Dot Hill Systems — Rodman & Renshaw Annual Global Investment Conference (September 2014)
49 slides from Dot Hill Systems's conference presentation, Sep 9, 2014

Slide 1: Driving Growth
a” om ? = . = => = % es ry : a o - a -_ on 2 . Co ie 22, Za. (Ké rr, “a Piso = **. a99 hd 2 = bY ¥ Wa a we \\ “DRIVING GROWTH" mM ASDA HILL Rodman & Renshaw Annual Global Investment Conference
Slide 2: Safe Harbor
Safe Harbor Hite’ tate It It d in this regarding matters that are not historical facts are “forward-looking statements” within the meaning of the Private Securities Litigation Reform Act. Because such statements are subject to risks and uncertainties, actual results may differ materially from those
Slide 3: Dot Hill at a Glance
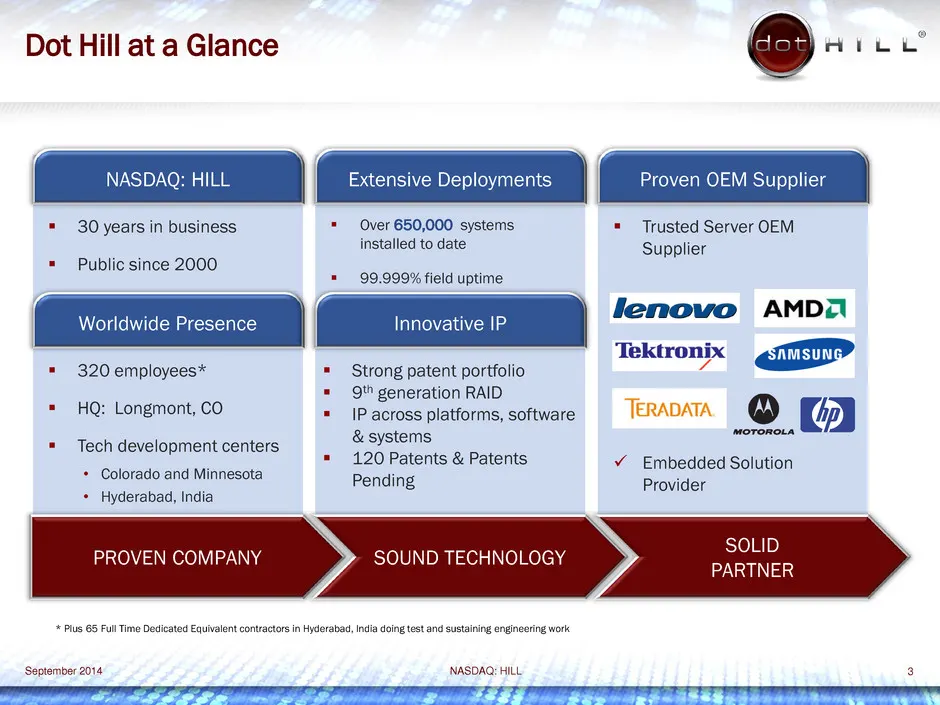
7 y 5 Dot Hill at a Glance 8 Hie Pwo = 30 years in business * Over 650,000 systems = Trusted Server OEM installed to date Supplier = Public since 2000 = — 99.999% field uptime | Worldwide Presence Innovative IP fenovo AMD Tektronix = 320 employees* Strong patent portfolio UA pennsunad = Qt" generati
Slide 4: Dot Hill Investment Highlights
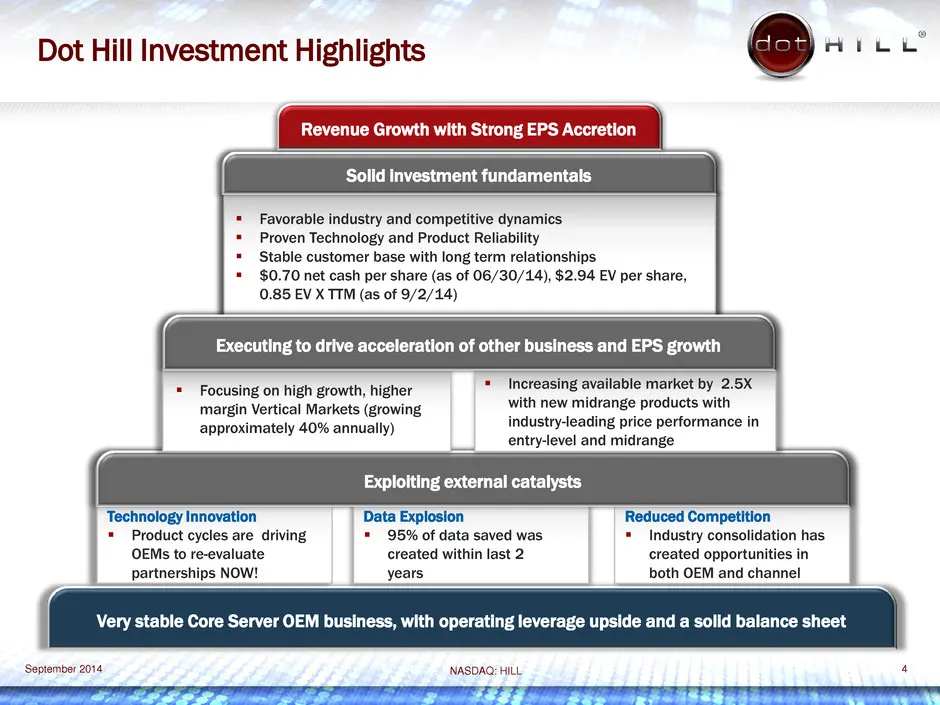
Dot Hill Investment Highlights Hiei’ Revenue Growth with Strong EPS Accretion Solid Investment fundamentals Proven Technology and Product Reliability Stable customer base with long term relationshi $0.70 net cash per share (as of 06/30/14), $2.94 EV per share, 0.85 EV X TTM (as of 9/2/14) Executing
Slide 5: Data Growth Facts
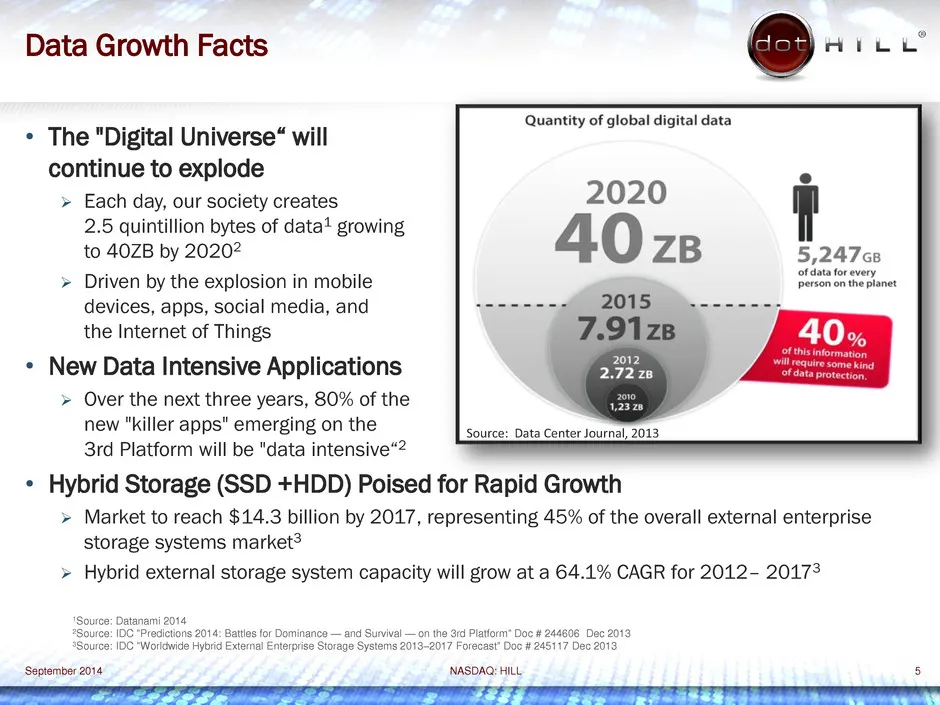
Data Growth Facts * The "Digital Universe“ will continue to explode > Each day, our society creates 2.5 quintillion bytes of data? growing to 40ZB by 20202 > Driven by the explosion in mobile devices, apps, social media, and the Internet of Things * New Data Intensive Applications > Over the next th
Slide 6: Selected Financial Information
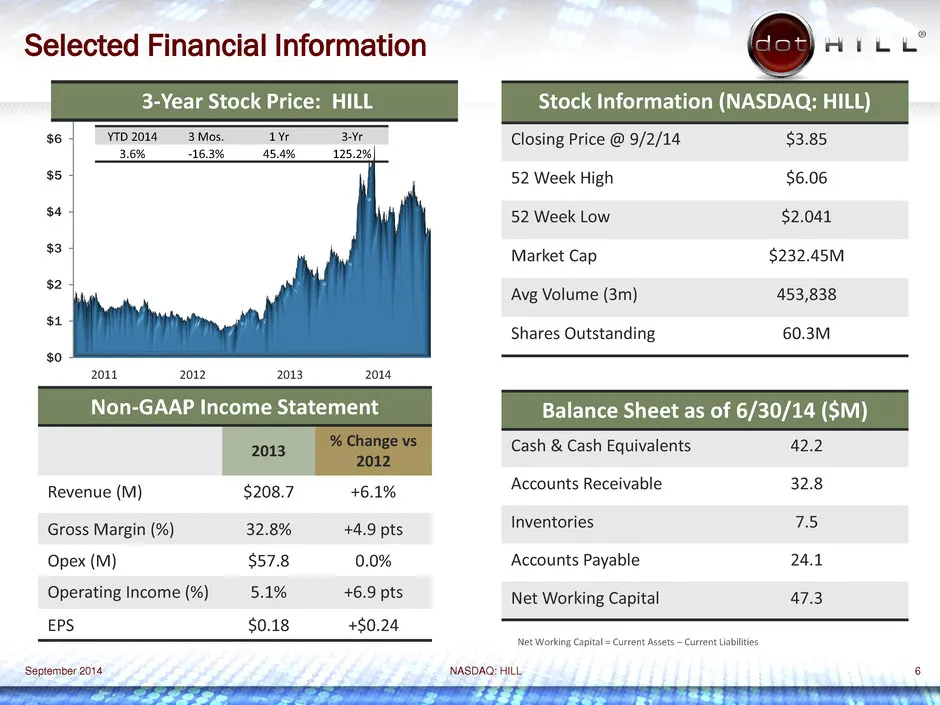
Selected Financial Information 8 Hite’ 3-Year Stock Pric: Stock Information (NASDAQ; HILL) a Closing Price @ 9/2/14 $3.85 52 Week High $6.06 52 Week Low $2.041 Market Cap $232.45M Avg Volume (3m) 453,838 Shares Outstanding 60.3M Non-GAAP Income Statement Cash & Cash Equivalents 42.2 Revenue (M) $208
Slide 7: Key Financial Metrics (2011 - 2013)
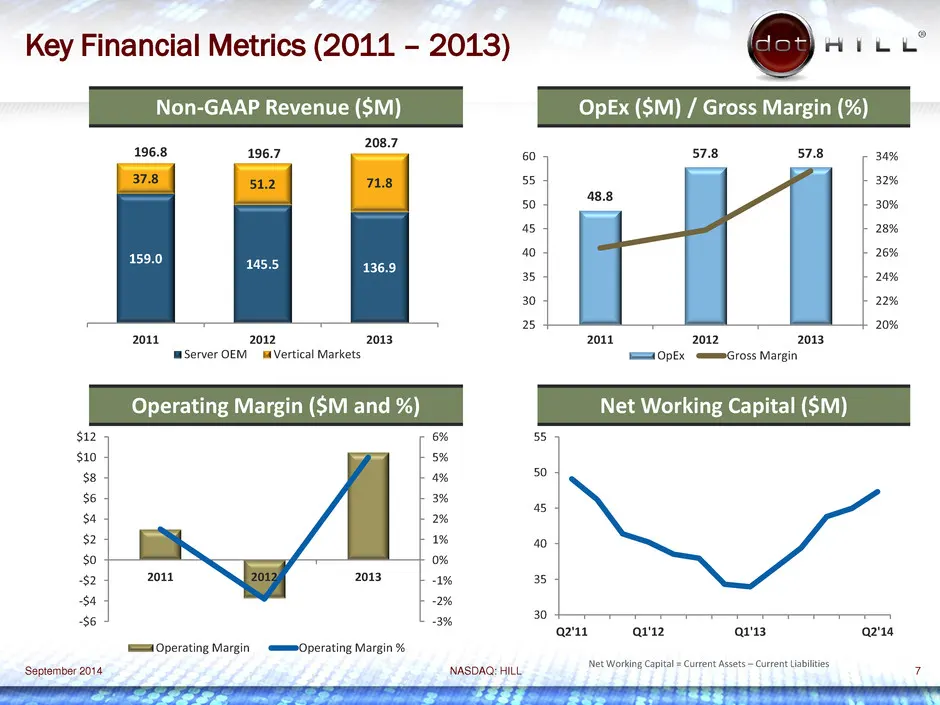
Key Financial Metrics (2011 - 2013) Hie Non-GAAP Revenue ($M) OpEx ($M) / Gross Margin (%) 208.7 196.8 196.7 60 57.8 57.8 34% 55 32% so 48.8 _ 45 28% 40 26% 35 24% 30 2% 25 20% 2011 3 2011 2012 201: 2012 2013 mServer OEM Vertical Markets SSIOPEX emmmGross Margin Operating Margin ($M and %) Net Worki
Slide 8: Dot Hill Leader in the IP Landscape
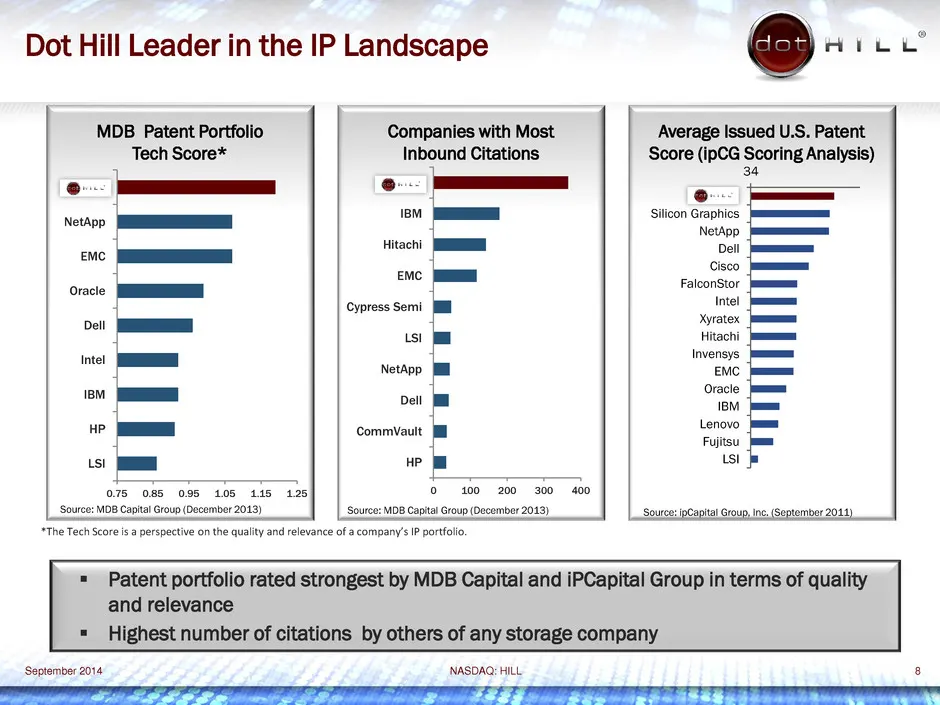
Dot Hill Leader in the IP Landscape 8 Hic’ MDB Patent Portfolio Companies with Most Average Issued U.S. Patent Tech Score* Ss (ipcG 34 — e eo. vet’? a sence Hitachi oC = —vc reco Faleonstor Cypress Semi Ill wit yratex Cl is! il Hitachi lnvensys hte NetApp Ill EM Oracle a pet fm = ee Commvautt [ill L
Slide 9: Industry Consolidation Expands Market Opportunity
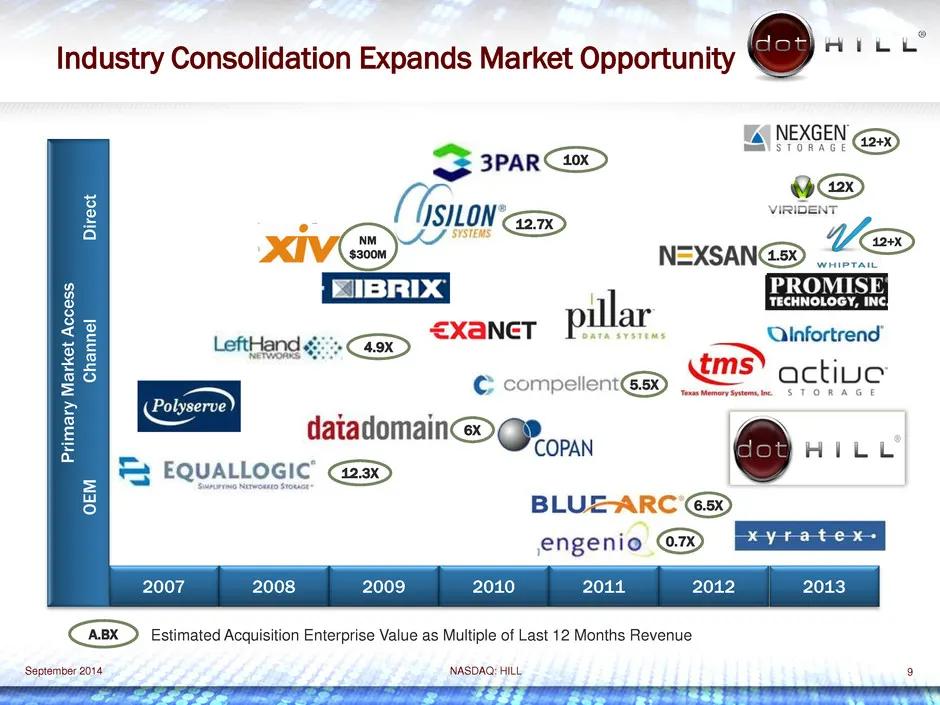
Industry Consolidation Expands Market Opportunity fod i LA NEXGEN Gog) S 3PARGD _ VIRIDENT ISON ca xiVe@)~ N=XSANG a ilar ca *xaNeT Porte Olnfortrend © compellent@X > en" active datadomain@> Gp... | oy TEE EQUALLOGIC GD Direct Primary Market Access Channel EM BLUEARC'GX engenio @ EZREmeal 2008 2009
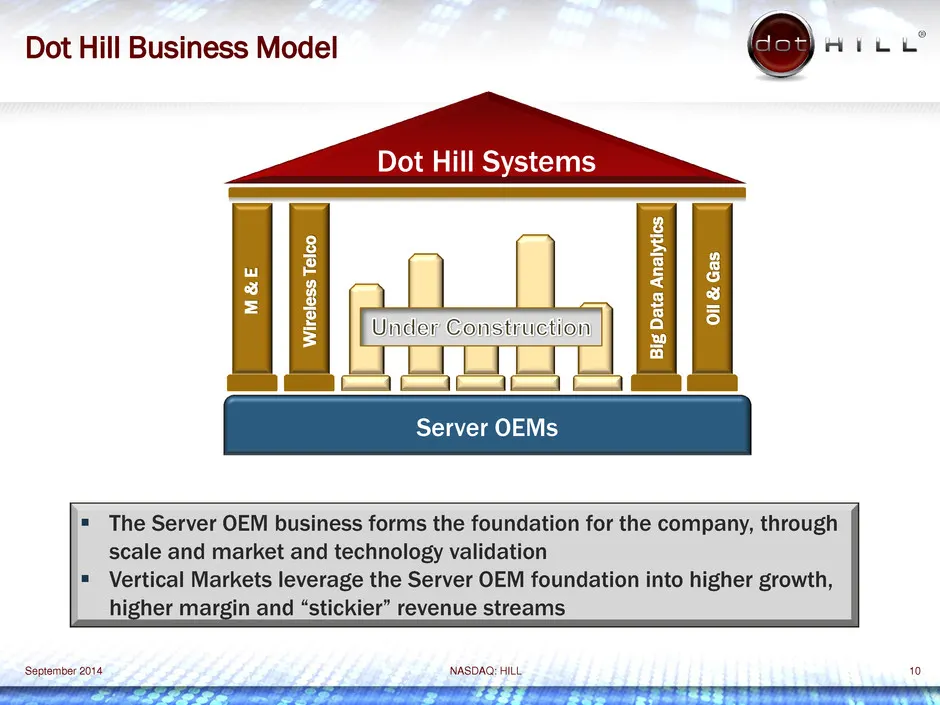
Slide 10: Dot Hill Business Model
Dot Hill Business Model S Hie Dot Hill Systems Oil & Gas Wireless Telco Big Data Analytics LI LJ = Server OEMs = The Server OEM business forms the foundation for the company, through scale and market and technology validation = Vertical Markets leverage the Server OEM foundation into higher growth,
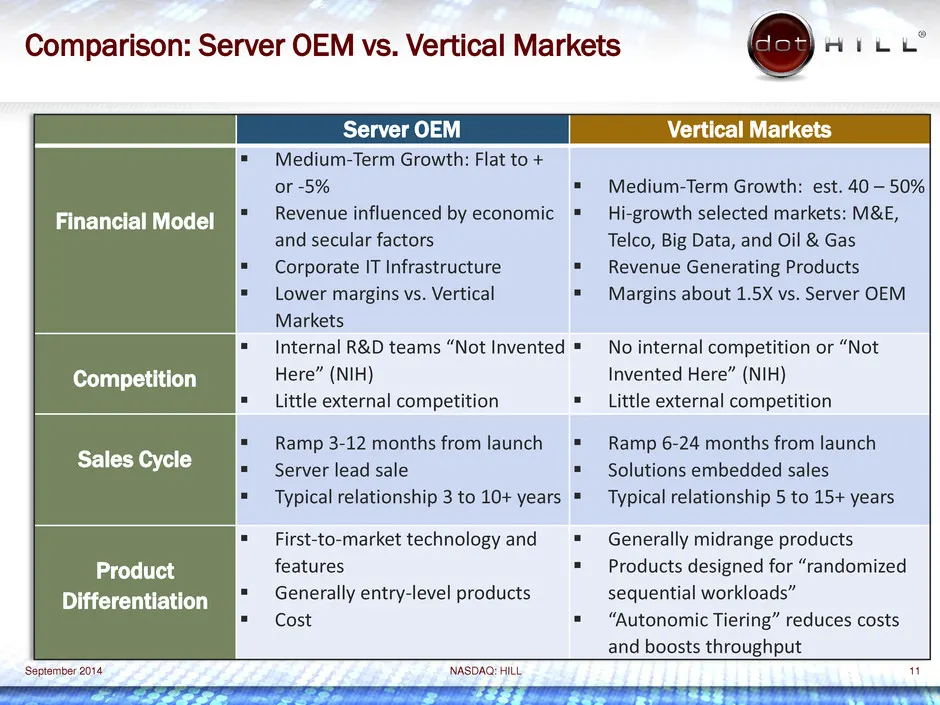
Slide 11: Comparison: Server OEM vs. Vertical Markets
Comparison: Server OEM vs. Vertical Markets Financial Model Competition Sales Cycle Product Differentiation ‘September 2014 Server OEM Medium-Term Growth: Flat to + or -5% Revenue influenced by economic and secular factors Corporate IT Infrastructure Lower margins vs. Vertical Markets Internal R&D t
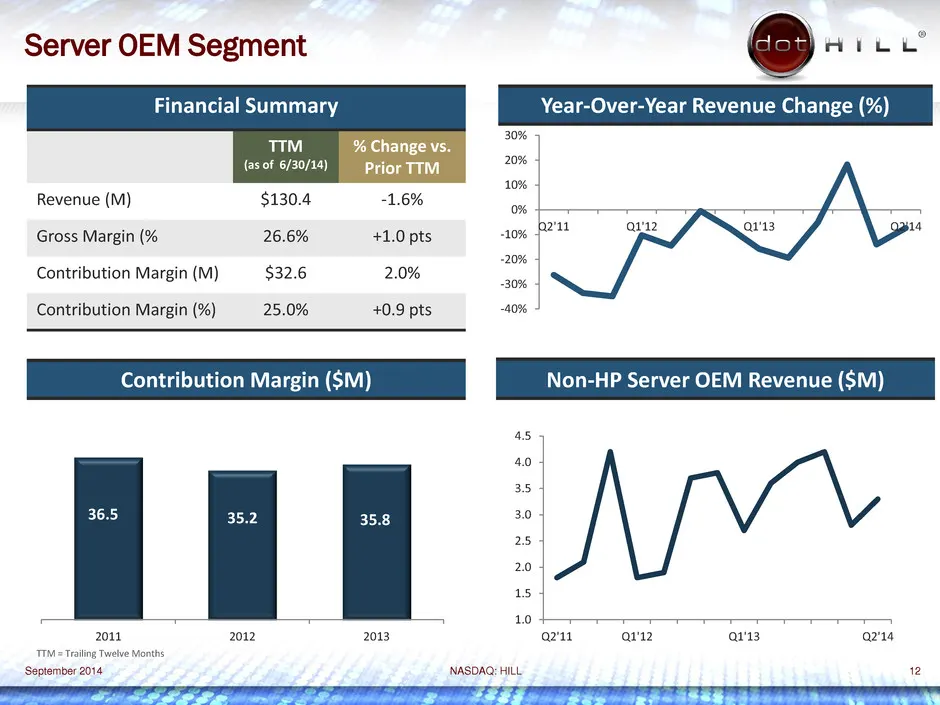
Slide 12: Server OEM Segment
Server OEM Segment Hic Financial Summary Year-Over-Year Revenue Change (%) % Change vs. T™ (as of 6/30/14) | Prior TIM 10% Revenue (M) $130.4 -1.6% i” Gross Margin (% 26.6% +1.0 pts 10% Pet ~ Ca \p« 20% Contribution Margin (M) $32.6 2.0% we Contribution Margin (%) 25.0% +0.9 pts 40% Contribution Mar
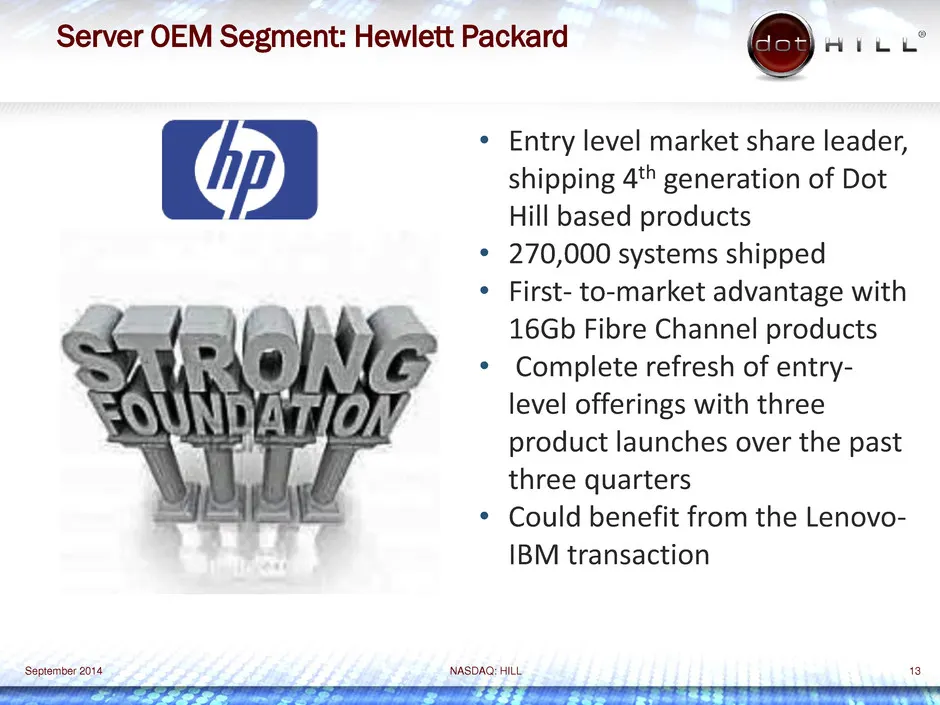
Slide 13: Server OEM Segment: Hewlett Packard
Server OEM Segment: Hewlett Packard 8 Hite (i; Entry level market share leader, ip shipping 4" generation of Dot Hill based products 270,000 systems shipped First- to-market advantage with 16Gb Fibre Channel products Complete refresh of entry- level offerings with three product launches over the pas
Slide 14: 2014 Strategic Initiatives
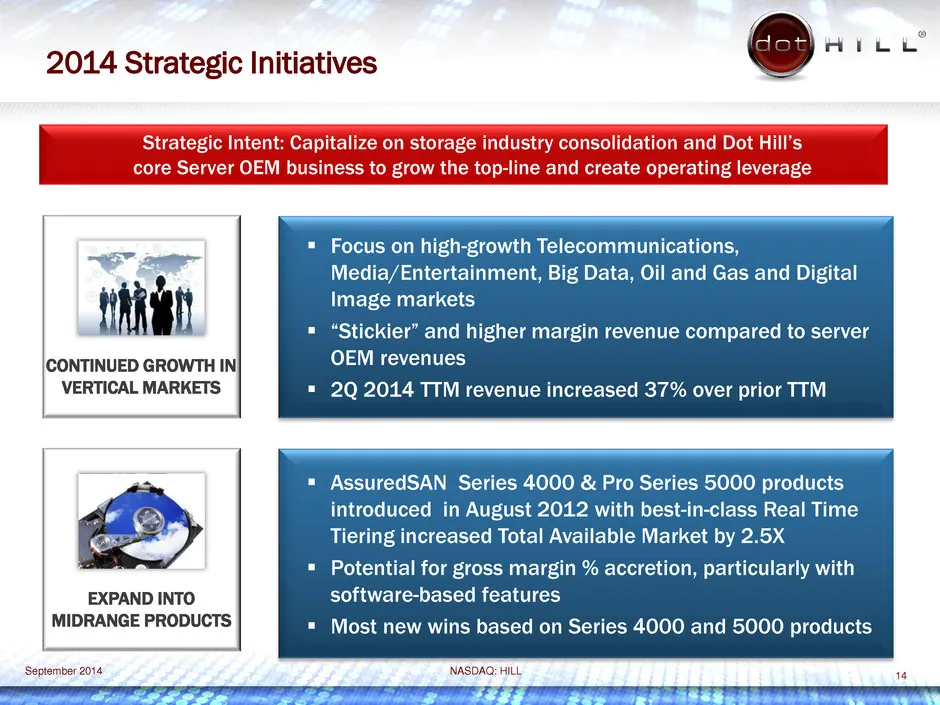
2014 Strategic Initiatives S =" Focus on high-growth Telecommunications, ae Media/Entertainment, Big Data, Oil and Gas and Digital rehiien Image markets “Stickier” and higher margin revenue compared to server CONTINUED GROWTH IN} OEM revenues VERTICAL MARKETS 2Q 2014 TTM revenue increased 37% over p
Slide 15: Broad Product Family
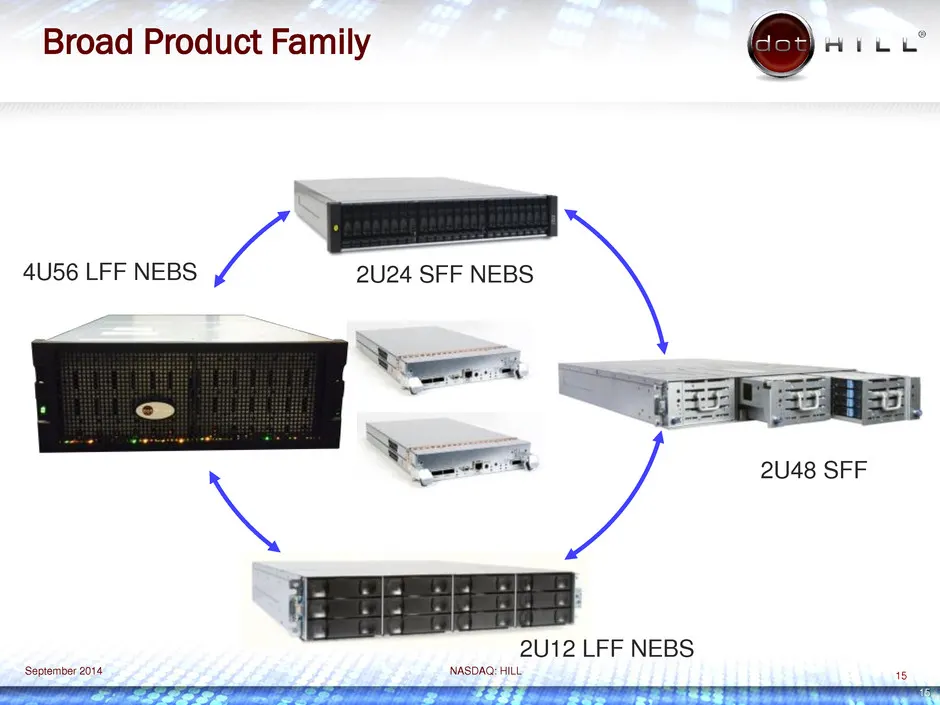
Broad Product Family 8 Hic ®S 4U56 LFF NEBS Va 2U24 SFF NEBS co) Ser = a 2U48 SFF 2U12 LFF NEBS ‘September 2014 NASDAQ: HILL ia PS ee ee eee ts
Slide 16: With a Range of Differentiated Features
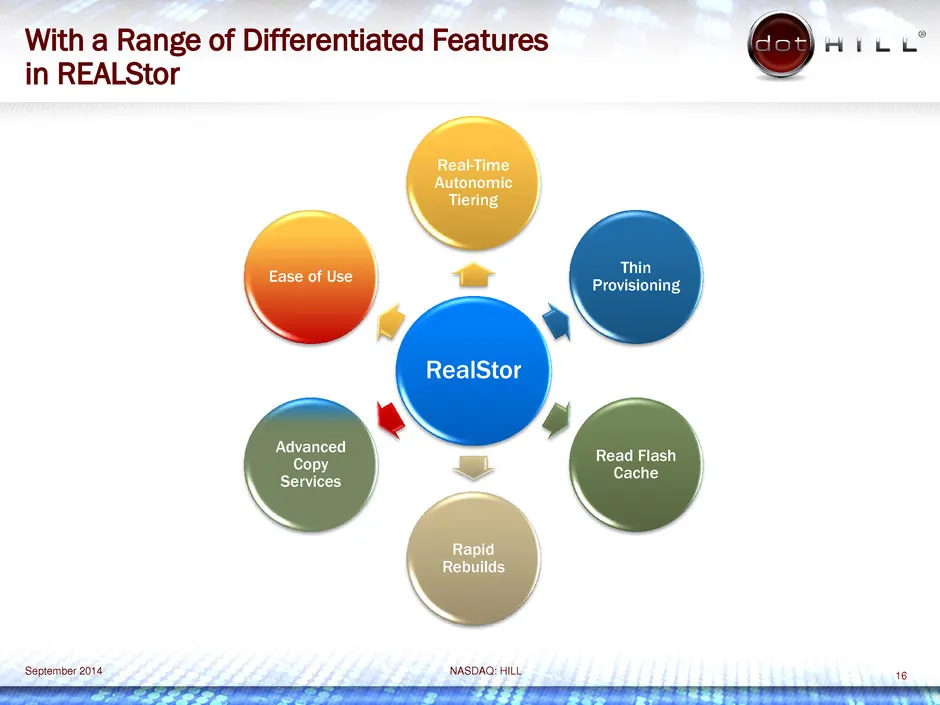
With a Range of Differentiated Features fod HILL in REALStor Real-Time Autonomic \ os Thin en RealStor ] Read Flash we Cache = X Advanced Ce opy \ Rapid wa } ‘September 2014 NASDAQ: HILL ia
Slide 17: Vertical Markets Focus to Drive Growth
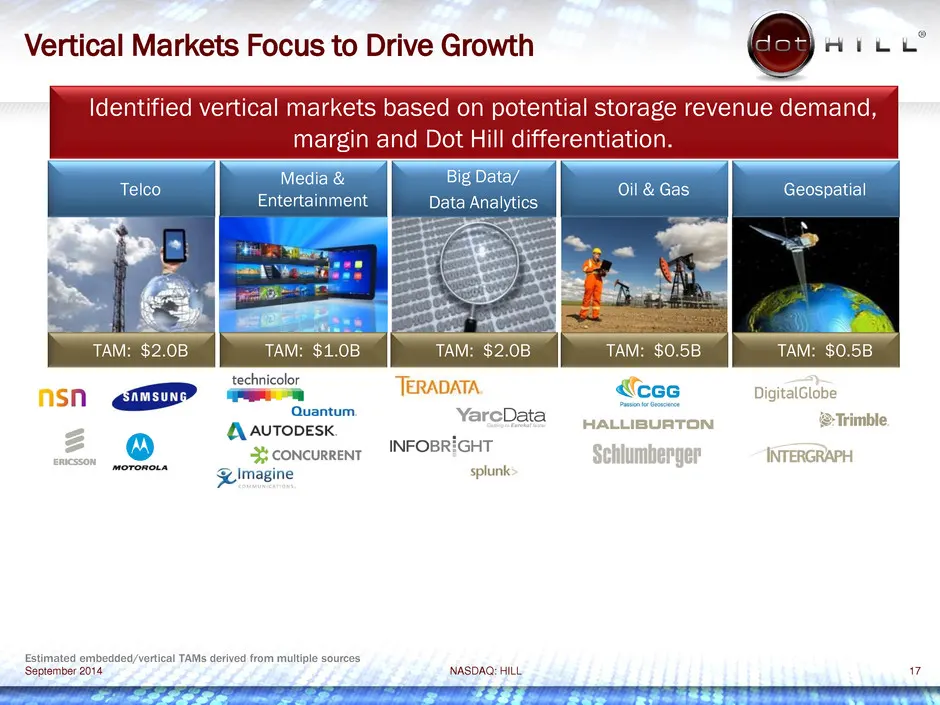
Vertical Markets Focus to Drive Growth 8 Hic’ d vertical markets based on potential storage margin and Dot Hill differentiation <3 TAM: $2.0B TAM: $1.08 | TAM: $2.0B TAM: $0.5B TAM: $0.5B inicolor nn gop en TERADATA Ke DigitaiGobe (autooesx. YarcData — HaLuiBuRTON 2 Trimble. Skconcurrent 'NFOBRIGHT
Slide 18: Vertical Markets Focus to Drive Growth
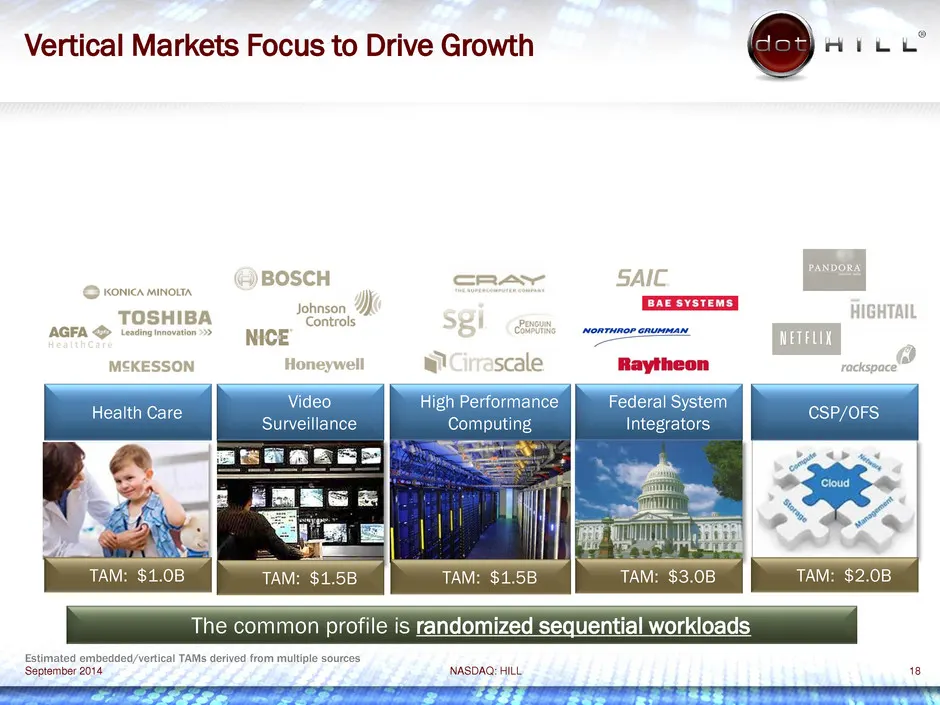
Vertical Markets Focus to Drive Growth i BOSCH cRar © nomen sanoun Is TOSHIB Meoniols Sei AGFA & Leading >>> NICE MSKESSON Honeywell wi Surveillance Jo LE) SAIC The common profile is randomized sequential workloads Estimated embedded/vertical TAMs derived from multiple sources ‘September 2014 NASDAQ
Slide 19: Vertical Markets Focus to Drive Growth
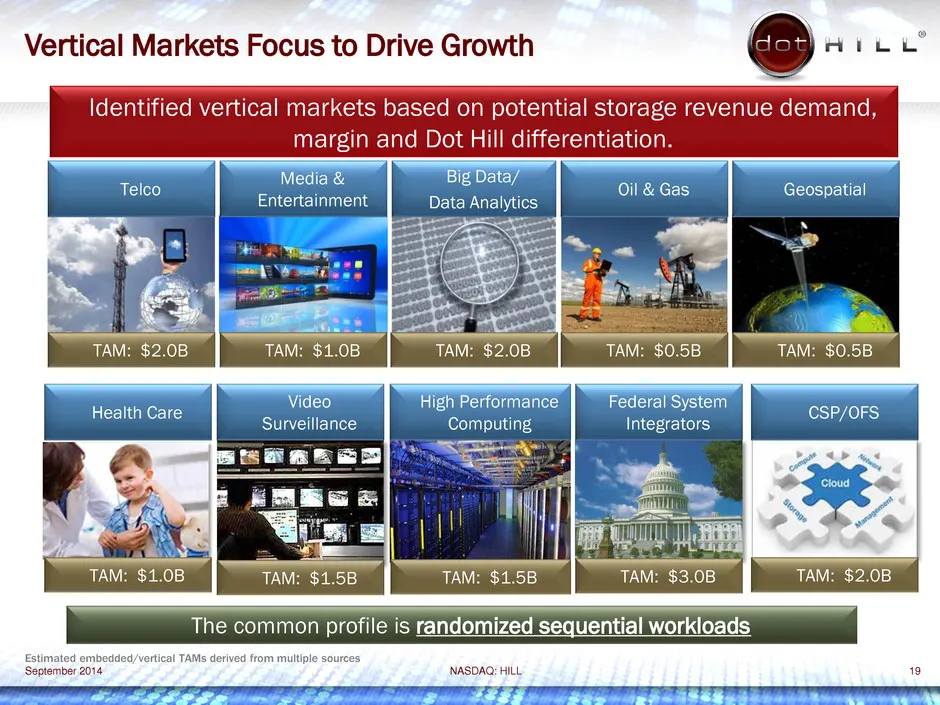
Vertical Markets Focus to Drive Growth 8 Hic Identified vertical markets based on potential storage in and Dot Hill differen Ses TAM: $2.0B The common profile is randomized seq ial workloads ated embedded/vertical TAMSs derived ip ‘September 2014 NASDAQ: HILL 19
Slide 20: Vertical Markets Segment
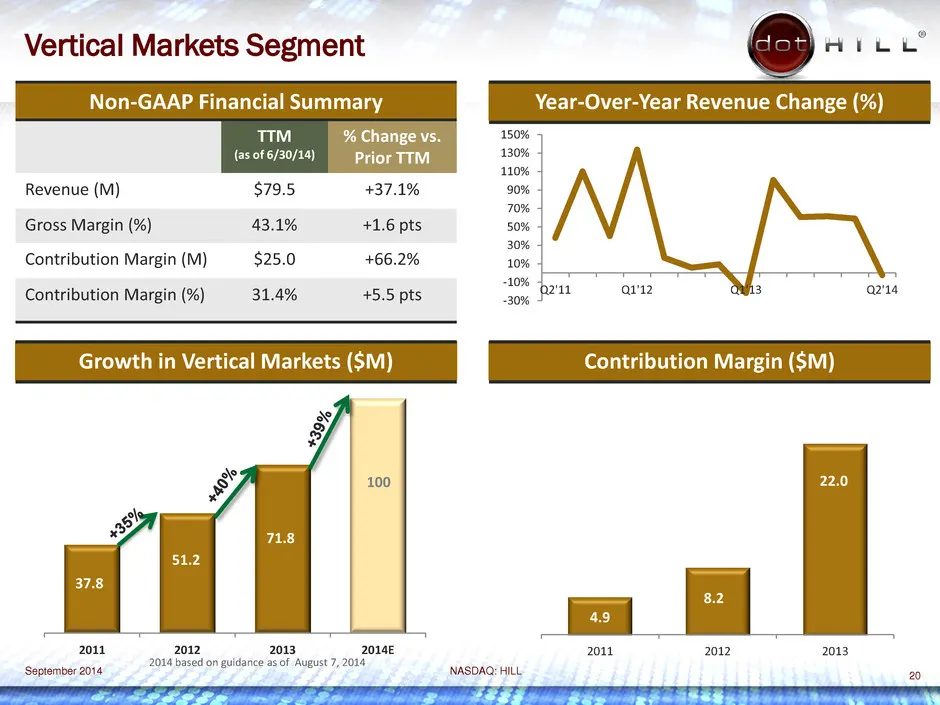
Vertical Markets Segment Lan Hie Non-GAAP Financial Summary Year-Over-Year Revenue Change (%) T™ % Change vs. 150% (as0f6/30/14) | rior TIM 130% 110% Revenue (M) $79.5 437.1% 90% 70% Gross Margin (%) 43.1% +2.6 pts 50% 30% Contribution Margin(M) $25.0 66.2% 10% 0% ; : Contribution Margin (%) 31.4% 4
Slide 21: Vertical Market Profile: Telco
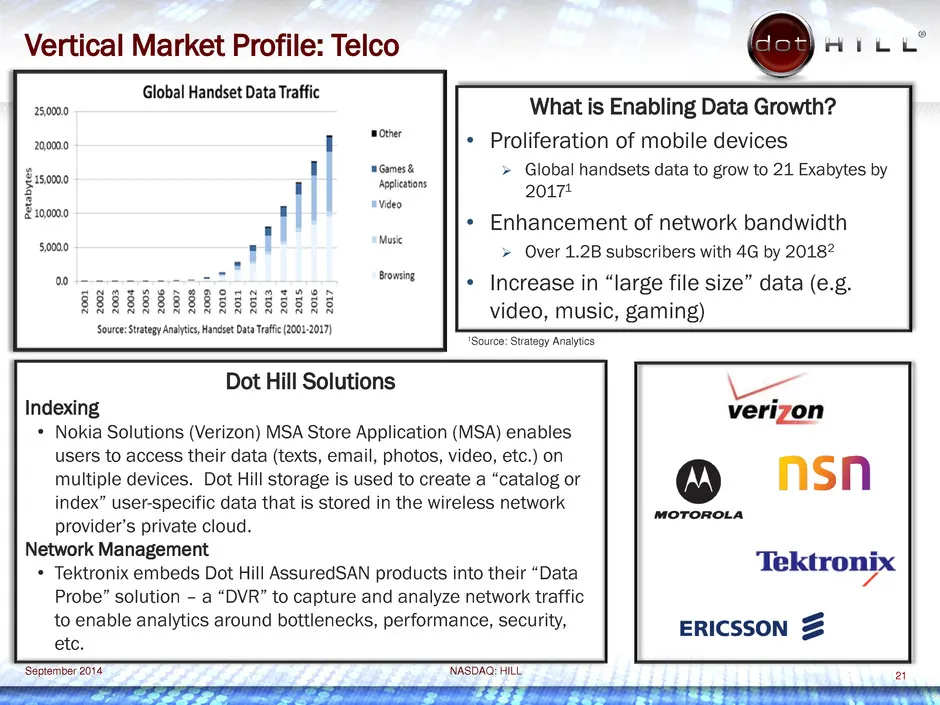
Vertical Market Profile: Telco Global Handset Data Traffic 20000 noe: ooo 7 seams $ssemo egleatons F igo000 | | esd sanoo : I Muse soning 101 201 101 RERR & Source: Strategy Anais, Handset Data Trafic (2001-2017) 7 . APee What is Enabling Data Growth? * Proliferation of mobile devices » Global hands
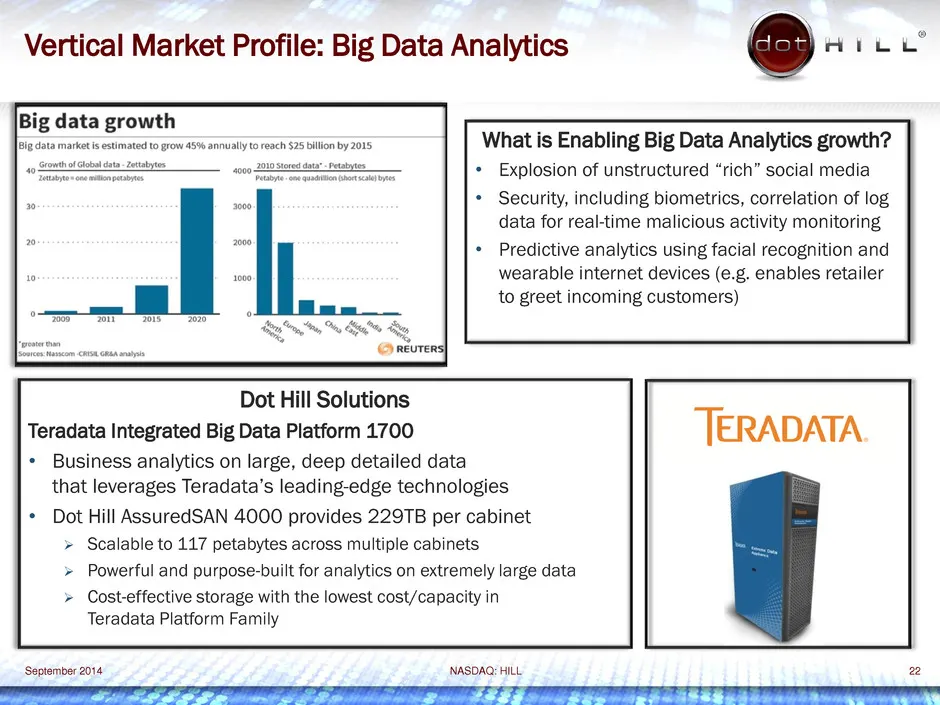
Slide 22: Vertical Market Profile: Big Data Analytics
Vertical Market Profile: Big Data Analytics Big data growth " Syn, Me Sets ey © revrers| @-.-- What is Enabling Big Data Analytics growth? Explosion of unstructured “rich” social media Security, including biometrics, correlation of log data for real-time malicious activity monitoring Predictive anal
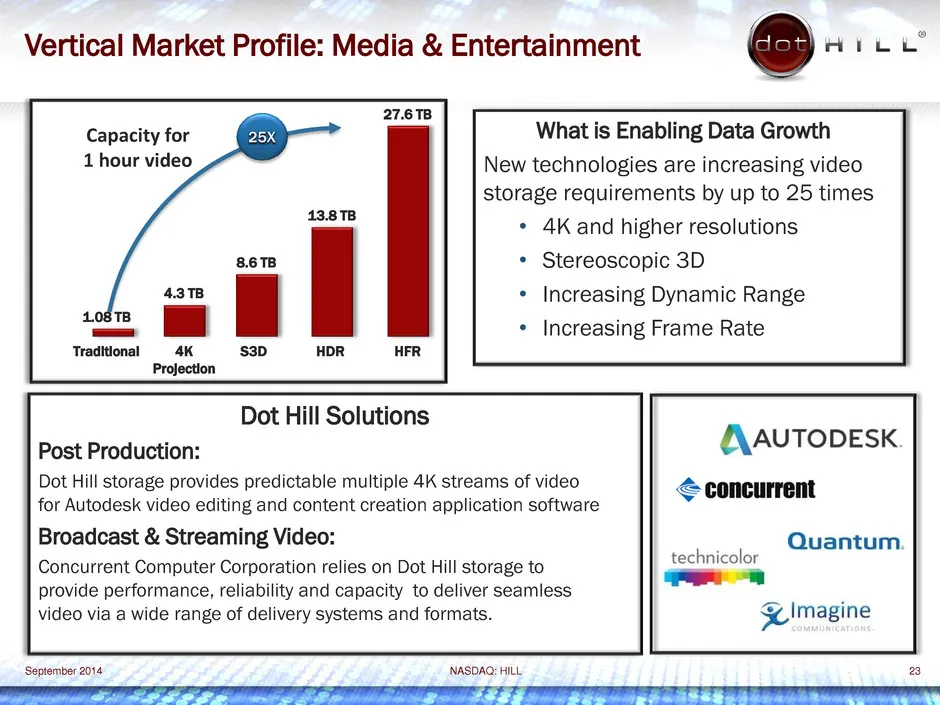
Slide 23: Vertical Market Profile: Media & Entertainment
Vertical Market Profile: Media & Entertainment 8 Hic’ What is Enabling Data Growth New technologies are increasing video storage requirements by up to 25 times * 4k and higher resolutions 8.67B * Stereoscopic 3D * Increasing Dynamic Range LOSTB . = * Increasing Frame Rate Traditional 4K $3D HDR HFR

Slide 24: Financials and Business Model
* — « : ey o* -» . o n lt “oa, Stoner Dy, ory = Lis ig ser P+) 116 = (Ké rr, 4 Va . “DRIVING GROWTH" mM ASDA HILL Financials and Business Model
Slide 25: About Non-GAAP Financial Measures and Segment Reporting
About Non-GAAP Financial Measures and Segment Reporting Non-GAAP Financial Measures The Company's non-GAAP financial measures exclude the impact of stock-based compensation expense, legal settlements and associated expenses, intangible asset amortization, restructuring and severance charges, charges
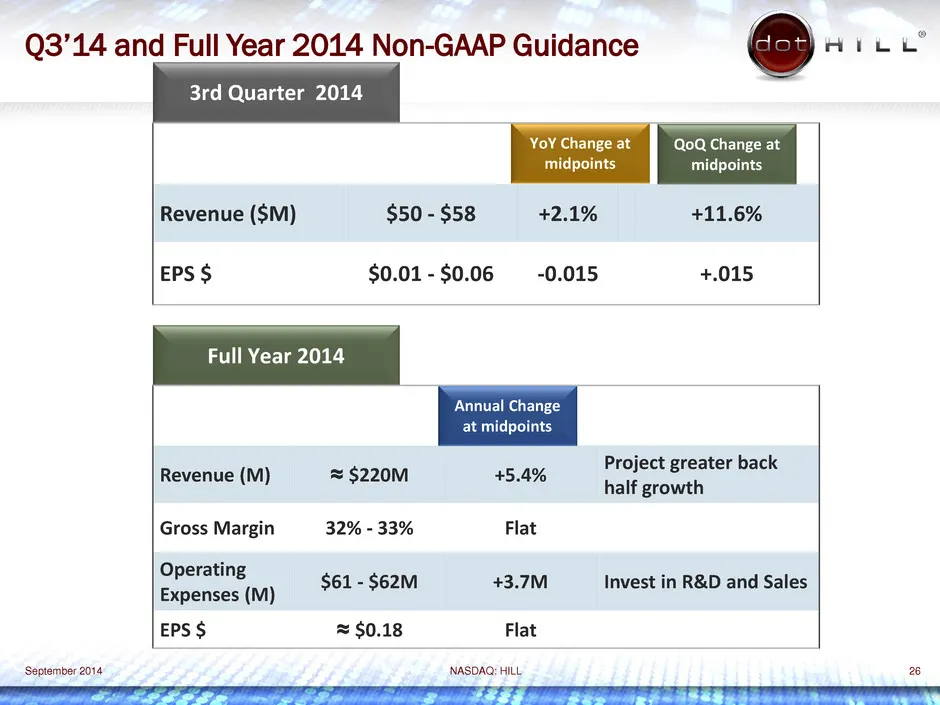
Slide 26: Q3'14 and Full Year 2014 Non-GAAP Guidance
Q3’14 and Full Year 2014 Non-GAAP Guidance 8 Ht YoY Change at ff QoQ Change at midpoints midpoints Revenue ($M) $50 - $58 +2.1% +11.6% EPS $ $0.01-$0.06 -0.015 +.015 Full Year 2014 Revenue (M) = $220M 45.4% ee Sere back Gross Margin 32% - 33% Flat Operating A Expenses (M) $61 - $62M +3.7M Invest in
Slide 27: Medium Term Business Goals
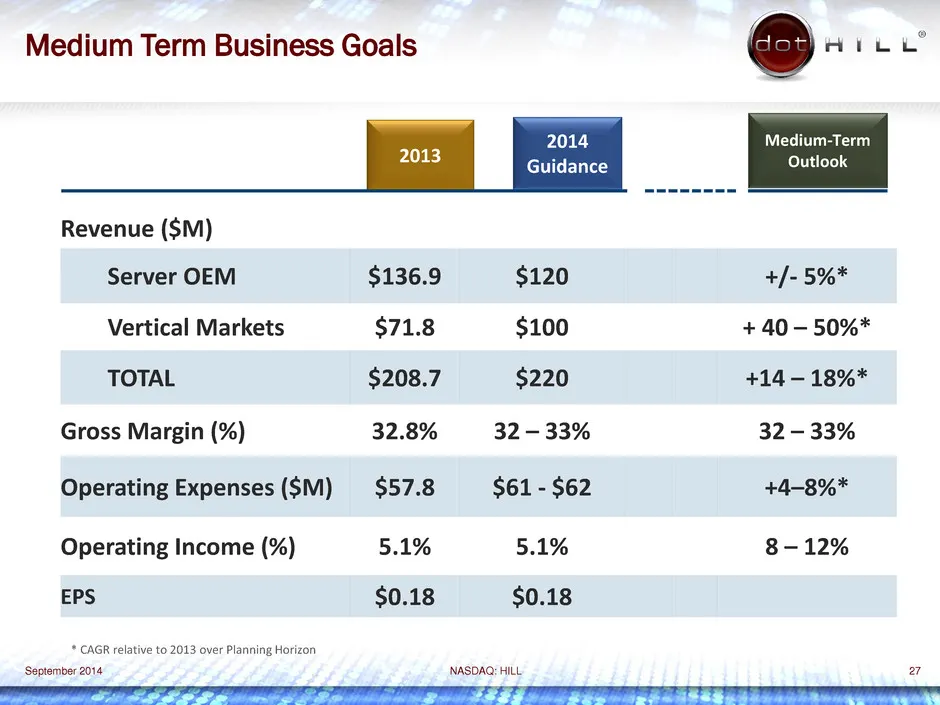
Medium Term Business Goals Revenue ($M) Server OEM $136.9 Vertical Markets $71.8 TOTAL $208.7 Gross Margin (%) 32.8% Operating Expenses ($M) $57.8 Operating Income (%) 5.1% EPS $0.18 * CAGR relative to 2013 over Planning Horizon ‘September 2014 $120 $100 $220 32-33% $61 - $62 5.1% $0.18 NASDAQ: HILL
Slide 28: Investment Highlights
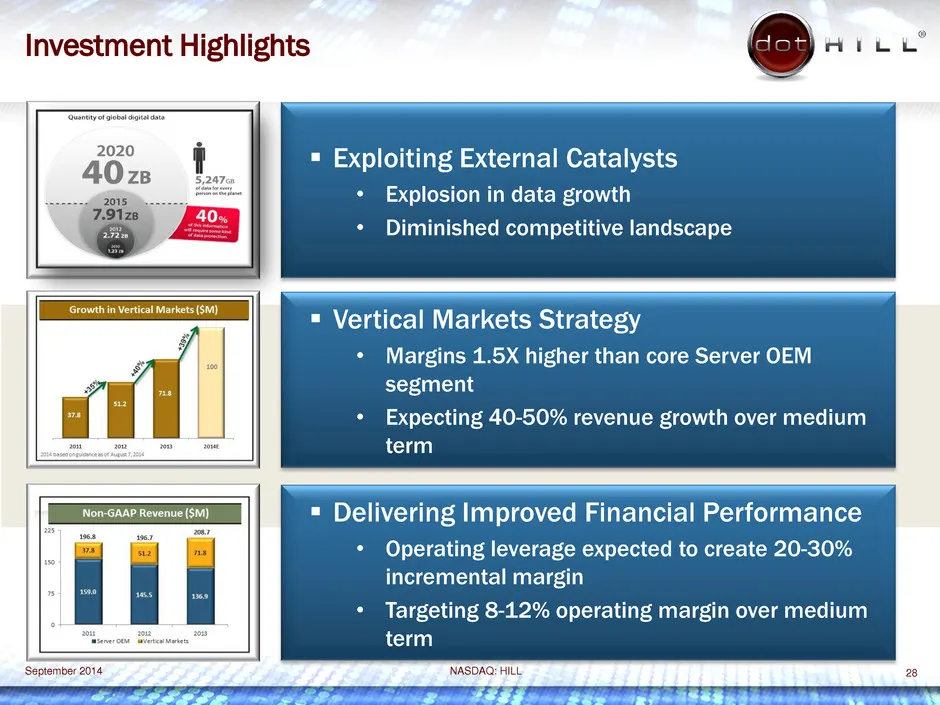
Investment Highlights = Exploiting External Catalysts * Explosion in data growth Pe oinienca = Vertical Markets Strategy Margins 1.5X higher than core Server OEM segment Expecting 40-50% revenue growth over medium term ae ie = Delivering Improved Financial Performance Operating leverage expected to
Slide 29: 2014 Outlook
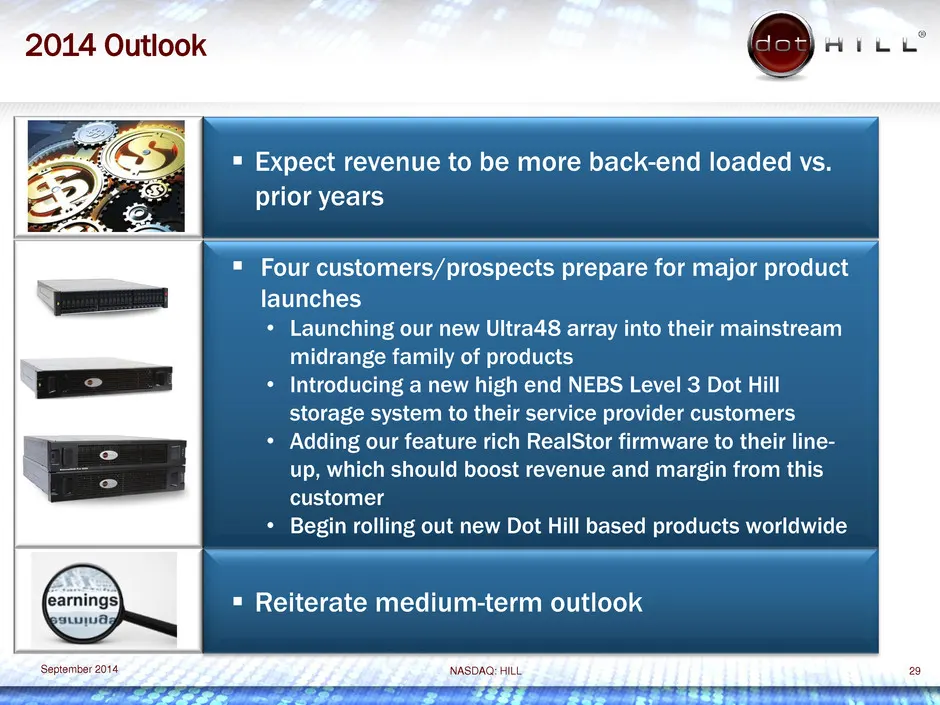
2014 Outlook = Expect revenue to be more back-end loaded vs. prior years = Four customers/prospects prepare for major product launches ¢ Launching our new Ultra48 array into their mainstream midrange family of products * Introducing a new high end NEBS Level 3 Dot Hill storage system to their servic

Slide 30: Appendix: Reconciliation of GAAP to Non-GAAP Financial Measures
a” om ? = . = => = % es ry : a o - a -_ on 2 . Co ie 22, Za. (Ké rr, “a Piso = **. a99 hd 2 = bY ¥ Wa a we \\ “DRIVING GROWTH" mM ASDA HILL Appendix |; Reconciliation of GAAP to Non-GAAP Financial Measures
Slide 31: About Non-GAAP Financial Measures and Segment Reporting
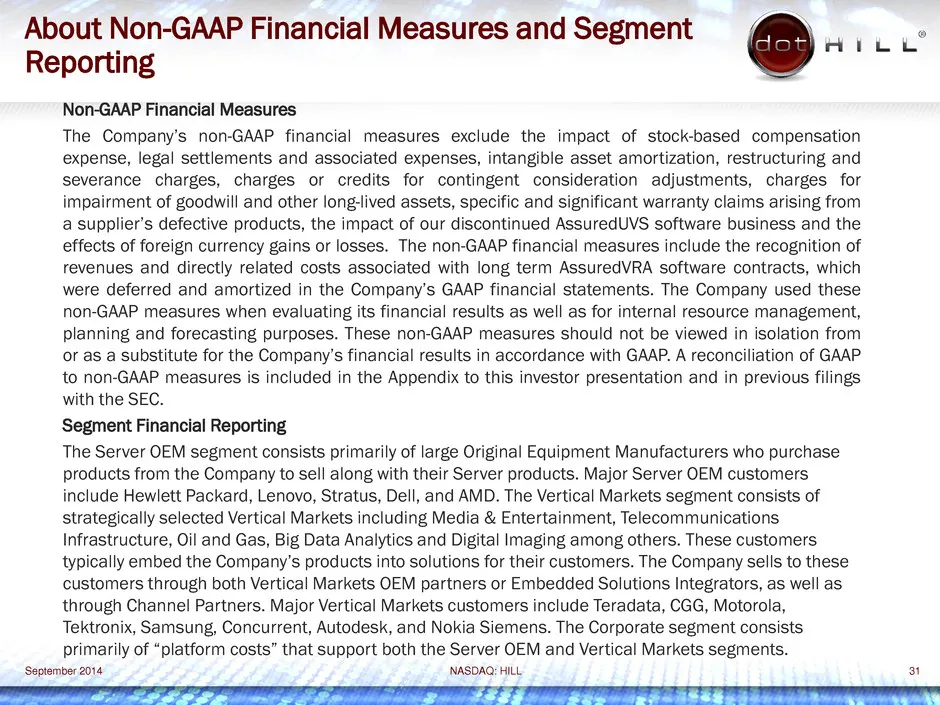
About Non-GAAP Financial Measures and Segment Reporting Non-GAAP Financial Measures The Company's non-GAAP financial measures exclude the impact of stock-based compensation expense, legal settlements and associated expenses, intangible asset amortization, restructuring and severance charges, charges
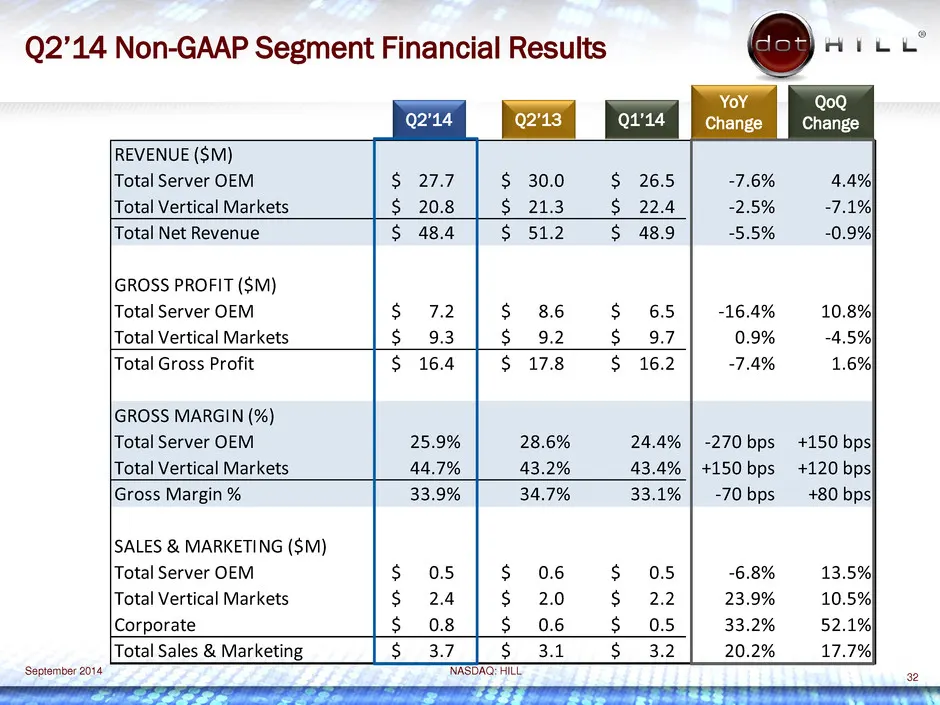
Slide 32: Q2'14 Non-GAAP Segment Financial Results
Q2’14 Non-GAAP Segment Financial Results 8 Hiei’ YoY Qot REVENUE (SM) Total Server OEM Sm 27a7 $ 30.0 $ 26.5 -7.6% 4.4%) Total Vertical Markets $20.8 $21.3 $22.4 -7.1% Total Net Revenue $ 48.4 $ 51.2 $ 48.9 -0.9%| GROSS PROFIT ($M) Total Server OEM S$ 7.2 S$ 86 $ 65 -16.4% 10.8% Total Vertical Marke
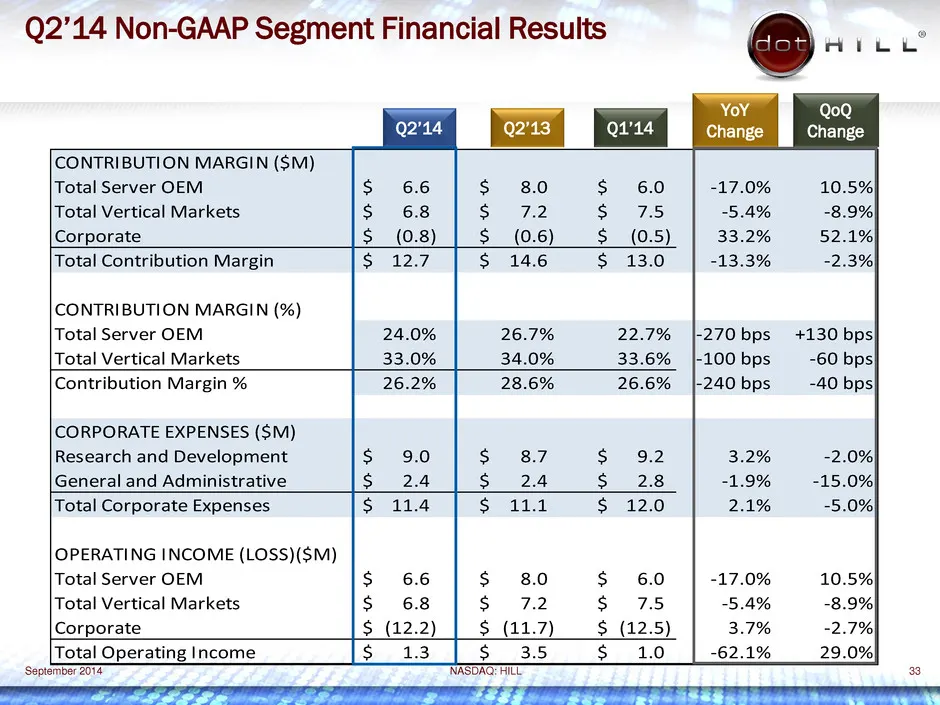
Slide 33: Q2'14 Non-GAAP Segment Financial Results
Q2’14 Non-GAAP Segment Financial Results 8 mice YoY QoQ Q2’14 hange Change CONTRIBUTION MARGIN (SM) Total Server OEM $ 66 $ 8.0 $ 6.0 -17.0% 10.5%| Total Vertical Markets $ 68 S 72 S 73) 5.4% -8.9%| Corporate $ (0.8) $ (0.6) $ (0.5) 33.2% 52.1%| Total Contribution Margin ol2e7, $ 14.6 $ 13.0 -13.3%
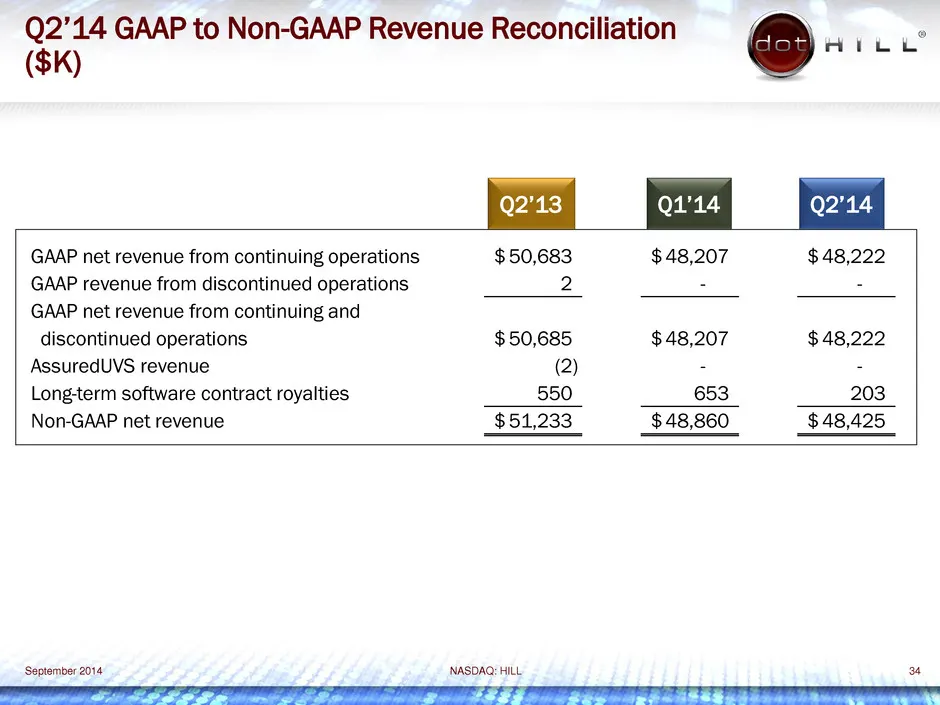
Slide 34: Q2'14 GAAP to Non-GAAP Revenue Reconciliation
Q2’14 GAAP to Non-GAAP Revenue Reconciliation Bi ° ($K) we GAAP net revenue from continuing operations $50,683 $48,207 $48,222 GAAP revenue from discontinued operations 2 - - GAAP net revenue from continuing and discontinued operations $50,685 $48,207 $48,222 AssuredUVS revenue (2) - - Long-term sof
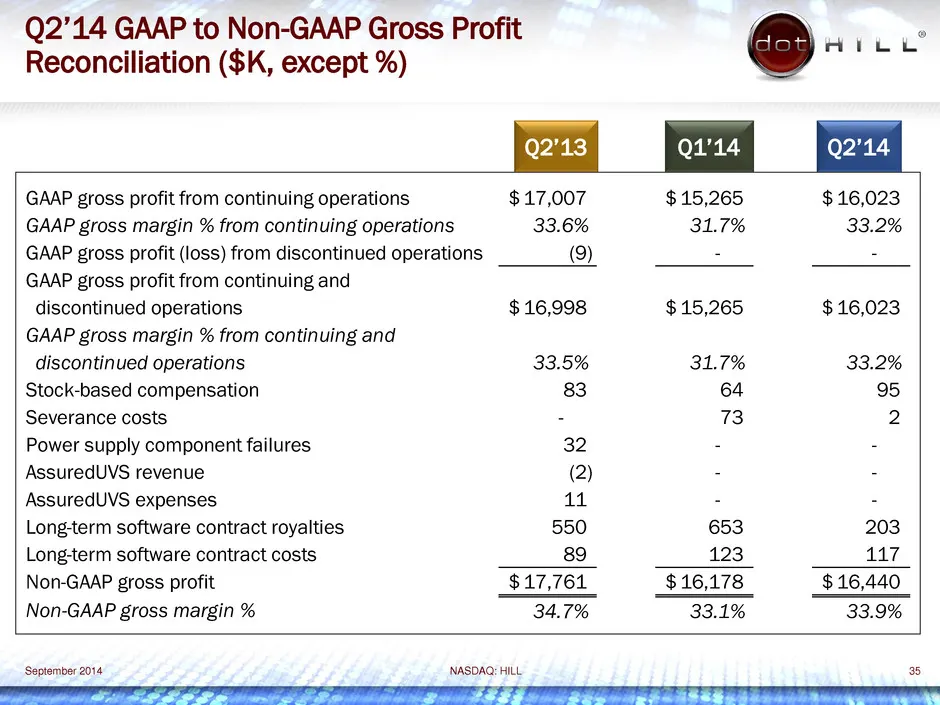
Slide 35: Q2'14 GAAP to Non-GAAP Gross Profit Reconciliation
Q2’14 GAAP to Non-GAAP Gross Profit 8 Th Reconciliation ($K, except %) Q2’13 Q1'14 Q2’'14 GAAP gross profit from continuing operations $17,007 $15,265 $16,023 GAAP gross margin % from continuing operations 33.6% 31.7% 33.2% GAAP gross profit (loss) from discontinued operations (9) - - GAAP gross pro
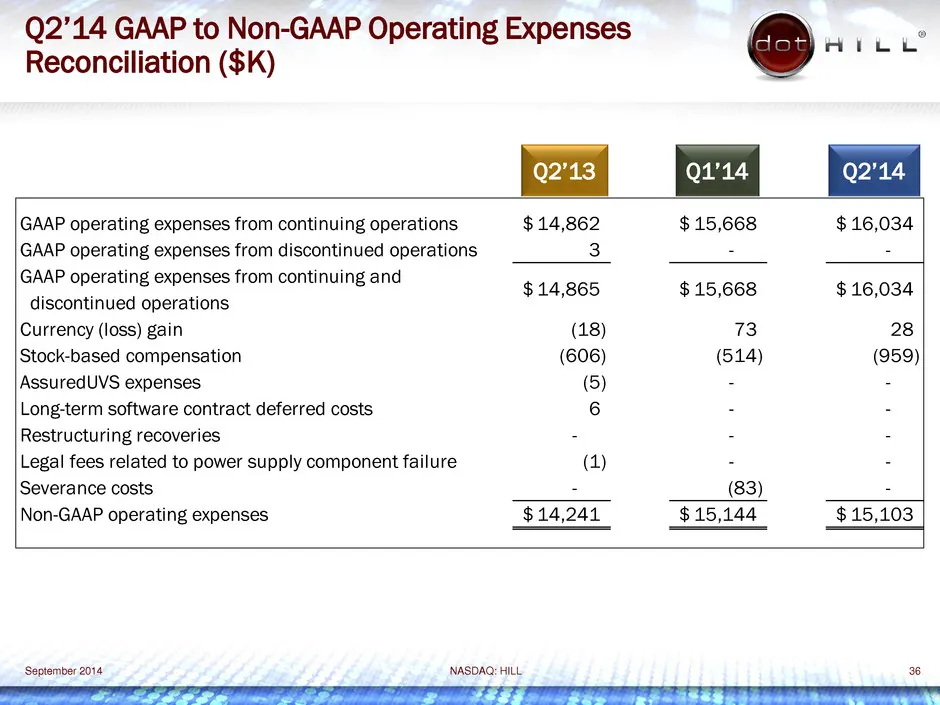
Slide 36: Q2'14 GAAP to Non-GAAP Operating Expenses
Q2’14 GAAP to Non-GAAP Operating Expenses 8 tic Reconciliation ($K) GAAP operating expenses from continuing operations $14,862 $15,668 $16,034 GAAP operating expenses from discontinued operations 3 : « GAAP operating expenses from continuing and . - ‘ $14,865 $ 15,668 $ 16,034 discontinued operation
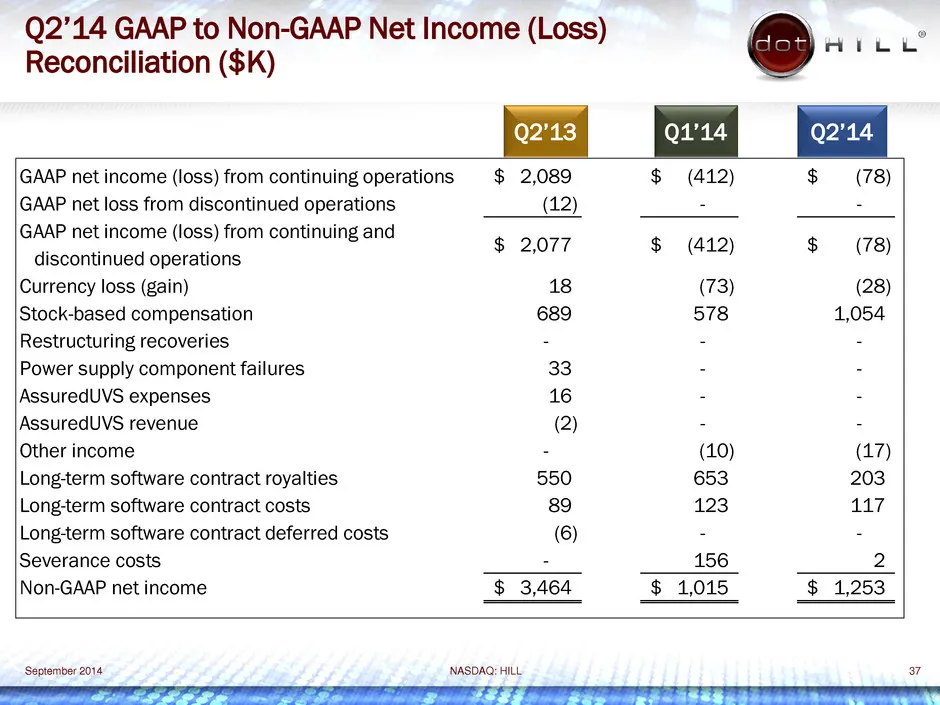
Slide 37: Q2'14 GAAP to Non-GAAP Net Income (Loss)
Q2’14 GAAP to Non-GAAP Net Income (Loss) Reconciliation ($K) Q2’13 GAAP net income (loss) from continuing operations $ 2,089 GAAP net loss from discontinued operations (12) GAAP net income (loss) from continuing and $ 2077 discontinued operations Currency loss (gain) 18 Stock-based compensation 689
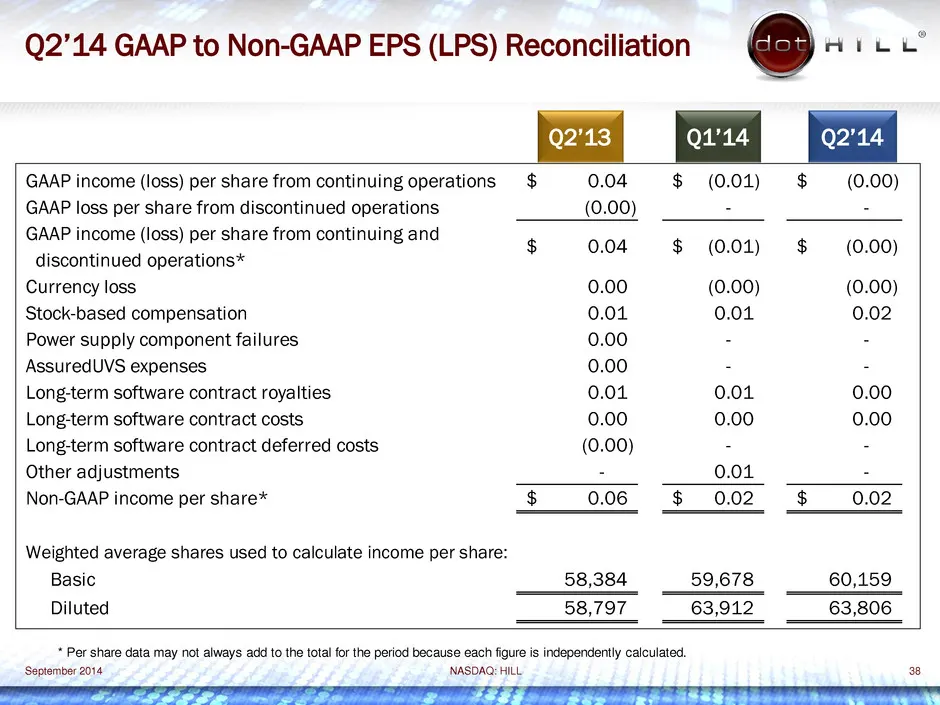
Slide 38: Q2'14 GAAP to Non-GAAP EPS (LPS) Reconciliation
Q2’14 GAAP to Non-GAAP EPS (LPS) Reconciliation 8 Hic’ GAAP income (loss) per share from continuing operations $ 0.04 $ (0.04) $ GAAP loss per share from discontinued operations (0.00) - GAAP income (loss) pe share from continuing and $ 0.04 $ (0.01) $ discontinued operations* Currency loss 0.00 (0.
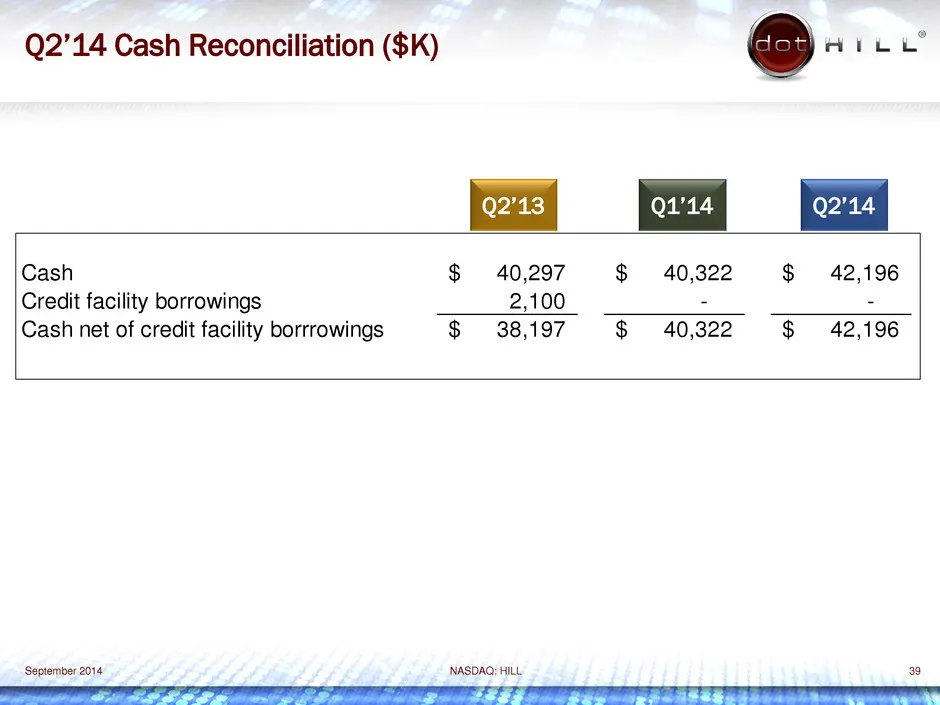
Slide 39: Q2'14 Cash Reconciliation ($K)
Q2’14 Cash Reconciliation ($K) 8 HILL’ Q2’13 Q2’'14 Cash $ 40,297 $ 40,322 $ 42,196 Credit facility borrowings 2,100 : : Cash net of credit facility borrrowings $ 38,197 $ 40,322 $ 42,196 ‘September 2014 NASDAQ: HILL rE eT TF fT Pee
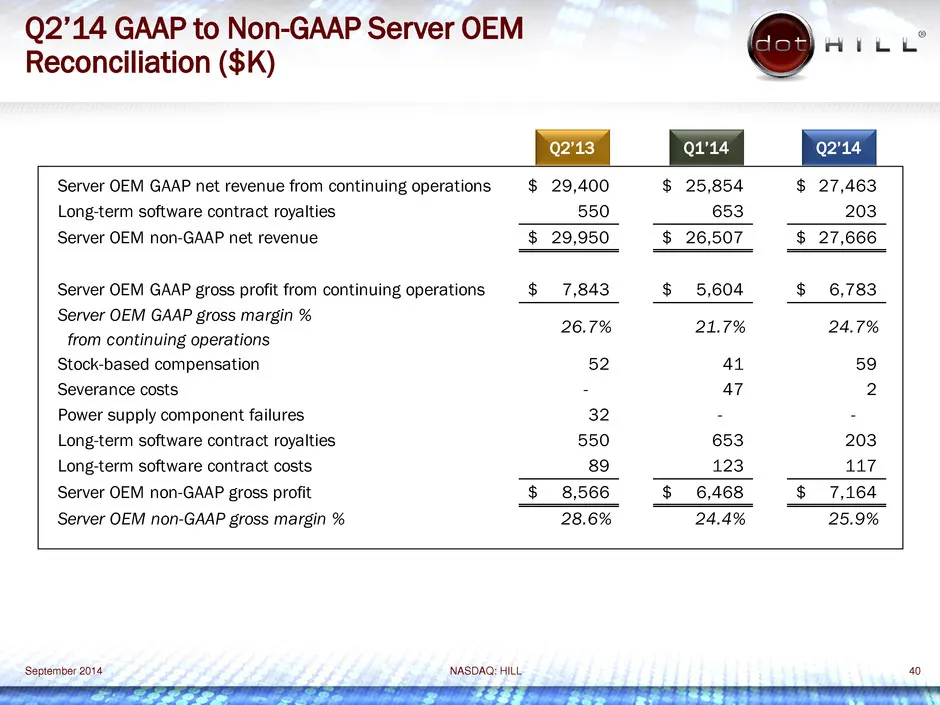
Slide 40: Q2'14 GAAP to Non-GAAP Server OEM Reconciliation
Q2’14 GAAP to Non-GAAP Server OEM 8 Th Reconciliation ($K) Q2'13 Qt'14 Q2'14 Server OEM GAAP net revenue from continuing operations $ 29,400 $ 25,854 $ 27,463 Long-term software contract royalties 550 653 203 Server OEM non-GAAP net revenue $ 29,950 $ 26,507 $ 27,666 Server OEM GAAP gross profit fro
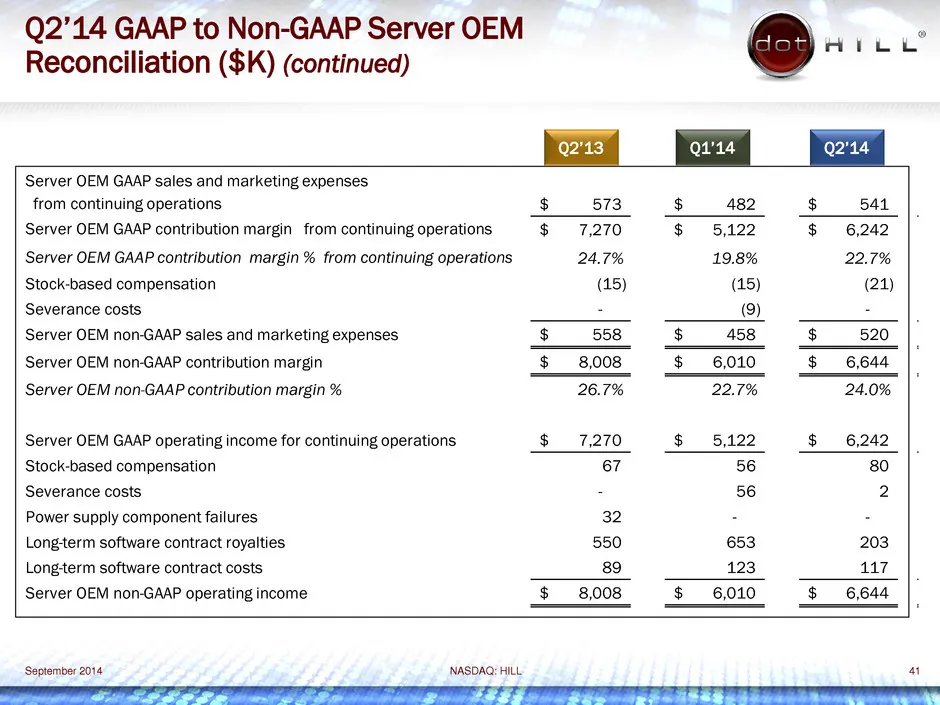
Slide 41: Q2'14 GAAP to Non-GAAP Server OEM Reconciliation (continued)
Q2’14 GAAP to Non-GAAP Server OEM ae Hit Reconciliation ($K) (continued) Q1'14 Q2'14 Server OEM GAAP sales and marketing expenses from continuing operations $ 573 $ 482 $ 541 Server OEM GAAP contribution margin from continuing operations $ 7,270 $ 5,122 $ 6,242 Server OEM GAAP contribution margin %
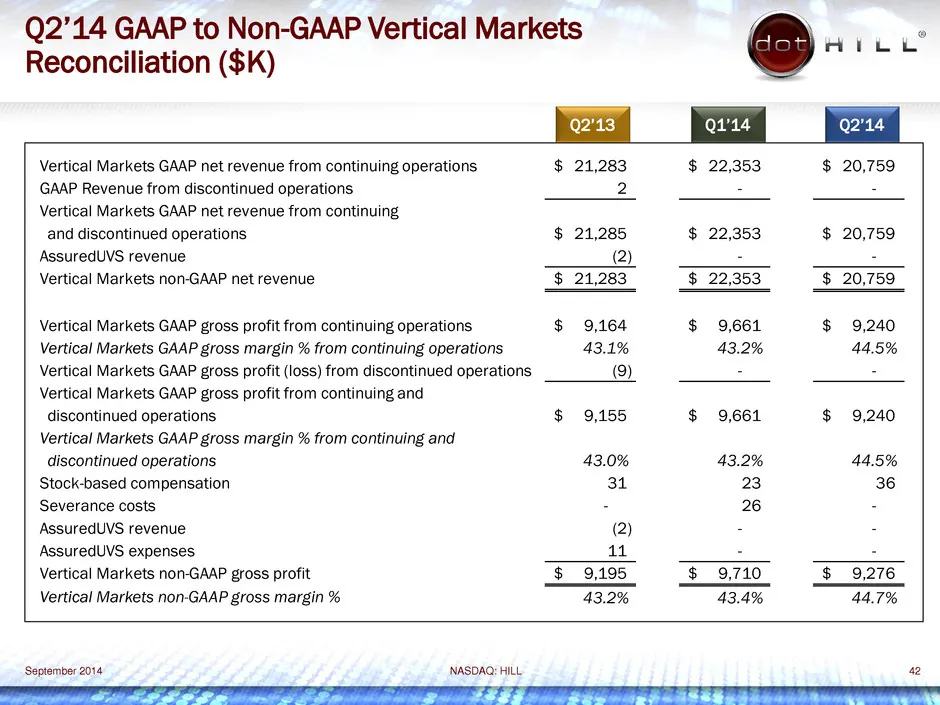
Slide 42: Q2'14 GAAP to Non-GAAP Vertical Markets Reconciliation
Q2’14 GAAP to Non-GAAP Vertical Markets ae Hit Reconciliation ($K) Q2'13 Q1'14 Q2'14 Vertical net revenue d ic $ 21,283 $ 22453 $ 20,759 GAAP Revenue from discontinued operations 2 a - Vertical net revenue i and discontinued operations $ 21,285 $ 22,353 $ 20,759 AssuredUVS revenue (2) ba Es Vertical
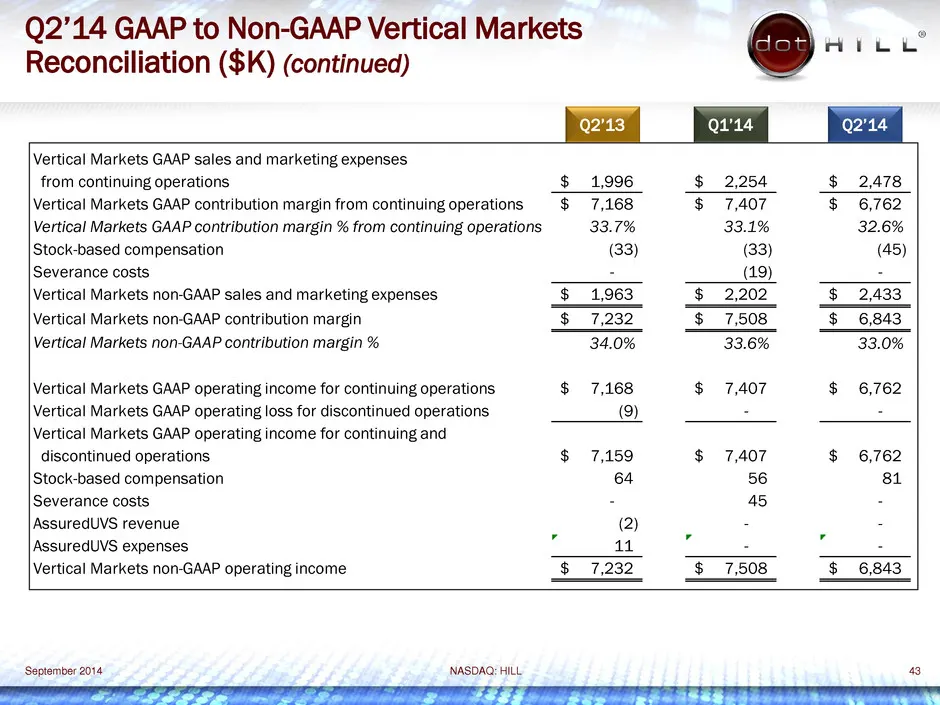
Slide 43: Q2'14 GAAP to Non-GAAP Vertical Markets Reconciliation (continued)
Q2’14 GAAP to Non-GAAP Vertical Markets Reconciliation ($K) (continued) Hic’ Q2 114 Vertical Markets GAAP sales and marketing expenses from continuing operations $1,996 $2,254 $2,478 Vertical Markets GAAP contribution margin trom continuing operations $7,168 $ 7,407 $ 6,762 Vertical gi 1g 33.7% 33.1
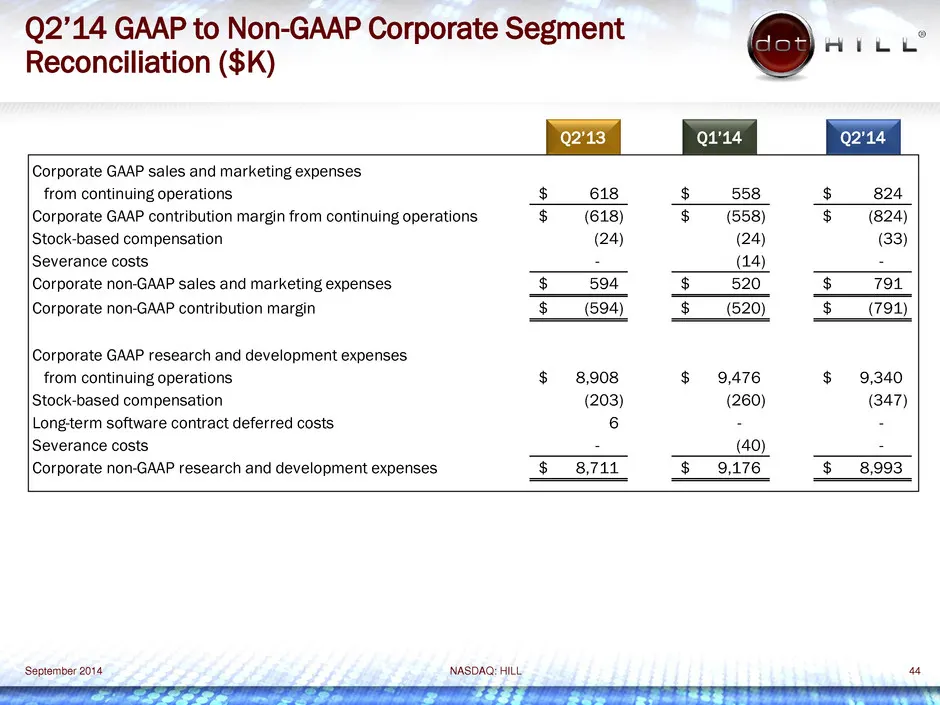
Slide 44: Q2'14 GAAP to Non-GAAP Corporate Segment Reconciliation
Q2’14 GAAP to Non-GAAP Corporate Segment Reconciliation ($K) and from continuing operations Stock-based compensation Severance costs Corporate non-GAAP sales and marketing expenses Corporate non-GAAP contribution margin Corporate GAAP research and development expenses from continuing operations Stoc
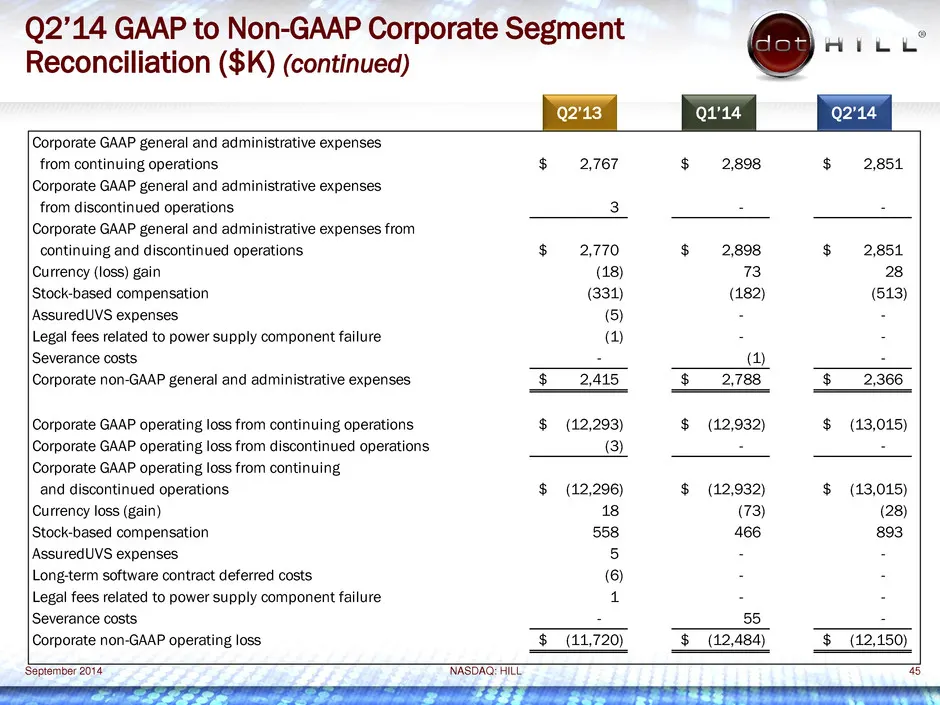
Slide 45: Q2'14 GAAP to Non-GAAP Corporate Segment Reconciliation (continued)
Q2’14 GAAP to Non-GAAP Corporate Segment Reconciliation ($K) (continued) pr ge from continuing operations & from discontinued operations & continuing and discontinued operations Currency (loss) gain tock-based compensation /AssuredUVS expenses Legal fees related to power supply component failure /Se
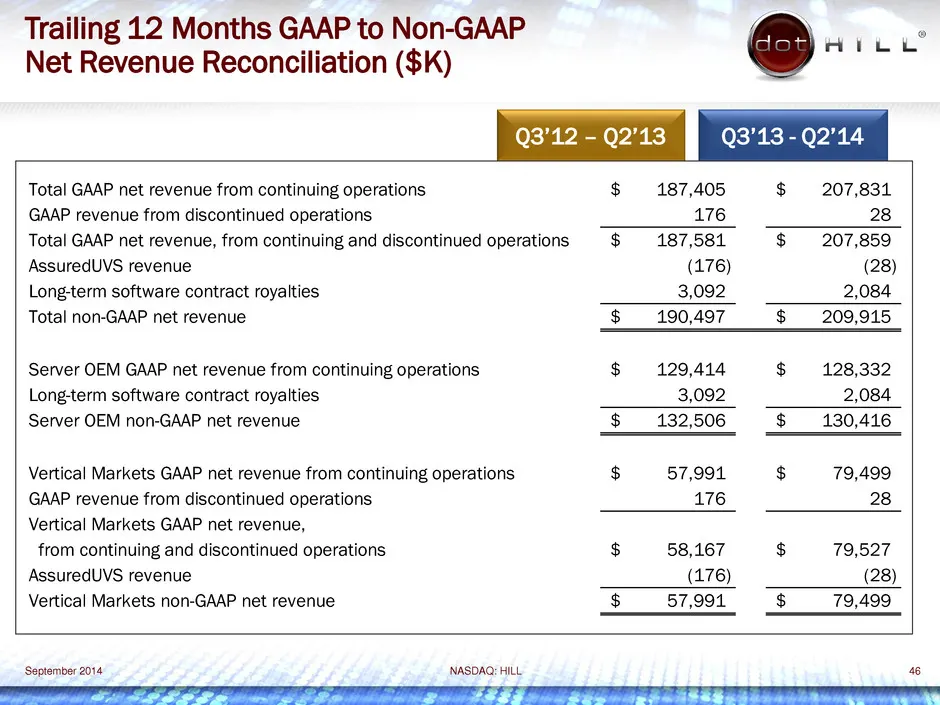
Slide 46: Trailing Months GAAP to Non-GAAP Net Revenue Reconciliation
Trailing 12 Months GAAP to Non-GAAP 8 tic Net Revenue Reconciliation ($K) Q3’12 - Q2’13 Q3’13 - Q2’14 Total GAAP net revenue from continuing operations $ 187,405 $ 207,831 GAAP revenue from discontinued operations Total GAAP net revenue, from continuing and discontinued operations $ $ 207,859 Assure
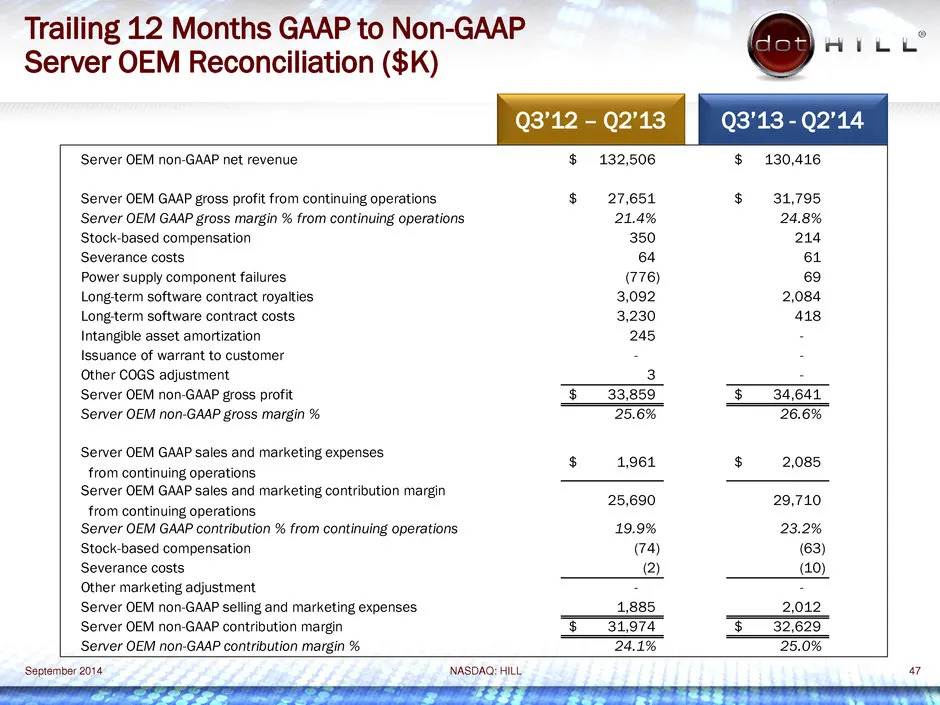
Slide 47: Trailing Months GAAP to Non-GAAP Server OEM Reconciliation
Trailing 12 Months GAAP to Non-GAAP Server OEM Reconciliation ($K) Server OEM non-GAAP net revenue Server OEM GAAP gross profit from continuing operations env gin % inuir ic Stock-based compensation Severance costs Power supply component failures Long;term software contract royalties Server OEM non-
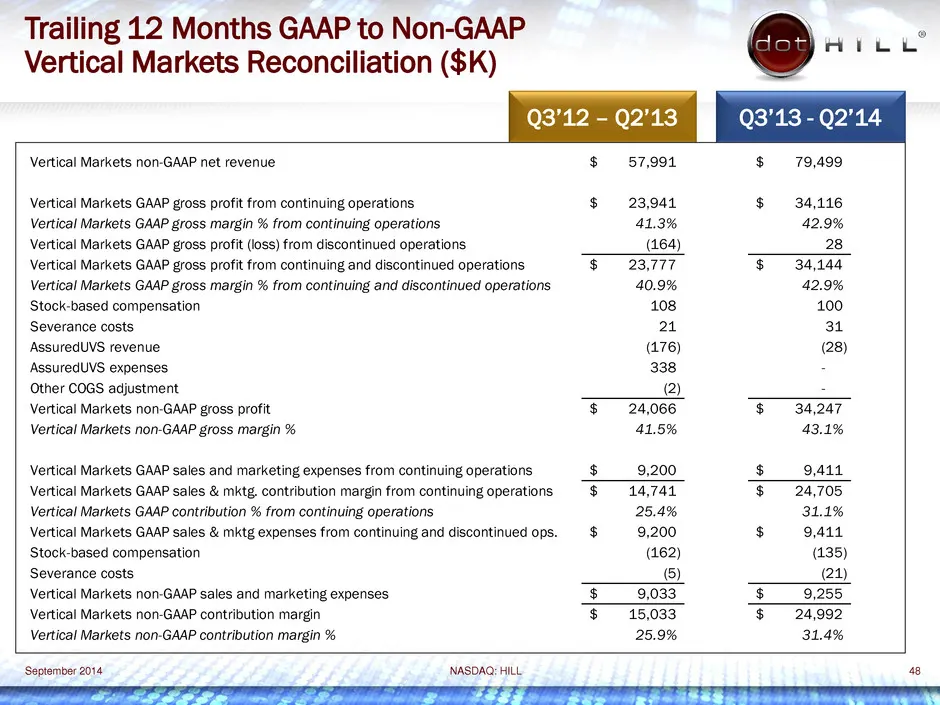
Slide 48: Trailing Months GAAP to Non-GAAP Vertical Markets Reconciliation
Trailing 12 Months GAAP to Non-GAAP P eg Hite’ Vertical Markets Reconciliation ($K) Vertical Markets non-GAAP net revenue $ 57,991 $ 79,499 $ 23,941 $ 34,116 operations 41.3% 42.9% q (164) ge profit pe $ 23,777 $ 34,144 rir ir is it 40.9% 42.9% Stock-based compensation 108 100 Severance AssuredUVS r

Slide 49: Dot Hill 30 Years
Source: SEC EDGAR · 8-K filed Sep 9, 2014
More decks from Dot Hill Systems Corp
 Q2 2015 Earnings Presentation27 slides · Aug 6, 2015
 Investor Presentation (May 2015)58 slides · May 12, 2015
 Q1 2015 Earnings Presentation13 slides · May 7, 2015
 Investor Presentation (March 2015)15 slides · Mar 5, 2015
 Investor Presentation (January 2015)49 slides · Jan 12, 2015
 Investor Presentation (November 2014)47 slides · Nov 10, 2014