Ascena Retail — Investor Day (February 2015)
54 slides from Ascena Retail's investor day presentation, Feb 11, 2015
Slide 1: Business Update: Positioning Ascena for Enhanced Growth and Value Creation
Business Update: Positioning Ascena for Enhanced Growth and Value Creation February 11 th , 2015
Slide 2: Safe Harbor Statement
PRONGS2015 \ 7. Analyst Day \ Presentation \ ASNA Analyst Day Presentation DRAFT V3.pptx 2 2 Safe Harbor Statement This presentation contains forward - looking statements within the meaning of the Private Securities Litigation Reform Act of 1995. Forward - looking statements are based on current exp
Slide 3: Topics
PRONGS2015 \ 7. Analyst Day \ Presentation \ ASNA Analyst Day Presentation DRAFT V3.pptx 3 3 ■ ascena vision, brand portfolio, and operating model ■ Justice update, and strategic priorities at other brands ■ Transformational shared services project update ■ Strategic initiatives ■ Recent financial p
Slide 4: Key takeaways
PRONGS2015 \ 7. Analyst Day \ Presentation \ ASNA Analyst Day Presentation DRAFT V3.pptx 4 4 Key takeaways Strong brands well positioned for future growth Strategic, margin - accretive projects underway Transformational projects nearing completion Significant free cash flow opportunity Disciplined c
Slide 5: Vision, brand portfolio, and operating model
Vision, brand portfolio, and operating model
Slide 6: Our vision of value creation is supported by over 325 years of collective heritage
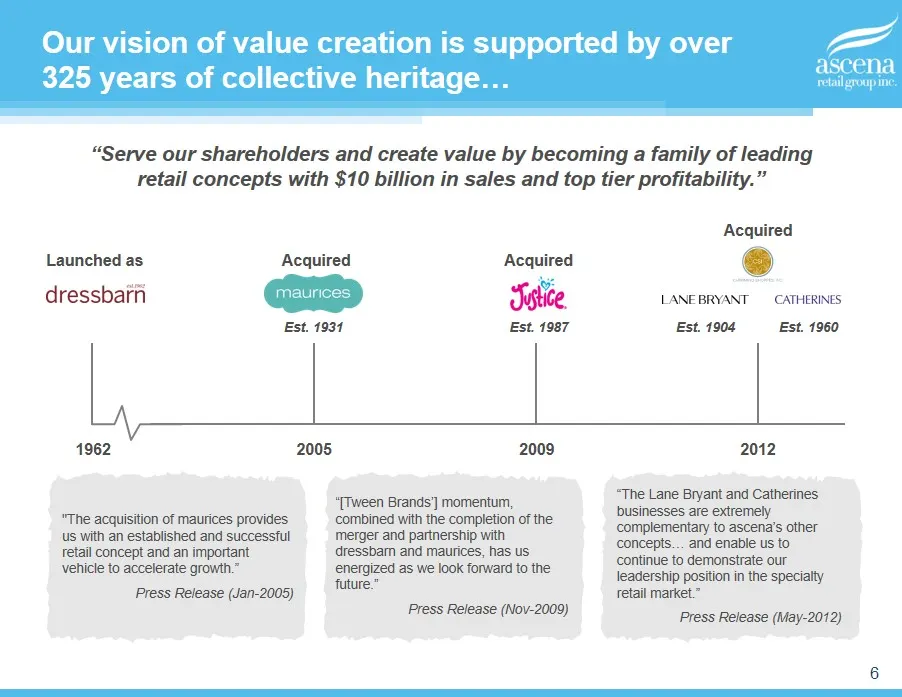
PRONGS2015 \ 7. Analyst Day \ Presentation \ ASNA Analyst Day Presentation DRAFT V3.pptx 6 6 Our vision of value creation is supported by over 325 years of collective heritage… 1962 2005 2009 2012 Launched as Acquired Est. 1931 Acquired Est. 1987 Est. 1904 Est. 1960 Acquired "The acquisition of m au
Slide 7: A series of acquisitions that have contributed significantly to earnings growth
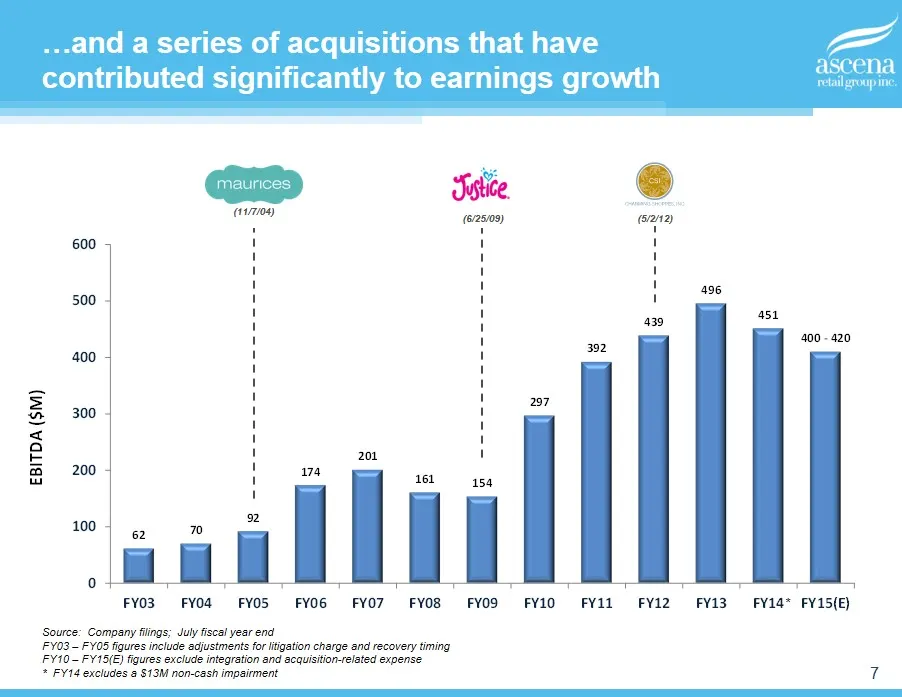
PRONGS2015 \ 7. Analyst Day \ Presentation \ ASNA Analyst Day Presentation DRAFT V3.pptx 7 7 62 70 92 174 201 161 154 297 392 439 496 451 400 - 420 0 100 200 300 400 500 600 FY03 FY04 FY05 FY06 FY07 FY08 FY09 FY10 FY11 FY12 FY13 FY14 FY15(E) EBITDA ($M) …and a series of acquisitions that have contri
Slide 8: Our brand portfolio is well-diversified
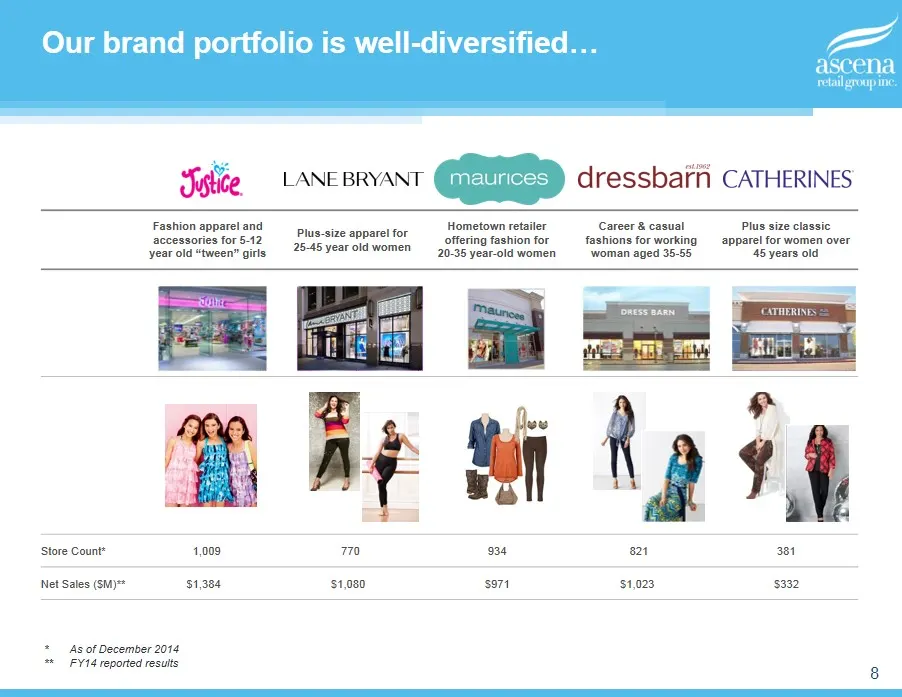
PRONGS2015 \ 7. Analyst Day \ Presentation \ ASNA Analyst Day Presentation DRAFT V3.pptx 8 8 Fashion apparel and accessories for 5 - 12 year old “tween” girls Plus - size apparel for 25 - 45 year old women Hometown retailer offering fashion for 20 - 35 year - old women Career & casual fashions for w
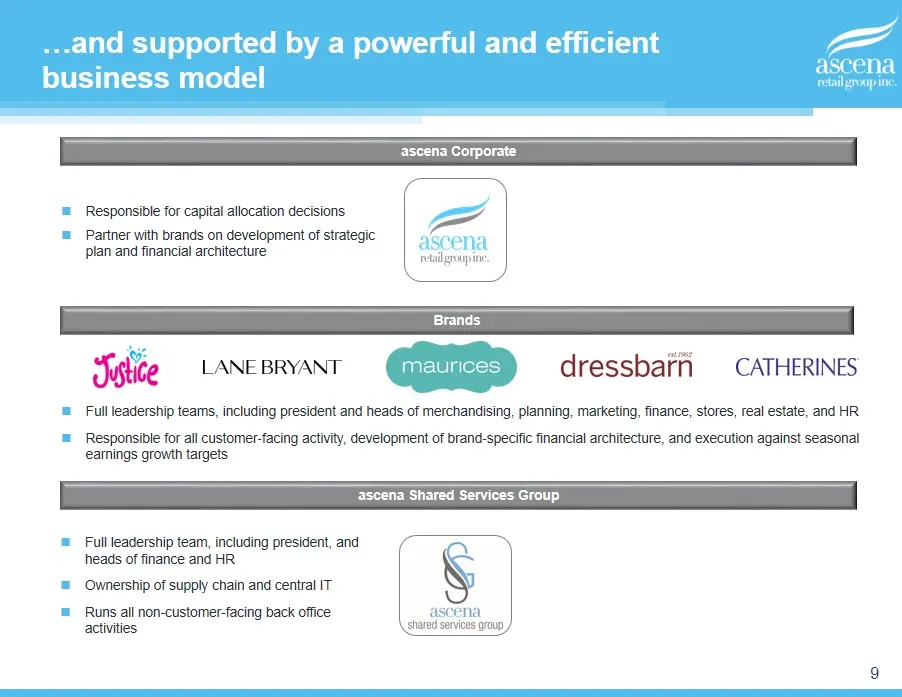
Slide 9: Supported by a powerful and efficient business model
PRONGS2015 \ 7. Analyst Day \ Presentation \ ASNA Analyst Day Presentation DRAFT V3.pptx 9 9 …and supported by a powerful and efficient business model Brands Full leadership teams, including president and heads of merchandising, planning, marketing, finance, stores, real estate, and HR Responsible f
Slide 10: Justice update
Pa ascena retail group ine. Justice update Slice = LANEBRYANT t maunces ] dressbaffi — CATHERINES
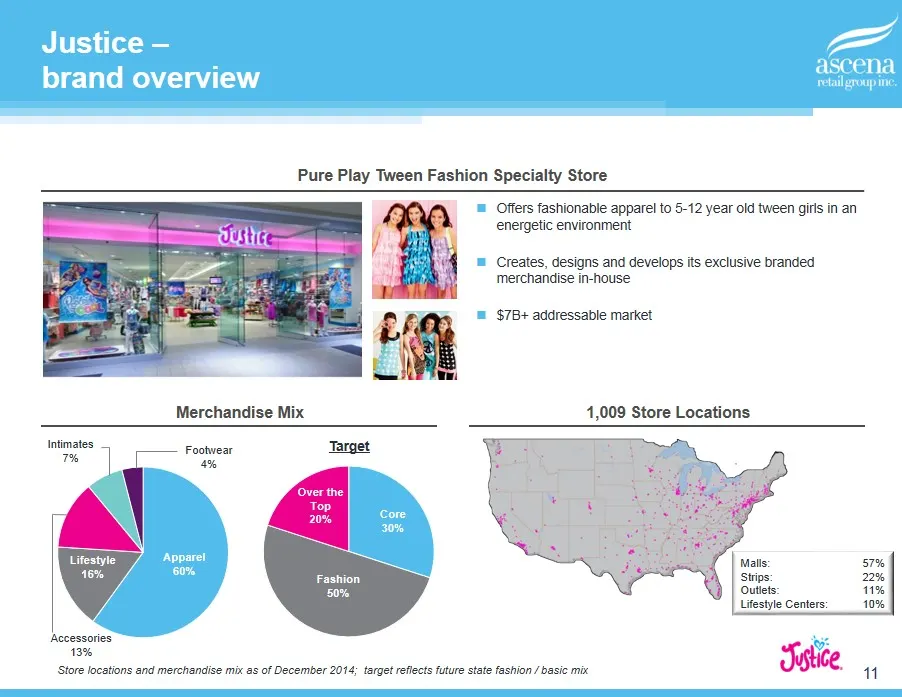
Slide 11: Justice - brand overview
PRONGS2015 \ 7. Analyst Day \ Presentation \ ASNA Analyst Day Presentation DRAFT V3.pptx 11 11 Apparel 60% Lifestyle 16% Accessories 13% Intimates 7% Footwear 4% Core 30% Fashion 50% Over the Top 20% Justice – brand o verview Pure Play Tween Fashion Specialty Store Merchandise Mix 1,009 Store Locati
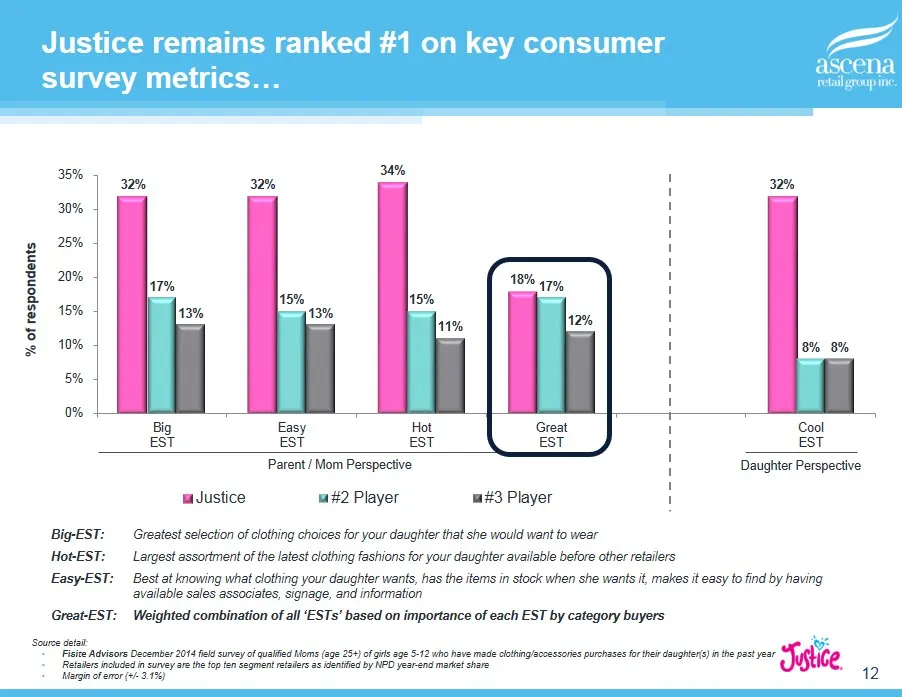
Slide 12: Justice remains ranked #1 on key consumer survey metrics
PRONGS2015 \ 7. Analyst Day \ Presentation \ ASNA Analyst Day Presentation DRAFT V3.pptx 12 12 Justice remains ranked #1 on key consumer survey metrics… 32% 32% 34% 18% 32% 17% 15% 15% 17% 8% 13% 13% 11% 12% 8% 0% 5% 10% 15% 20% 25% 30% 35% Big EST Easy EST Hot EST Great EST Cool EST Justice #2 Play
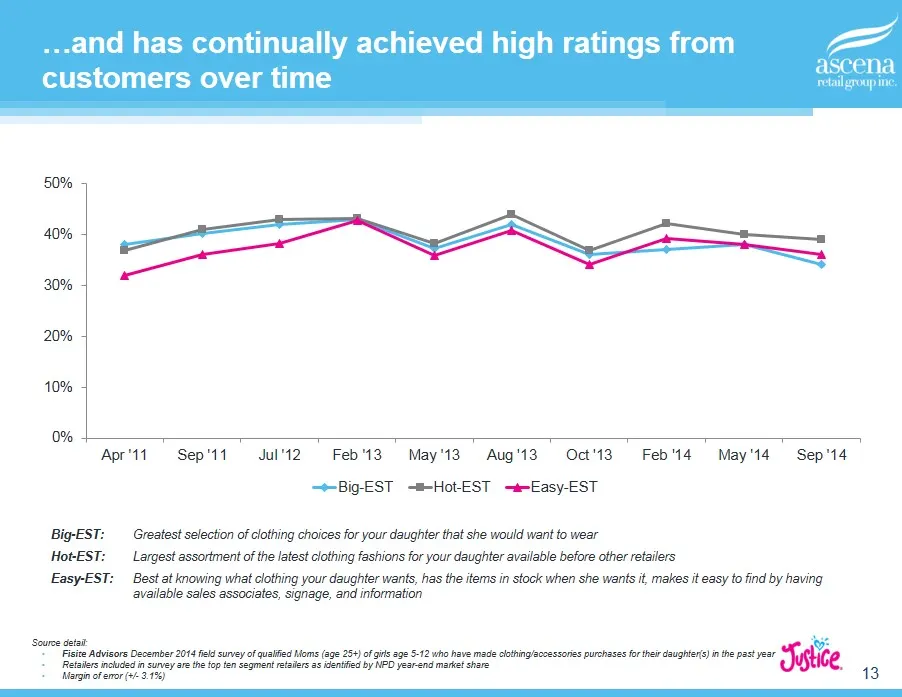
Slide 13: Continually achieved high ratings from customers over time
PRONGS2015 \ 7. Analyst Day \ Presentation \ ASNA Analyst Day Presentation DRAFT V3.pptx 13 13 …and has continually achieved high ratings from customers over time 0% 10% 20% 30% 40% 50% Apr '11 Sep '11 Jul '12 Feb '13 May '13 Aug '13 Oct '13 Feb '14 May '14 Sep '14 Big-EST Hot-EST Easy-EST Source de
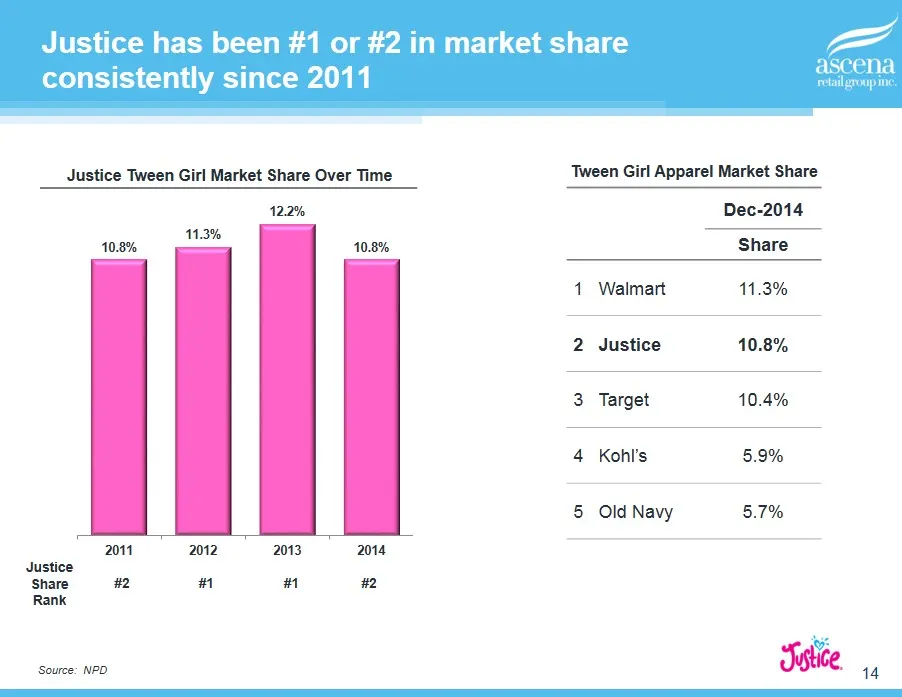
Slide 14: Justice has been #1 or #2 in market share since 2011
PRONGS2015 \ 7. Analyst Day \ Presentation \ ASNA Analyst Day Presentation DRAFT V3.pptx 14 14 Justice has been #1 or #2 in market share consistently since 2011 10.8% 11.3% 12.2% 10.8% 2011 2012 2013 2014 Justice Share Rank #2 #1 #1 #2 Tween Girl Apparel Market Share Dec - 2014 Share 1 Walmart 11.3%
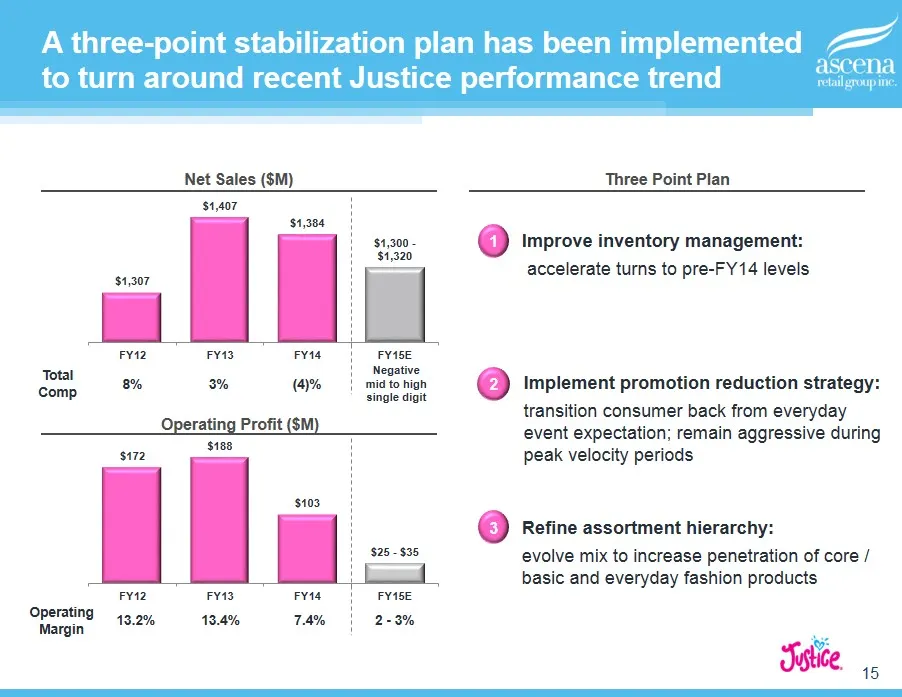
Slide 15: Three-point stabilization plan to turn around Justice performance
PRONGS2015 \ 7. Analyst Day \ Presentation \ ASNA Analyst Day Presentation DRAFT V3.pptx 15 15 Operating Margin 13.2% 13.4% 7.4% 2 - 3% Total Comp 8% 3% (4)% Negative mid to high single digit A three - point stabilization plan has been implemented to turn around recent Justice performance trend Net
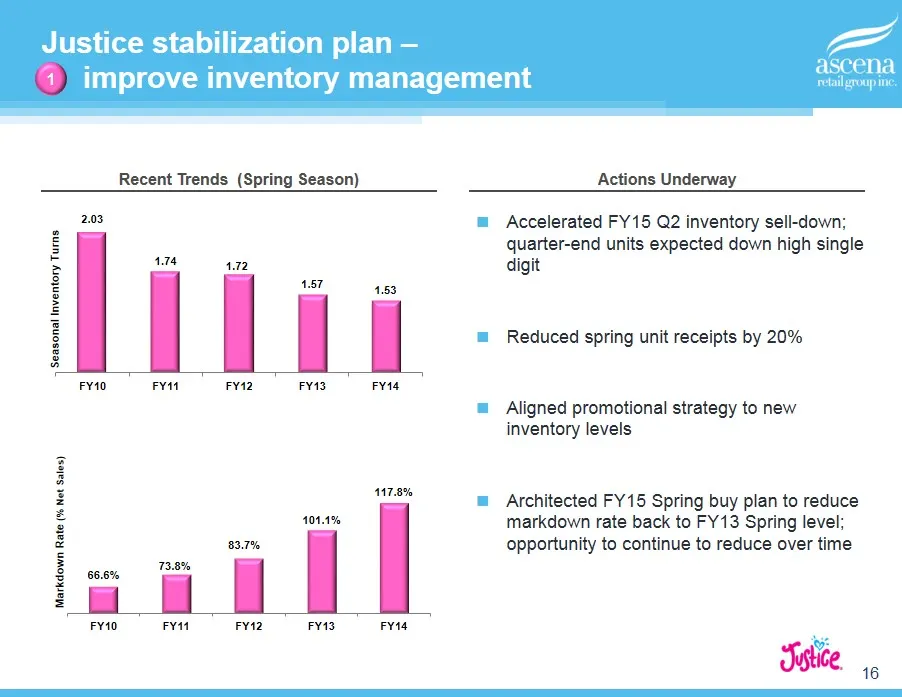
Slide 16: Justice stabilization plan - improve inventory management
PRONGS2015 \ 7. Analyst Day \ Presentation \ ASNA Analyst Day Presentation DRAFT V3.pptx 16 16 66.6% 73.8% 83.7% 101.1% 117.8% FY10 FY11 FY12 FY13 FY14 Markdown Rate (% Net Sales) Justice stabilization plan – improve inventory m anagement Recent Trends (Spring Season) Actions Underway 2.03 1.74 1.72
Slide 17: Justice stabilization plan - implement promotion reduction strategy
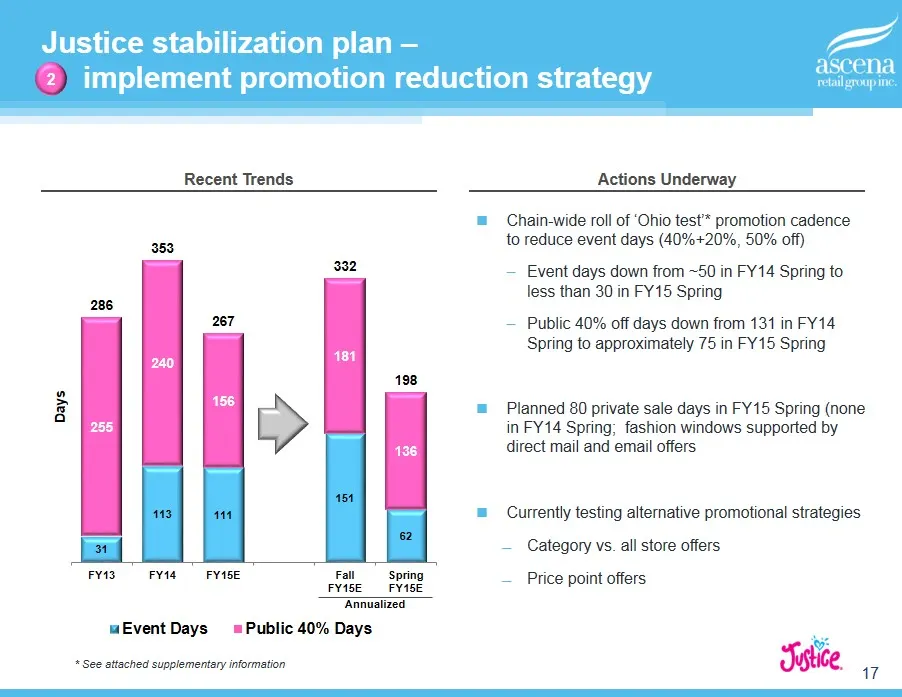
PRONGS2015 \ 7. Analyst Day \ Presentation \ ASNA Analyst Day Presentation DRAFT V3.pptx 17 17 Justice stabilization plan – implement promotion reduction strategy Recent Trends Actions Underway 31 113 111 151 62 255 240 156 181 136 286 353 267 332 198 FY13 FY14 FY15E Fall FY15E Spring FY15E Days Eve
Slide 18: Justice stabilization plan - refine assortment hierarchy
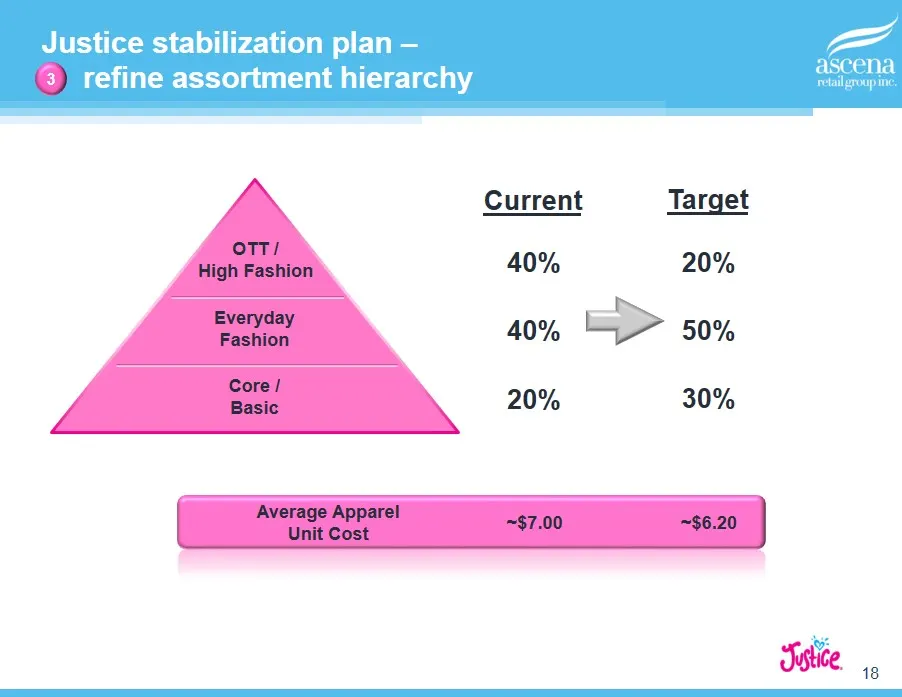
PRONGS2015 \ 7. Analyst Day \ Presentation \ ASNA Analyst Day Presentation DRAFT V3.pptx 18 18 Justice stabilization plan – refine assortment hierarchy OTT / High Fashion Everyday Fashion Core / Basic 40% 40% 20% 20% 50% 30% Target Current Average Apparel Unit Cost ~$7.00 ~$6.20 3
Slide 19: Strategic priorities at other brands
Strategic p riorities at other b rands
Slide 20: Lane Bryant - brand overview
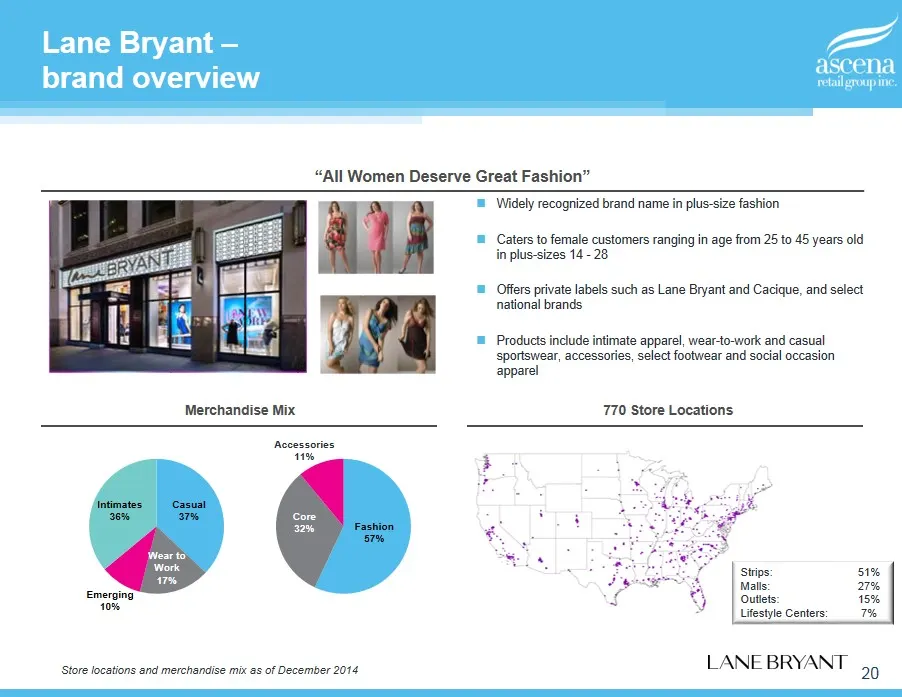
PRONGS2015 \ 7. Analyst Day \ Presentation \ ASNA Analyst Day Presentation DRAFT V3.pptx 20 20 Fashion 57% Core 3 2 % Lane Bryant – brand overview “All Women Deserve Great Fashion” Merchandise Mix 770 Store Locations Widely recognized brand name in plus - size fashion Caters to female customers rang
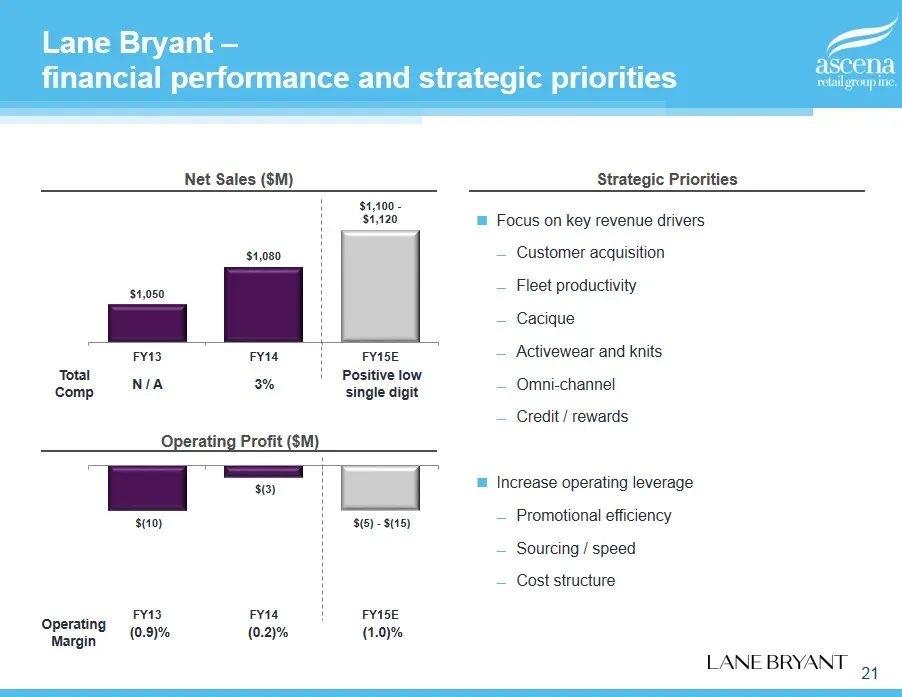
Slide 21: Lane Bryant - financial performance and strategic priorities
PRONGS2015 \ 7. Analyst Day \ Presentation \ ASNA Analyst Day Presentation DRAFT V3.pptx 21 21 Total Comp N / A 3% Positive low single digit Operating Margin (0.9)% (0.2)% (1.0)% $(10) $(3) $(5) - $(15) FY13 FY14 FY15E Lane Bryant – financial performance and strategic priorities Net Sales ($ M ) Str
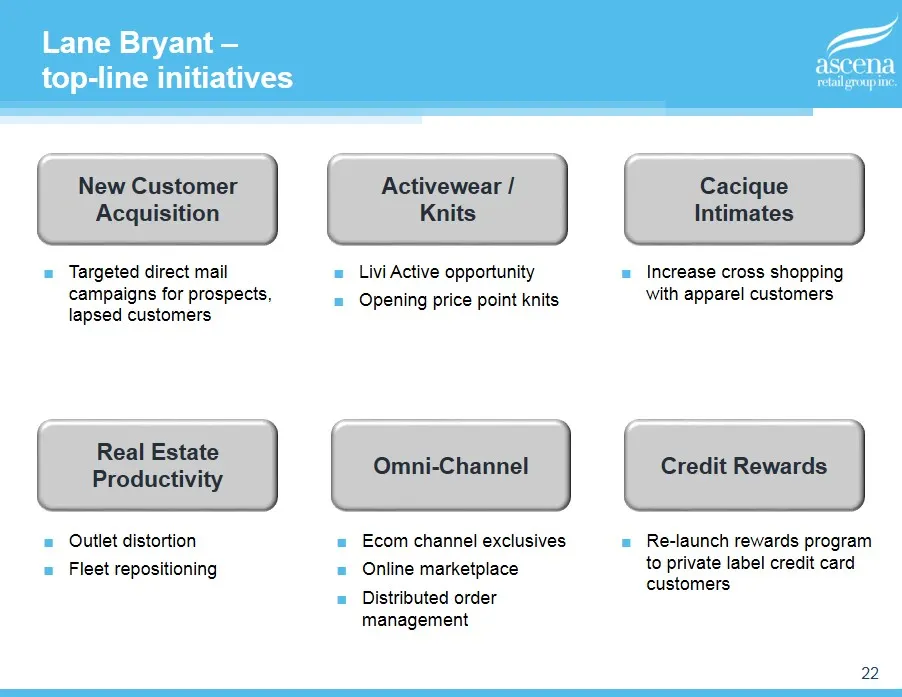
Slide 22: Lane Bryant - top-line initiatives
PRONGS2015 \ 7. Analyst Day \ Presentation \ ASNA Analyst Day Presentation DRAFT V3.pptx 22 22 ■ Outlet distortion ■ Fleet repositioning Lane Bryant – top - line initiatives New Customer Acquisition Real Estate Productivity Cacique Intimates Activewear / Knits Omni - Channel Credit Rewards ■ Targete
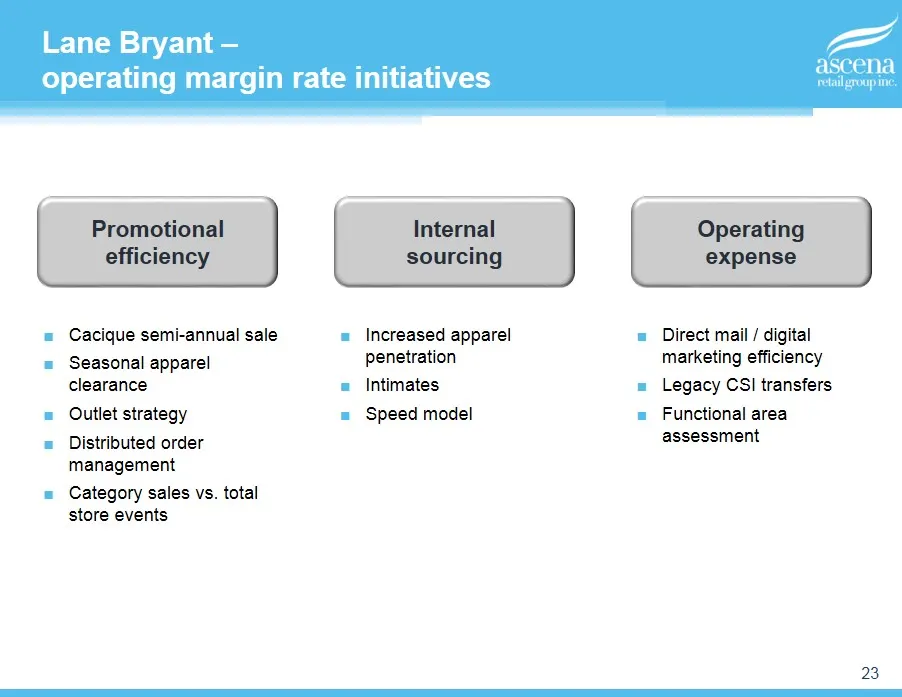
Slide 23: Lane Bryant - operating margin rate initiatives
PRONGS2015 \ 7. Analyst Day \ Presentation \ ASNA Analyst Day Presentation DRAFT V3.pptx 23 23 Lane Bryant – operating margin rate initiatives Promotional efficiency ■ Cacique semi - annual sale ■ Seasonal apparel clearance ■ Outlet strategy ■ Distributed order management ■ Category sales vs. total
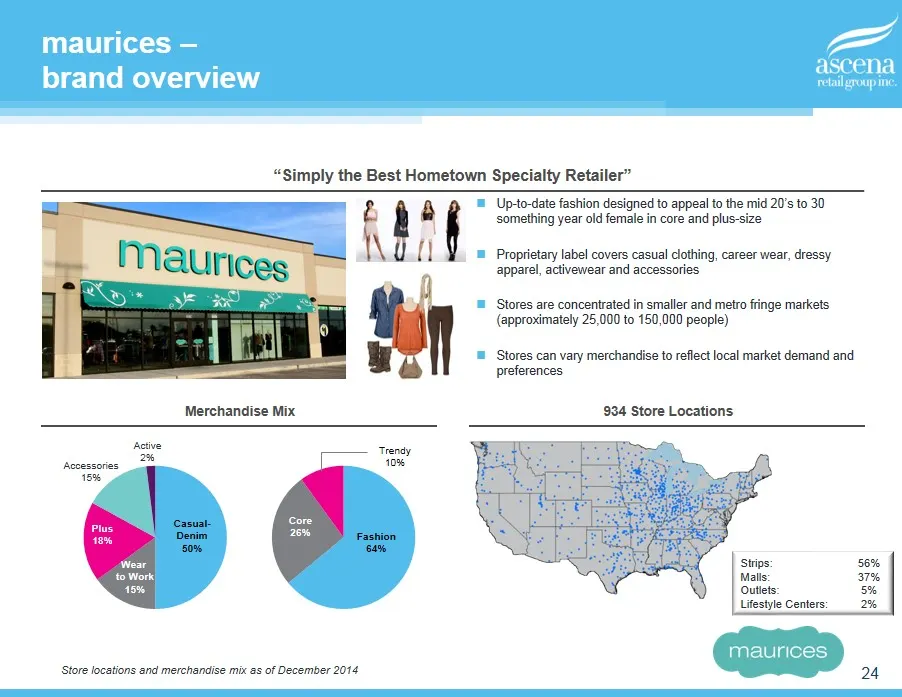
Slide 24: maurices - brand overview
PRONGS2015 \ 7. Analyst Day \ Presentation \ ASNA Analyst Day Presentation DRAFT V3.pptx 24 24 Fashion 64% Core 26% Trendy 10% Casual - Denim 50% Plus 18% Wear to Work 15% maurices – brand o verview “Simply the Best Hometown Specialty Retailer” Merchandise Mix 934 Store Locations Up - to - date fash
Slide 25: maurices - financial performance and strategic priorities
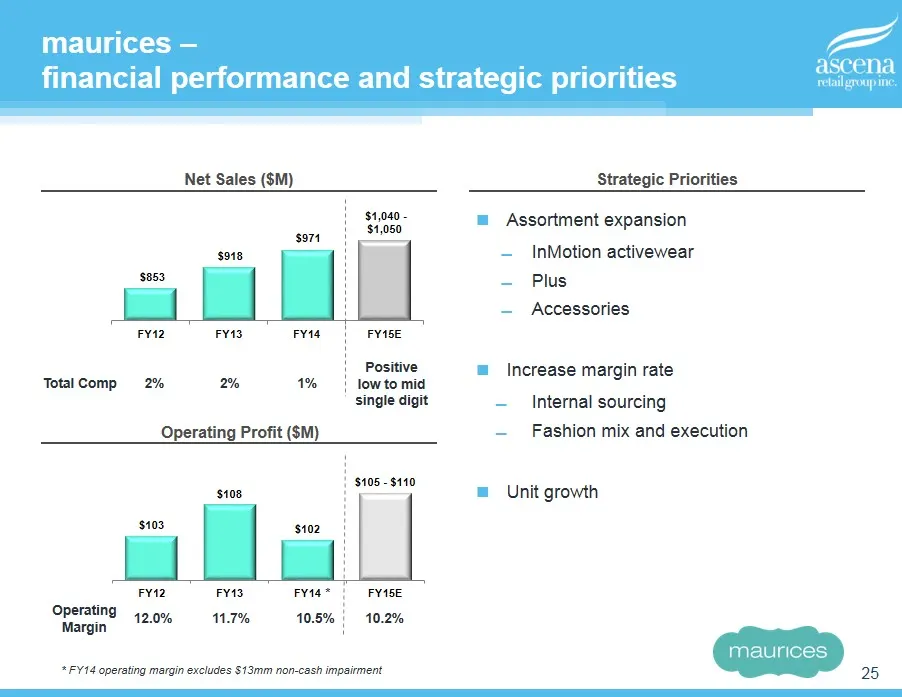
PRONGS2015 \ 7. Analyst Day \ Presentation \ ASNA Analyst Day Presentation DRAFT V3.pptx 25 25 maurices – financial performance and strategic priorities Net Sales ($ M ) Strategic Priorities Operating Profit ($ M ) Assortment expansion ̶ InMotion activewear ̶ Plus ̶ Accessories Increase margin rate
Slide 26: dressbarn - brand overview
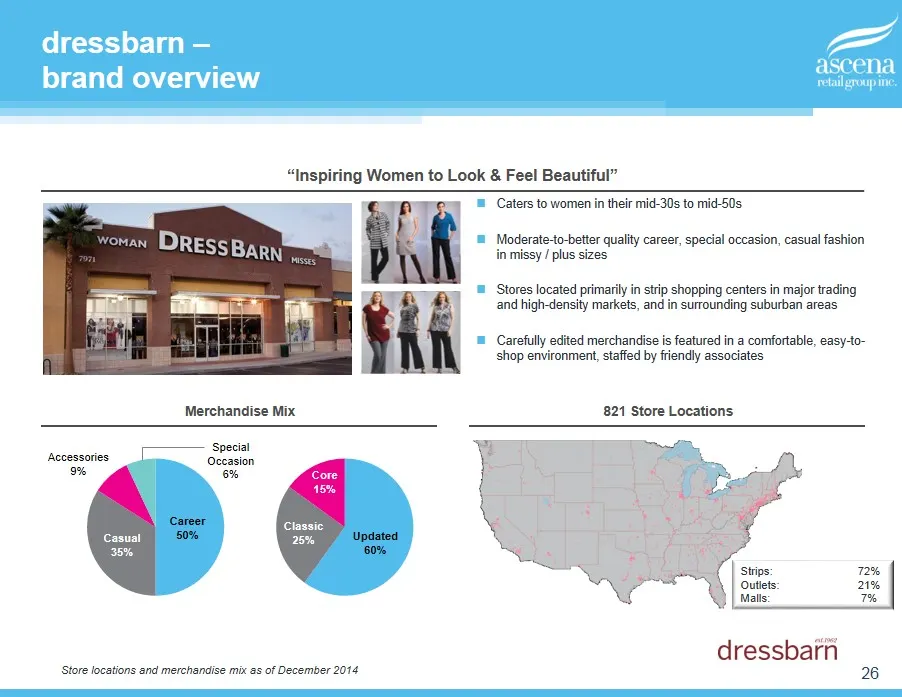
PRONGS2015 \ 7. Analyst Day \ Presentation \ ASNA Analyst Day Presentation DRAFT V3.pptx 26 26 Updated 60% Classic 25% Core 15% Career 50% Casual 35% Accessories 9 % Special Occasion 6 % dressbarn – brand overview “Inspiring Women to Look & Feel Beautiful” Merchandise Mix 821 Store Locations Caters
Slide 27: dressbarn - financial performance and strategic priorities
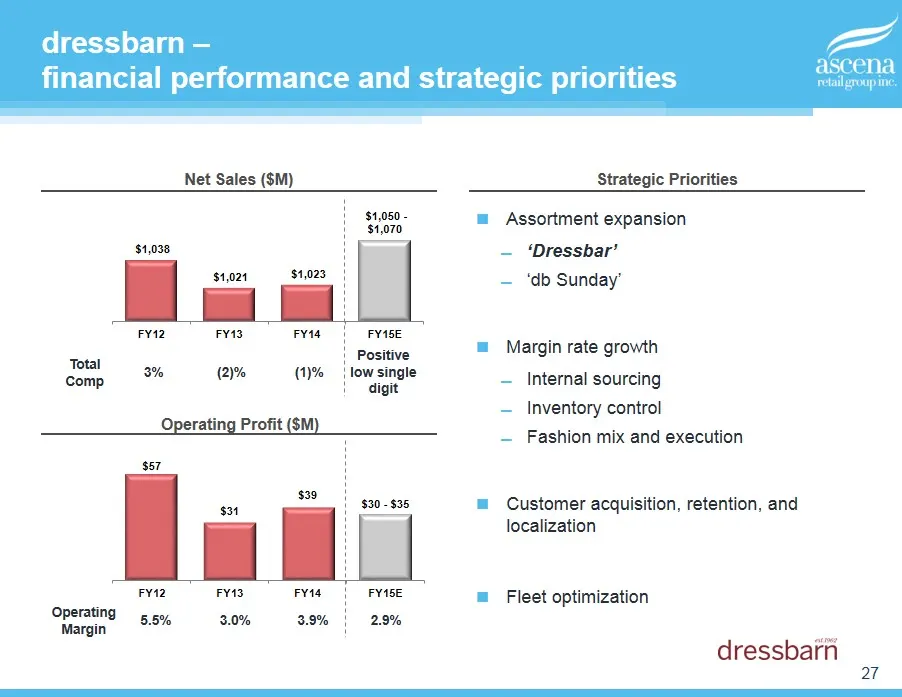
PRONGS2015 \ 7. Analyst Day \ Presentation \ ASNA Analyst Day Presentation DRAFT V3.pptx 27 27 dressbarn – financial performance and strategic priorities Net Sales ($M) Strategic Priorities Operating Profit ($M) Assortment expansion ̶ ‘ Dressbar ’ ̶ ‘ db Sunday’ Margin rate growth ̶ Internal sourcin
Slide 28: Catherines - brand overview
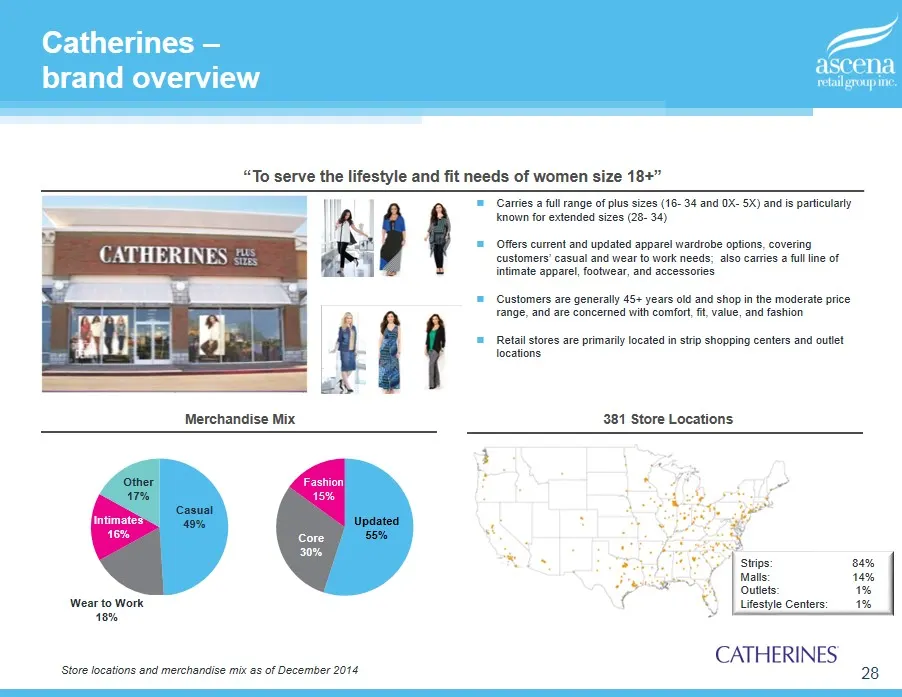
PRONGS2015 \ 7. Analyst Day \ Presentation \ ASNA Analyst Day Presentation DRAFT V3.pptx 28 28 Updated 55% Core 30% Fashion 15% Catherines – brand o verview “To serve the lifestyle and fit needs of women size 18 +” Merchandise Mix 381 Store Locations Carries a full range of plus sizes (16 - 34 and 0
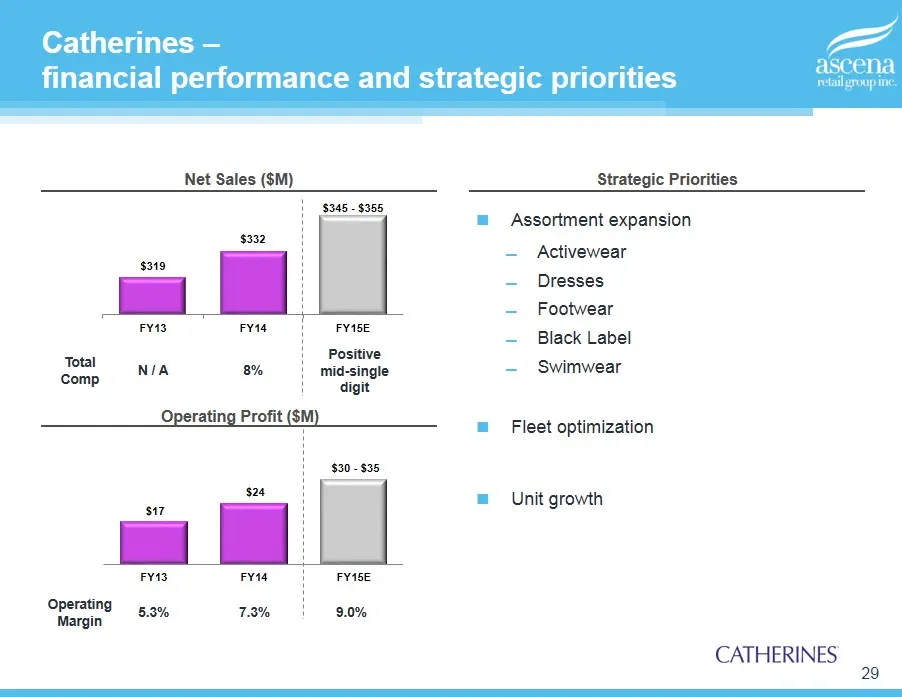
Slide 29: Catherines - financial performance and strategic priorities
PRONGS2015 \ 7. Analyst Day \ Presentation \ ASNA Analyst Day Presentation DRAFT V3.pptx 29 29 Assortment expansion ̶ Activewear ̶ Dresses ̶ Footwear ̶ Black Label ̶ Swimwear Fleet optimization Unit growth Catherines – financial performance and strategic priorities Net Sales ($ M ) Strategic Priorit
Slide 30: Transformational shared services project update
Transformational s hared s ervices project update
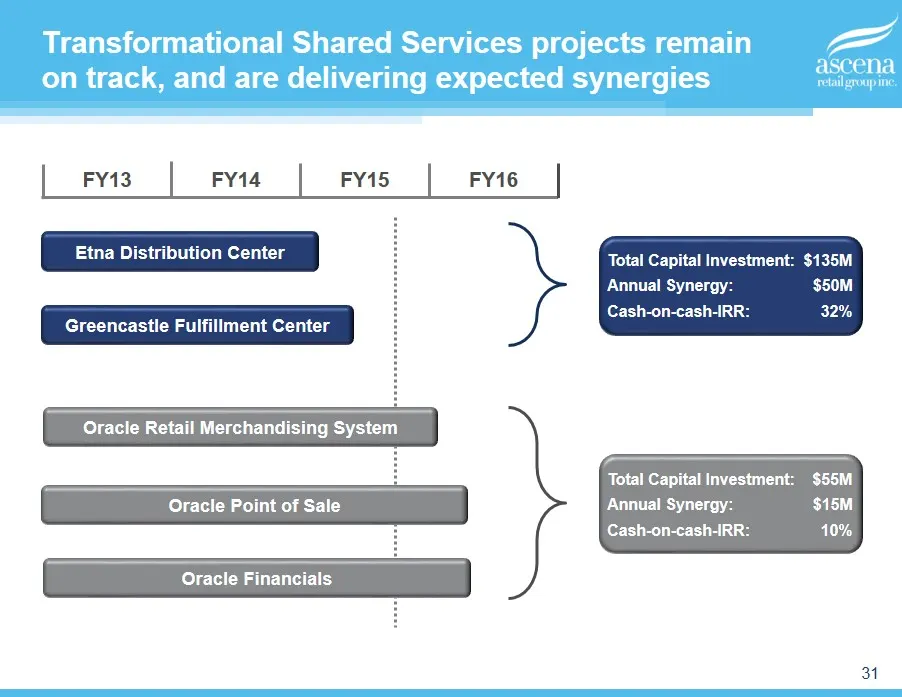
Slide 31: Shared Services projects remain on track, delivering expected synergies
PRONGS2015 \ 7. Analyst Day \ Presentation \ ASNA Analyst Day Presentation DRAFT V3.pptx 31 31 Transformational Shared Services projects remain on track, and are delivering expected synergies FY13 FY14 FY15 FY16 Etna Distribution Center Greencastle Fulfillment Center Oracle Point of Sale Total Capit
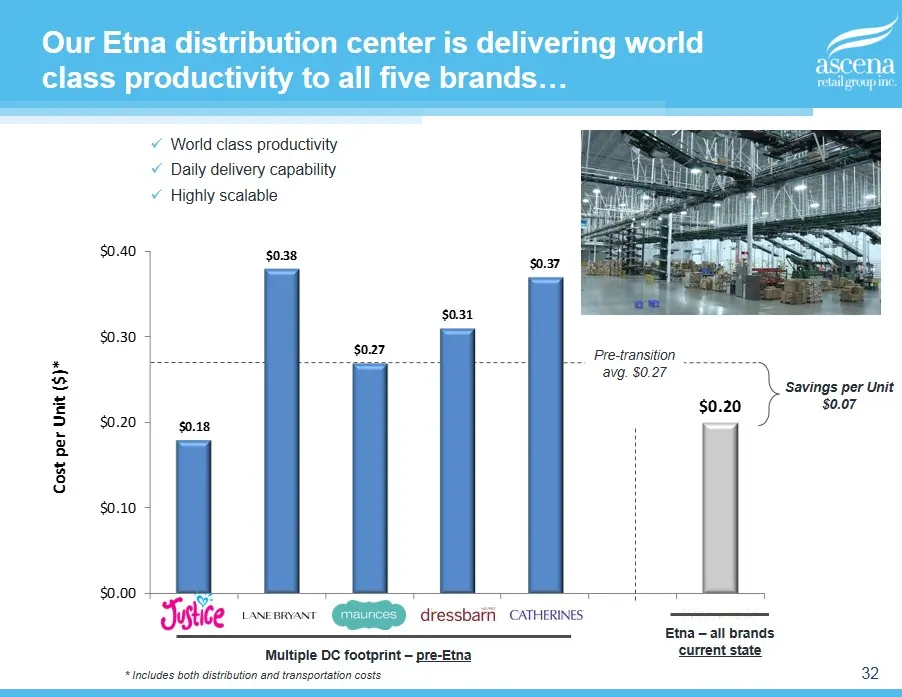
Slide 32: Etna distribution center delivering world class productivity
PRONGS2015 \ 7. Analyst Day \ Presentation \ ASNA Analyst Day Presentation DRAFT V3.pptx 32 32 Our Etna distribution center is delivering world class productivity to all five brands… x World class productivity x Daily delivery capability x Highly scalable Multiple DC footprint – pre - Etna Etna – al
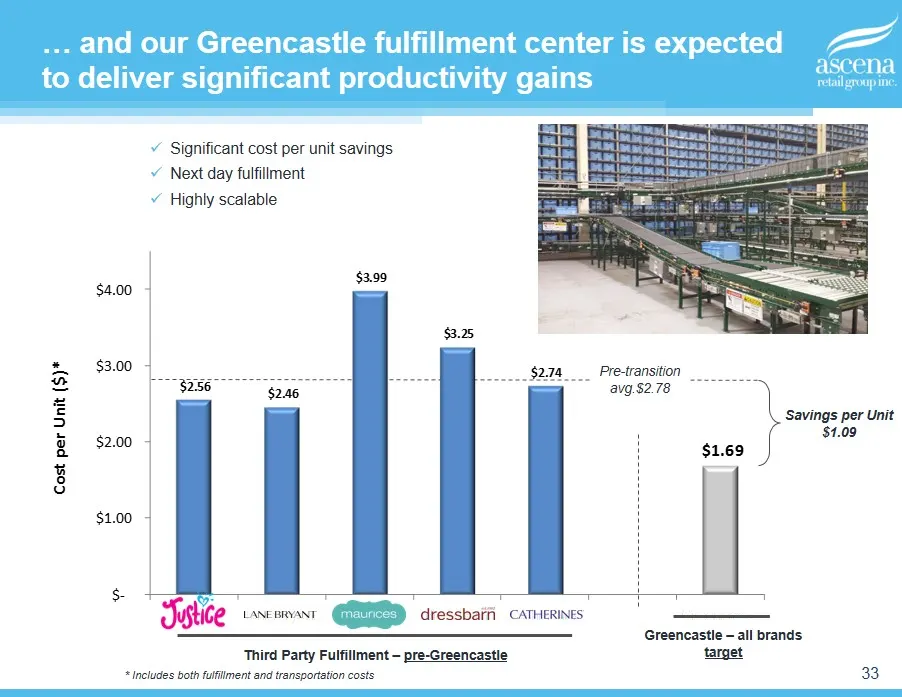
Slide 33: Greencastle fulfillment center expected to deliver significant productivity gains
PRONGS2015 \ 7. Analyst Day \ Presentation \ ASNA Analyst Day Presentation DRAFT V3.pptx 33 33 Third Party Fulfillment – pre - Greencastle Greencastle – all brands target … and our Greencastle fulfillment center is expected to deliver significant productivity gains x Significant cost per unit saving
Slide 34: Strategic initiatives
Strategic initiatives Sfiglice = LANE BRYANT t maunces ] dressbaffi — CATHERINES
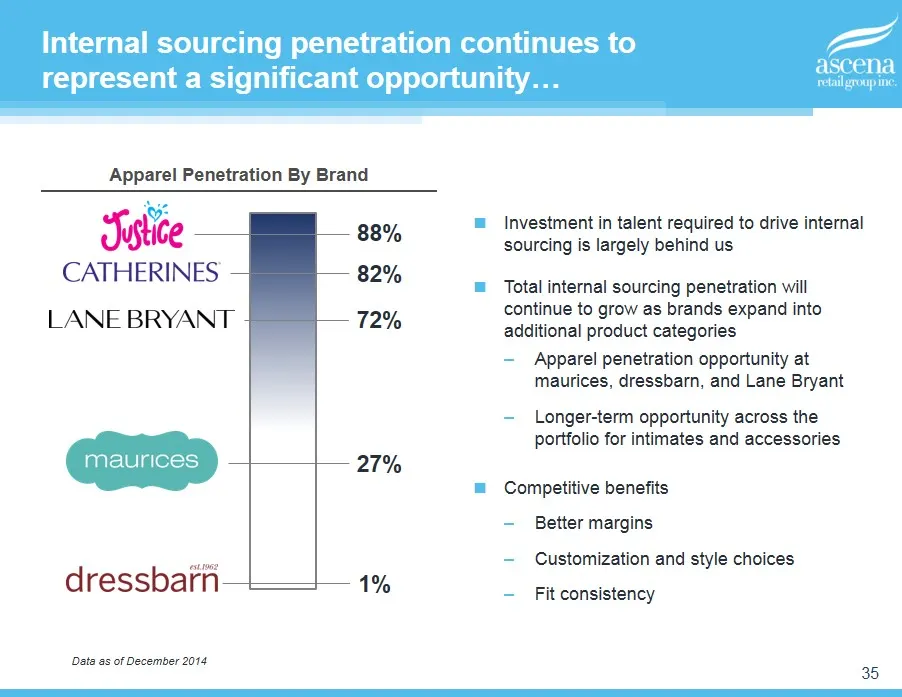
Slide 35: Internal sourcing penetration continues to represent a significant opportunity
PRONGS2015 \ 7. Analyst Day \ Presentation \ ASNA Analyst Day Presentation DRAFT V3.pptx 35 35 Internal sourcing penetration continues to represent a significant opportunity… Investment in talent required to drive internal sourcing is largely behind us Total internal sourcing penetration will contin
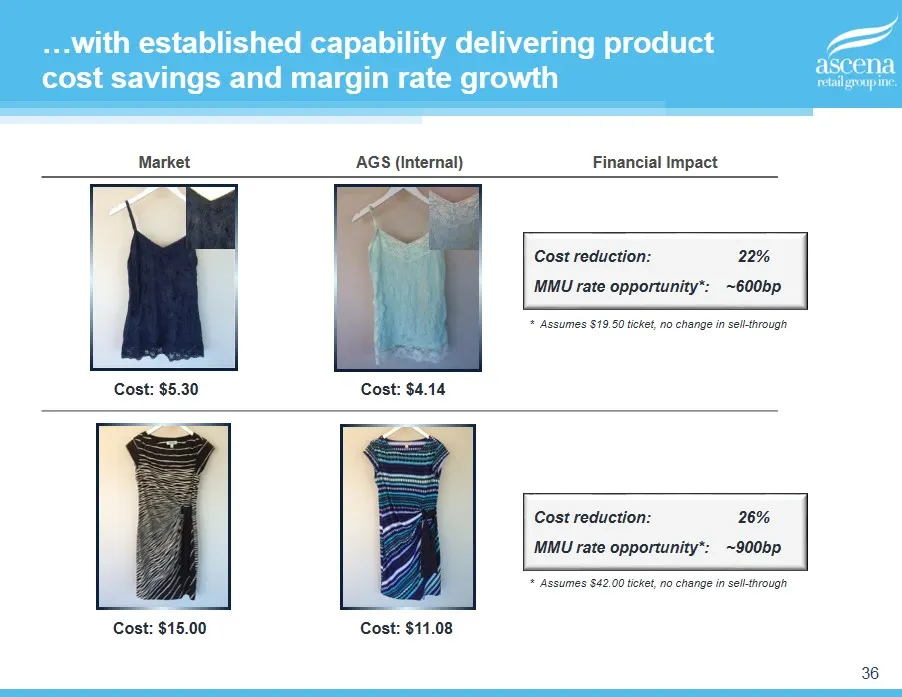
Slide 36: Established capability delivering product cost savings and margin rate growth
PRONGS2015 \ 7. Analyst Day \ Presentation \ ASNA Analyst Day Presentation DRAFT V3.pptx 36 36 …with established capability delivering product cost savings and margin rate growth Market AGS (Internal) Financial Impact Cost: $5.30 Cost: $15.00 Cost : $4.14 Cost : $ 11.08 Cost reduction: 22% MMU rate
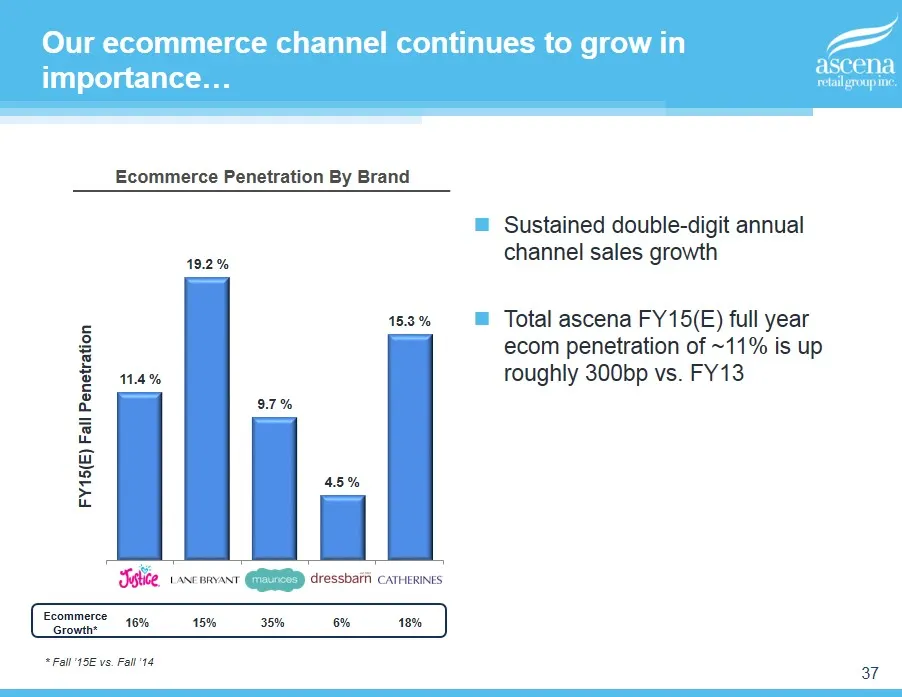
Slide 37: Our ecommerce channel continues to grow in importance
PRONGS2015 \ 7. Analyst Day \ Presentation \ ASNA Analyst Day Presentation DRAFT V3.pptx 37 37 11.4 % 19.2 % 9.7 % 4.5 % 15.3 % Justice Lane Bryant maurices dressbarn Catherines FY15(E) Fall Penetration Our ecommerce channel continues to grow in importance… Ecommerce Growth* 16% 15% 35% 6% 18% Ecomm
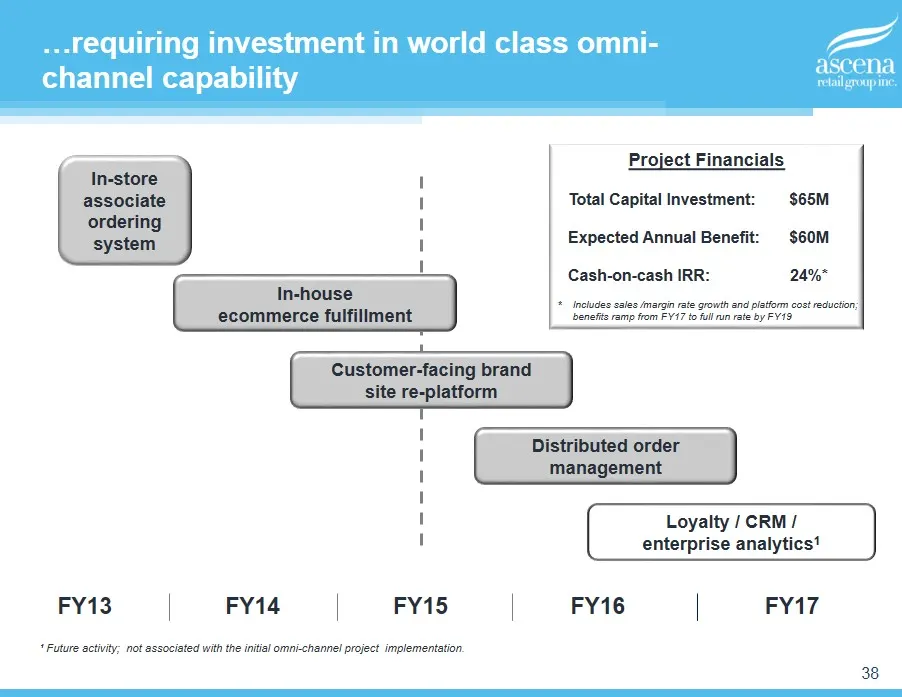
Slide 38: Investment in world class omni-channel capability
PRONGS2015 \ 7. Analyst Day \ Presentation \ ASNA Analyst Day Presentation DRAFT V3.pptx 38 38 …requiring investment in world class omni - channel capability ¹ Future activity; not associated with the initial omni - channel project implementation. Customer - facing brand site re - platform In - hous
Slide 39: Recent financial performance
Recent f inancial p erformance
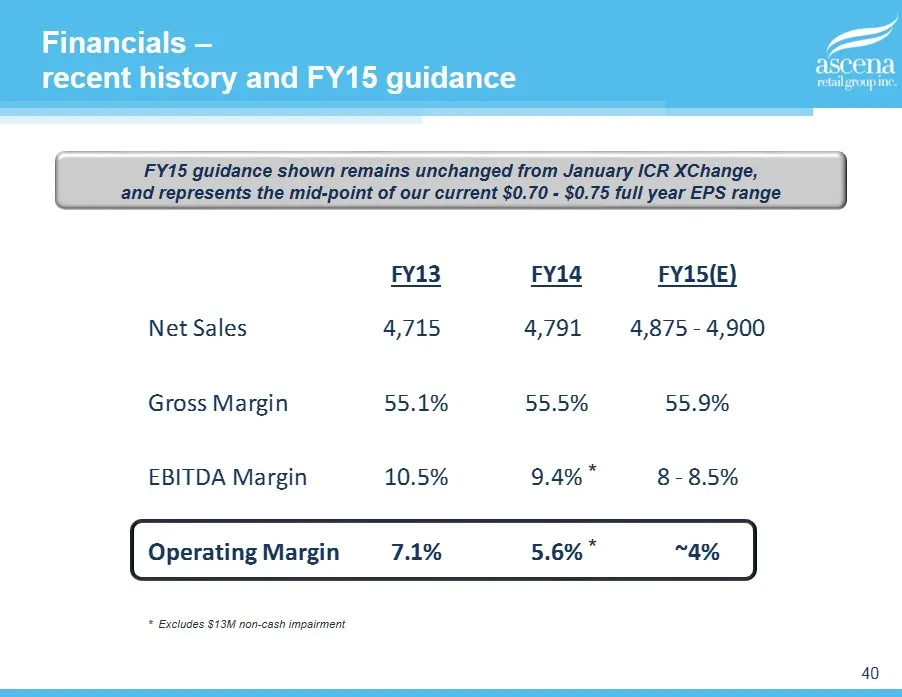
Slide 40: Financials - recent history and FY15 guidance
PRONGS2015 \ 7. Analyst Day \ Presentation \ ASNA Analyst Day Presentation DRAFT V3.pptx 40 40 Financials – recent history and FY15 guidance FY13 FY14 FY15(E) Net Sales 4,715 4,791 4,875 - 4,900 Gross Margin 55.1% 55.5% 55.9% EBITDA Margin 10.5% 9.4% 8 - 8.5% Operating Margin 7.1% 5.6% ~4% FY15 guid
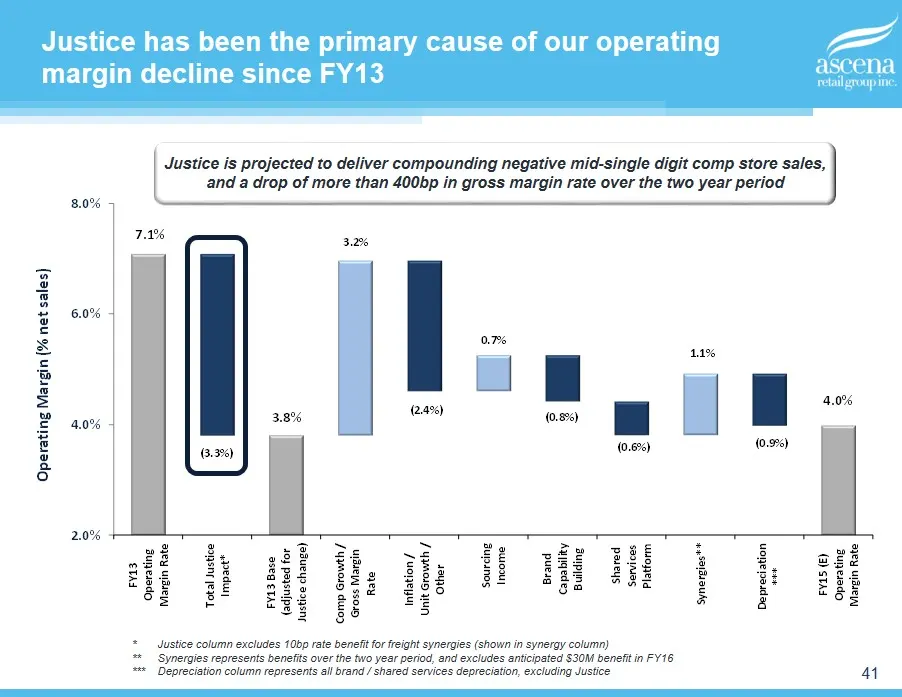
Slide 41: Justice primary cause of operating margin decline since FY13
PRONGS2015 \ 7. Analyst Day \ Presentation \ ASNA Analyst Day Presentation DRAFT V3.pptx 41 41 7.1% 3.8% 4.0% 3.2% 0.7% 1.1% (3.3%) (2.4%) (0.8%) (0.6%) (0.9%) 2.0% 4.0% 6.0% 8.0% FY13 Operating Margin Rate Total Justice Impact* FY13 Base (adjusted for Justice change) Comp Growth / Gross Margin Rate
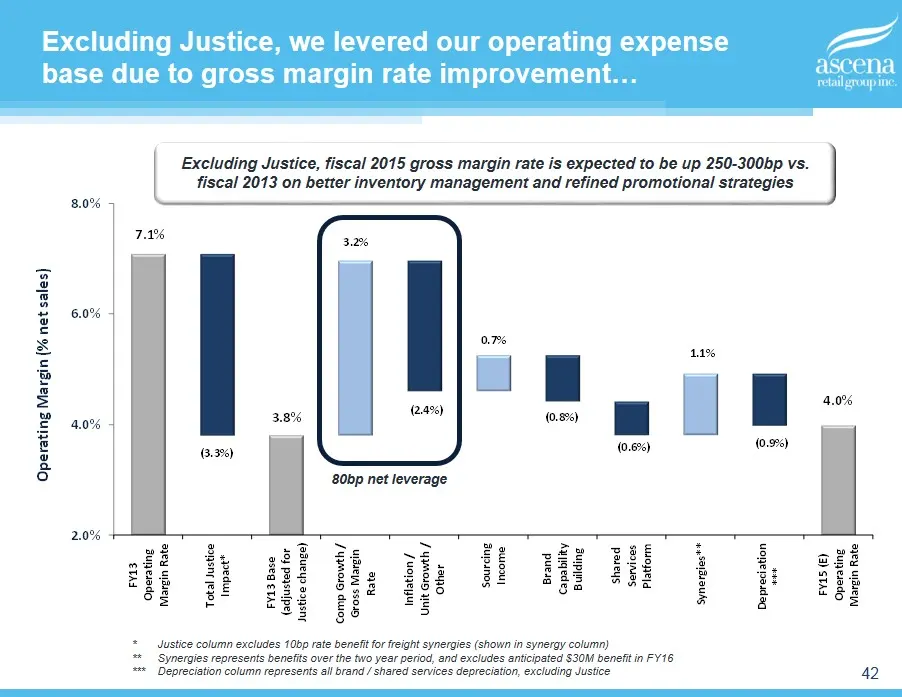
Slide 42: Excluding Justice, we levered our operating expense base
PRONGS2015 \ 7. Analyst Day \ Presentation \ ASNA Analyst Day Presentation DRAFT V3.pptx 42 42 7.1% 3.8% 4.0% 3.2% 0.7% 1.1% (3.3%) (2.4%) (0.8%) (0.6%) (0.9%) 2.0% 4.0% 6.0% 8.0% FY13 Operating Margin Rate Total Justice Impact* FY13 Base (adjusted for Justice change) Comp Growth / Gross Margin Rate
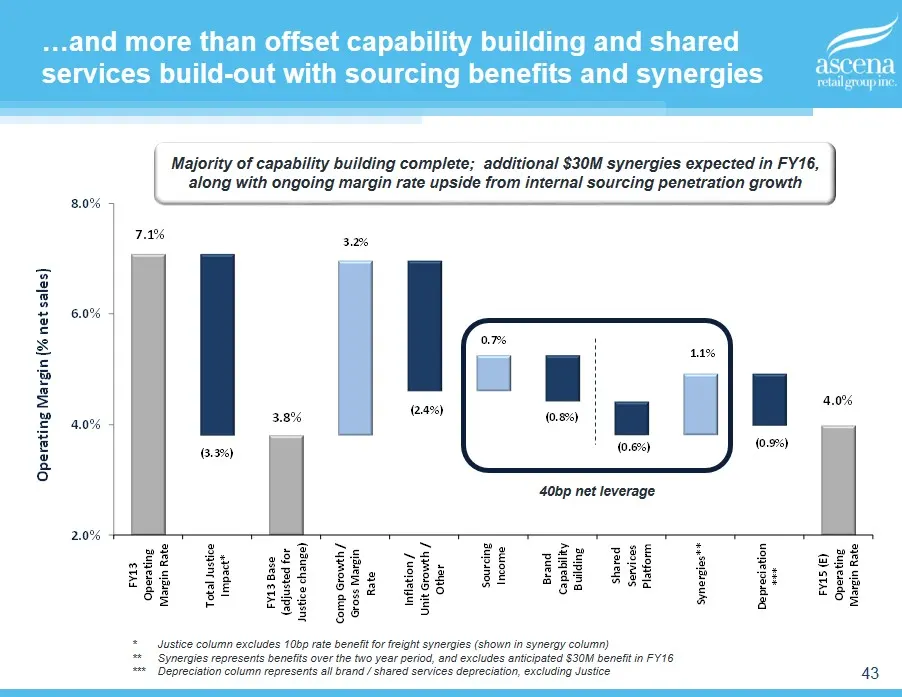
Slide 43: Offset capability building and shared services build-out with sourcing benefits and synergies
PRONGS2015 \ 7. Analyst Day \ Presentation \ ASNA Analyst Day Presentation DRAFT V3.pptx 43 43 7.1% 3.8% 4.0% 3.2% 0.7% 1.1% (3.3%) (2.4%) (0.8%) (0.6%) (0.9%) 2.0% 4.0% 6.0% 8.0% FY13 Operating Margin Rate Total Justice Impact* FY13 Base (adjusted for Justice change) Comp Growth / Gross Margin Rate
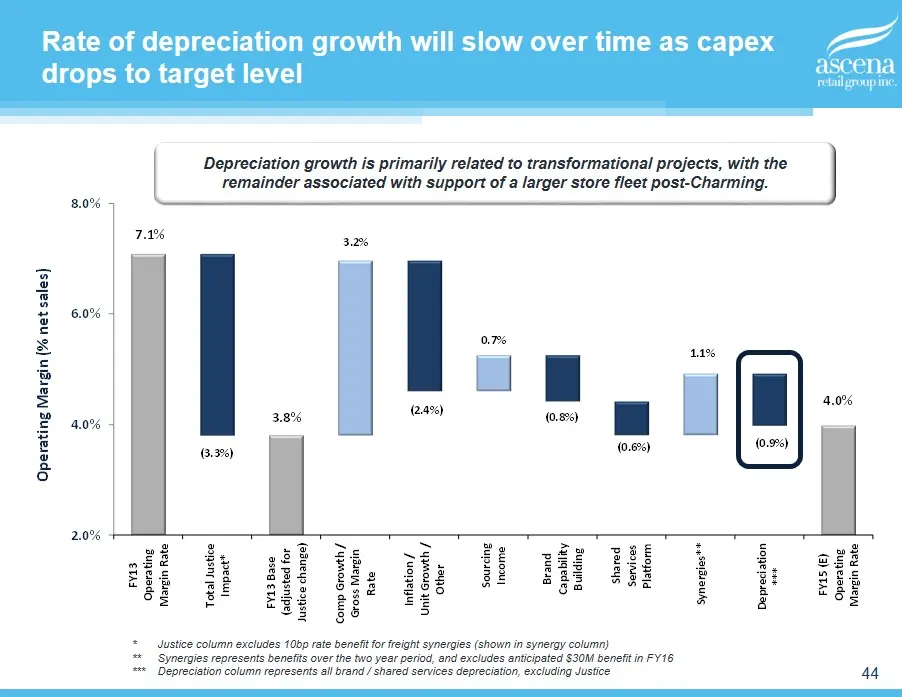
Slide 44: Depreciation growth related to transformational projects
PRONGS2015 \ 7. Analyst Day \ Presentation \ ASNA Analyst Day Presentation DRAFT V3.pptx 44 44 7.1% 3.8% 4.0% 3.2% 0.7% 1.1% (3.3%) (2.4%) (0.8%) (0.6%) (0.9%) 2.0% 4.0% 6.0% 8.0% FY13 Operating Margin Rate Total Justice Impact* FY13 Base (adjusted for Justice change) Comp Growth / Gross Margin Rate
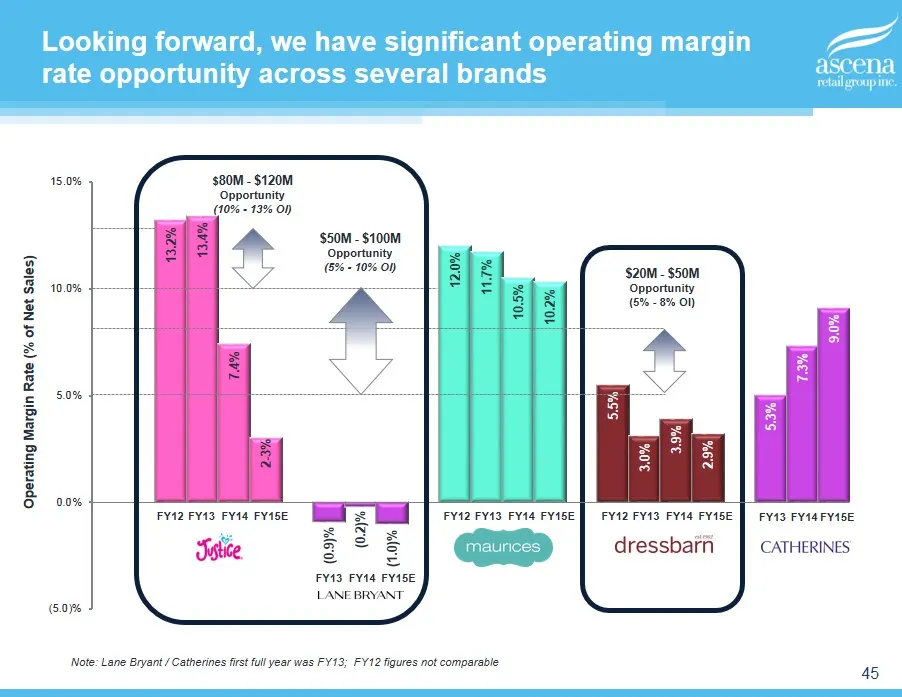
Slide 45: Significant operating margin rate opportunity across several brands
PRONGS2015 \ 7. Analyst Day \ Presentation \ ASNA Analyst Day Presentation DRAFT V3.pptx 45 45 13.2% 13.4% 7.4% 2 - 3% (0.9)% (0.2)% (1.0)% 12.0% 11.7% 10.5% 10.2% 5.5% 3.0% 3.9% 2.9% 5.3% 7.3% 9.0% (5.0)% 0.0% 5.0% 10.0% 15.0% FY12 FY13 FY14 FY15E FY13 FY14 FY15E FY12 FY13 FY14 FY15E FY12 FY13 FY14
Slide 46: Capital allocation
Pa ascena retail group ine. Capital allocation Slice = LANEBRYANT t maunces ] dressbaffi — CATHERINES
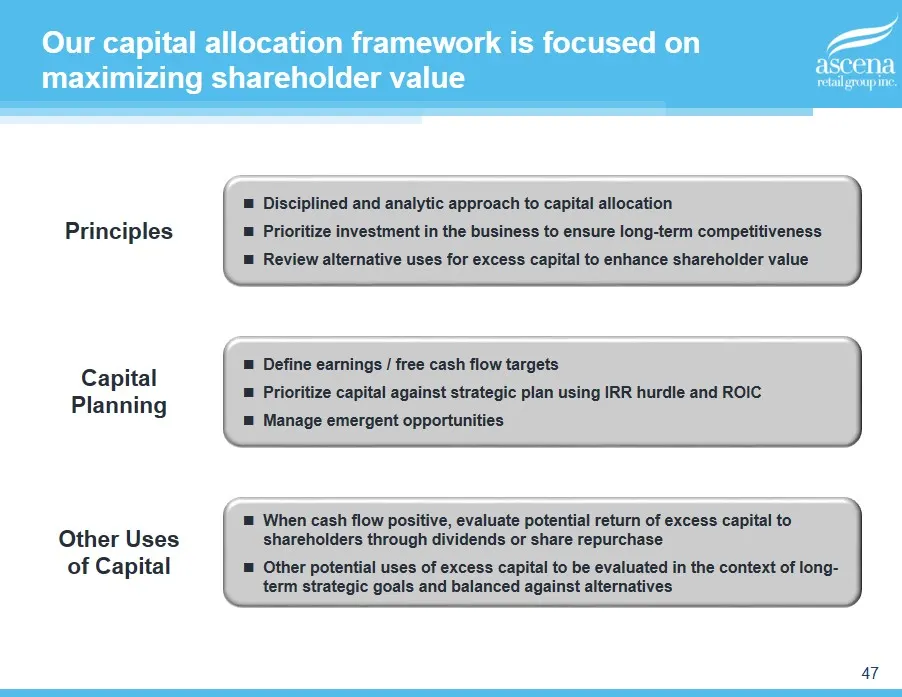
Slide 47: Capital allocation framework focused on maximizing shareholder value
PRONGS2015 \ 7. Analyst Day \ Presentation \ ASNA Analyst Day Presentation DRAFT V3.pptx 47 47 Our capital allocation framework is focused on maximizing shareholder value Disciplined and analytic approach to capital allocation Prioritize investment in the business to ensure long - term competitivene
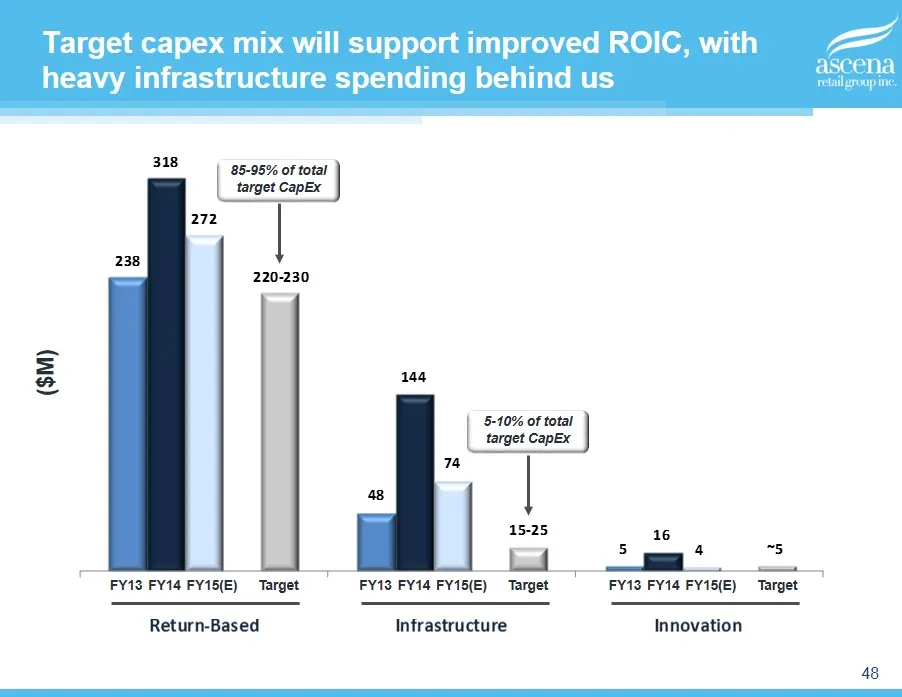
Slide 48: Target capex mix will support improved ROIC
PRONGS2015 \ 7. Analyst Day \ Presentation \ ASNA Analyst Day Presentation DRAFT V3.pptx 48 48 238 48 5 318 144 16 272 74 4 220 - 230 15 - 25 ~5 Return-Based Infrastructure Innovation 85 - 95% of total target CapEx Target capex mix will support improved ROIC, with heavy infrastructure spending behin
Slide 49: Reduced transformational capex supports significant free cash flow opportunity
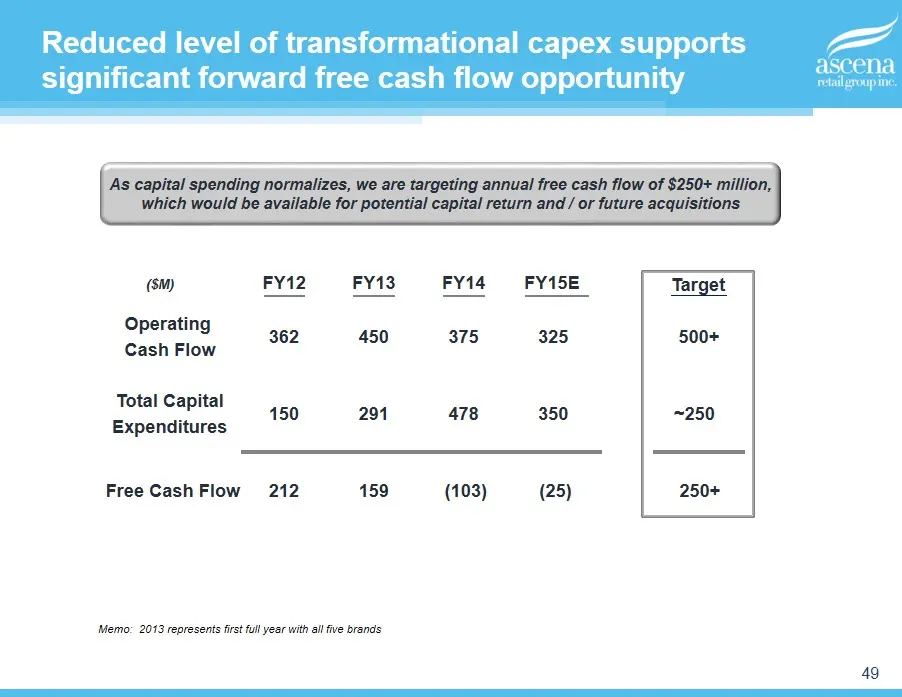
PRONGS2015 \ 7. Analyst Day \ Presentation \ ASNA Analyst Day Presentation DRAFT V3.pptx 49 49 Reduced level of transformational capex supports significant forward free cash flow opportunity As capital spending normalizes, we are targeting annual free cash flow of $ 250+ million, which would be avai
Slide 50: Key Takeaways
Pa ascena retail group ine. Key Takeaways Slice = LANEBRYANT t maunces ] dressbaffi — CATHERINES
Slide 51: Key takeaways
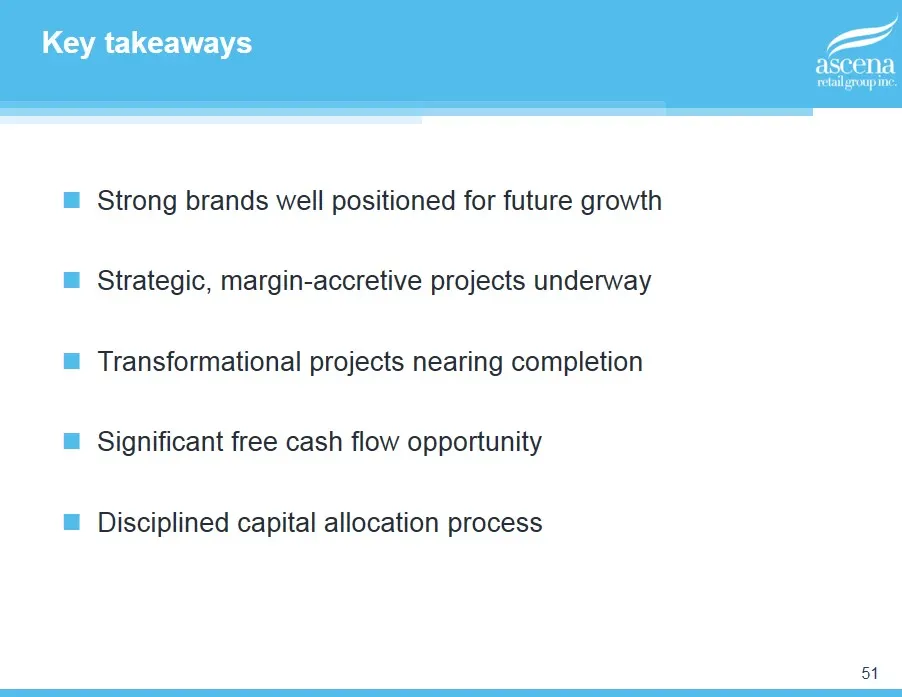
PRONGS2015 \ 7. Analyst Day \ Presentation \ ASNA Analyst Day Presentation DRAFT V3.pptx 51 51 Key takeaways Strong brands well positioned for future growth Strategic, margin - accretive projects underway Transformational projects nearing completion Significant free cash flow opportunity Disciplined

Slide 52: Supplemental Material - Justice private sale ('Ohio') test data
Supplemental Material – Justice private sale (‘Ohio’) test data
Slide 53: Justice stabilization plan - promotion strategy - 'Ohio' test summary
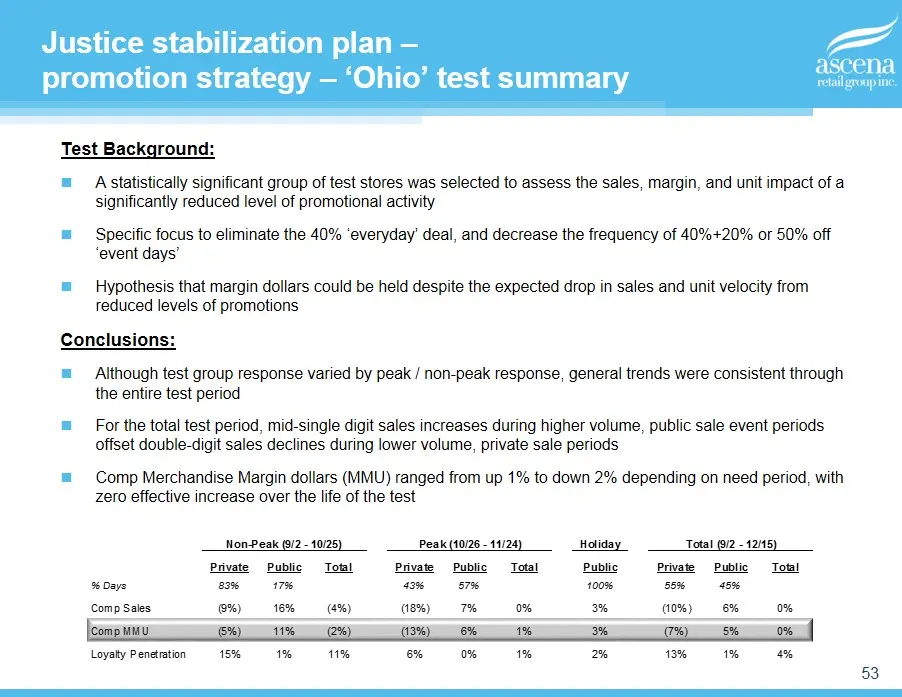
PRONGS2015 \ 7. Analyst Day \ Presentation \ ASNA Analyst Day Presentation DRAFT V3.pptx 53 53 Justice stabilization plan – promotion strategy – ‘Ohio’ test summary Test Background: A statistically significant group of test stores was selected to assess the sales, margin, and unit impact of a signif
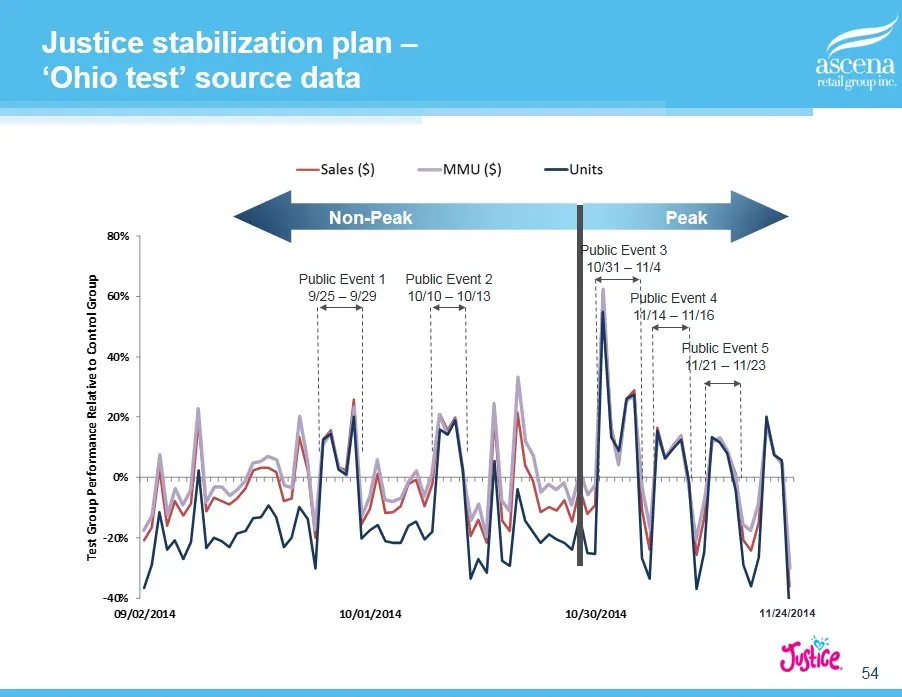
Slide 54: Justice stabilization plan - 'Ohio test' source data
PRONGS2015 \ 7. Analyst Day \ Presentation \ ASNA Analyst Day Presentation DRAFT V3.pptx 54 54 -40% -20% 0% 20% 40% 60% 80% 09/02/2014 10/01/2014 10/30/2014 Test Group Performance Relative to Control Group Sales ($) MMU ($) Units Justice stabilization plan – ‘Ohio test’ source data Public Event 1 9/
Source: SEC EDGAR · 8-K filed Feb 11, 2015
More decks from Ascena Retail Group Inc
 Q2 FY2020 Earnings Presentation9 slides · Mar 9, 2020
 Q1 FY2020 Earnings Presentation9 slides · Dec 9, 2019
 Q4 FY2019 Earnings Presentation9 slides · Oct 3, 2019
 Earnings Presentation (June 2019)5 slides · Jun 10, 2019
 Q3 2019 Earnings Presentation11 slides · Jun 10, 2019
 Q2 FY2019 Earnings Presentation12 slides · Mar 14, 2019