HCC Insurance — Investor Presentation (December 2009)
37 slides from HCC Insurance's investor presentation, Dec 7, 2009
Slide 1: Third Quarter 2009 Investor Presentation
Third Quarter 2009 Investor Presentation
Slide 2: Notice About This Presentation
Notice About This Presentation ABOUT FORWARD-LOOKING STATEMENTS: This presentation contains certain "forward-looking statements" within the meaning of Section 27A of the Securities Act of 1933 and Section 21E of the Securities Exchange Act of 1934, which are intended to be covered by the safe harbor
Slide 3: HCC Overview
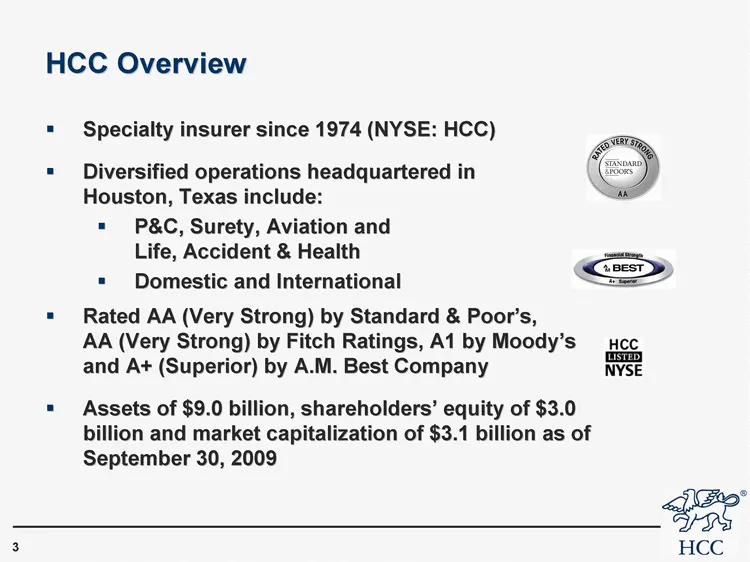
HCC Overview Specialty insurer since 1974 (NYSE: HCC) Diversified operations headquartered in Houston, Texas include: P&C, Surety, Aviation and Life, Accident & Health Domestic and International Rated AA (Very Strong) by Standard & Poor's, AA (Very Strong) by Fitch Ratings, A1 by Moody's and A+ (Sup
Slide 4: Lines of Business
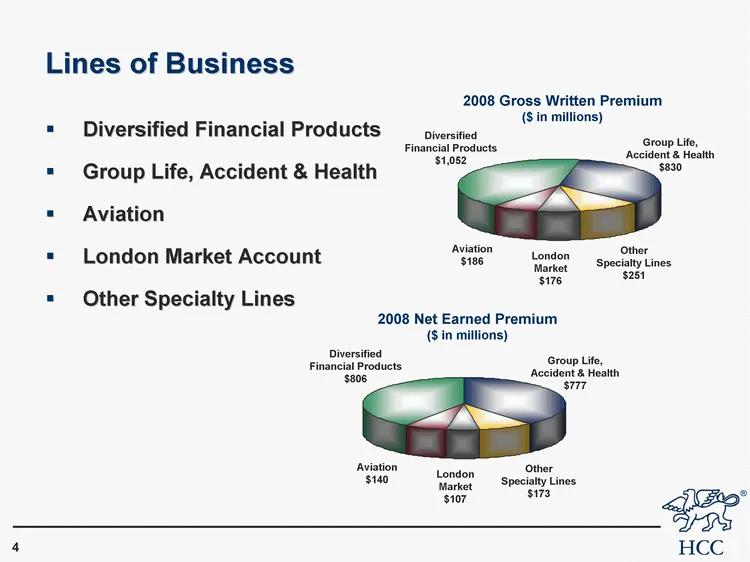
DFP Life A&H Other Spec Lon. Market Aviation 12/31/2008 806 777 173 107 140 Lines of Business Diversified Financial Products Group Life, Accident & Health Aviation London Market Account Other Specialty Lines DFP Life A&H Other Spec Lon. Market Aviation 12/31/2008 1052 830 251 176 186 Group Life, Acc
Slide 5: Lines of Business Overview
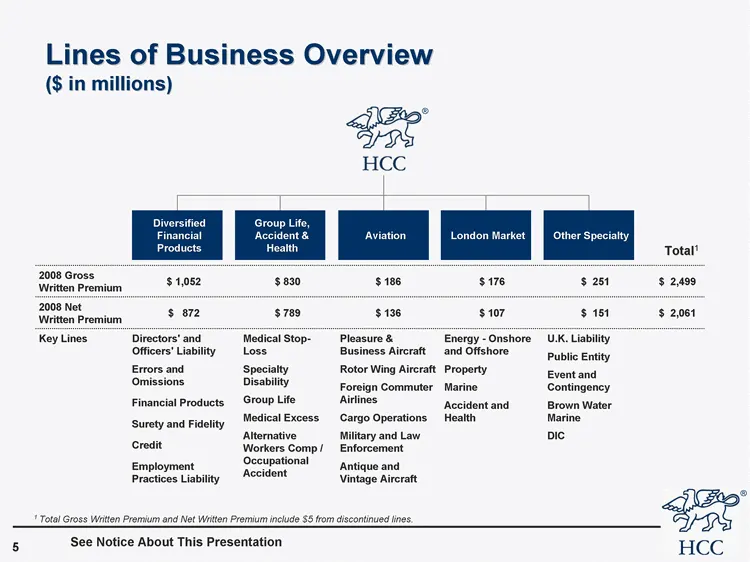
Lines of Business Overview ($ in millions) Total1 2008 Gross Written Premium $ 1,052 $ 830 $ 186 $ 176 $ 251 $ 2,499 2008 Net Written Premium $ 872 $ 789 $ 136 $ 107 $ 151 $ 2,061 Key Lines Directors' and Officers' Liability Errors and Omissions Financial Products Surety and Fidelity Credit Employme
Slide 6: Lines of Business Comparison
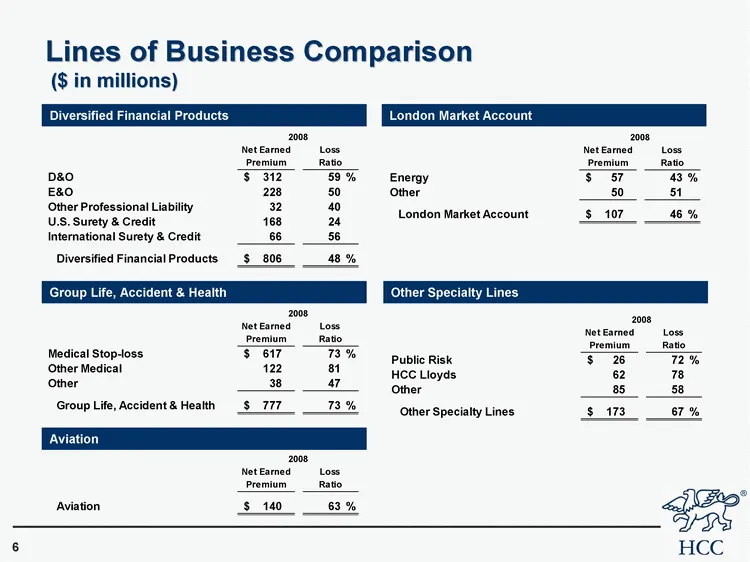
Lines of Business Comparison ($ in millions) Diversified Financial Products Group Life, Accident & Health Aviation London Market Account Other Specialty Lines
Slide 7: Historical Performance
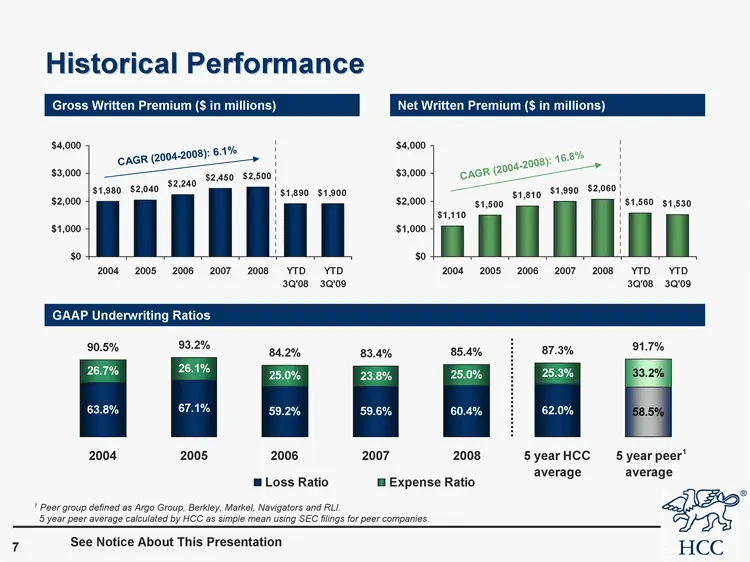
Historical Performance See Notice About This Presentation Gross Written Premium ($ in millions) 2004 2005 2006 2007 2008 5 year HCC average 5 year peer average Loss Ratio 0.638 0.671 0.592 0.596 0.604 0.62 0.585 Expense Ratio 0.267 0.261 0.25 0.238 0.25 0.253 0.332 Total 0.905 0.932 0.842 0.834 0.85
Slide 8: 2009 Underwriting Performance
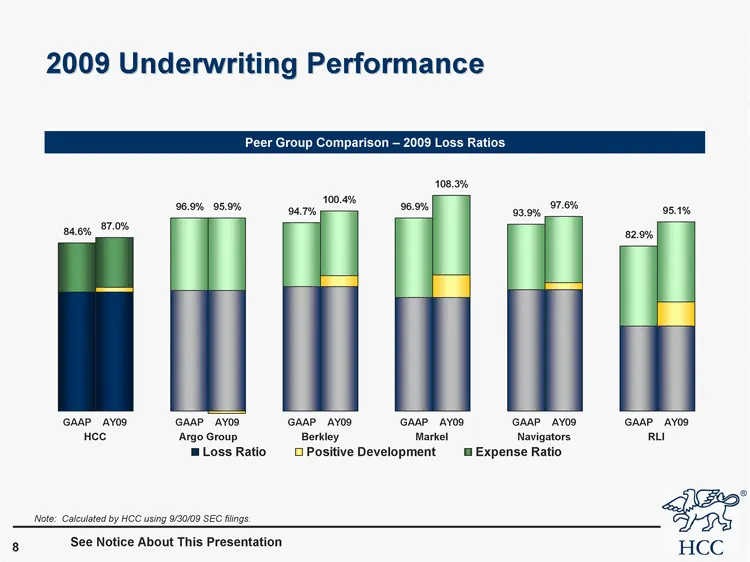
2009 Underwriting Performance GAAP AY09 GAAP AY09 GAAP AY09 GAAP AY09 GAAP AY09 GAAP AY09 Loss Ratio 0.598 0.598 0.607 0.607 0.624 0.624 0.571 0.571 0.61 0.61 0.425 0.425 Positive Development 0.024 -0.01 0.057 0.114 0.037 0.122 Expense Ratio 0.248 0.248 0 0.362 0.362 0 0.323 0.323 0 0.398 0.398 0 0.
Slide 9: Strong, Predictable Return on Equity
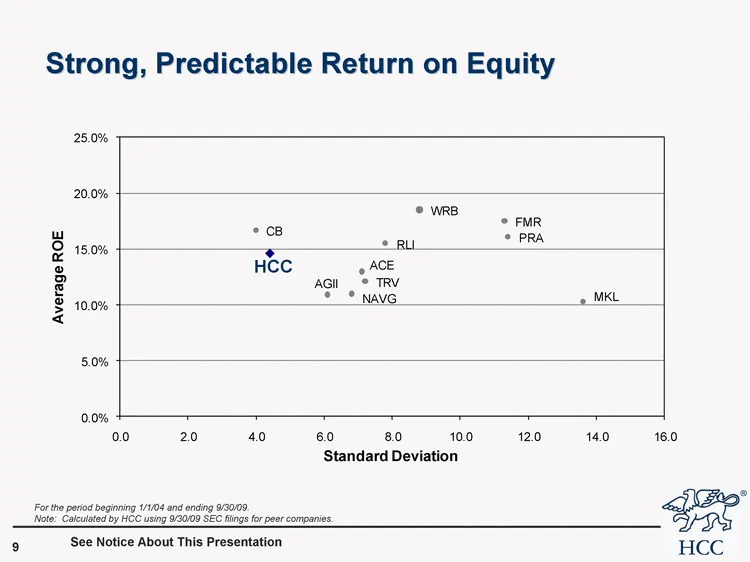
Strong, Predictable Return on Equity For the period beginning 1/1/04 and ending 9/30/09. Note: Calculated by HCC using 9/30/09 SEC filings for peer companies. See Notice About This Presentation
Slide 10: Strong BVPS Growth
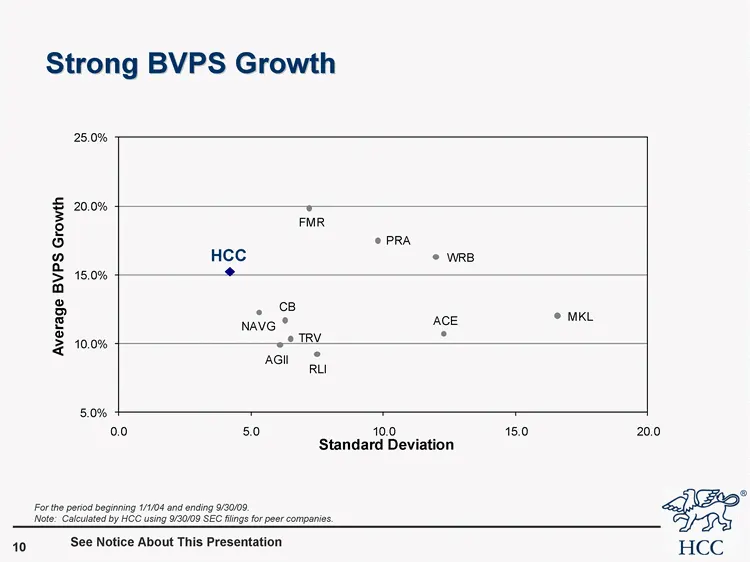
Strong BVPS Growth See Notice About This Presentation For the period beginning 1/1/04 and ending 9/30/09. Note: Calculated by HCC using 9/30/09 SEC filings for peer companies.
Slide 11: Growth in Shareholders' Equity and BVPS
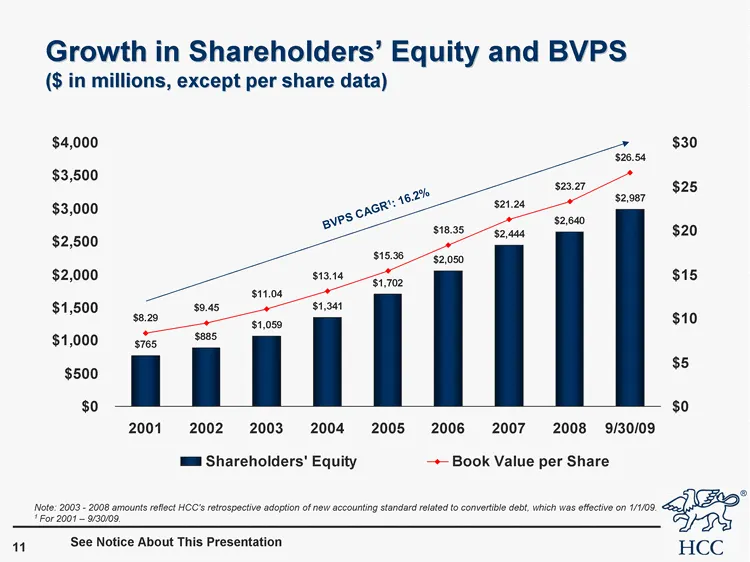
1998 1999 2000 2001 2002 2003 2004 2005 2006 2007 2008 9/30/2009 Shareholders' Equity 440430000 458439000 530930000 765.347 884.671 1059.135 1341.274 1702.015 2050.009 2443.695 2640.023 2987 Book Value per Share 8.29 9.45 11.04 13.14 15.36 18.35 21.24 23.27 26.54 Growth in Shareholders' Equity and B
Slide 12: Characteristics That Make HCC Unique
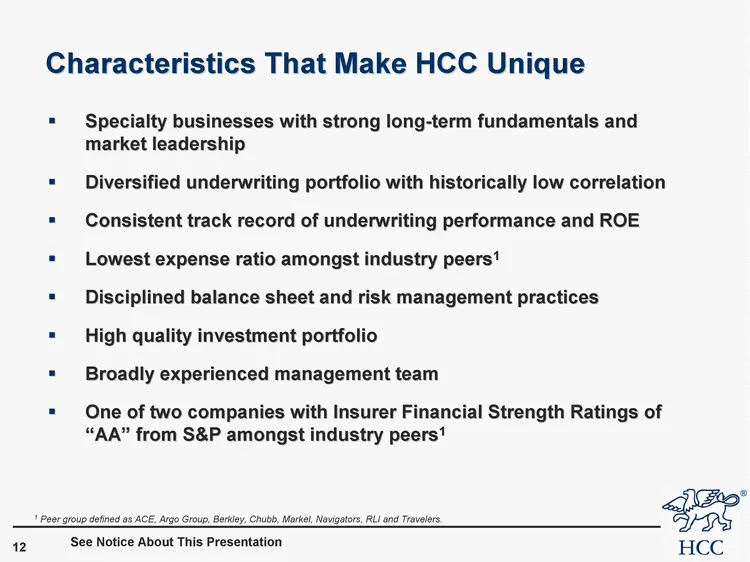
Characteristics That Make HCC Unique Specialty businesses with strong long-term fundamentals and market leadership Diversified underwriting portfolio with historically low correlation Consistent track record of underwriting performance and ROE Lowest expense ratio amongst industry peers1 Disciplined
Slide 13: HCC Underwriters Compensation Example
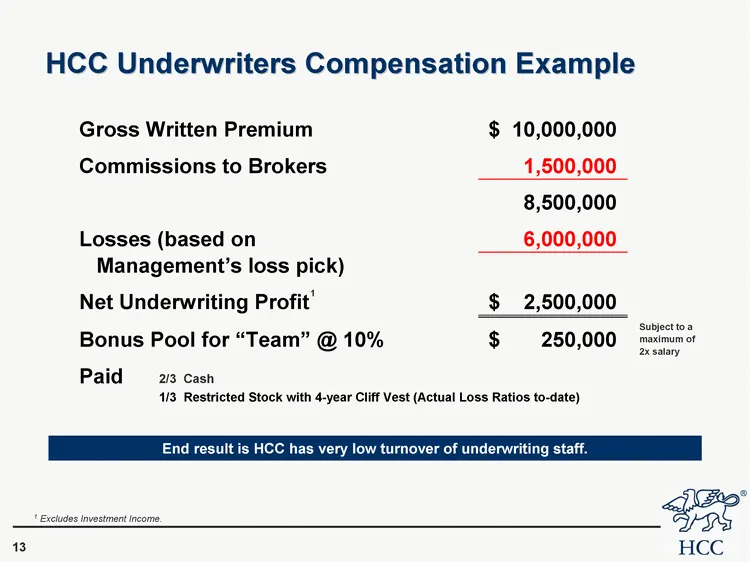
HCC Underwriters Compensation Example 1 Excludes Investment Income. End result is HCC has very low turnover of underwriting staff. 1
Slide 14: A Diverse Collection of Profitable Businesses
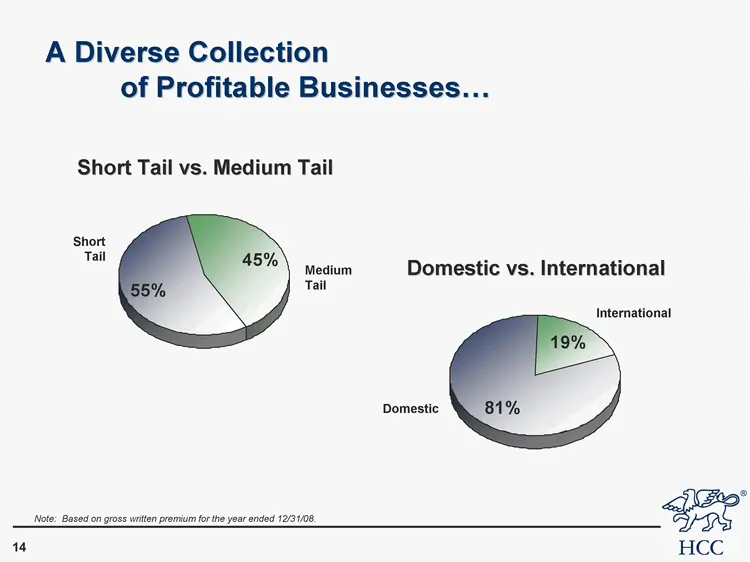
A Diverse Collection of Profitable Businesses... Short Medium 4th Qtr East 0.55 0.45 20.4 Short Tail vs. Medium Tail Short Tail Medium Tail Domestgic International East 0.81 0.19 Domestic vs. International International Domestic Note: Based on gross written premium for the year ended 12/31/08.
Slide 15: Effective Catastrophe Management
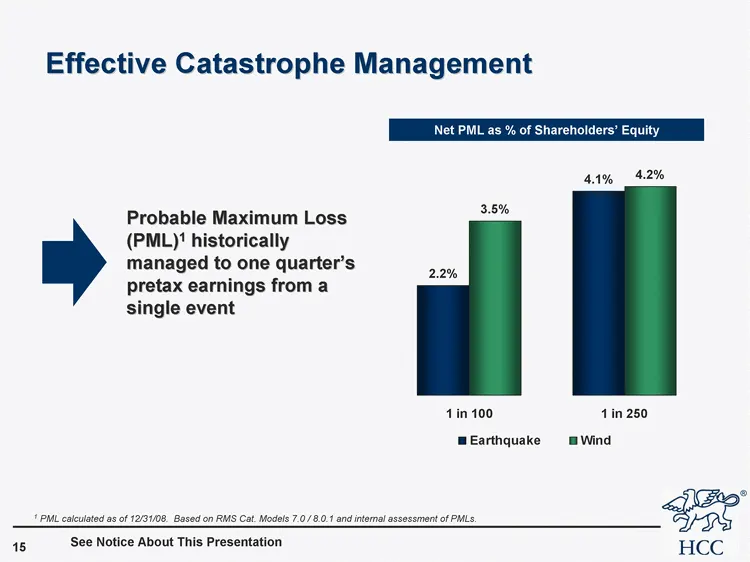
Effective Catastrophe Management 1 in 100 1 in 250 Earthquake 0.022 0.041 Wind 0.035 0.042 Probable Maximum Loss (PML)1 historically managed to one quarter's pretax earnings from a single event See Notice About This Presentation 1 PML calculated as of 12/31/08. Based on RMS Cat. Models 7.0 / 8.0.1 a
Slide 16: Investment Portfolio September 30, 2009
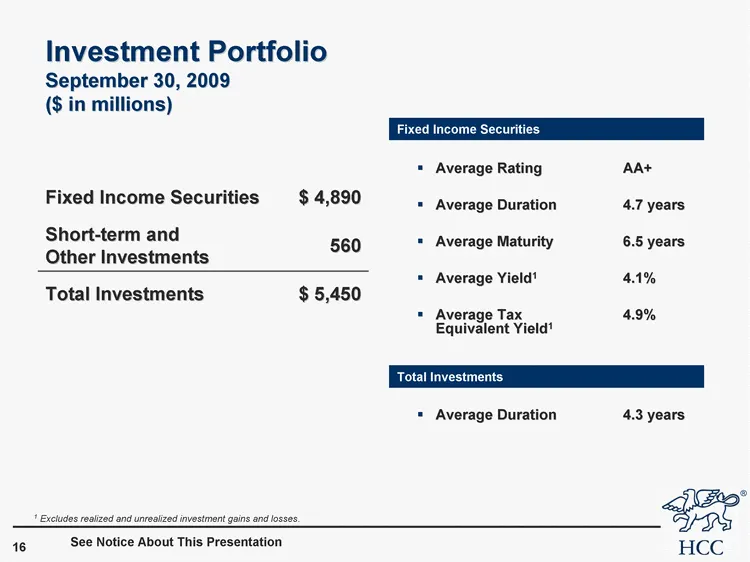
Average Rating AA+ Average Duration 4.7 years Average Maturity 6.5 years Average Yield1 4.1% Average Tax 4.9% Equivalent Yield1 Average Duration 4.3 years Fixed Income Securities $ 4,890 Short-term and Other Investments 560 Total Investments $ 5,450 Investment Portfolio September 30, 2009 ($ in mill
Slide 17: Investment Portfolio September 30, 2009
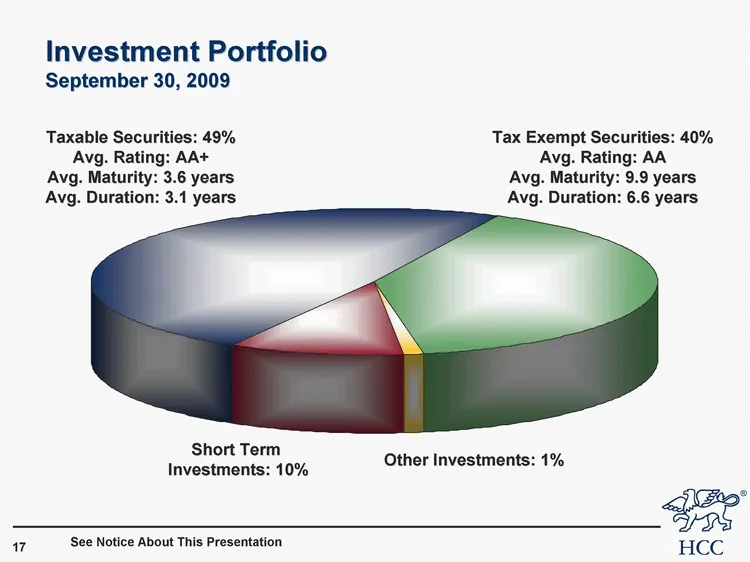
Taxable Securities Tax Exempt Securities Other Cash Short Term Investments 6/30/2007 49 40 1 1.1 10 See Notice About This Presentation Short Term Investments: 10% Tax Exempt Securities: 40% Avg. Rating: AA Avg. Maturity: 9.9 years Avg. Duration: 6.6 years Taxable Securities: 49% Avg. Rating: AA+ Avg
Slide 18: Investment Analysis
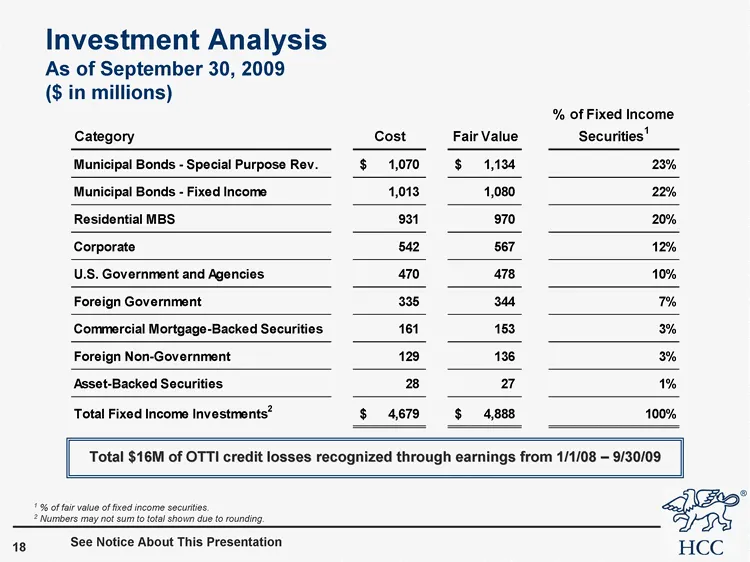
See Notice About This Presentation Investment Analysis As of September 30, 2009 ($ in millions) 1 % of fair value of fixed income securities. 2 Numbers may not sum to total shown due to rounding. Total $16M of OTTI credit losses recognized through earnings from 1/1/08 - 9/30/09
Slide 19: HCC's Investment Portfolio Losses vs. Peers
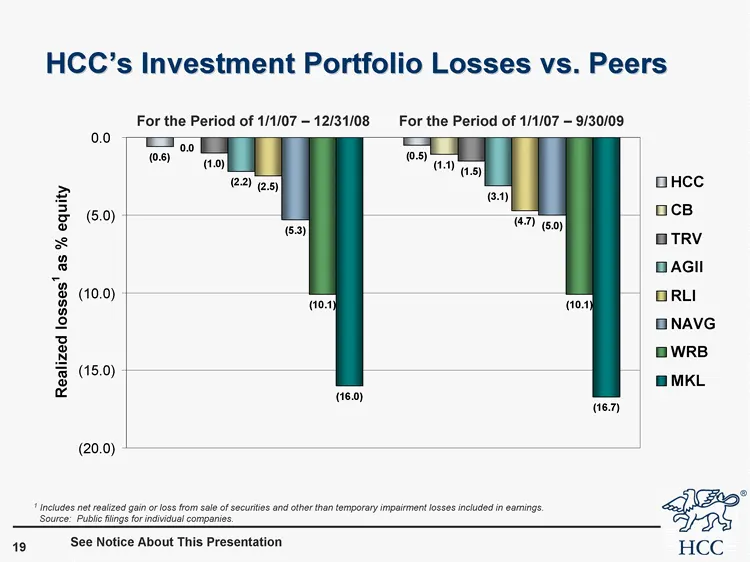
1 Includes net realized gain or loss from sale of securities and other than temporary impairment losses included in earnings. Source: Public filings for individual companies. HCC's Investment Portfolio Losses vs. Peers See Notice About This Presentation For the Period of 1/1/07 - 12/31/08 For the Pe
Slide 20: HCC Surpasses Peers in Value Creation
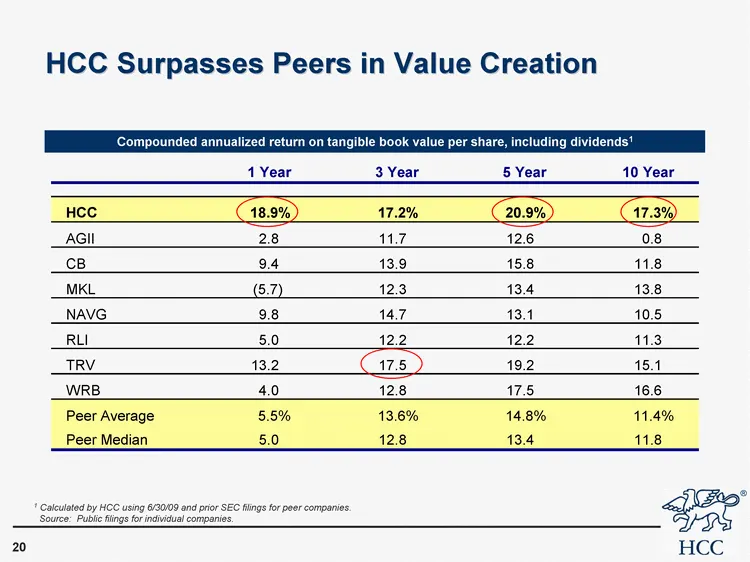
HCC Surpasses Peers in Value Creation 1 Calculated by HCC using 6/30/09 and prior SEC filings for peer companies. Source: Public filings for individual companies. Compounded annualized return on tangible book value per share, including dividends1 Compounded annualized return on tangible book value p
Slide 21: HCC is Well Positioned to Pursue New Opportunities
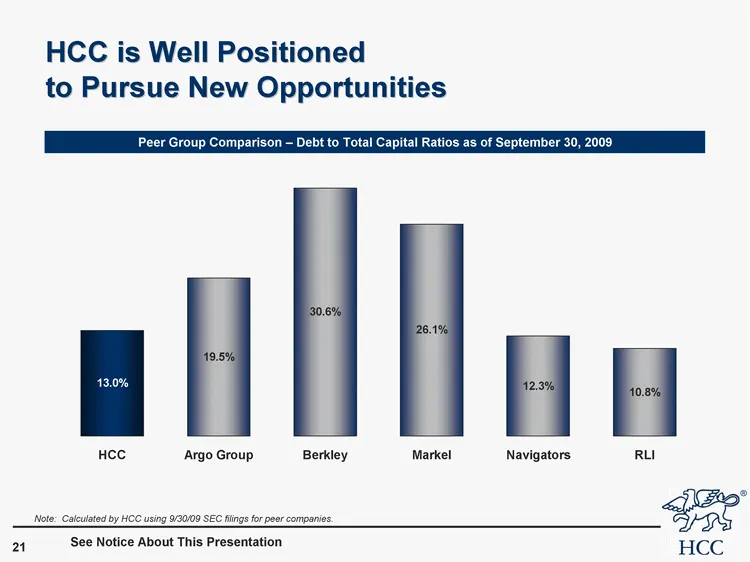
HCC Argo Group Berkley Markel Navigators RLI Debt to Equity 0.13 0.195 0.306 0.261 0.123 0.108 HCC is Well Positioned to Pursue New Opportunities Peer Group Comparison - Debt to Total Capital Ratios as of September 30, 2009 See Notice About This Presentation Note: Calculated by HCC using 9/30/09 SEC
Slide 22: Coupons on Recent Senior Debt Issuances Relative to Market Capitalization
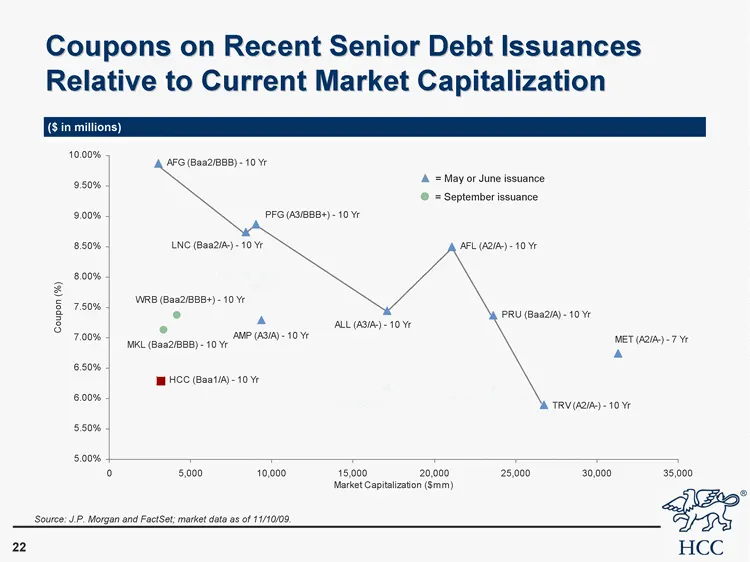
Coupons on Recent Senior Debt Issuances Relative to Current Market Capitalization Source: J.P. Morgan and FactSet; market data as of 11/10/09. ($ in millions) Market cap Coupon Series 2 Labels (not for graphing) Series 3 Series 4 Series 5 Series 6 Series 7 Series 8 Series 9 Series 10 Series 11 Serie
Slide 23: Favorable Reserve Development
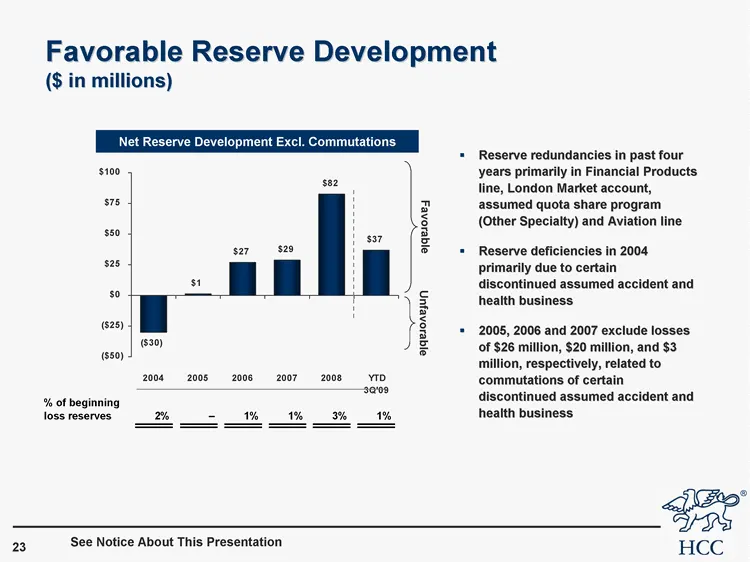
Favorable Reserve Development ($ in millions) 2003 2004 2005 2006 2007 2008 YTD 3Q'09 Cumulative redundancy (deficiency) -123.2 -30 1 27 29 82.4 37 Net Reserve Development Excl. Commutations Reserve redundancies in past four years primarily in Financial Products line, London Market account, assumed
Slide 24: Quality Reinsurance Security
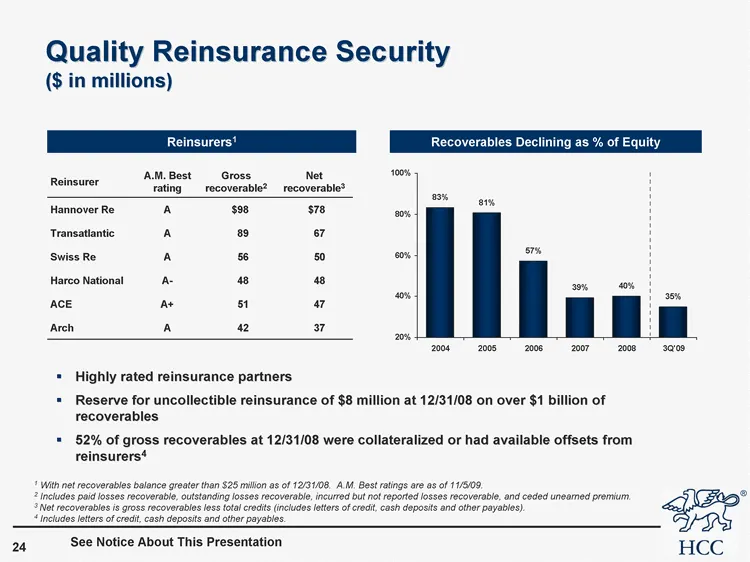
Quality Reinsurance Security ($ in millions) Reinsurers1 Reinsurer A.M. Best rating Gross recoverable2 Gross recoverable2 Net recoverable3 Net recoverable3 Hannover Re A $98 $78 $78 Transatlantic A 89 67 67 Swiss Re A 56 50 50 Harco National A- 48 48 48 ACE A+ 51 47 47 Arch A 42 37 37 1 With net rec
Slide 25: Summary of Strengths
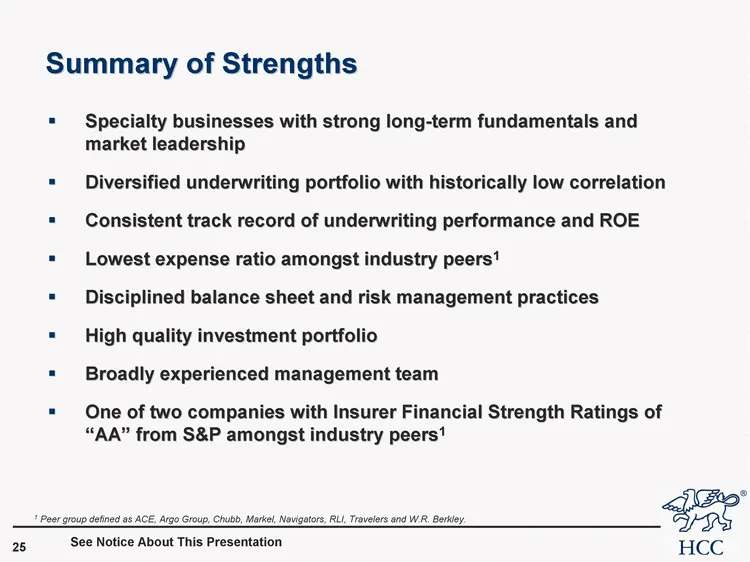
Summary of Strengths Specialty businesses with strong long-term fundamentals and market leadership Diversified underwriting portfolio with historically low correlation Consistent track record of underwriting performance and ROE Lowest expense ratio amongst industry peers1 Disciplined balance sheet a
Slide 26: Appendix
Appendix HCC
Slide 27: Financial Highlights
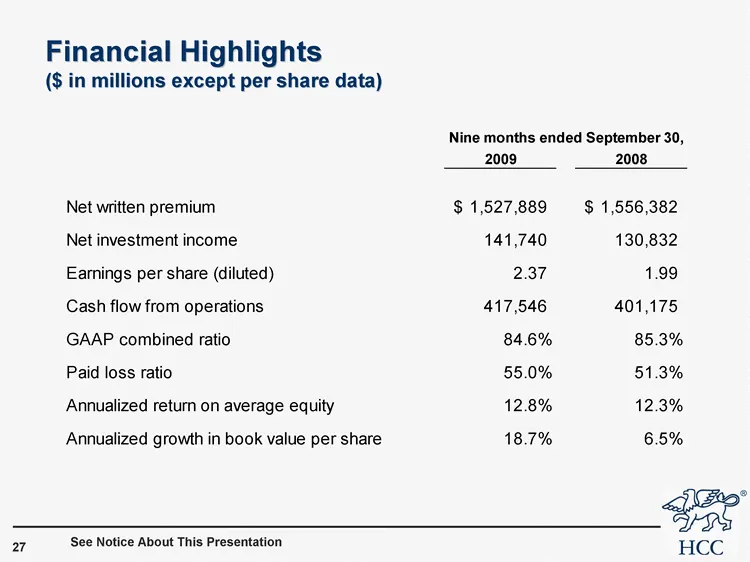
Financial Highlights ($ in millions except per share data) See Notice About This Presentation
Slide 28: Total Investments
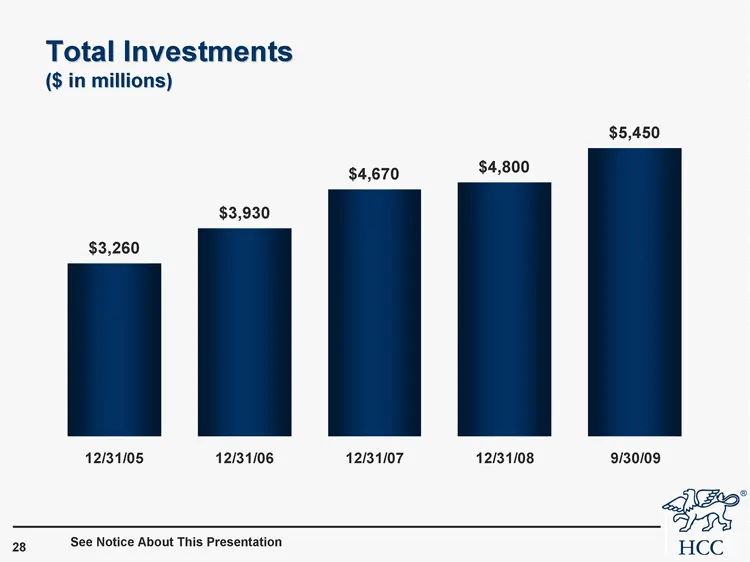
Total Investments ($ in millions) 2003 2004 38717 12/31/2006 12/31/2007 12/31/2008 9/30/2009 Investment Assets 1710 2470 3260 3930 4670 4800 5450 See Notice About This Presentation
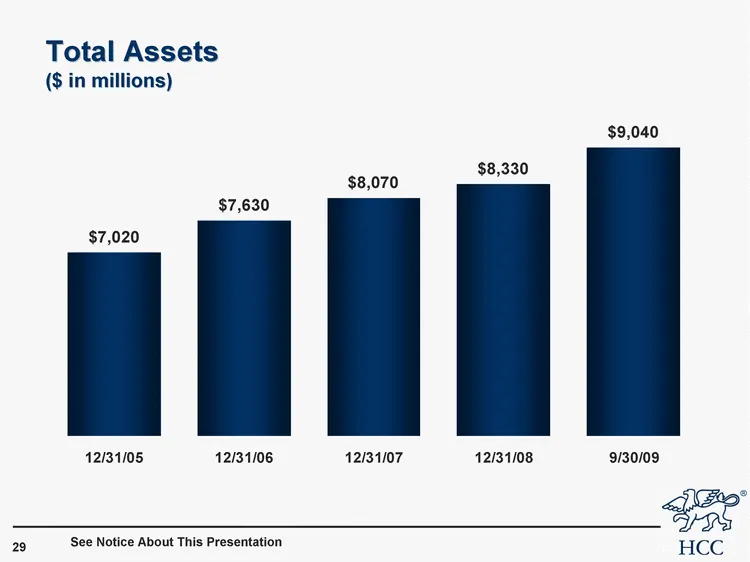
Slide 29: Total Assets
Total Assets ($ in millions) 2003 2004 38717 12/31/2006 12/31/2007 12/31/2008 9/30/2009 Total Assets 4900 5900 7020 7630 8070 8330 9040 See Notice About This Presentation
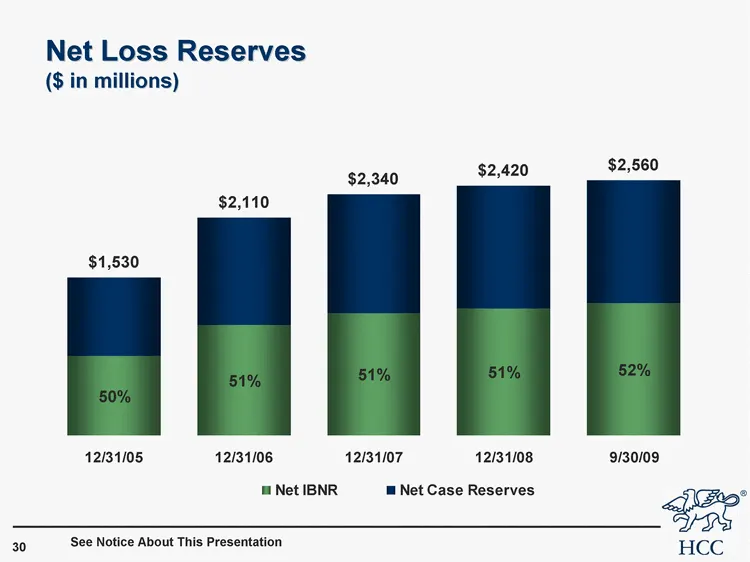
Slide 30: Net Loss Reserves
Net Loss Reserves ($ in millions) 2003 2004 12/31/05 12/31/2006 12/31/2007 12/31/2008 9/30/2009 Net IBNR 516 768 1073 1187 1230 1284 See Notice About This Presentation
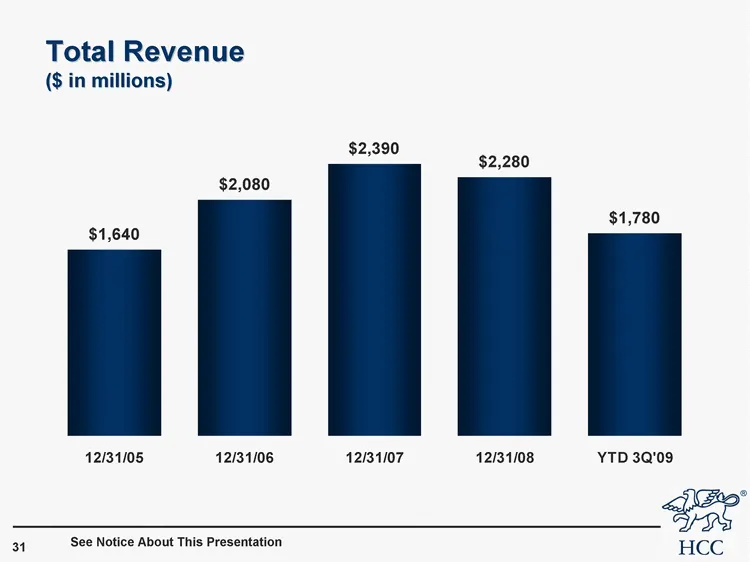
Slide 31: Total Revenue
Total Revenue ($ in millions) 2003 2004 12/31/05 12/31/2006 12/31/2007 12/31/2008 YTD 3Q'09 Total Revenur 940 1280 1640 2080 2390 2280 1780 See Notice About This Presentation
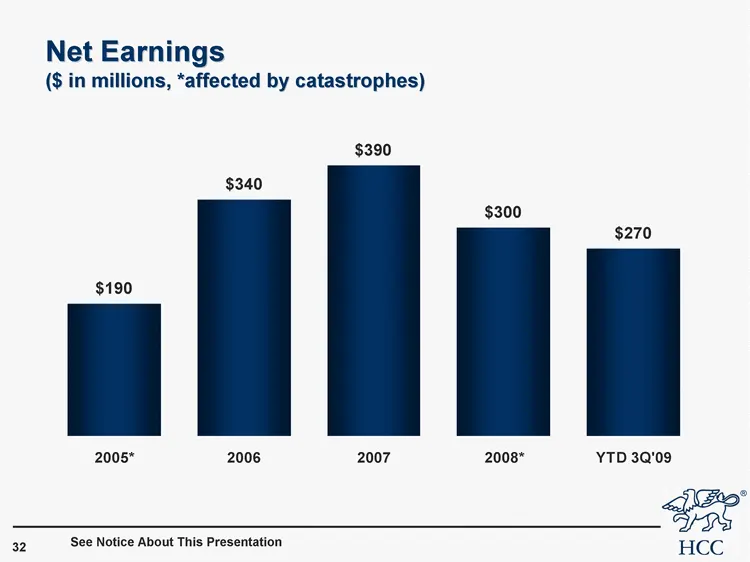
Slide 32: Net Earnings
Net Earnings ($ in millions, *affected by catastrophes) 2003 2004* 2005* 2006 2007 2008* YTD 3Q'09 Net Earnings 142 163 190 340 390 300 270 See Notice About This Presentation
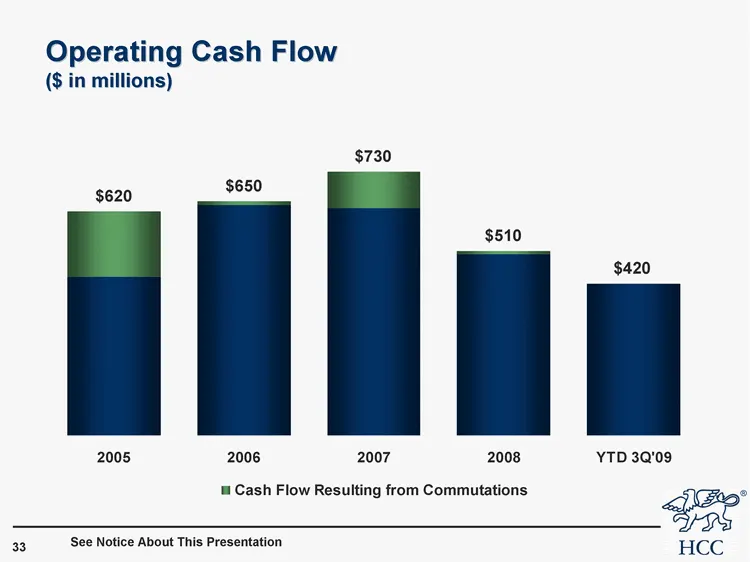
Slide 33: Operating Cash Flow
Operating Cash Flow ($ in millions) 2003 2004 2005 2006 2007 2008 YTD 3Q'09 $420 See Notice About This Presentation
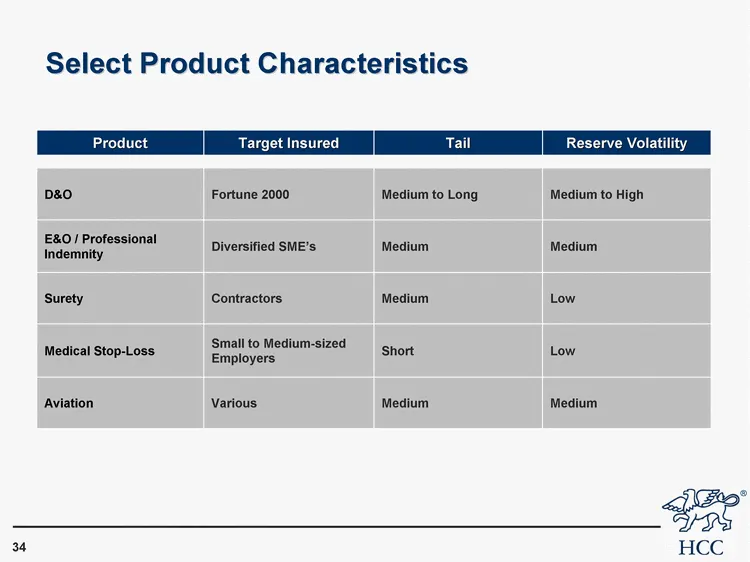
Slide 34: Select Product Characteristics
Select Product Characteristics Product Target Insured Tail Reserve Volatility D&O Fortune 2000 Medium to Long Medium to High E&O / Professional Indemnity Diversified SME's Medium Medium Surety Contractors Medium Low Medical Stop-Loss Small to Medium-sized Employers Short Low Aviation Various Medium
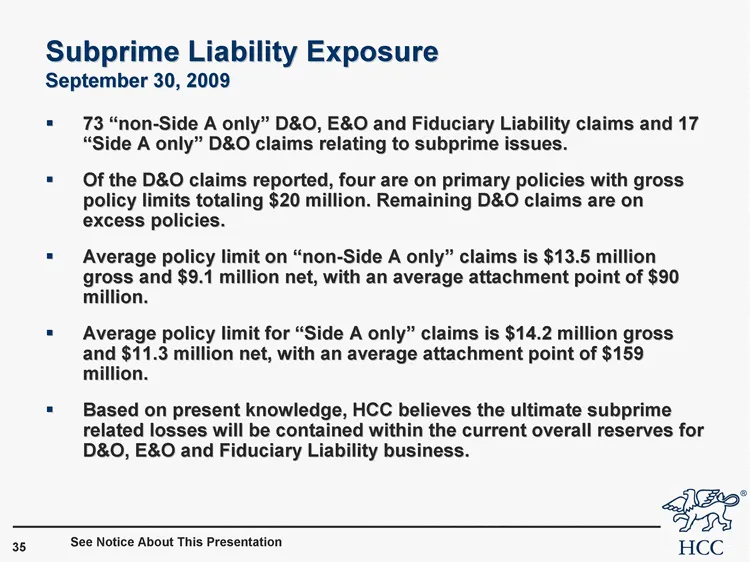
Slide 35: Subprime Liability Exposure
Subprime Liability Exposure September 30, 2009 73 "non-Side A only" D&O, E&O and Fiduciary Liability claims and 17 "Side A only" D&O claims relating to subprime issues. Of the D&O claims reported, four are on primary policies with gross policy limits totaling $20 million. Remaining D&O claims are on
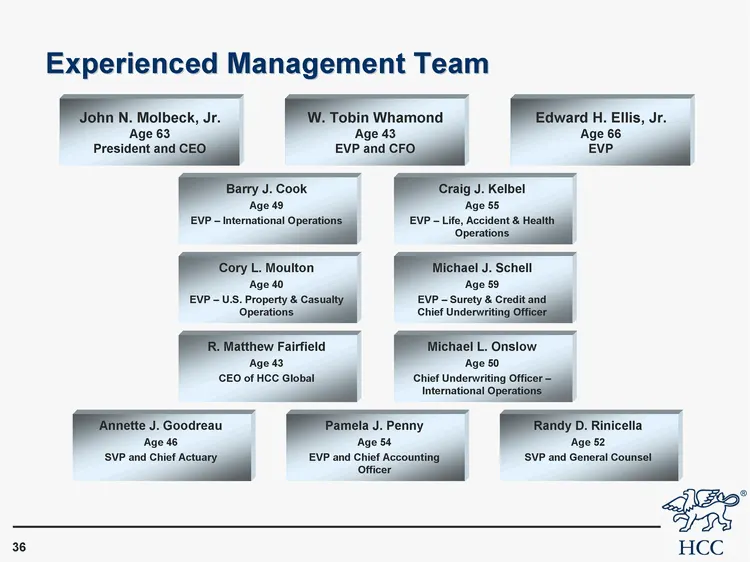
Slide 36: Experienced Management Team
Experienced Management Team Pamela J. Penny Age 54 EVP and Chief Accounting Officer Randy D. Rinicella Age 52 SVP and General Counsel Barry J. Cook Age 49 EVP - International Operations Michael J. Schell Age 59 EVP - Surety & Credit and Chief Underwriting Officer Cory L. Moulton Age 40 EVP - U.S. Pr
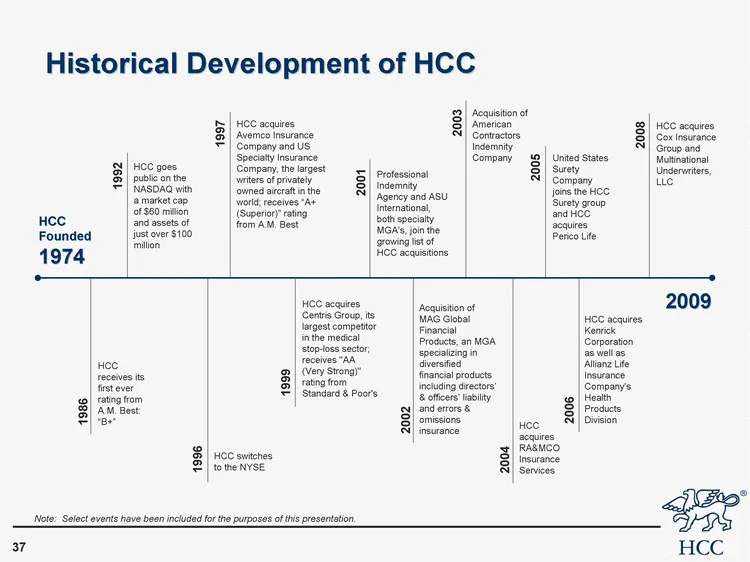
Slide 37: Historical Development of HCC
Historical Development of HCC HCC Founded 1974 2009 HCC receives its first ever rating from A.M. Best: "B+" HCC goes public on the NASDAQ with a market cap of $60 million and assets of just over $100 million HCC switches to the NYSE HCC acquires Avemco Insurance Company and US Specialty Insurance Co
Source: SEC EDGAR · 8-K filed Dec 7, 2009
More decks from HCC Insurance Holdings Inc
 Q2 2015 Earnings Presentation31 slides · Aug 14, 2015
 Merger or Acquisition (June 2015)22 slides · Jun 23, 2015
 Merger or Acquisition (June 2015)10 slides · Jun 10, 2015
 Merger or Acquisition (June 2015)30 slides · Jun 10, 2015
 Q1 2015 Earnings Presentation35 slides · May 21, 2015
 36th Annual Raymond James Institutional Investors Conference (February 2015)36 slides · Feb 27, 2015