Comerica — Comerica Inc /New/ — Goldman Sachs US Financial Services Conference 2017
15 slides from Comerica's conference presentation, Dec 4, 2017
Slide 1: Goldman Sachs US Financial Services Conference
Comerica Incorporated Goldman Sachs US Financial Services Conference December 5, 2017 David Duprey Executive Vice President & Chief Financial Officer Ralph W. Babb, Jr. Chairman & Chief Executive Officer Muneera Carr Executive Vice President & Chief Accounting Officer Pete Guilfoile Executive Vice P
Slide 2: Focused on Enhancing Shareholder Value
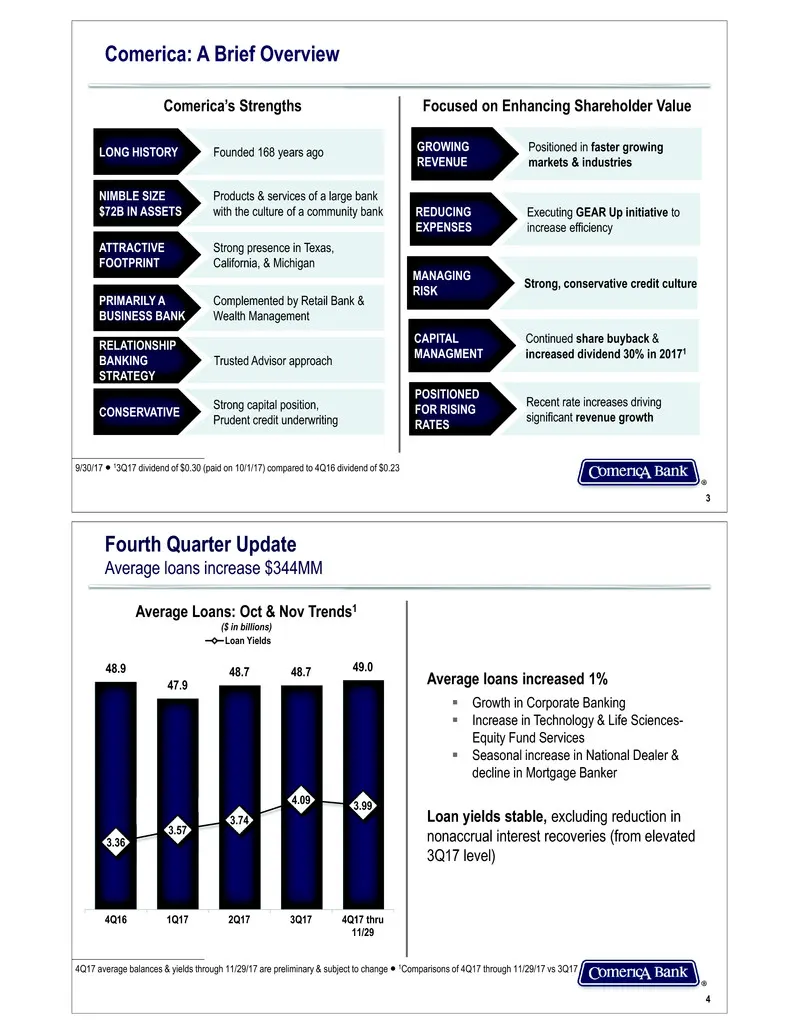
Focused on Enhancing Shareholder Value 9/30/17 ? 13Q17 dividend of $0.30 (paid on 10/1/17) compared to 4Q16 dividend of $0.23 Comerica: A Brief Overview GROWING REVENUE Positioned in faster growing markets & industries REDUCING EXPENSES Executing GEAR Up initiative to increase efficiency MANAGING RI
Slide 3: Diverse Footprint & Business Mix
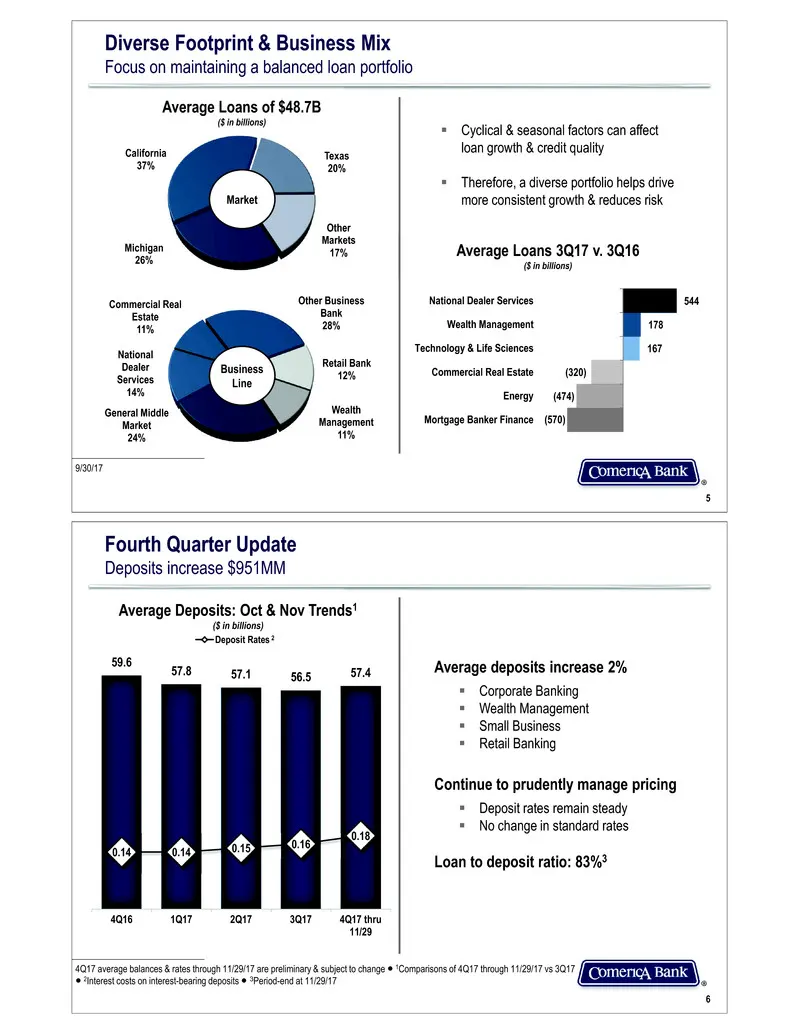
Diverse Footprint & Business Mix Focus on maintaining a balanced loan portfolio Average Loans of $48.7B ($ in billions) Michigan 26% California 37% Texas 20% Other Markets 17% Market General Middle Market 24% National Dealer Services 14% Commercial Real Estate 11% Other Business Bank 28% Retail Bank
Slide 4: Diverse Footprint & Business Mix: Relationship Deposits
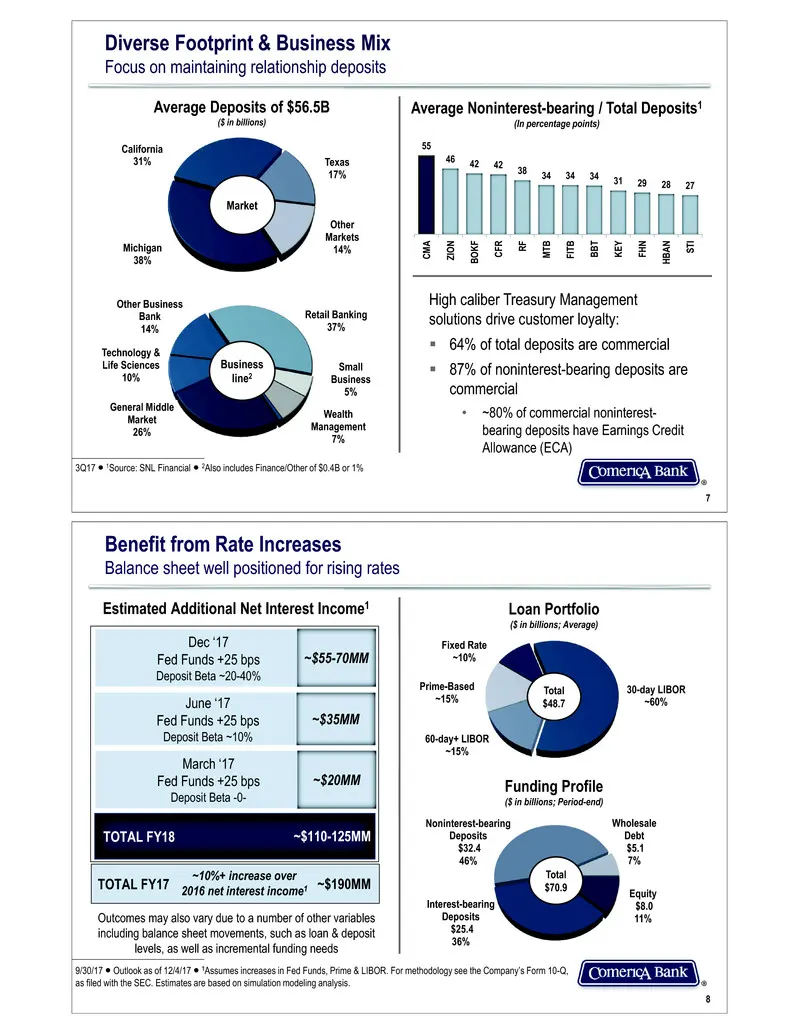
Diverse Footprint & Business Mix Focus on maintaining relationship deposits 55 46 42 42 38 34 34 34 31 29 28 27 CM A ZI O N BO KF CF R RF M TB FI TB BB T KE Y FH N HB AN ST I Average Noninterest-bearing / Total Deposits1 (In percentage points) 3Q17 ? 1Source: SNL Financial ? 2Also includes Finance/O
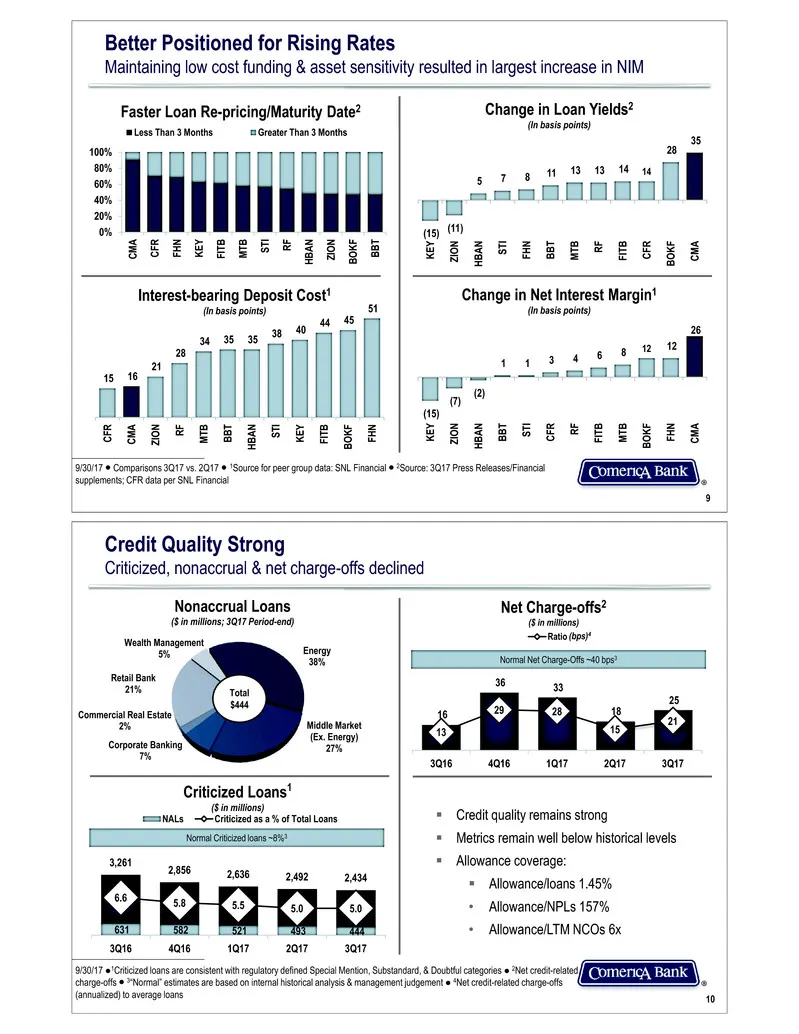
Slide 5: Better Positioned for Rising Rates
Change in Net Interest Margin1 (In basis points) Better Positioned for Rising Rates Maintaining low cost funding & asset sensitivity resulted in largest increase in NIM 9/30/17 ? Comparisons 3Q17 vs. 2Q17 ? 1Source for peer group data: SNL Financial ? 2Source: 3Q17 Press Releases/Financial supplemen
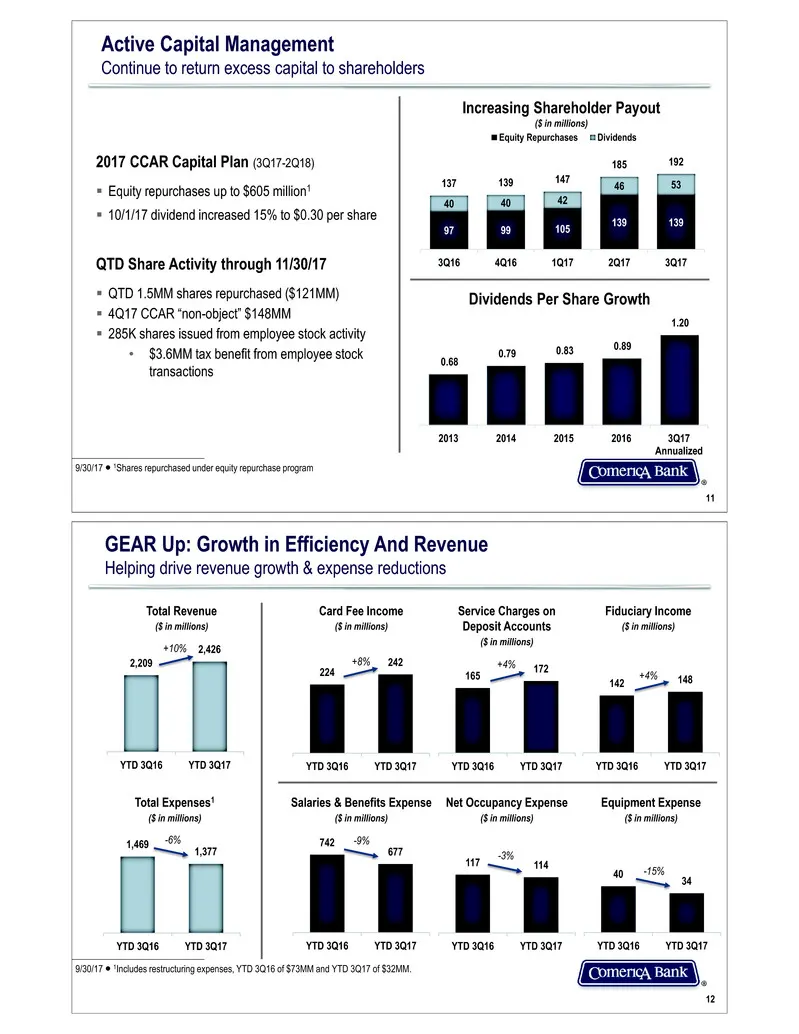
Slide 6: Active Capital Management
97 99 105 139 139 40 40 42 46 53137 139 147 185 192 3Q16 4Q16 1Q17 2Q17 3Q17 Equity Repurchases Dividends 9/30/17 ? 1Shares repurchased under equity repurchase program Active Capital Management Continue to return excess capital to shareholders 2017 CCAR Capital Plan (3Q17-2Q18) ? Equity repurchases
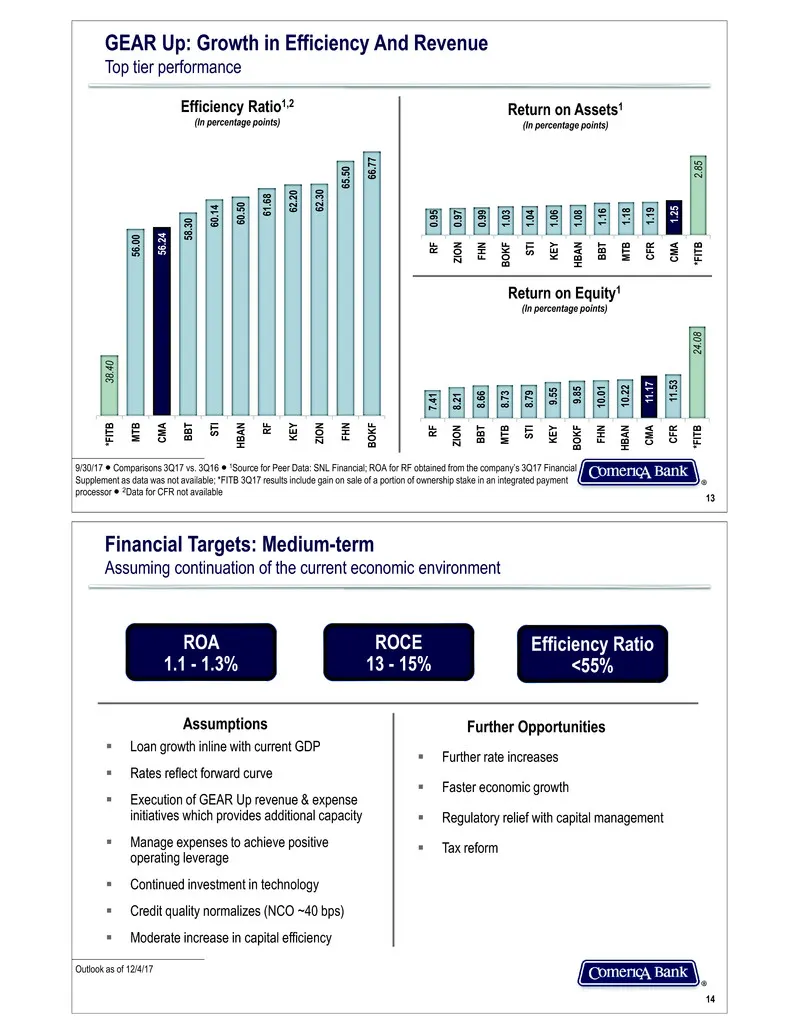
Slide 7: GEAR Up: Top Tier Performance
9/30/17 ? Comparisons 3Q17 vs. 3Q16 ? 1Source for Peer Data: SNL Financial; ROA for RF obtained from the company’s 3Q17 Financial Supplement as data was not available; *FITB 3Q17 results include gain on sale of a portion of ownership stake in an integrated payment processor ? 2Data for CFR not avail
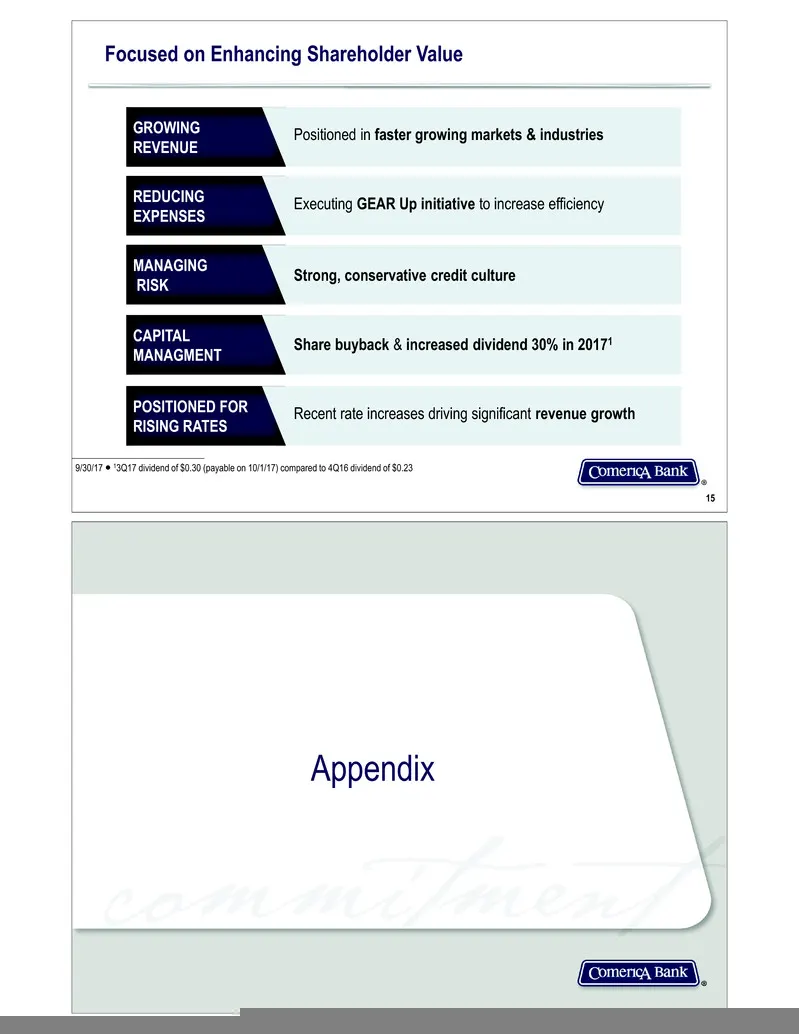
Slide 8: Focused on Enhancing Shareholder Value: Appendix
REDUCING EXPENSES Executing GEAR Up initiative to increase efficiency GROWING REVENUE CAPITAL MANAGMENT POSITIONED FOR RISING RATES Positioned in faster growing markets & industries Recent rate increases driving significant revenue growth Share buyback & increased dividend 30% in 20171 MANAGING RISK
Slide 9: Financial Summary
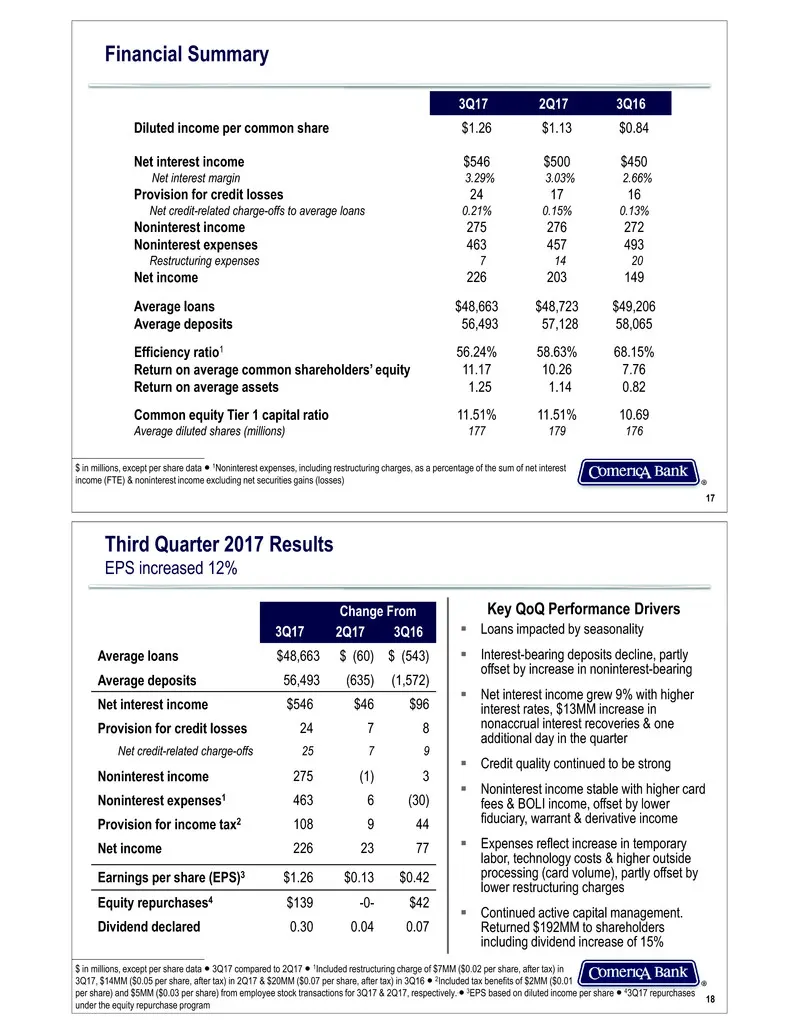
Financial Summary 3Q17 2Q17 3Q16 Diluted income per common share $1.26 $1.13 $0.84 Net interest income $546 $500 $450 Net interest margin 3.29% 3.03% 2.66% Provision for credit losses 24 17 16 Net credit-related charge-offs to average loans 0.21% 0.15% 0.13% Noninterest income 275 276 272 Noninteres
Slide 10: Loans by Business and Market
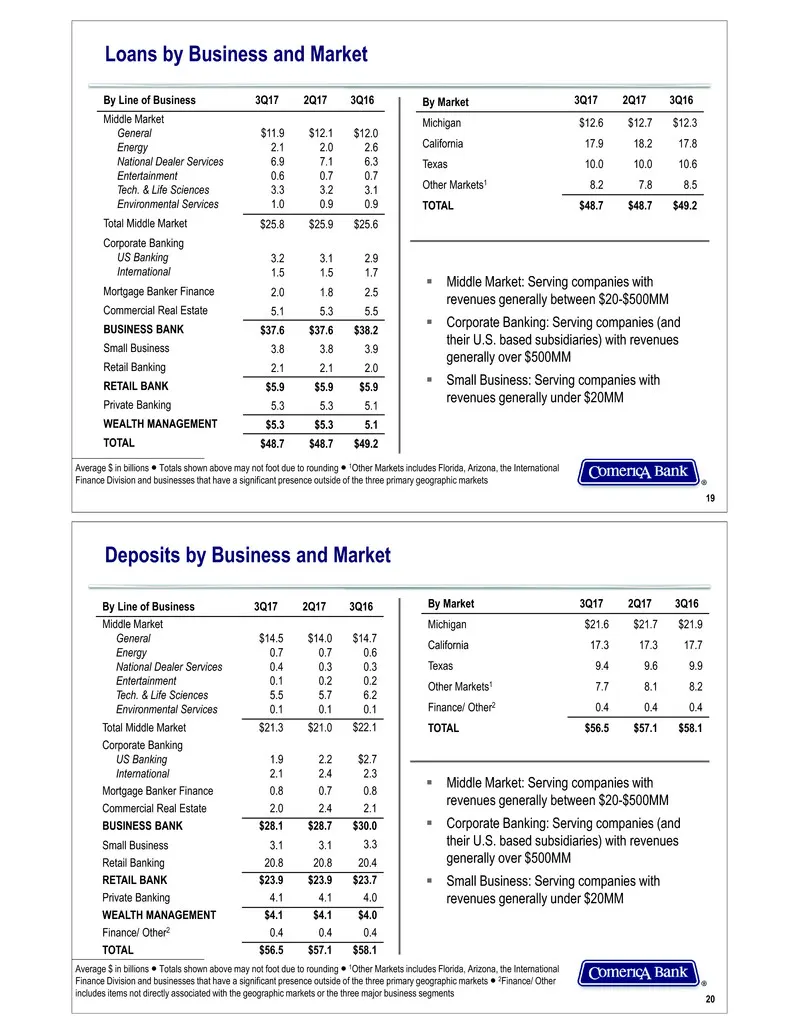
Loans by Business and Market Average $ in billions ? Totals shown above may not foot due to rounding ? 1Other Markets includes Florida, Arizona, the International Finance Division and businesses that have a significant presence outside of the three primary geographic markets ? Middle Market: Serving
Slide 11: Commercial Real Estate Line of Business
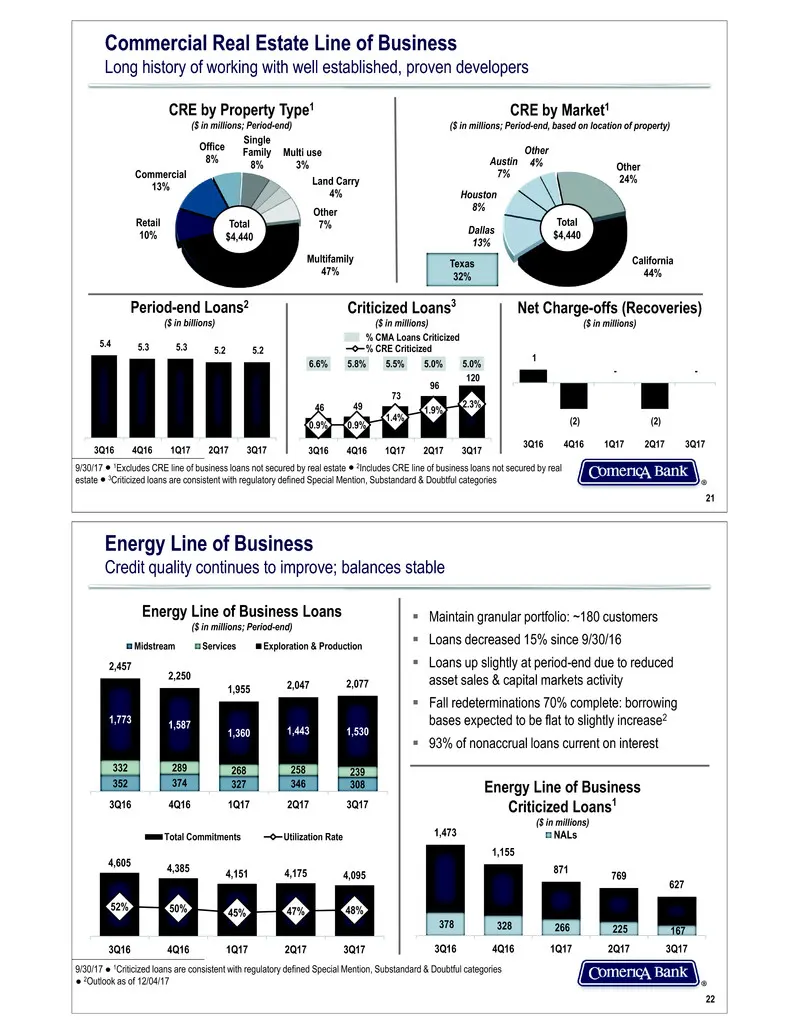
Other 24% California 44% Dallas 13% Houston 8% Austin 7% Other 4% Multifamily 47% Retail 10% Commercial 13% Office 8% Single Family 8% Multi use 3% Land Carry 4% Other 7% 9/30/17 ? 1Excludes CRE line of business loans not secured by real estate ? 2Includes CRE line of business loans not secured by r
Slide 12: Mortgage Banker Finance
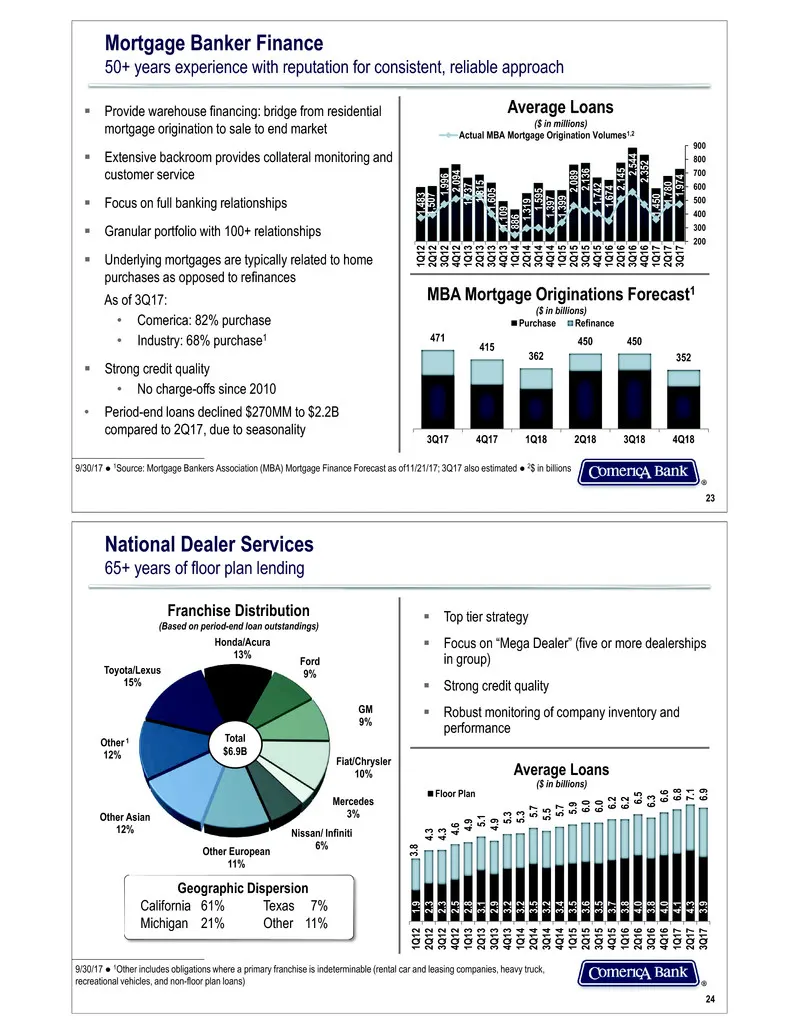
1, 48 3 1, 50 7 1, 99 6 2, 09 4 1, 73 7 1, 81 5 1, 60 5 1, 10 9 88 6 1, 31 9 1, 59 5 1, 39 7 1, 39 9 2, 08 9 2, 13 6 1, 74 2 1, 67 4 2, 14 5 2, 54 4 2, 35 2 1, 45 0 1, 78 0 1, 97 4 200 300 400 500 600 700 800 900 1Q 12 2Q 12 3Q 12 4Q 12 1Q 13 2Q 13 3Q 13 4Q 13 1Q 14 2Q 14 3Q 14 4Q 14 1Q 15 2Q 15 3Q
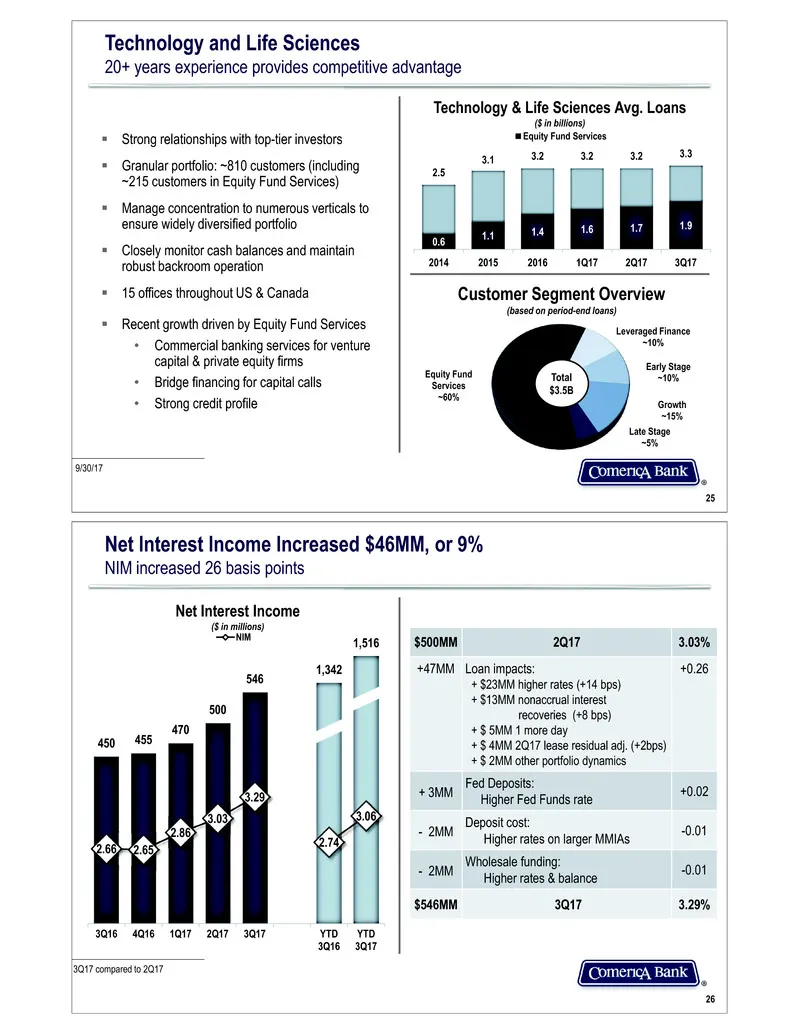
Slide 13: Technology and Life Sciences
Customer Segment Overview (based on period-end loans) Early Stage ~10% Growth ~15% Late Stage ~5% Equity Fund Services ~60% Leveraged Finance ~10% Technology and Life Sciences 20+ years experience provides competitive advantage Technology & Life Sciences Avg. Loans ($ in billions) ? Strong relations
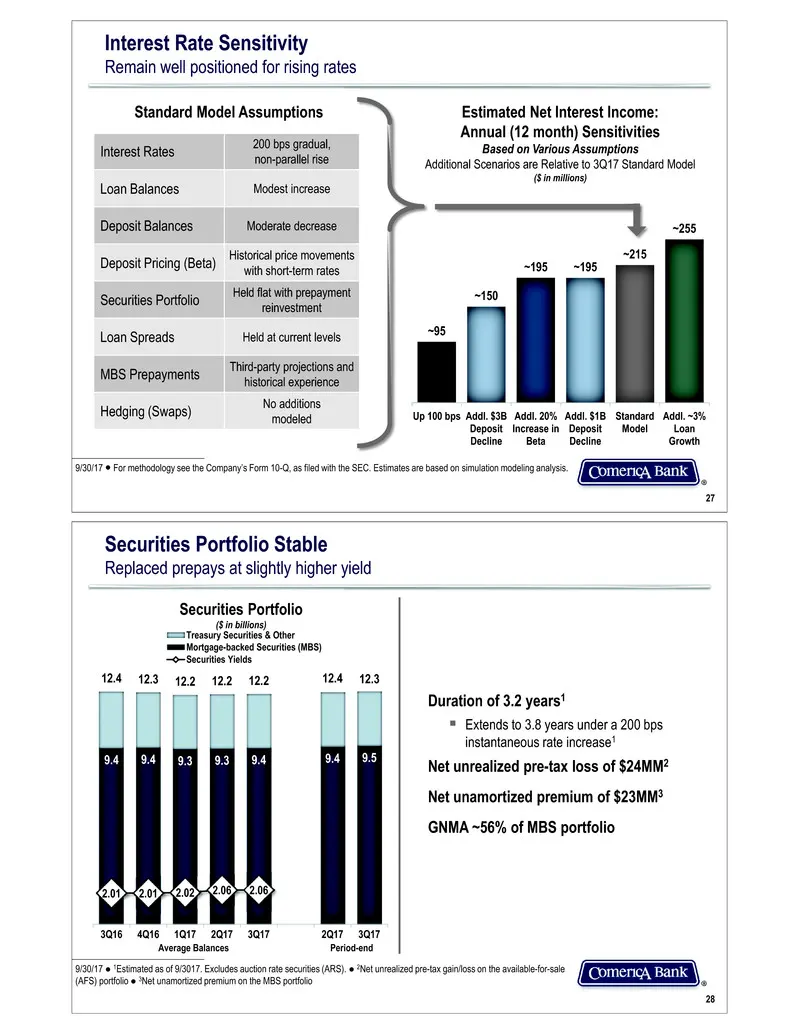
Slide 14: Interest Rate Sensitivity
~95 ~150 ~195 ~195 ~215 ~255 Up 100 bps Addl. $3B Deposit Decline Addl. 20% Increase in Beta Addl. $1B Deposit Decline Standard Model Addl. ~3% Loan Growth Interest Rate Sensitivity Remain well positioned for rising rates 9/30/17 ? For methodology see the Company’s Form 10-Q, as filed with the SEC.
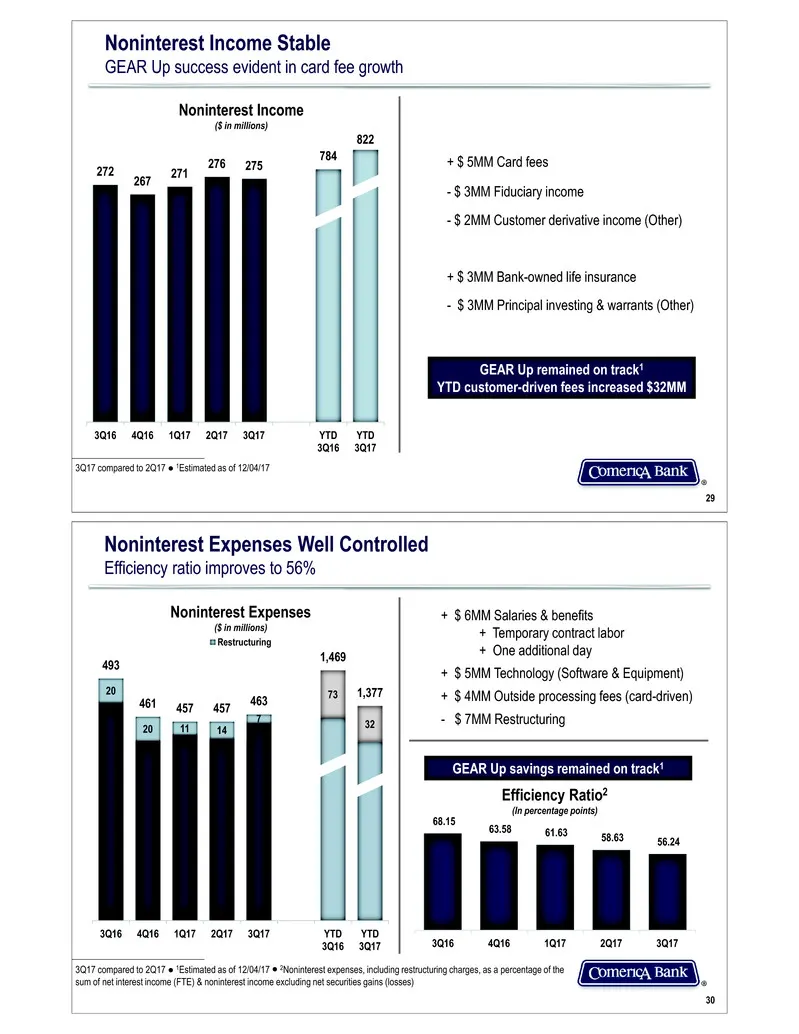
Slide 15: Noninterest Income Stable; Noninterest Expenses Well Controlled
Noninterest Income Stable GEAR Up success evident in card fee growth 3Q17 compared to 2Q17 ? 1Estimated as of 12/04/17 272 267 271 276 275 784 822 3Q16 4Q16 1Q17 2Q17 3Q17 YTD 3Q16 YTD 3Q17 Noninterest Income ($ in millions) + $ 5MM Card fees - $ 3MM Fiduciary income - $ 2MM Customer derivative inco
Source: SEC EDGAR · 8-K filed Dec 4, 2017
More decks from Comerica Incorporated
 Goldman Sachs Financial Services Conference 202520 slides · Dec 11, 2025
 Merger or Acquisition (October 2025)18 slides · Oct 6, 2025
 Barclays Global Financial Services Conference 202524 slides · Sep 8, 2025
 Q2 2025 Earnings Presentation24 slides · Jul 18, 2025
 Q1 2025 Earnings Presentation21 slides · Apr 21, 2025
 Q4 2024 Earnings Presentation24 slides · Jan 22, 2025