OMNOVA Solutions — Deutsche Bank 2009 Leveraged Finance Conference
28 slides from OMNOVA Solutions's conference presentation, Oct 1, 2009
Slide 1: Deutsche Bank - 2009 Leveraged Finance Conference
Exhibit 99 Deutsche Bank - 2009 Leveraged Finance Conference Kevin McMullen Chairman & CEO October 1, 2009
Slide 2: Cautionary Forward-Looking Statements
Cautionary Forward-Looking Statements • This presentation includes “forward-looking statements” as defined by federal securities laws. These statements are intended to qualify for the protections afforded forward-looking statements under the Private Securities Litigation Reform Act of 1995. Forward-
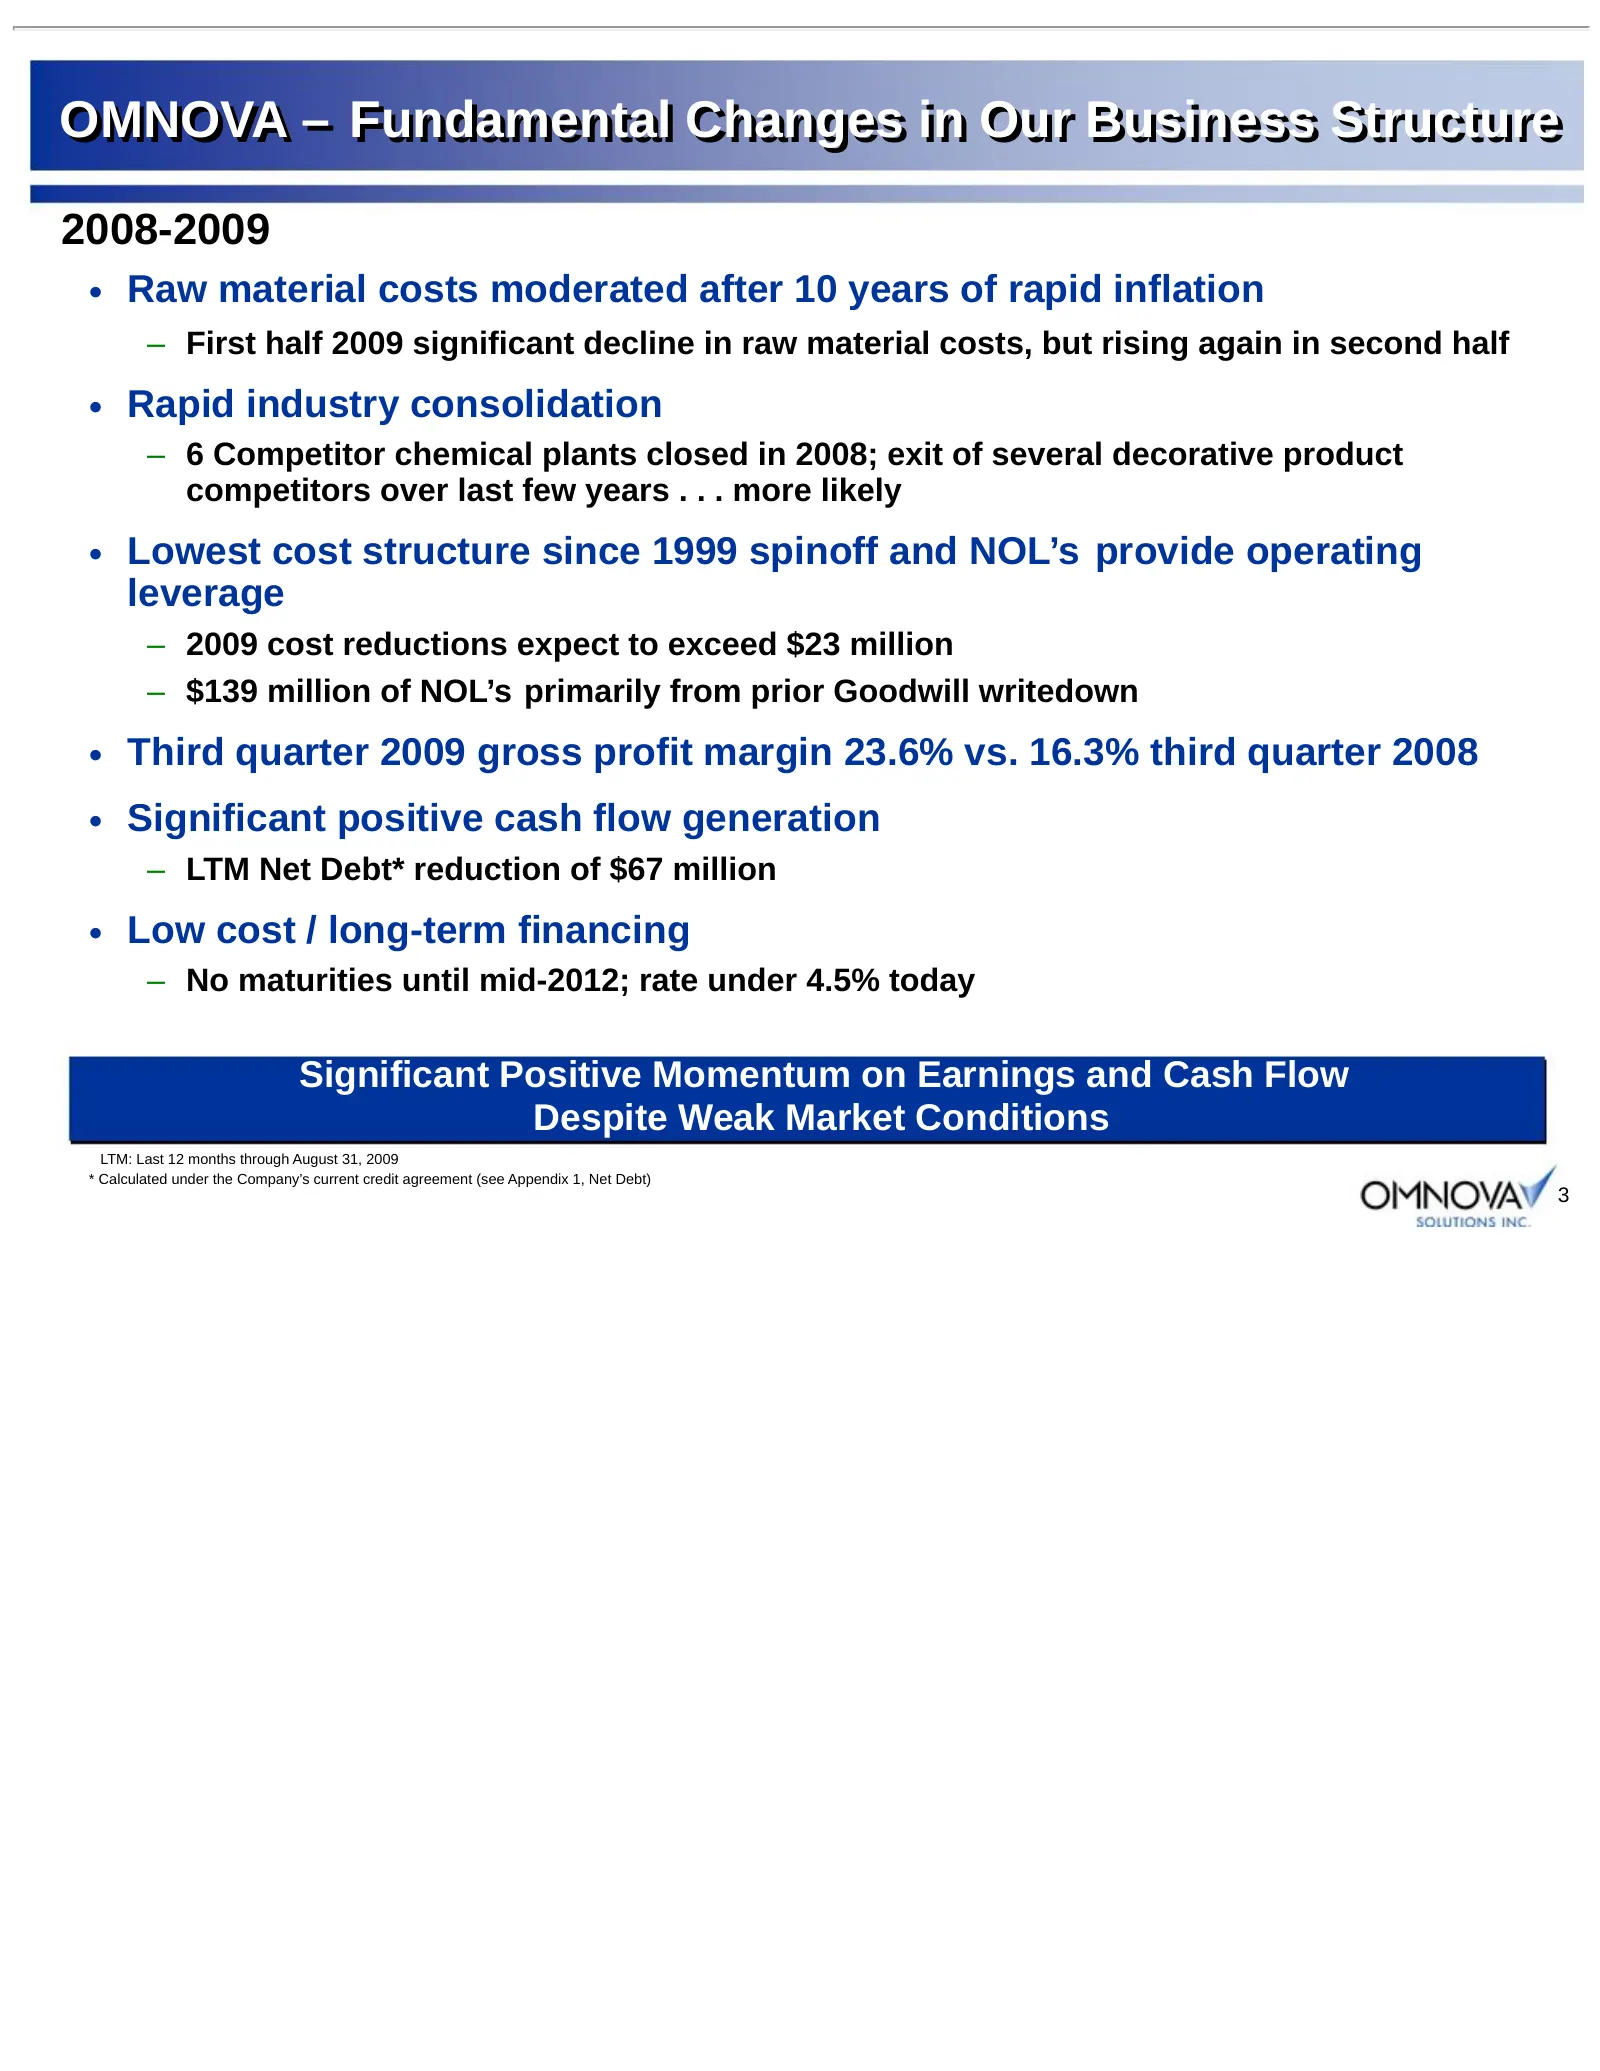
Slide 3: OMNOVA – Fundamental Changes in Our Business Structure
OMNOVA – Fundamental Changes in Our Business Structure 2008-2009 • Raw material costs moderated after 10 years of rapid inflation – First half 2009 significant decline in raw material costs, but rising again in second half • Rapid industry consolidation – 6 Competitor chemical plants closed in 2008;
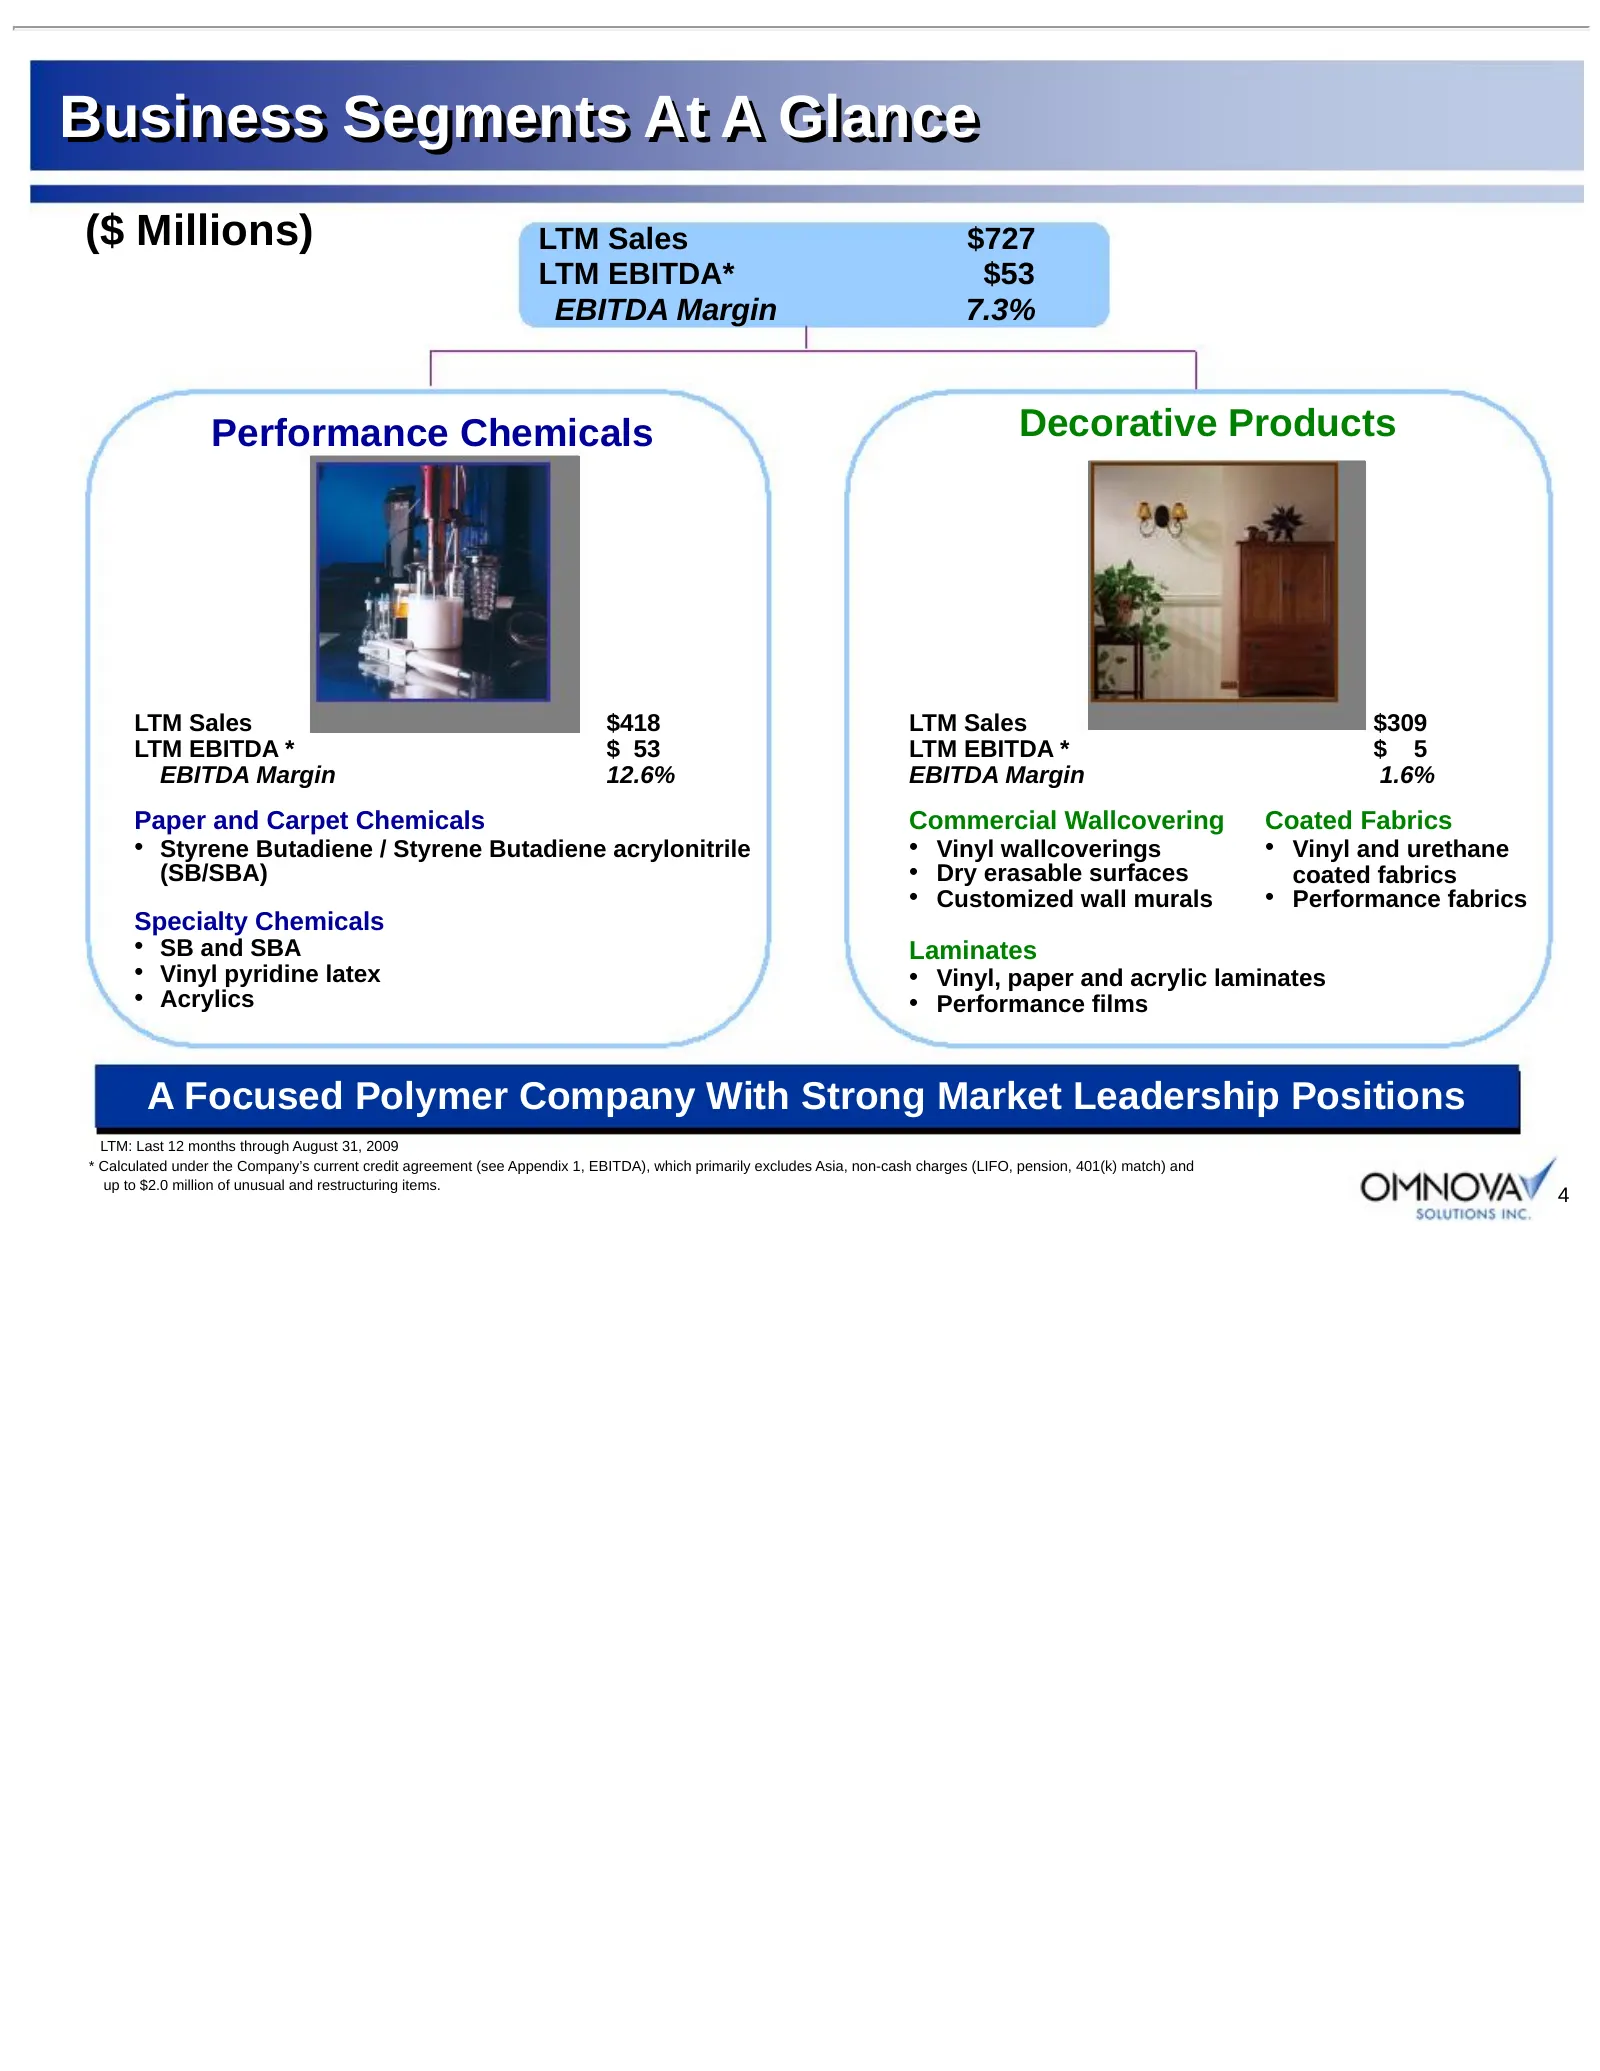
Slide 4: Business Segments At A Glance
Business Segments At A Glance ($ Millions) LTM Sales $727 LTM EBITDA* $53 EBITDA Margin 7.3% Performance Chemicals Decorative Products LTM Sales $418 LTM Sales $309 LTM EBITDA * $ 53 LTM EBITDA * $ 5 EBITDA Margin 12.6% EBITDA Margin 1.6% Paper and Carpet Chemicals Commercial Wallcovering Coated Fab
Slide 5: Third Quarter 2009 Results
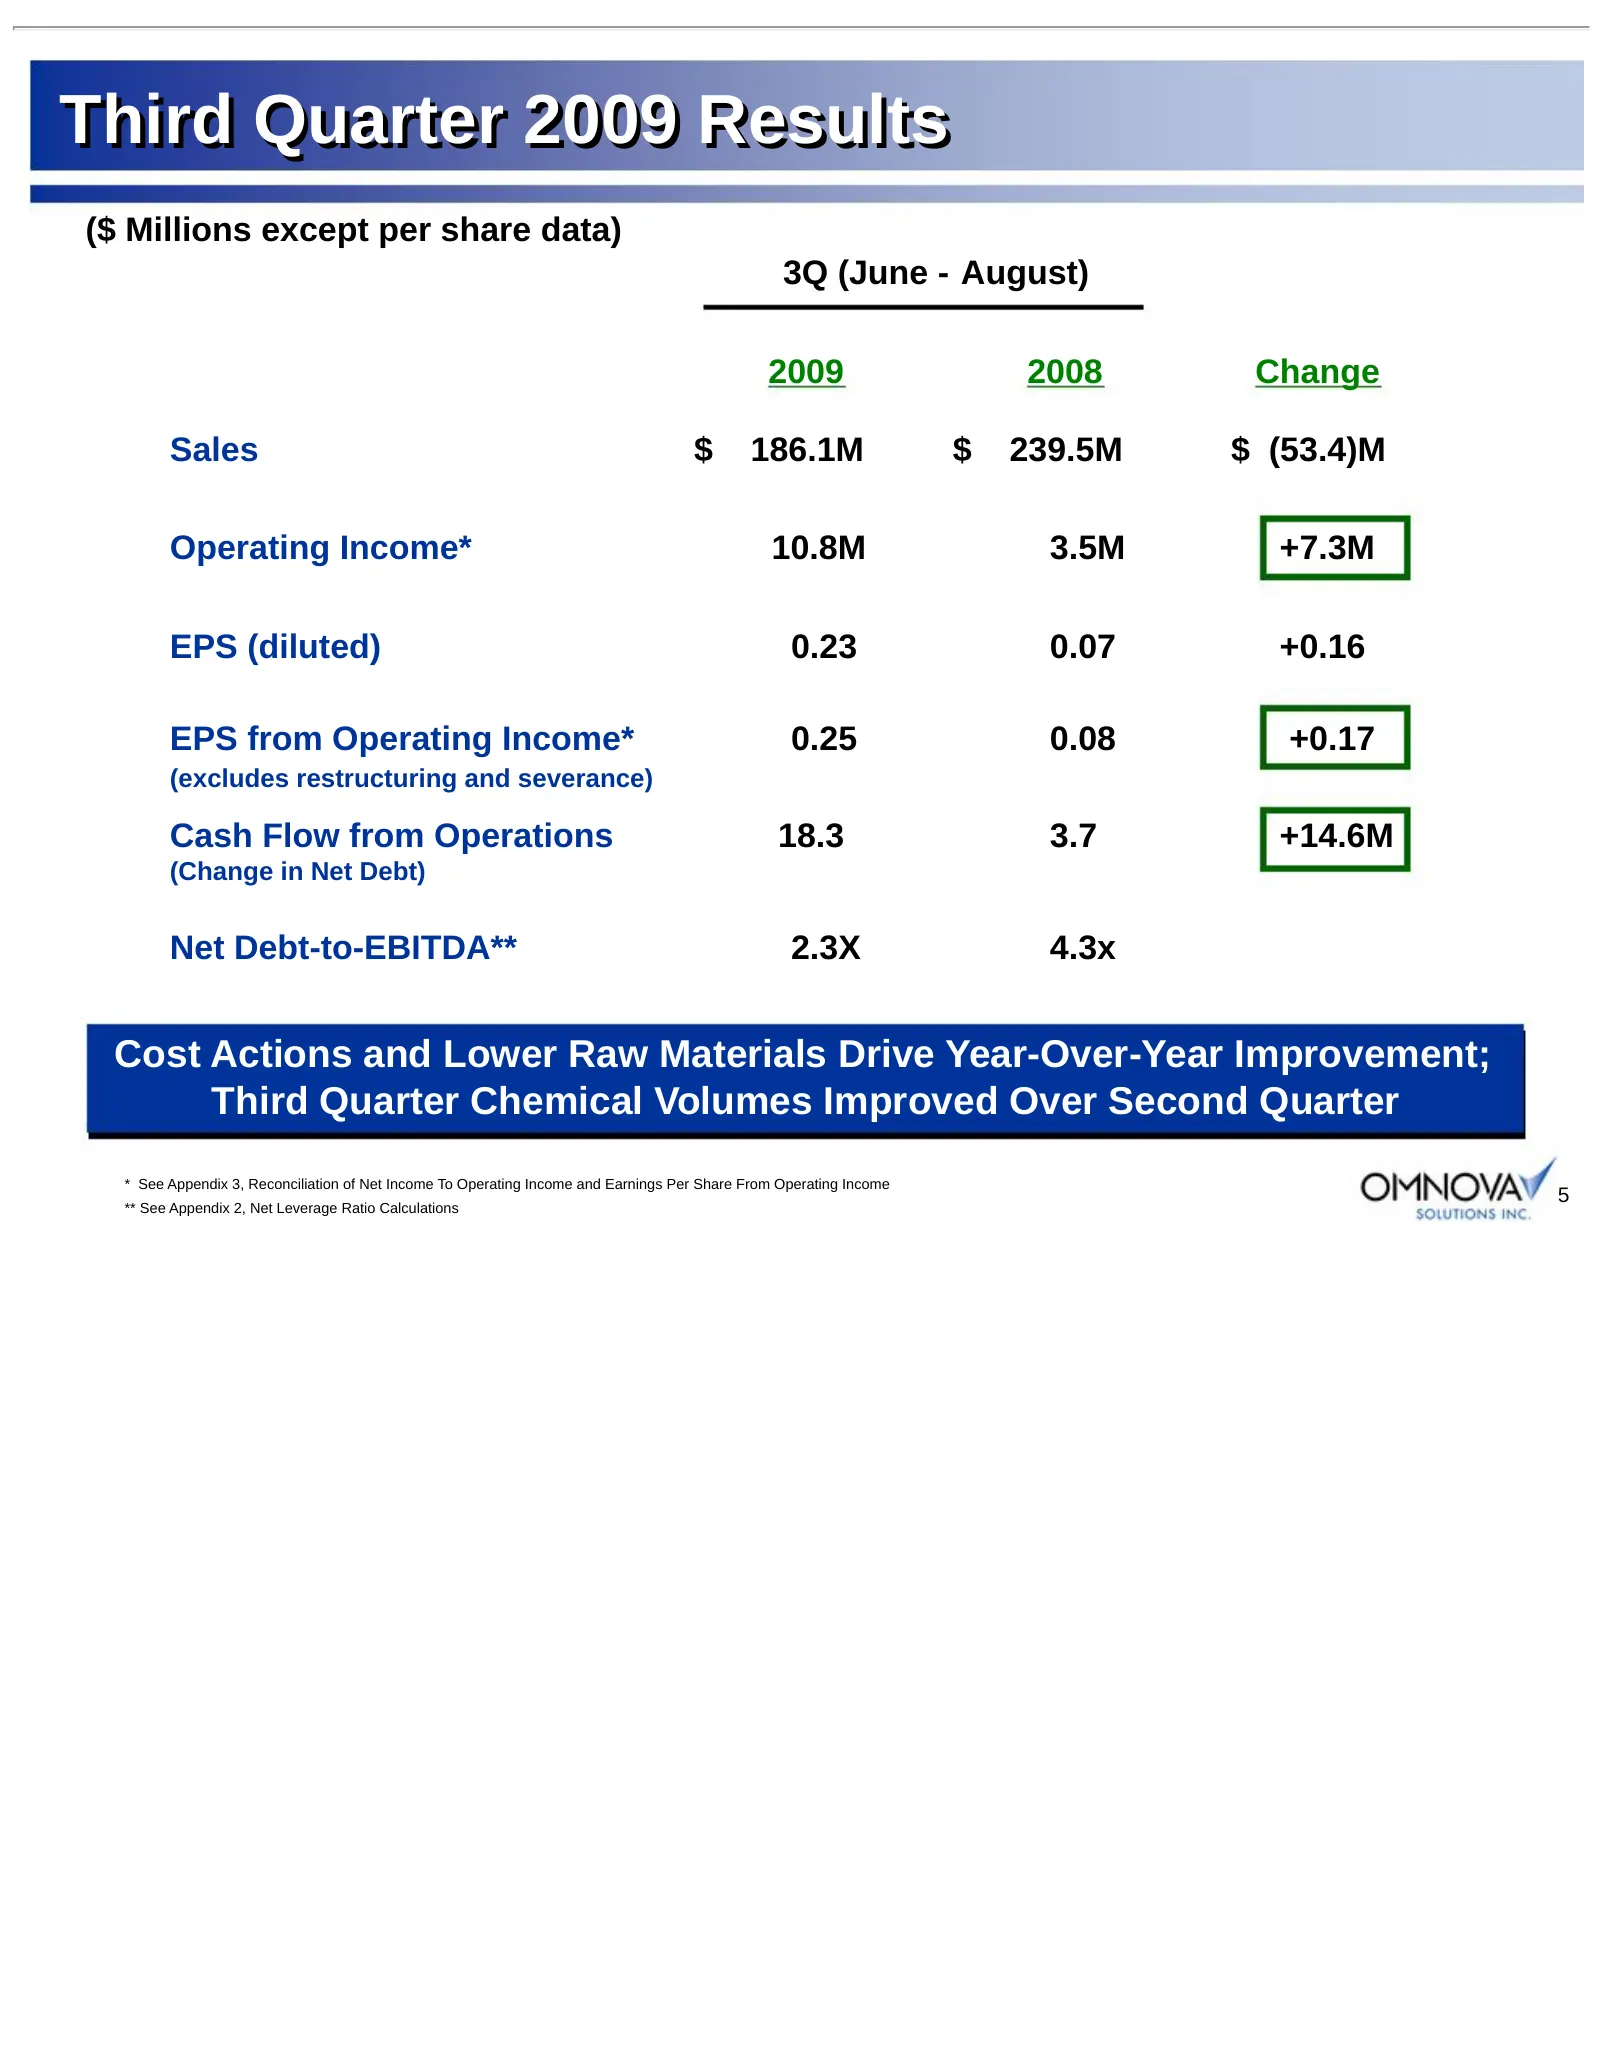
Third Quarter 2009 Results ($ Millions except per share data) 3Q (June - August) 2009 2008 Change Sales $ 186.1M $ 239.5M $ (53.4)M Operating Income* 10.8M 3.5M +7.3M EPS (diluted) 0.23 0.07 +0.16 EPS from Operating Income* 0.25 0.08 +0.17 (excludes restructuring and severance) Cash Flow from Operat
Slide 6: Financial Summary - Sales
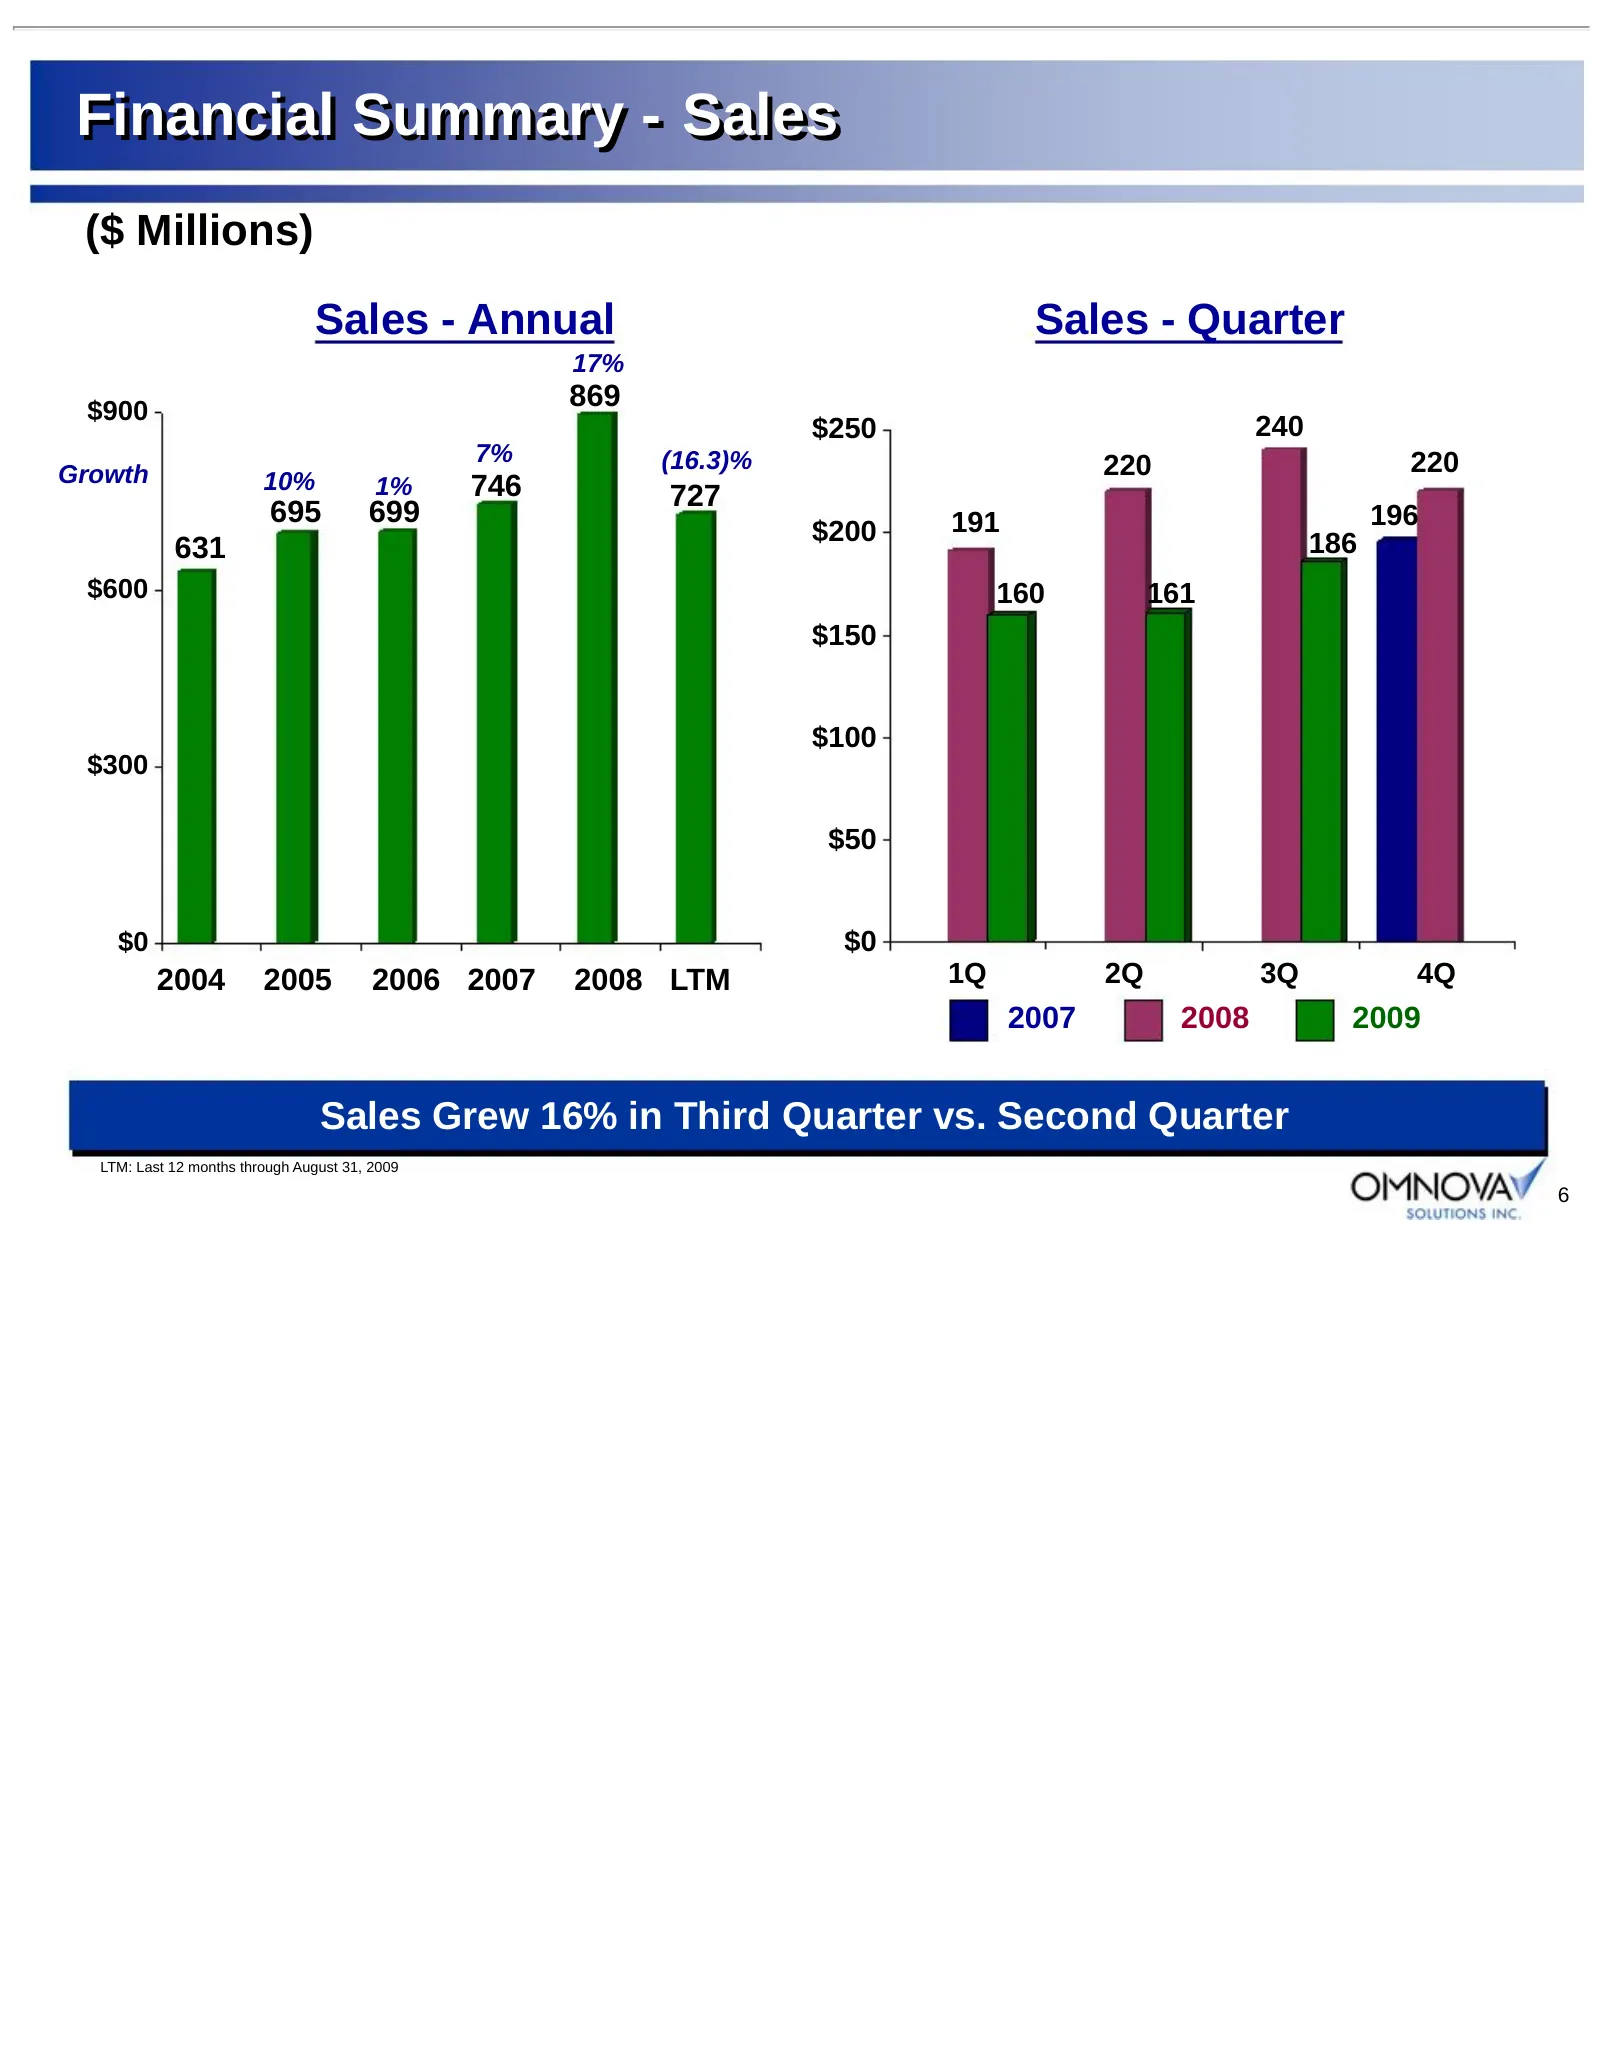
Financial Summary - Sales ($ Millions) Sales - Annual Sales - Quarter 17% $900 869 $250 240 7% (16.3)% 220 220 Growth 10% 1% 746 727 695 699 191 196 $200 186 631 $600 160 161 $150 $100 $300 $50 $0 $0 2004 2005 2006 2007 2008 LTM 1Q 2Q 3Q 4Q 2007 2008 2009 Sales Grew 16% in Third Quarter vs. Second Q
Slide 7: Financial Summary – EBITDA
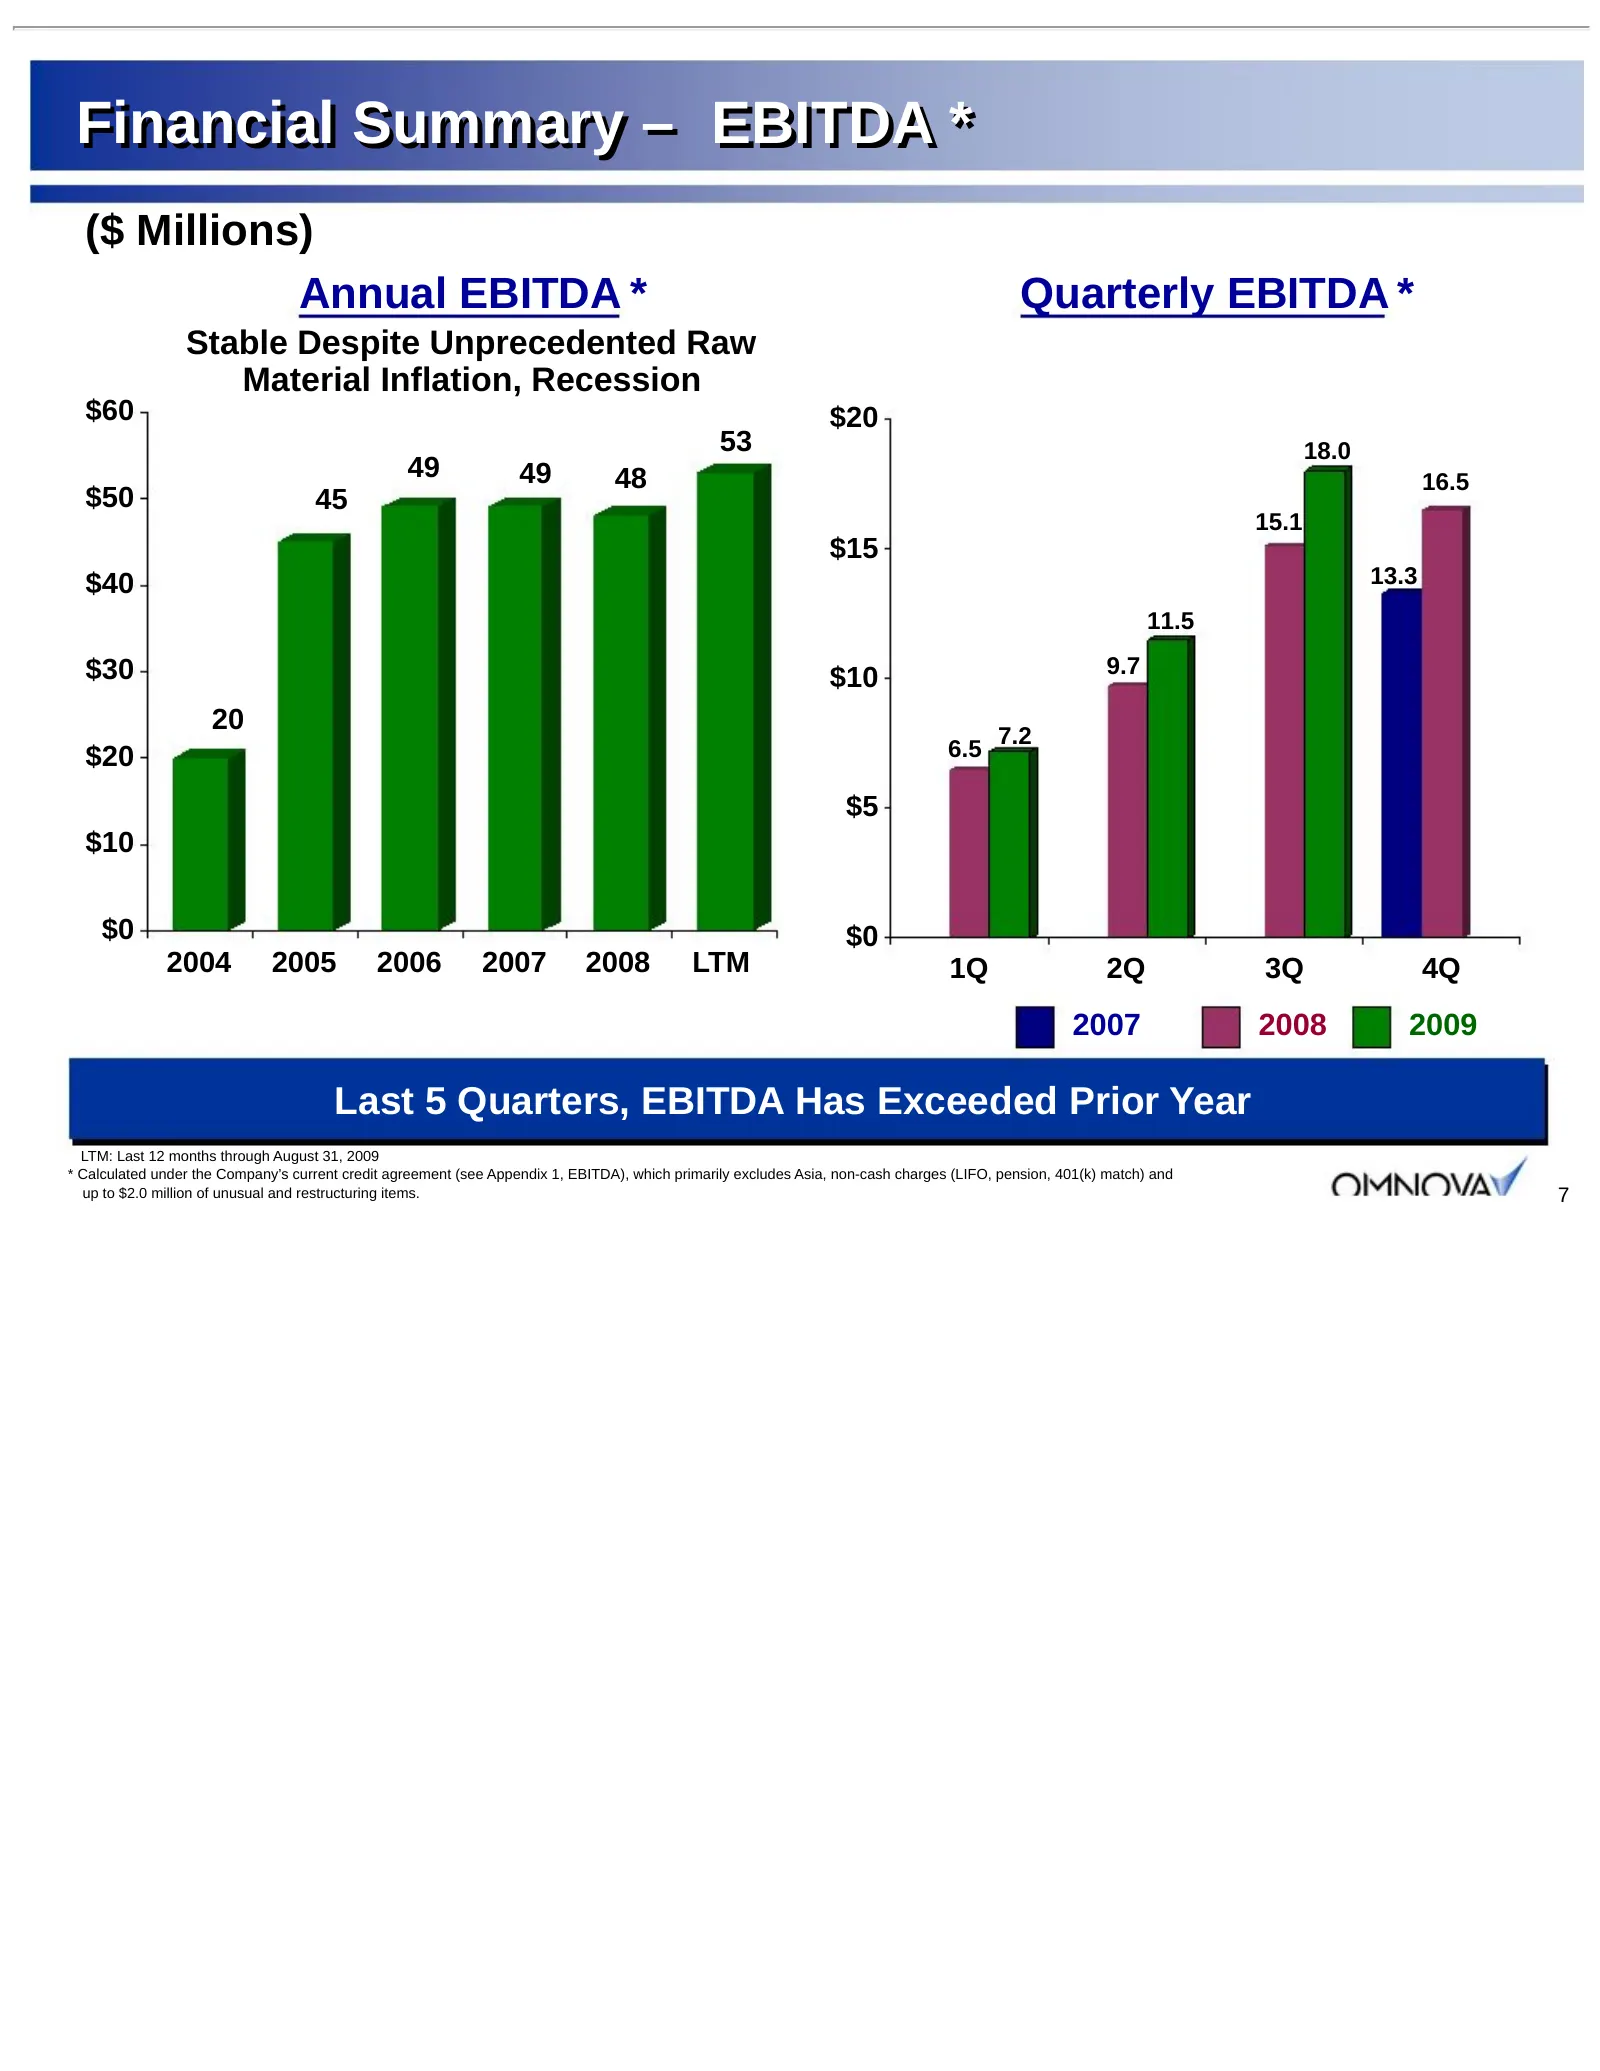
Financial Summary – EBITDA * ($ Millions) Annual EBITDA * Quarterly EBITDA * Stable Despite Unprecedented Raw Material Inflation, Recession $60 $20 53 18.0 49 49 48 16.5 $50 45 15.1 $15 $40 13.3 11.5 $30 9.7 $10 20 7.2 $20 6.5 $5 $10 $0 $0 2004 2005 2006 2007 2008 LTM 1Q 2Q 3Q 4Q 2007 2008 2009 Last
Slide 8: Significant Balance Sheet Improvements
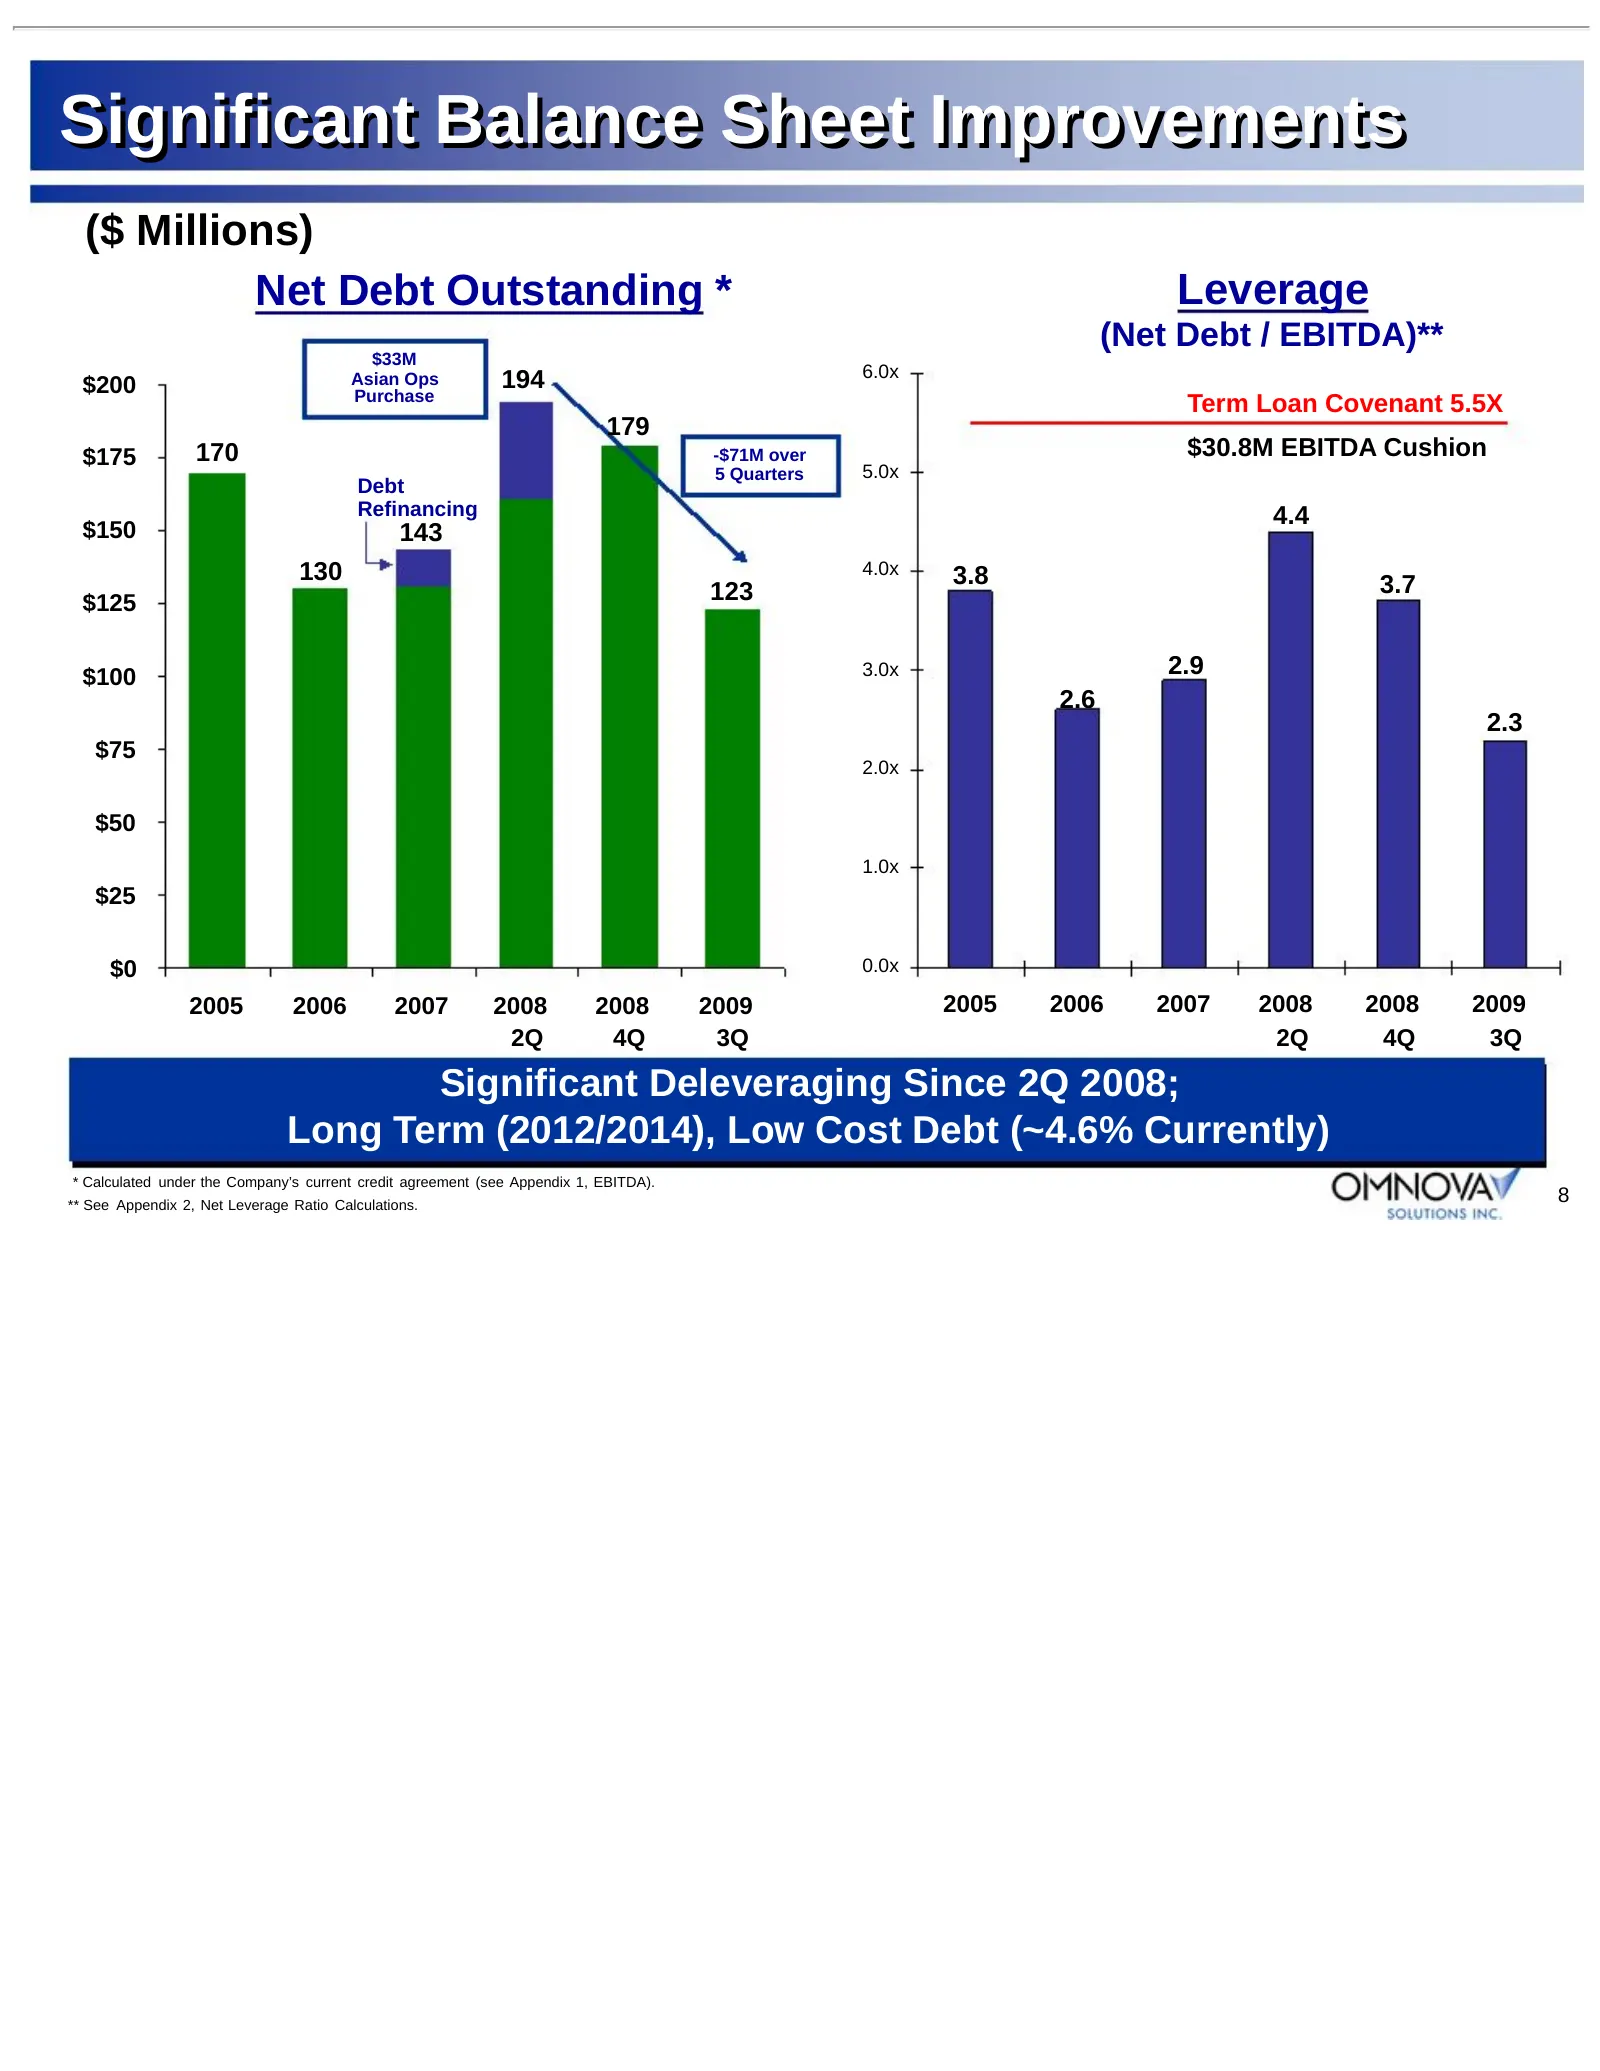
Significant Balance Sheet Improvements ($ Millions) Net Debt Outstanding * Leverage (Net Debt / EBITDA)** $33M Asian Ops 194 6.0x $200 Purchase Term Loan Covenant 5.5X 179 $175 170 -$71M over $30.8M EBITDA Cushion 5 Quarters 5.0x Debt Refinancing 4.4 $150 143 130 4.0x 3.8 123 3.7 $125 $100 3.0x 2.9
Slide 9: Debt Profile
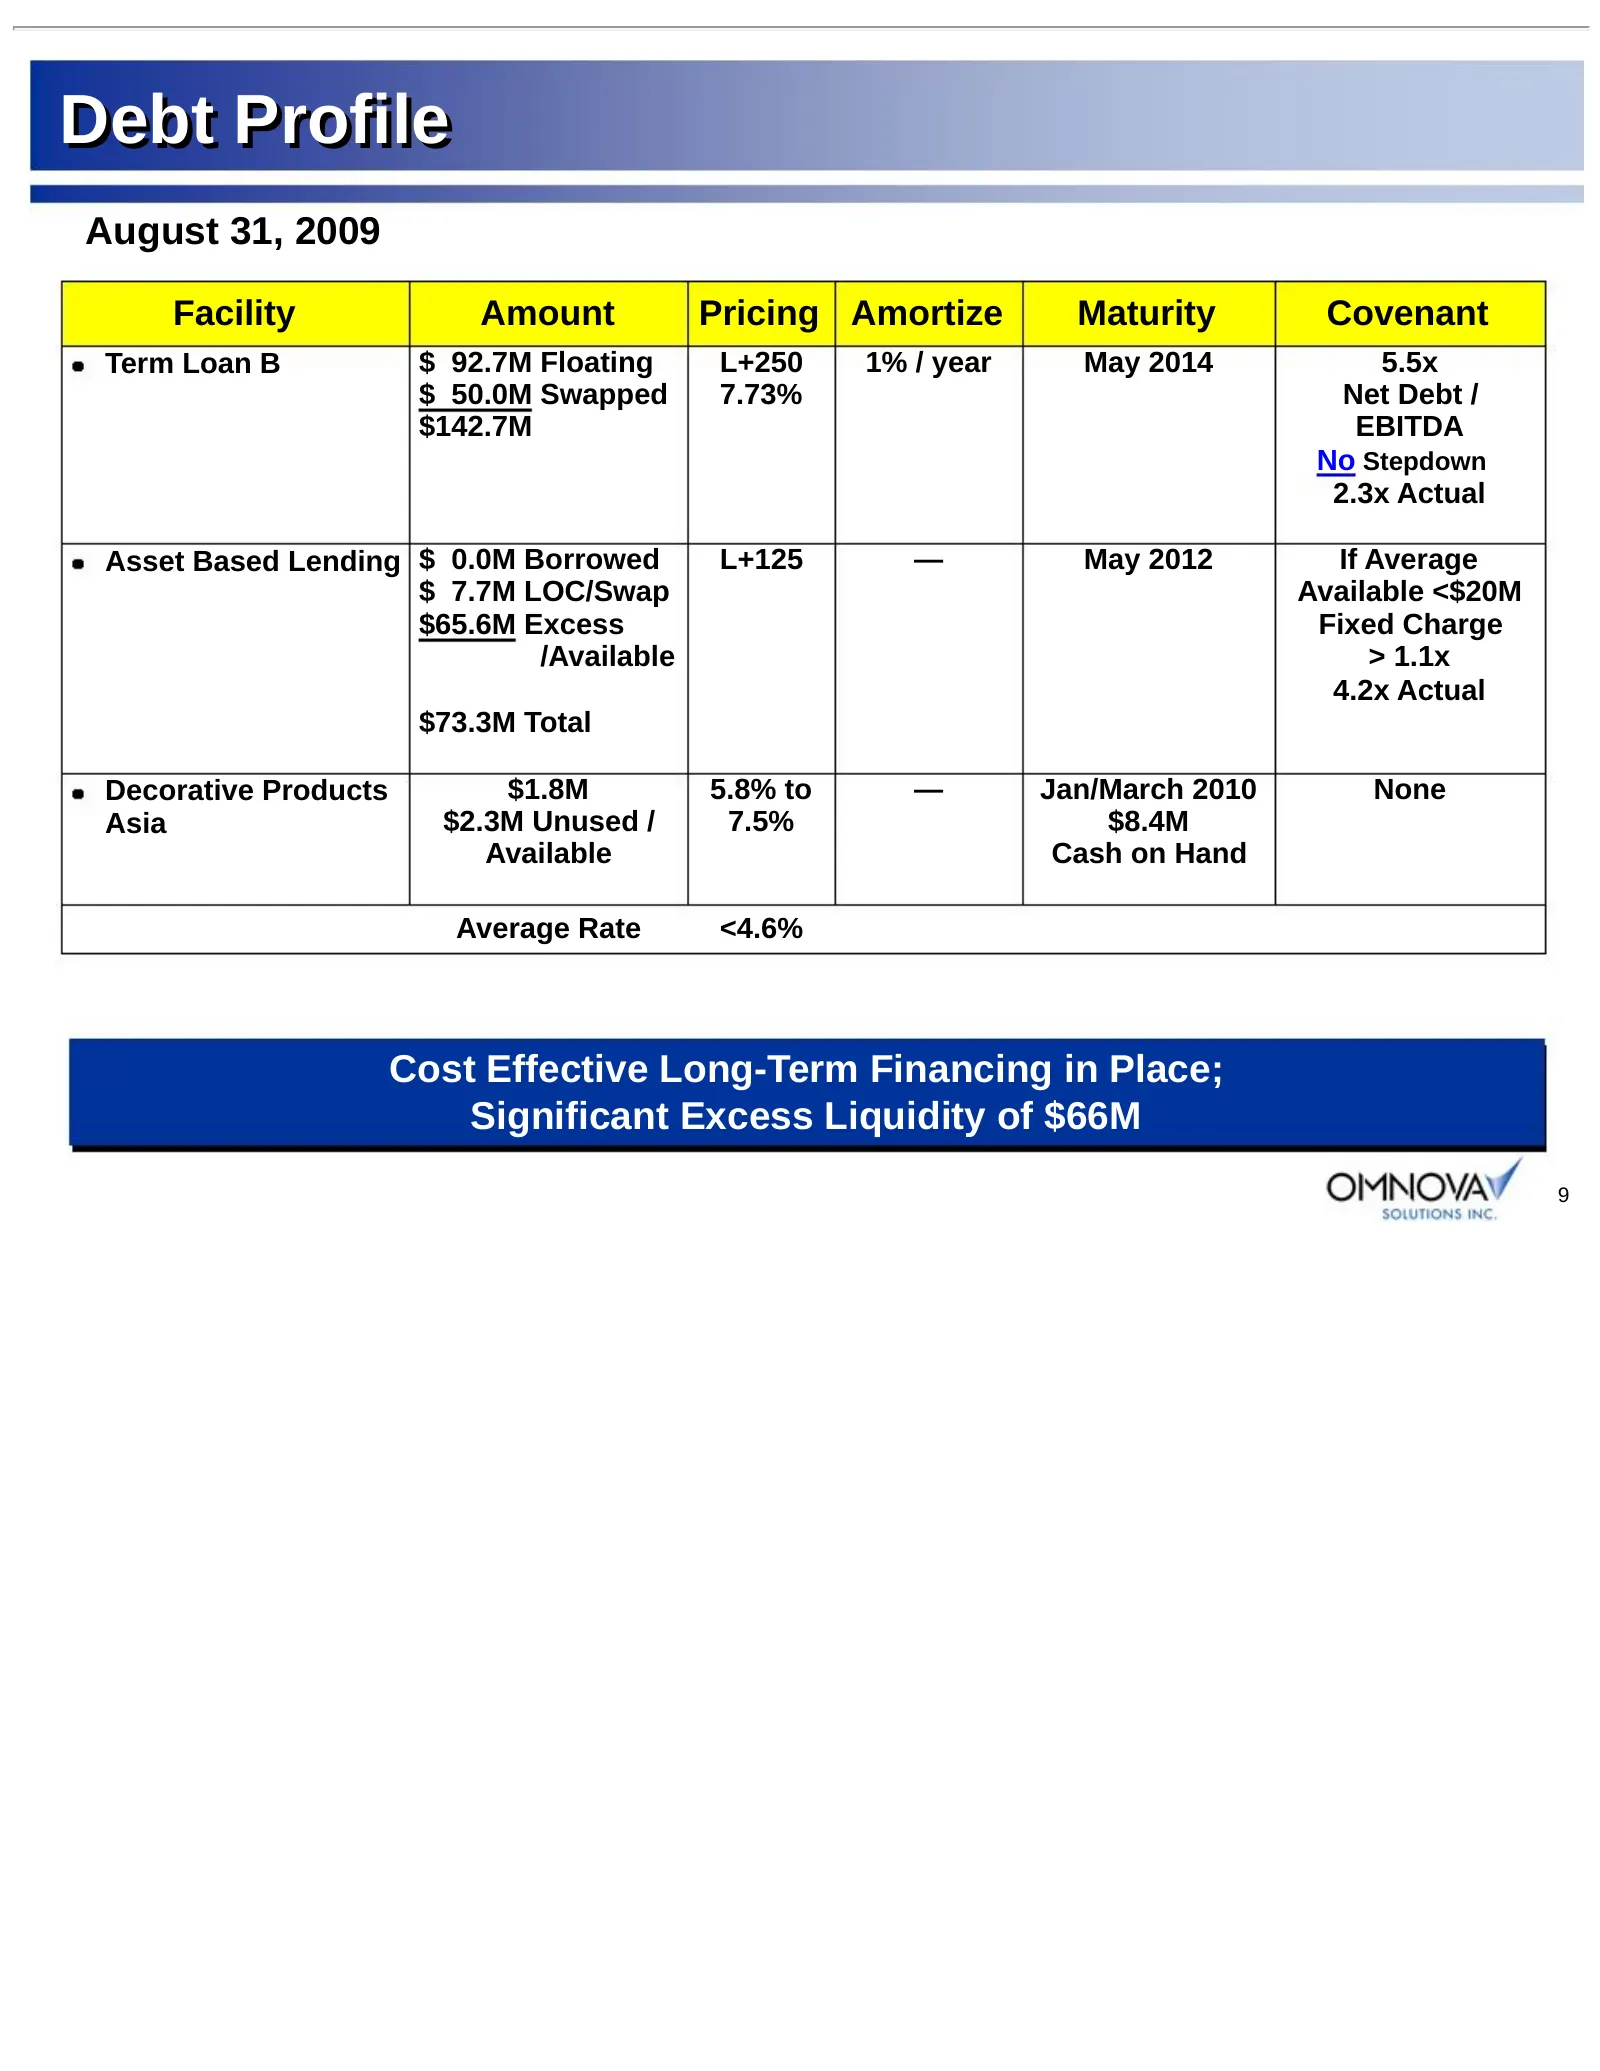
Debt Profile August 31, 2009 Facility Amount Pricing Amortize Maturity Covenant Term Loan B $ 92.7M Floating L+250 1% / year May 2014 5.5x $ 50.0M Swapped 7.73% Net Debt / $142.7M EBITDA No Stepdown 2.3x Actual Asset Based Lending $ 0.0M Borrowed L+125 — May 2012 If Average $ 7.7M LOC/Swap Available
Slide 10: 2008/2009 OMNOVA Volume Trends
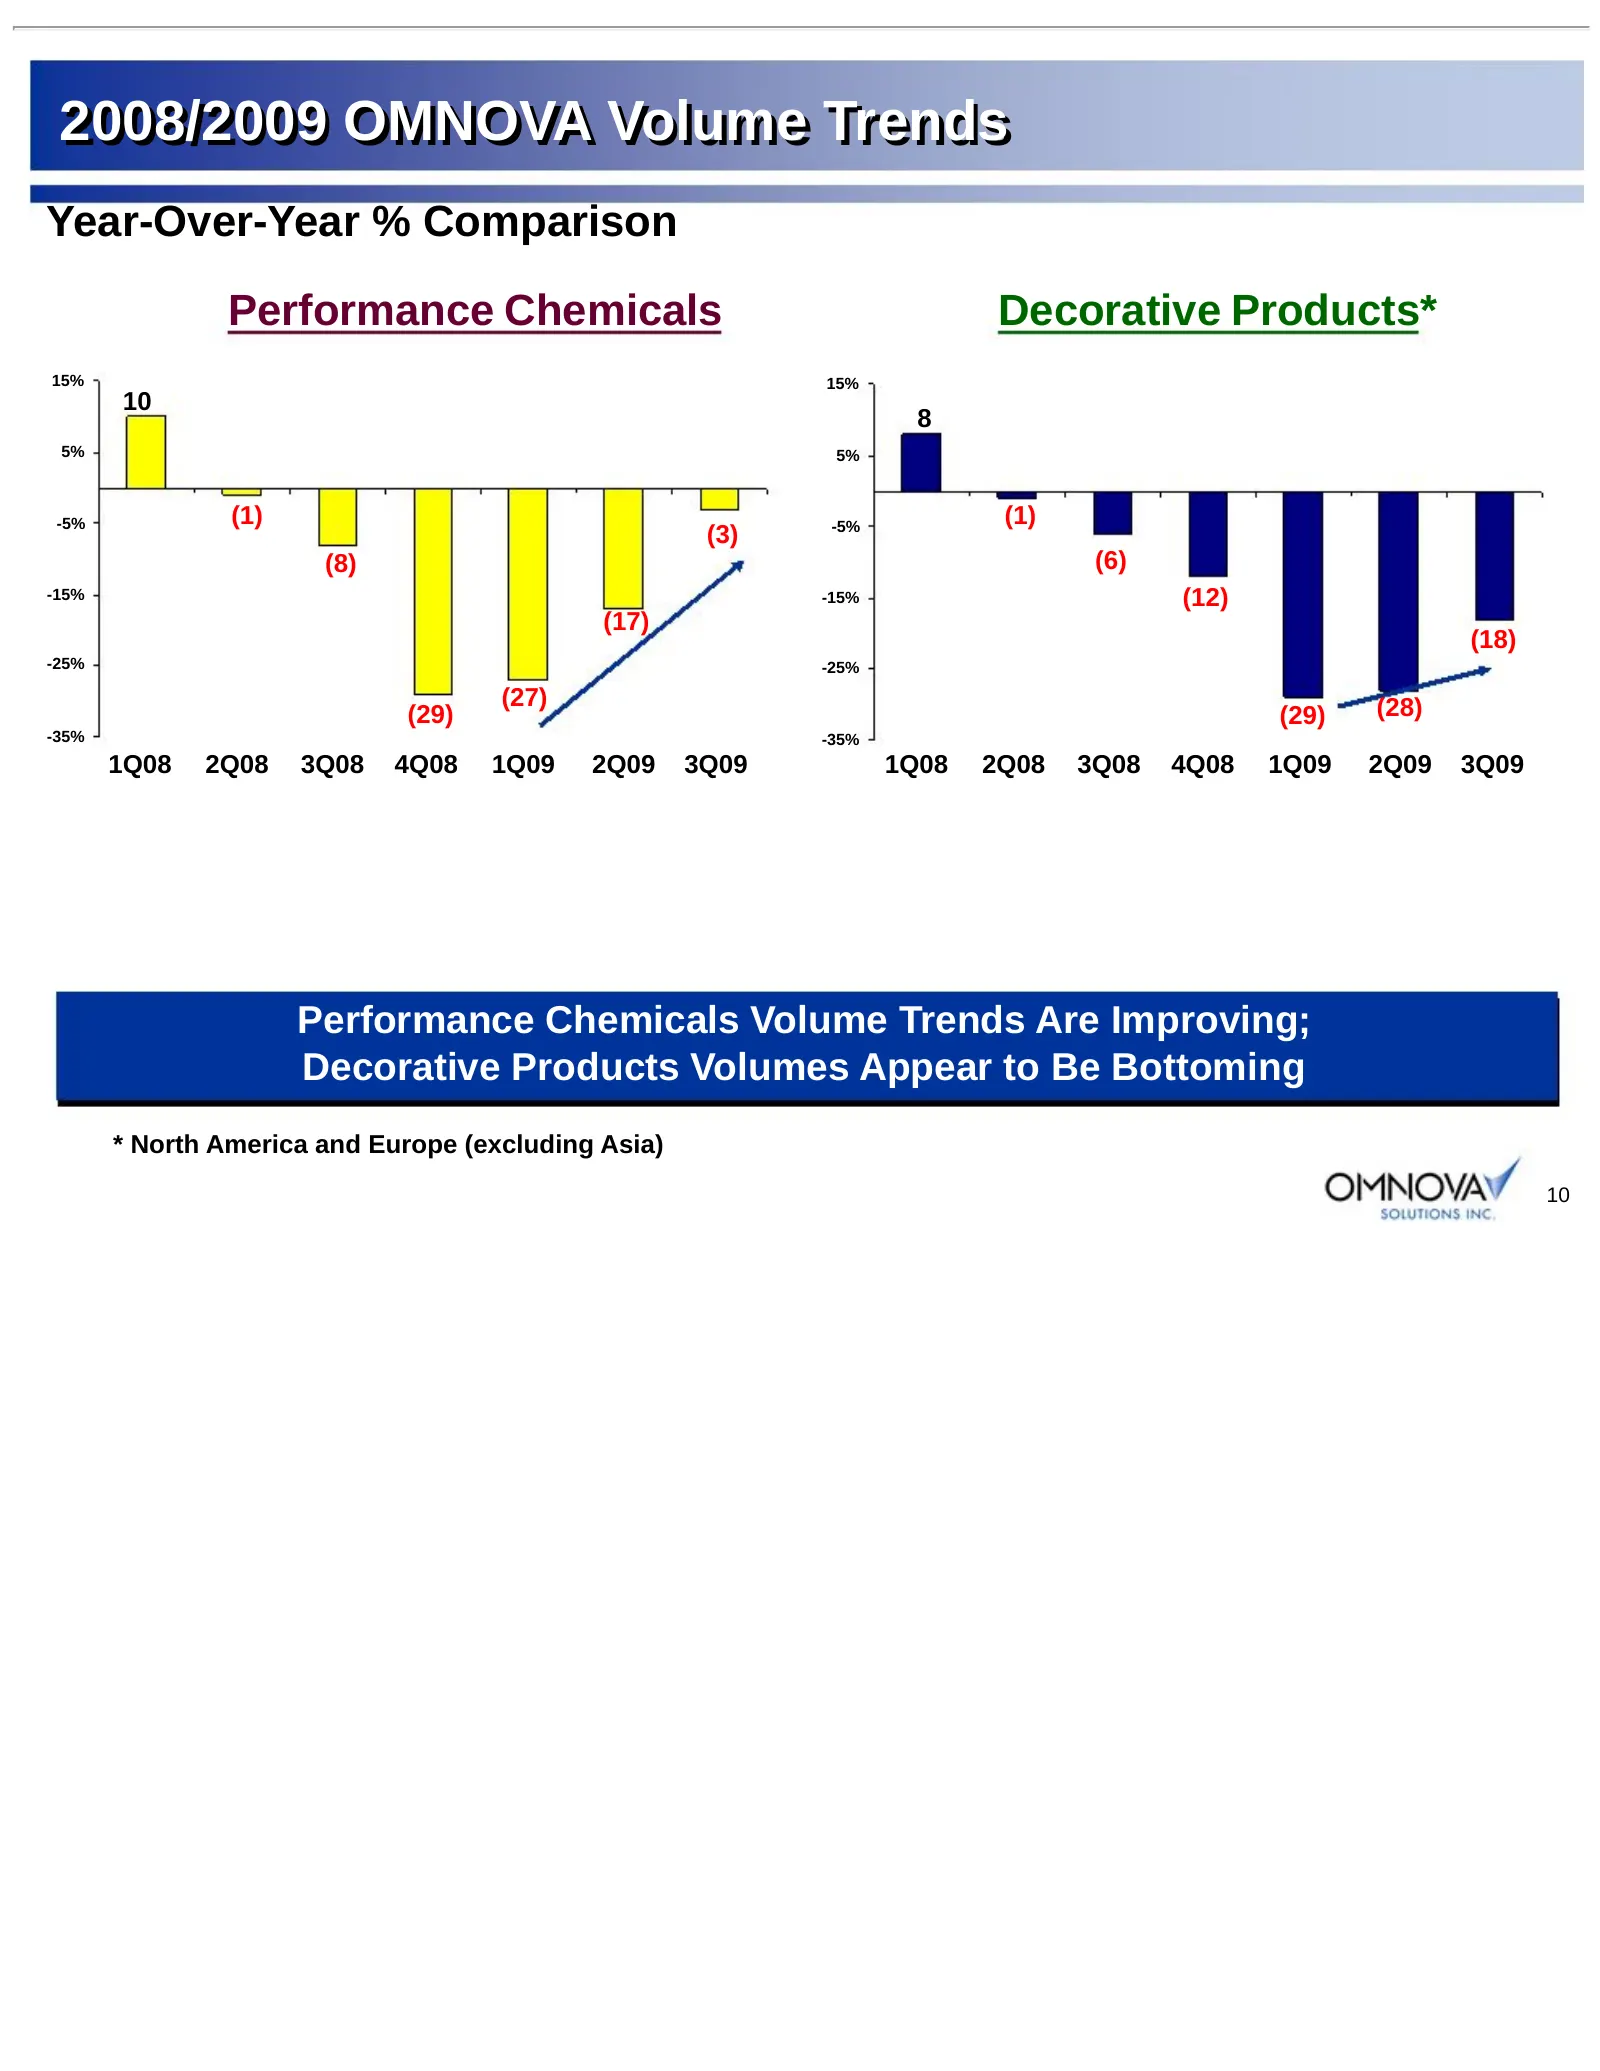
2008/2009 OMNOVA Volume Trends Year-Over-Year % Comparison Performance Chemicals Decorative Products* 15% 15% 10 8 5% 5% -5% (1) -5% (1) (3) (8) (6) -15% -15% (12) (17) (18) -25% -25% (27) (28) (29) (29) -35% -35% 1Q08 2Q08 3Q08 4Q08 1Q09 2Q09 3Q09 1Q08 2Q08 3Q08 4Q08 1Q09 2Q09 3Q09 Performance Chem
Slide 11: 2010 Projected Growth in OMNOVA's Markets
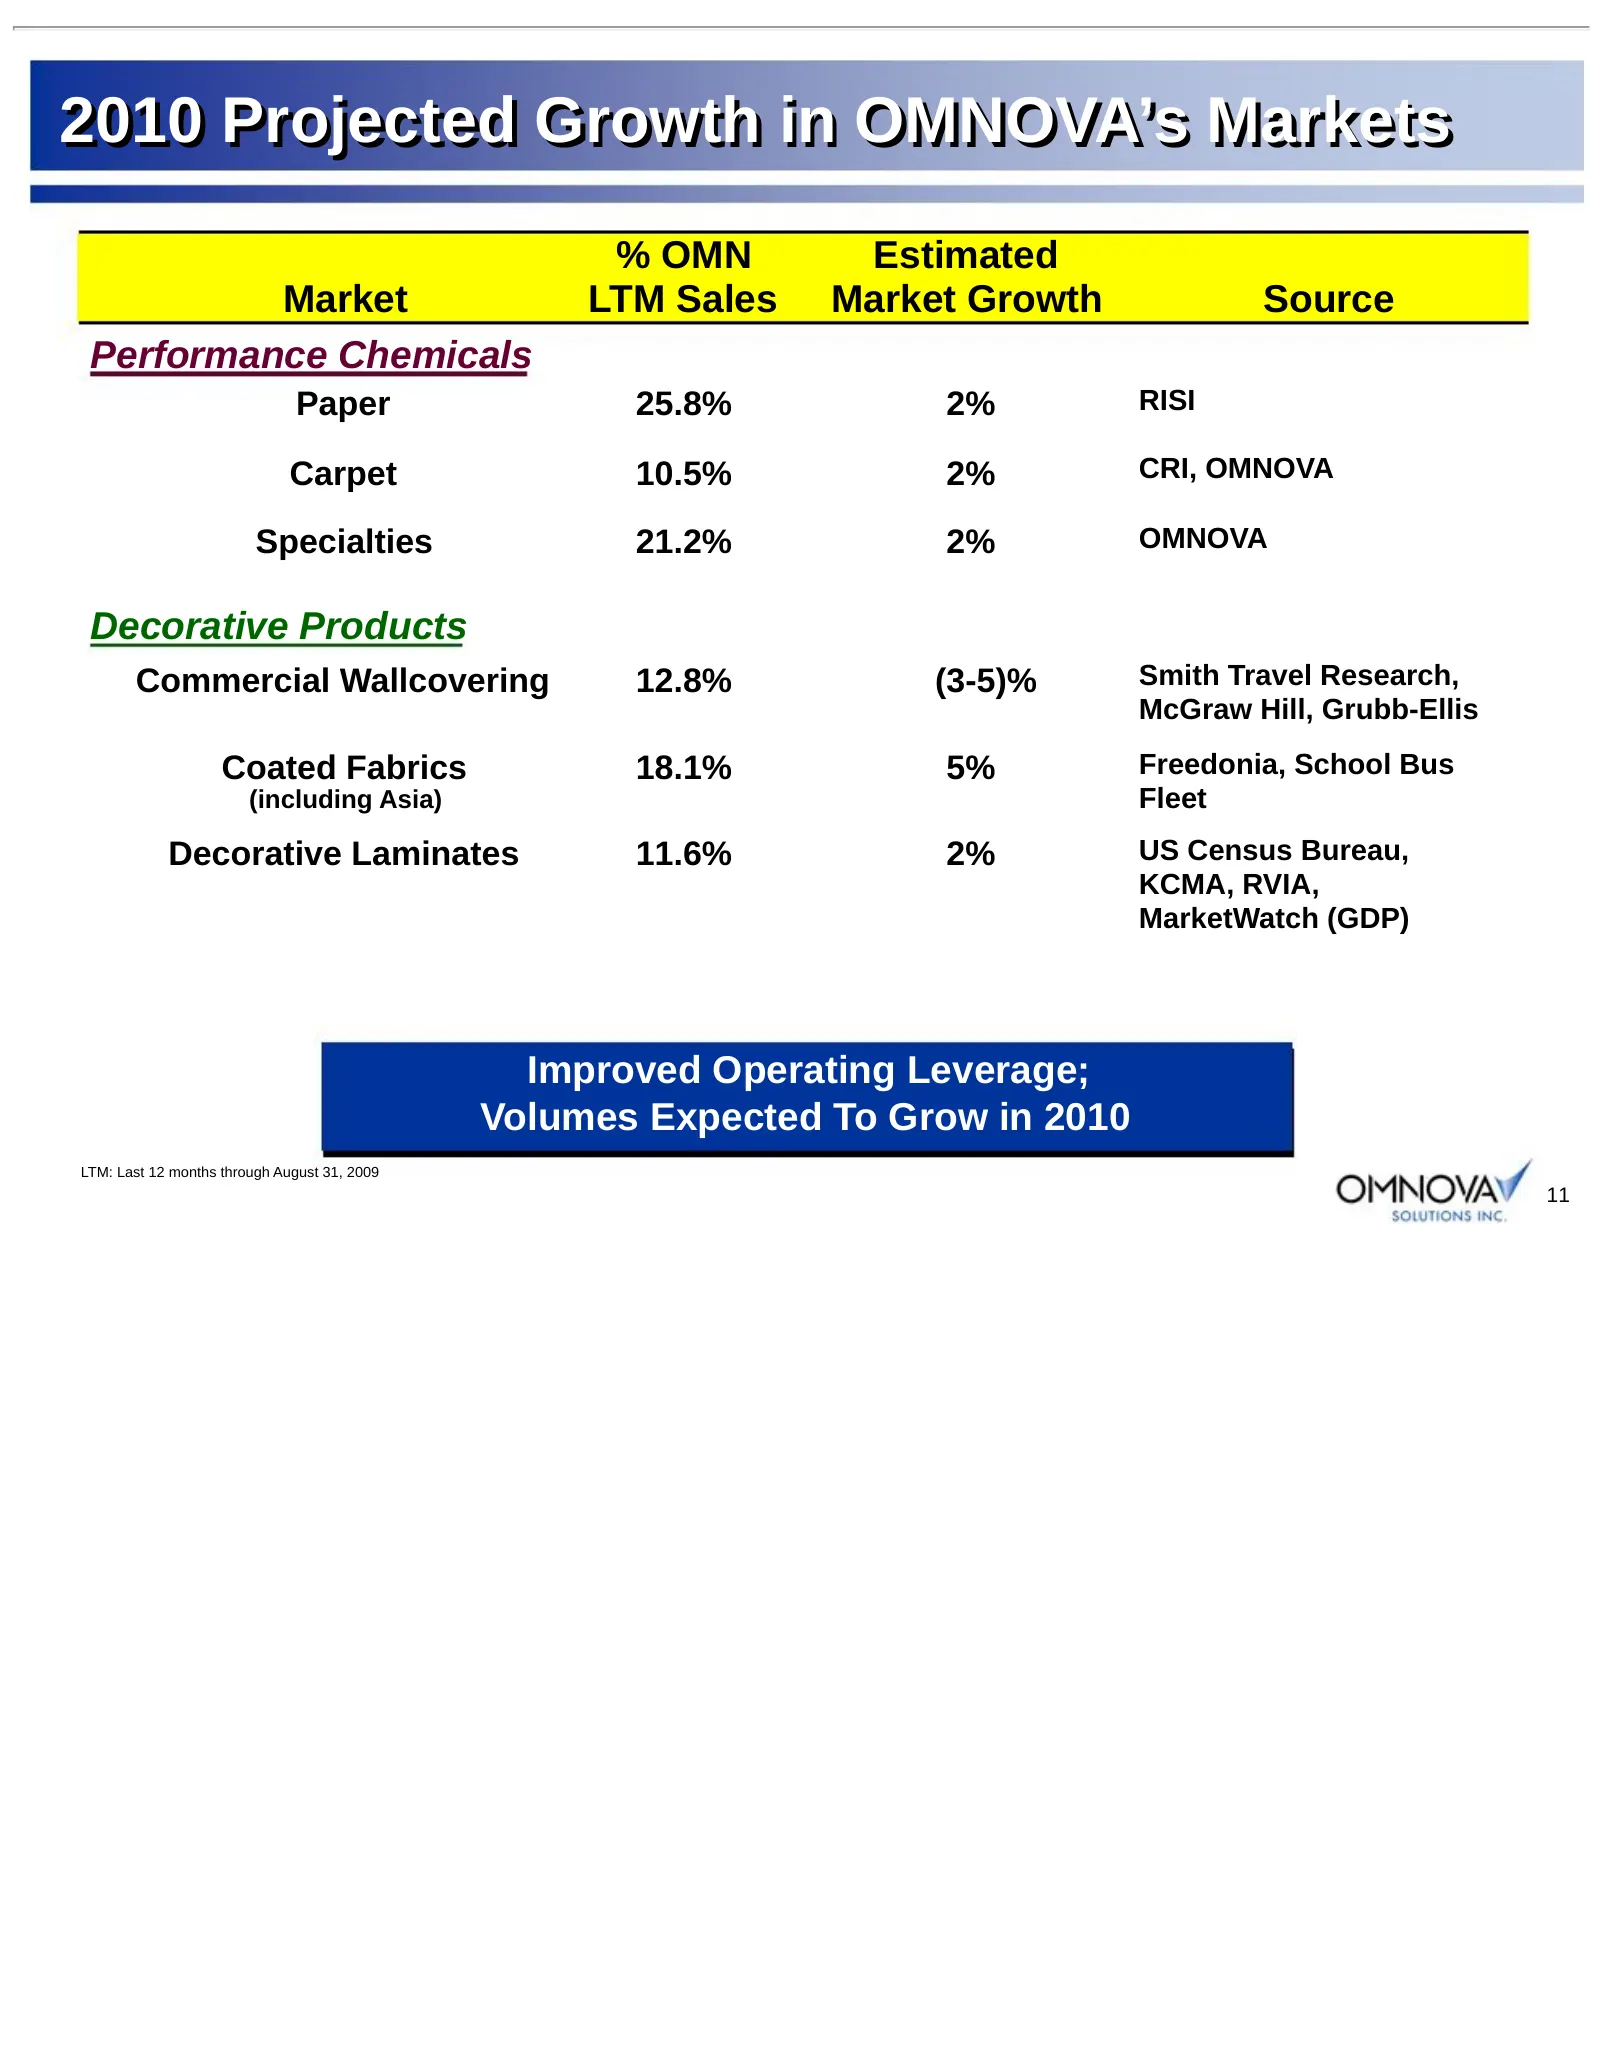
2010 Projected Growth in OMNOVA’s Markets % OMN Estimated Market LTM Sales Market Growth Source Performance Chemicals Paper 25.8% 2% RISI Carpet 10.5% 2% CRI, OMNOVA Specialties 21.2% 2% OMNOVA Decorative Products Commercial Wallcovering 12.8% (3-5)% Smith Travel Research, McGraw Hill, Grubb-Ellis C
Slide 12: Performance Chemicals Segment
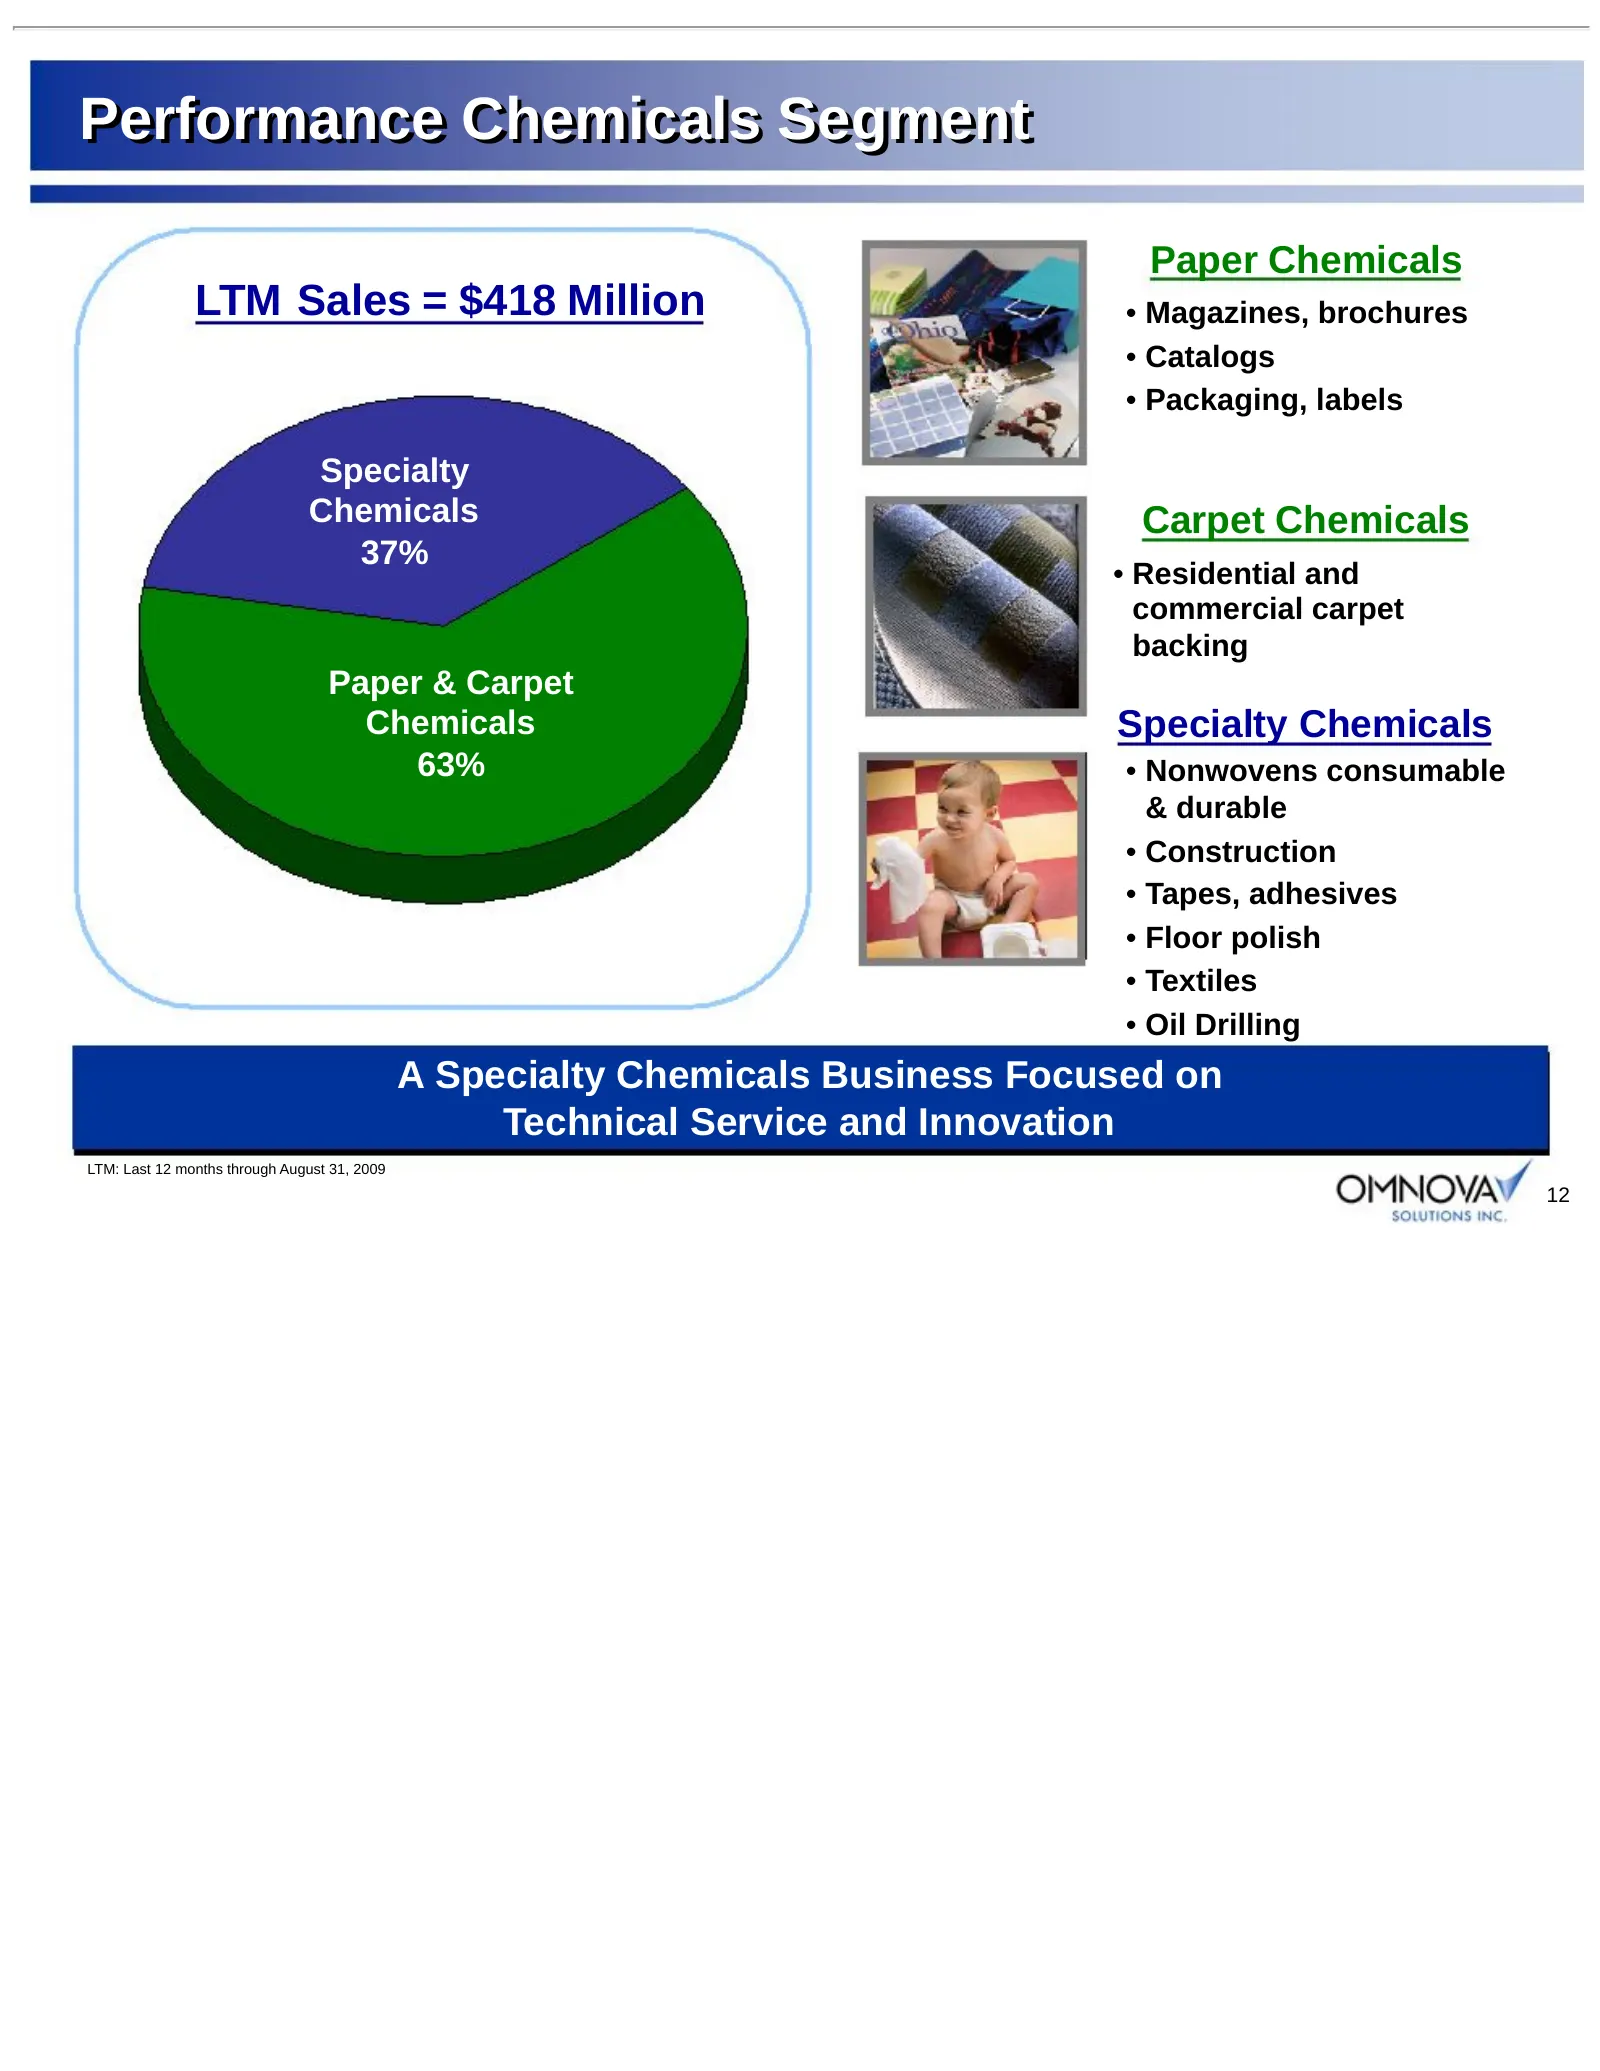
Performance Chemicals Segment Paper Chemicals LTM Sales = $418 Million • Magazines, brochures • Catalogs • Packaging, labels Specialty Chemicals Carpet Chemicals 37% • Residential and commercial carpet backing Paper & Carpet Chemicals Specialty Chemicals 63% • Nonwovens consumable & durable • Constr
Slide 13: Raw Materials – Styrene
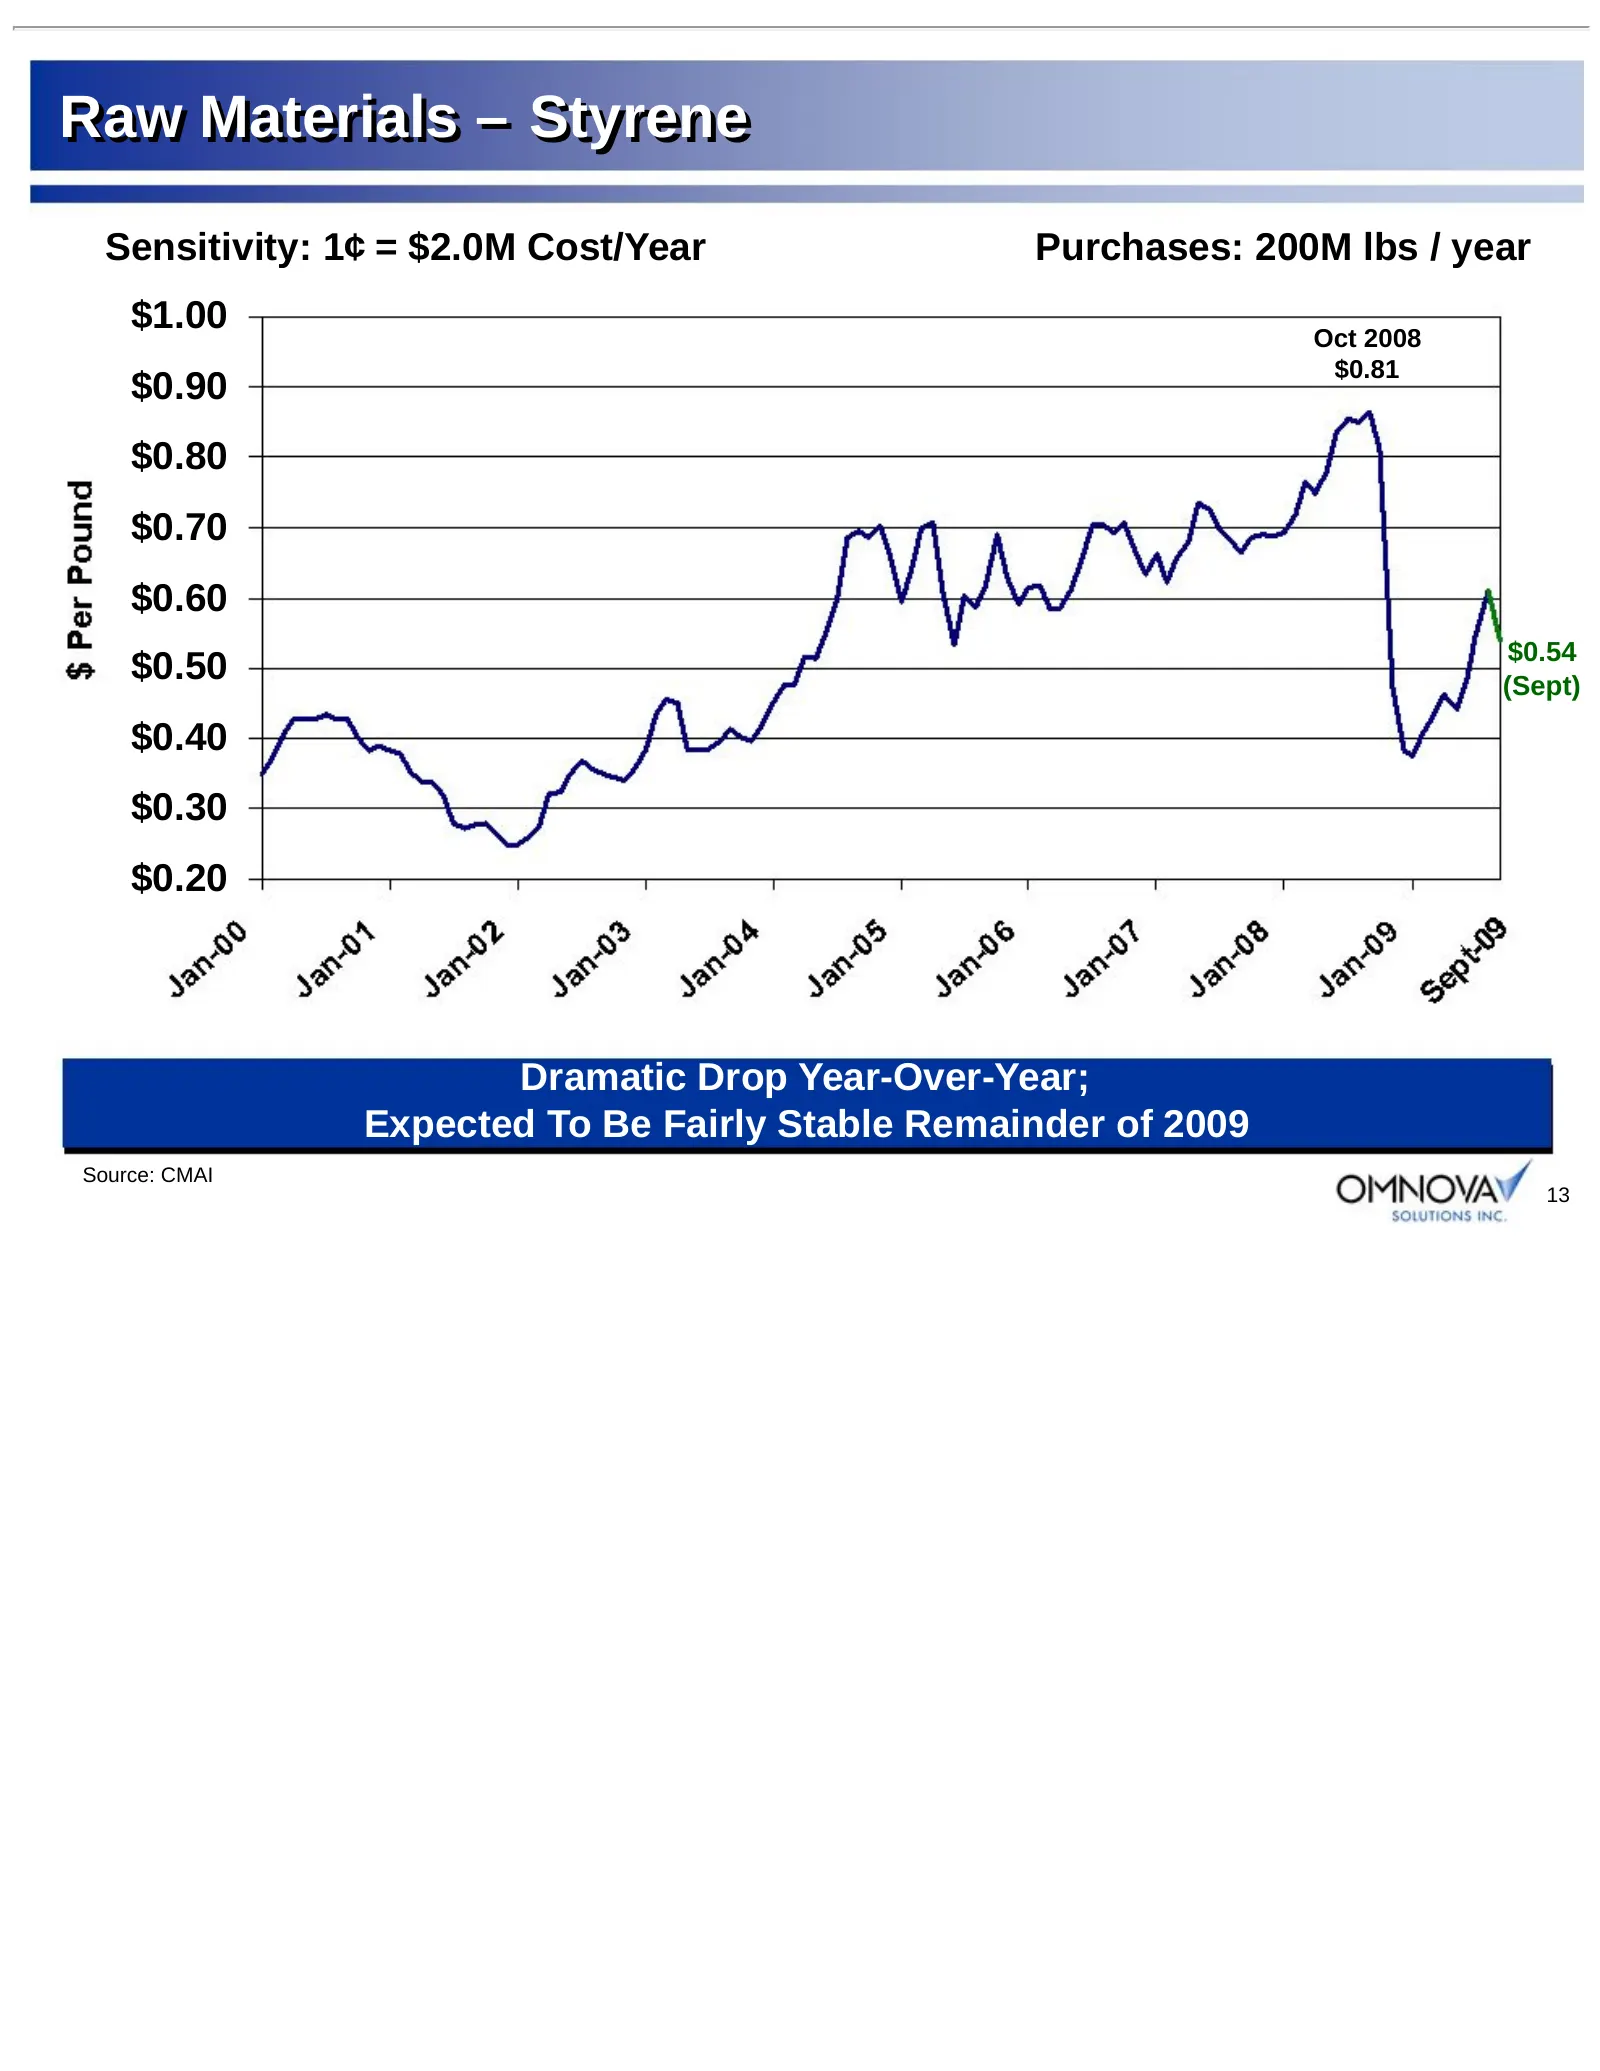
Raw Materials – Styrene Sensitivity: 1¢ = $2.0M Cost/Year Purchases: 200M lbs / year $1.00 Oct 2008 $0.81 $0.90 $0.80 $0.70 $0.60 $0.54 $0.50 (Sept) $0.40 $0.30 $0.20 Dramatic Drop Year-Over-Year; Expected To Be Fairly Stable Remainder of 2009 Source: CMAI 13
Slide 14: Raw Materials – Butadiene
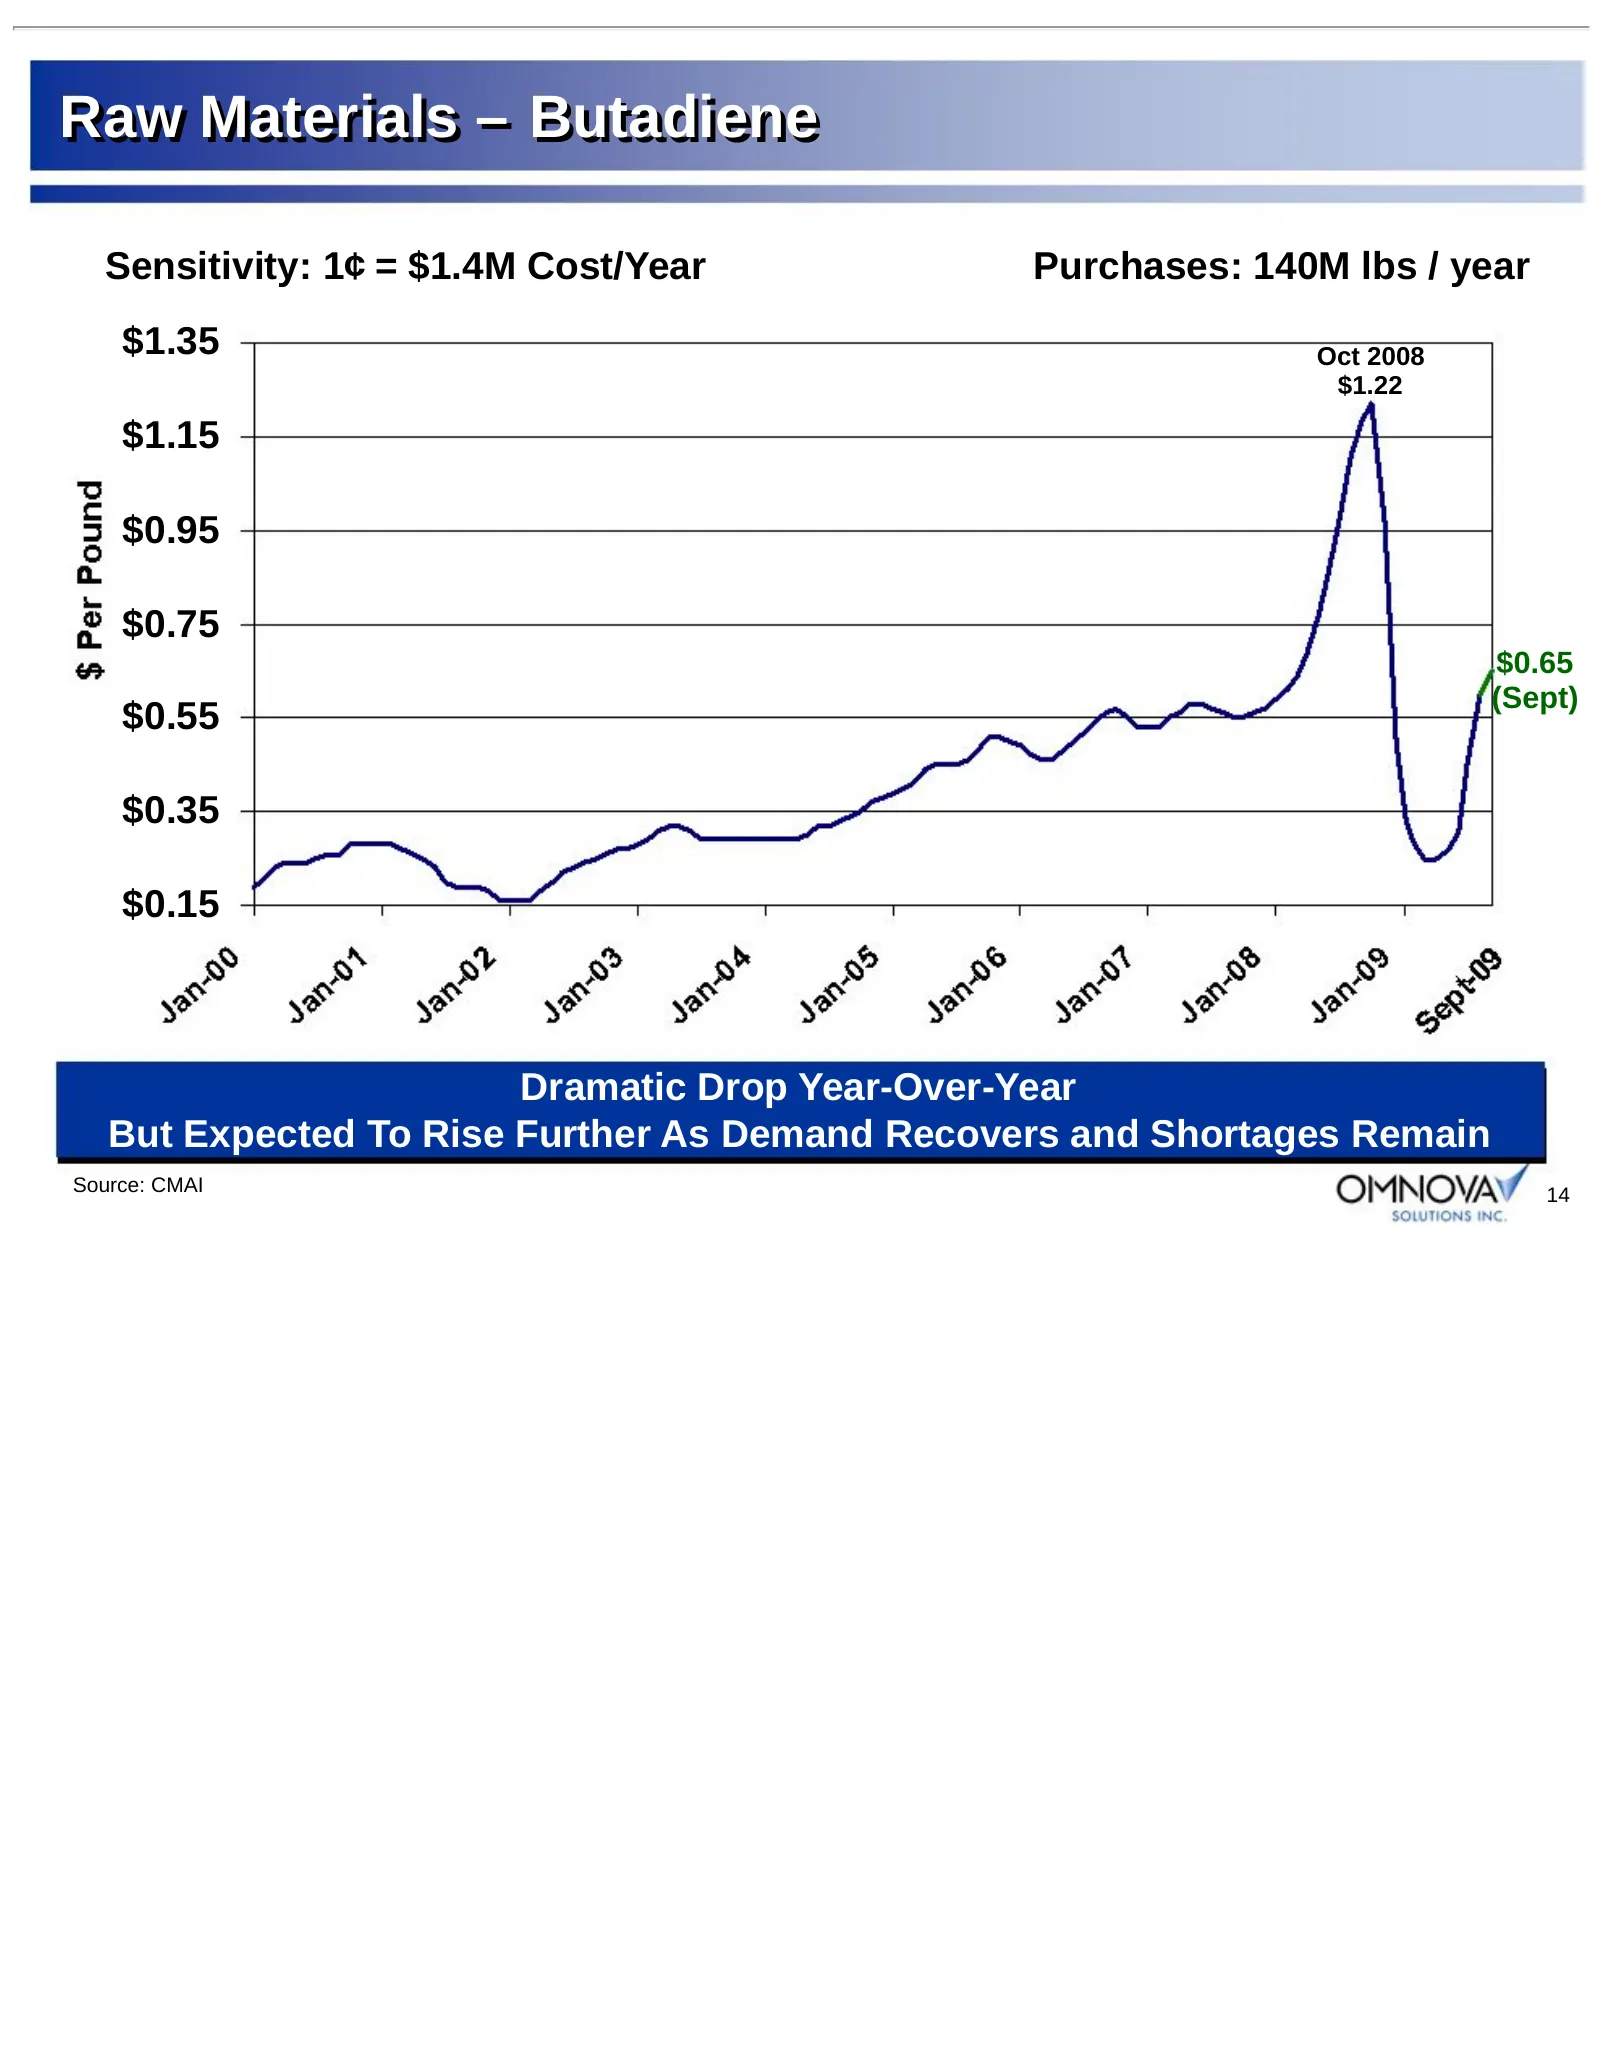
Raw Materials – Butadiene Sensitivity: 1¢ = $1.4M Cost/Year Purchases: 140M lbs / year $1.35 Oct 2008 $1.22 $1.15 $0.95 $0.75 $0.65 (Sept) $0.55 $0.35 $0.15 Dramatic Drop Year-Over-Year But Expected To Rise Further As Demand Recovers and Shortages Remain Source: CMAI 14
Slide 15: Performance Chemicals: North American SB Consolidation
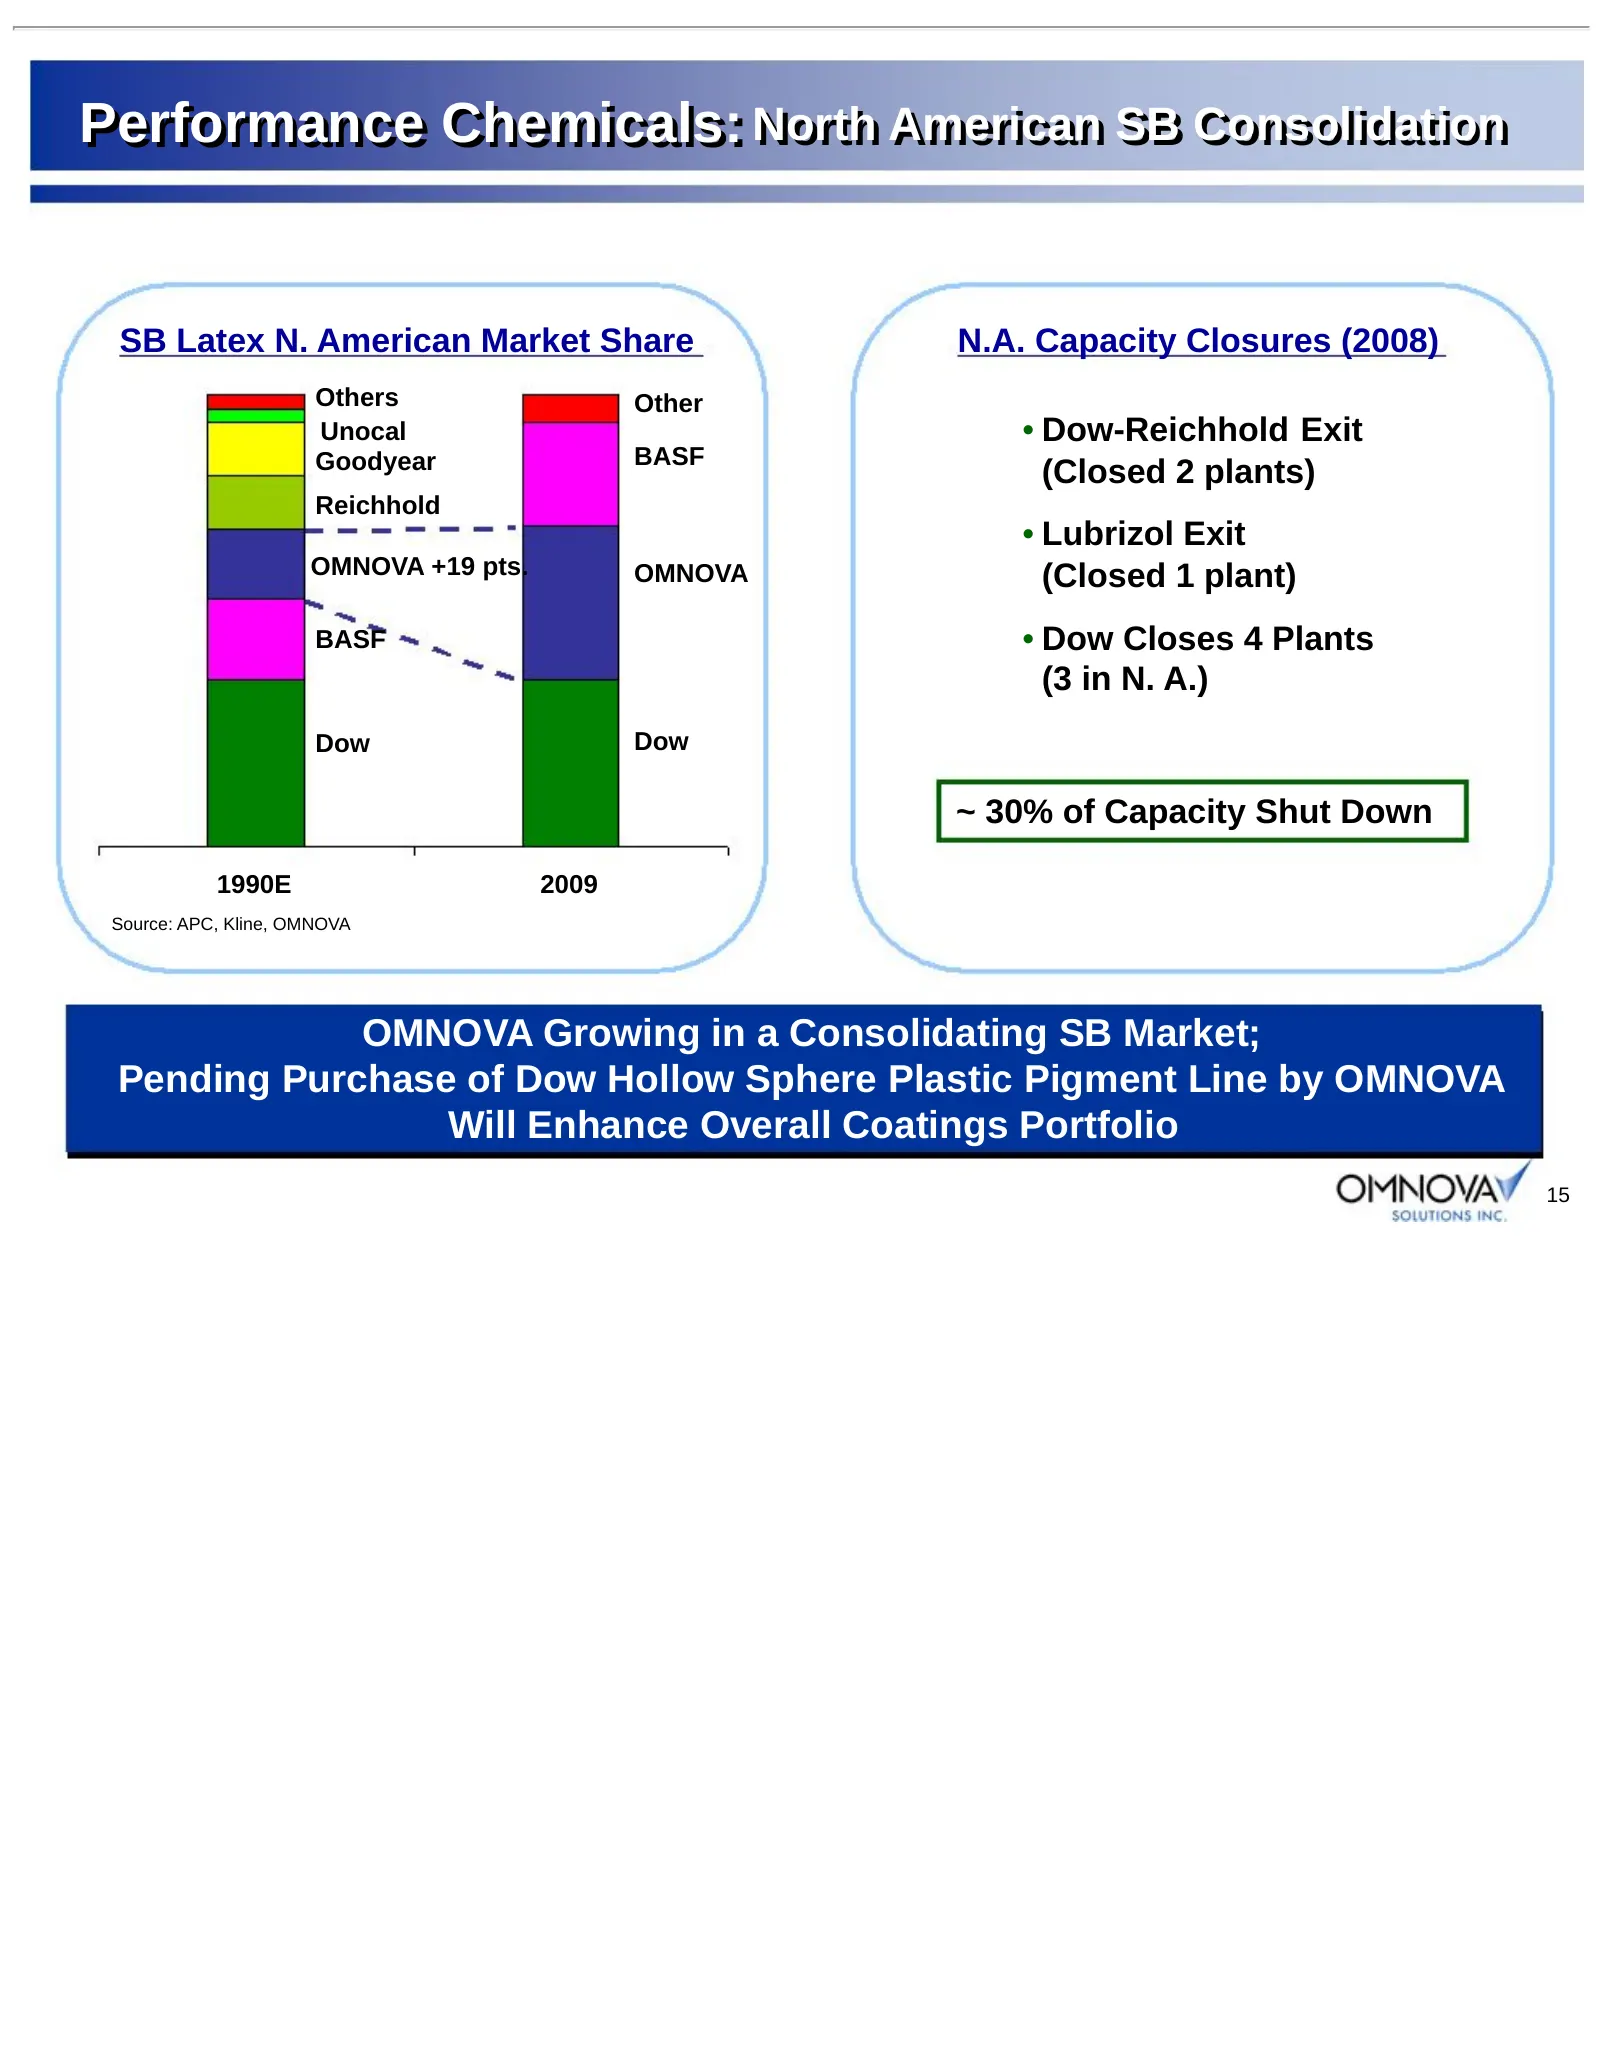
Performance Chemicals: North North American American SB SB Consolidation Consolidation SB Latex N. American Market Share N.A. Capacity Closures (2008) Others Other Unocal • Dow-Reichhold Exit Goodyear BASF (Closed 2 plants) Reichhold • Lubrizol Exit OMNOVA +19 pts. OMNOVA (Closed 1 plant) BASF • Dow
Slide 16: Performance Chemicals – New Product Examples
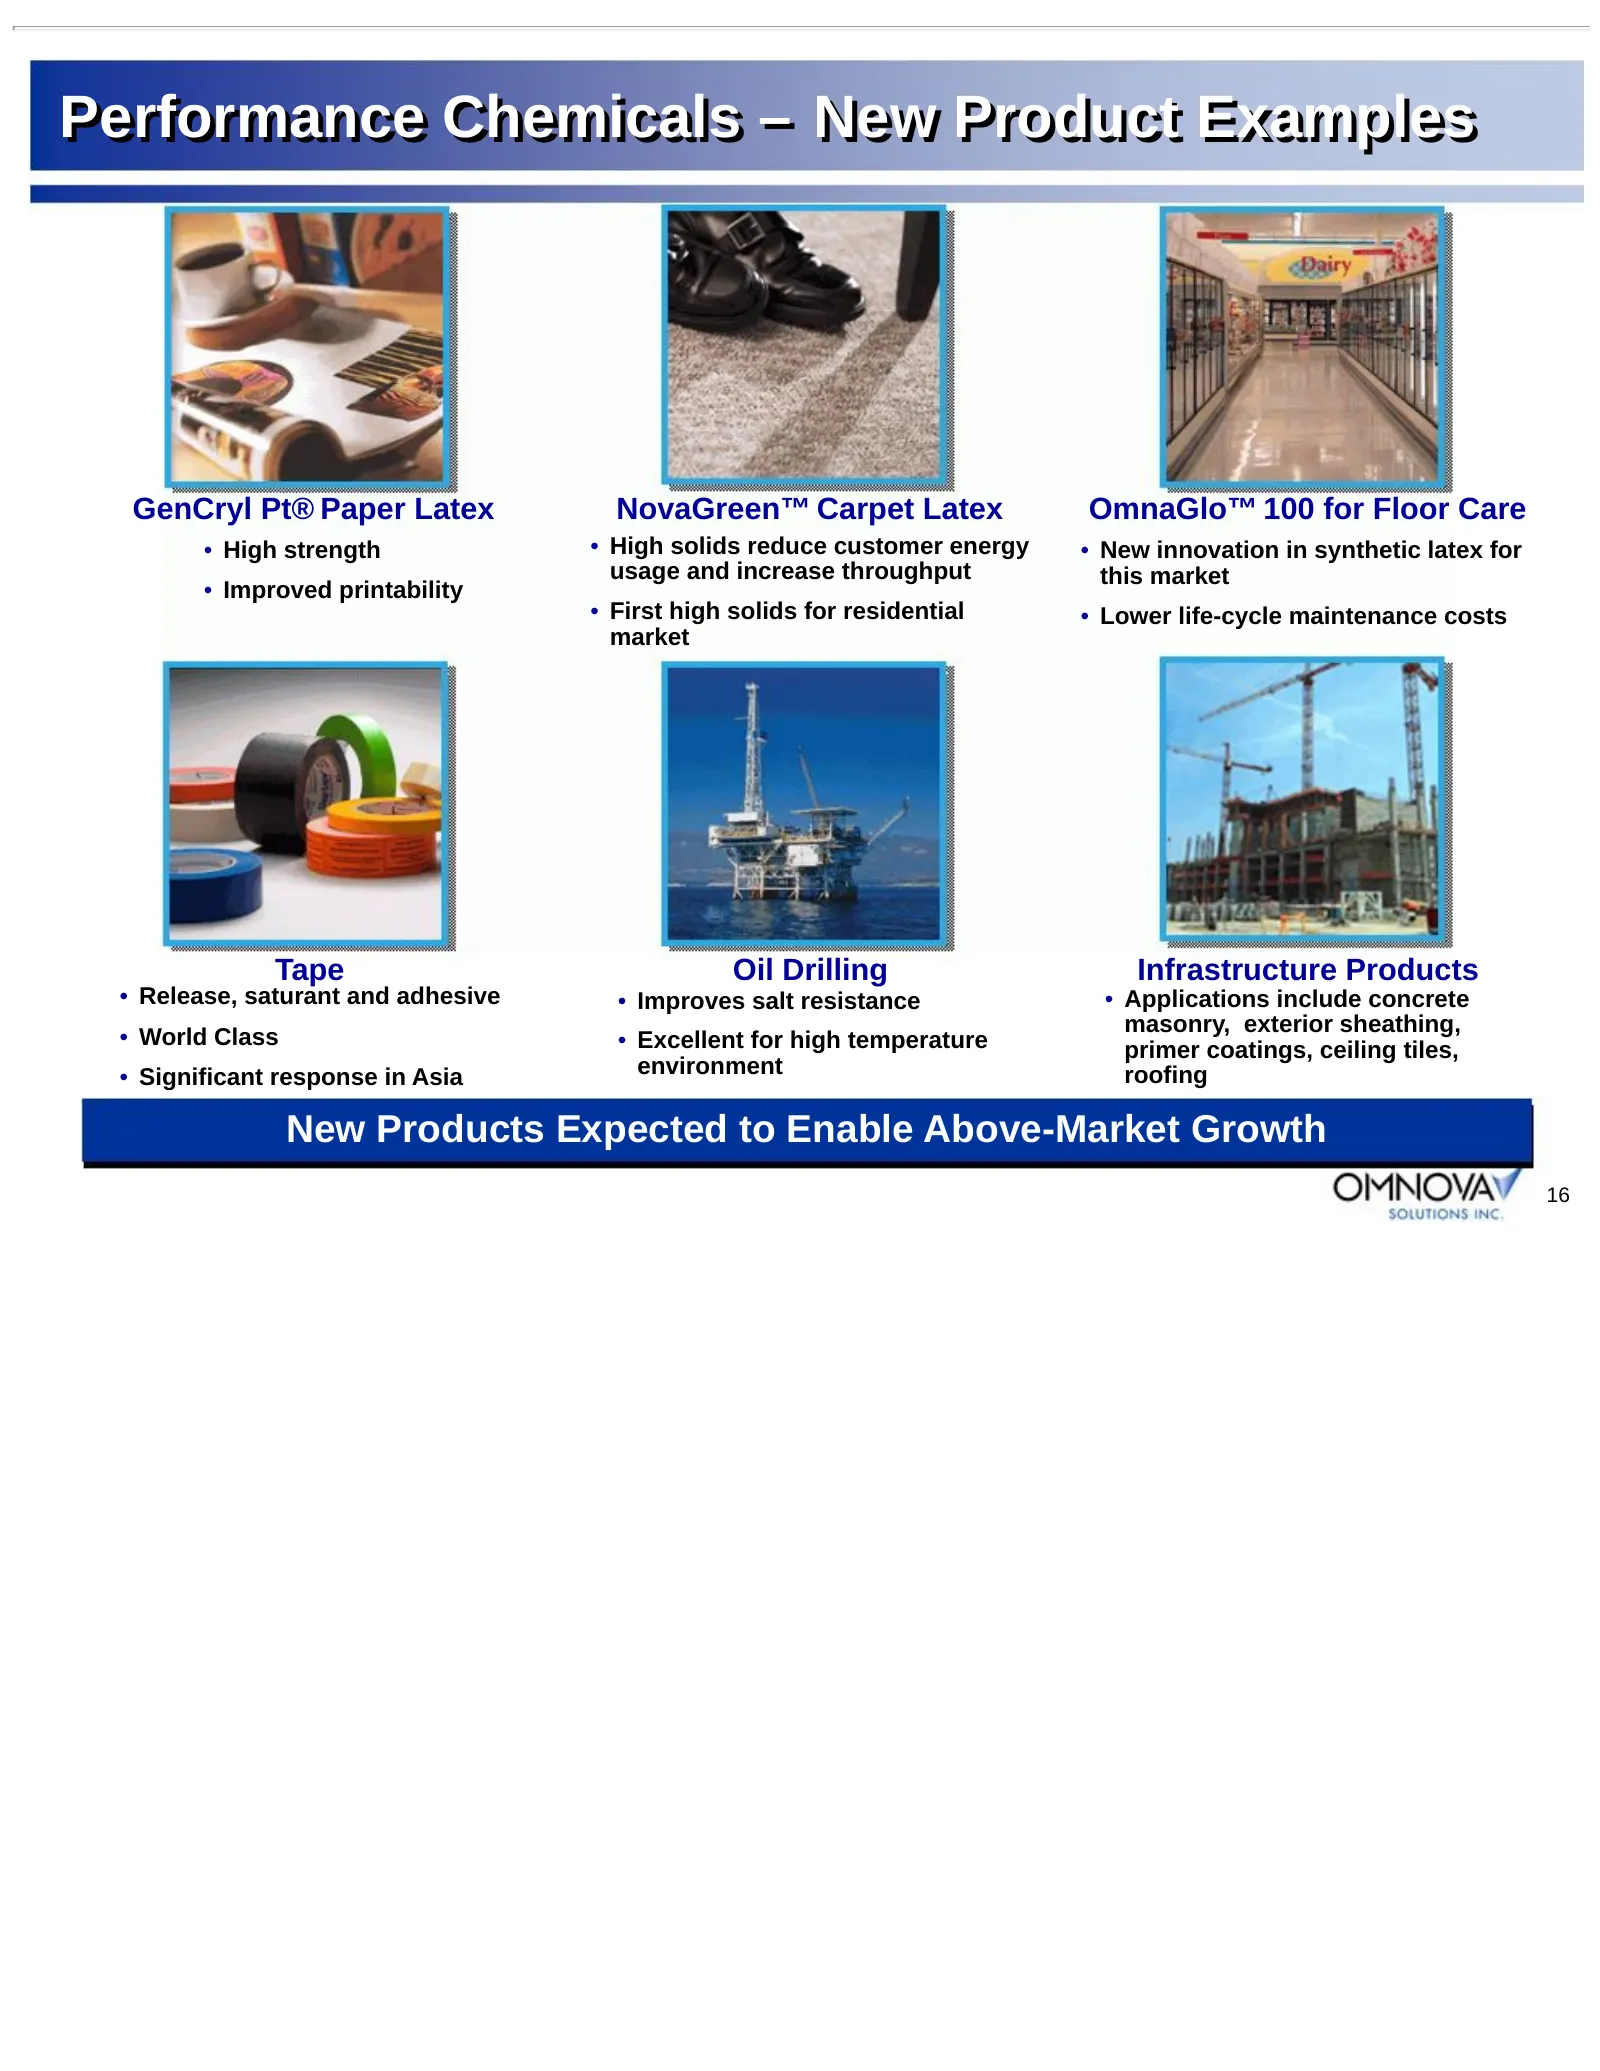
Performance Chemicals – New Product Examples GenCryl Pt® Paper Latex NovaGreen™ Carpet Latex OmnaGlo™ 100 for Floor Care • High strength • High solids reduce customer energy • New innovation in synthetic latex for usage and increase throughput this market • Improved printability • First high solids
Slide 17: Decorative Products Segment
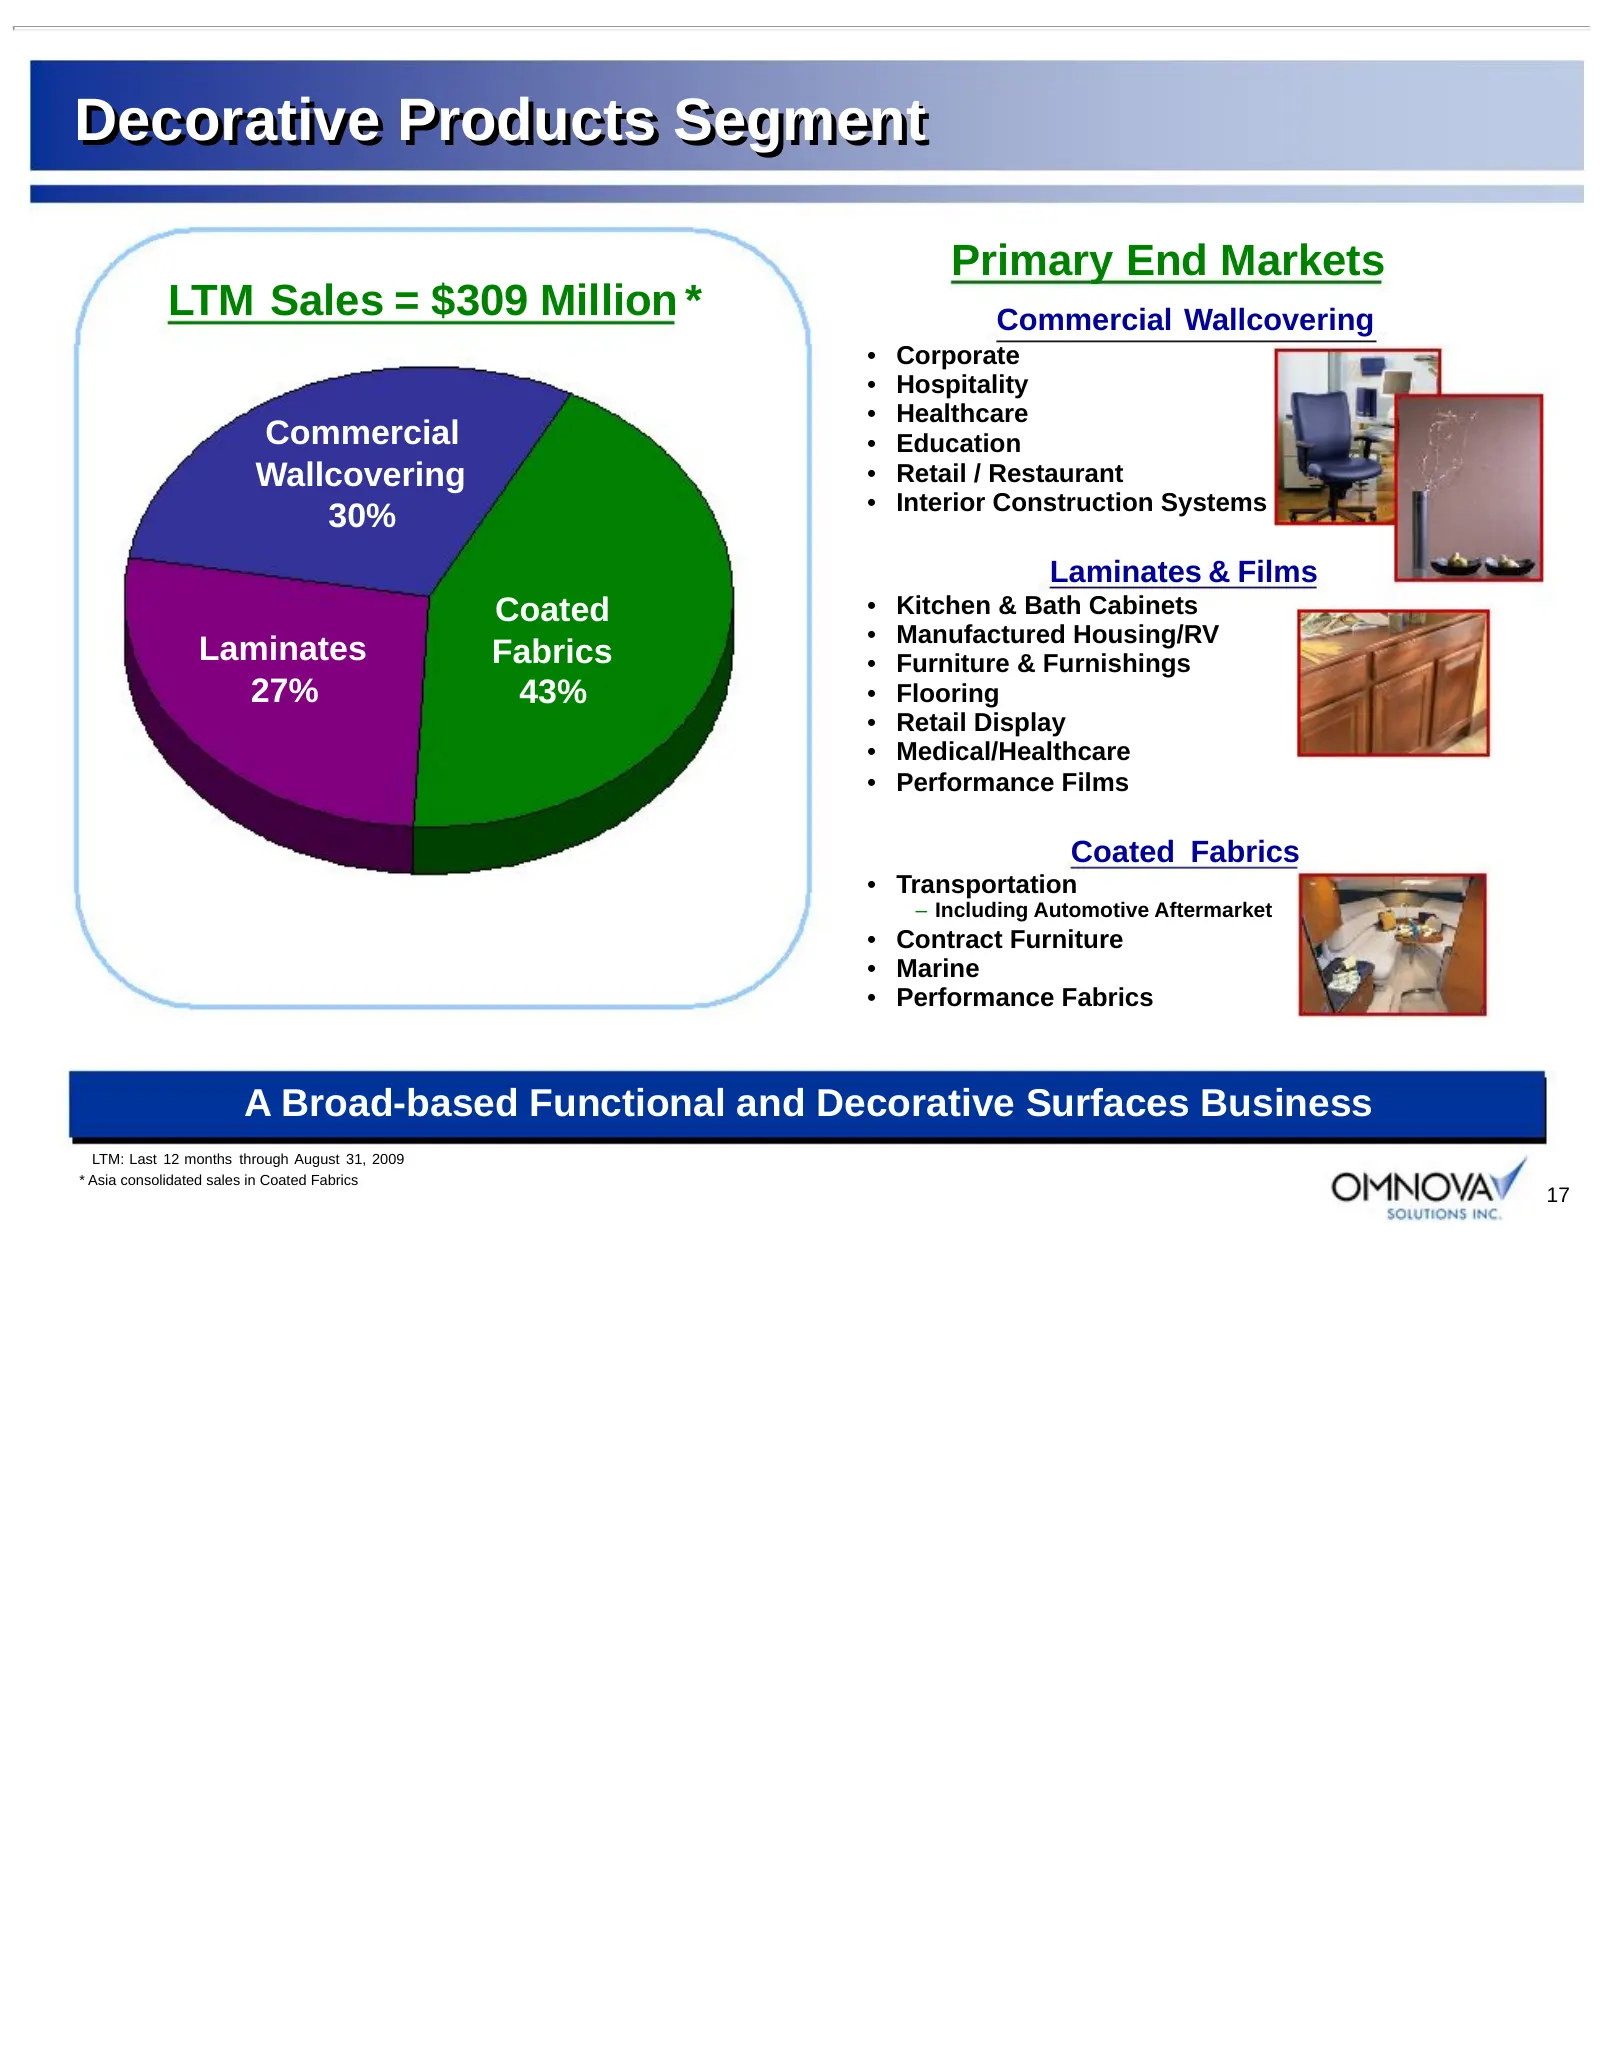
Decorative Products Segment Primary End Markets LTM Sales = $309 Million * Commercial Wallcovering • Corporate • Hospitality • Healthcare Commercial • Education Wallcovering • Retail / Restaurant • Interior Construction Systems 30% Laminates & Films Coated • Kitchen & Bath Cabinets • Manufactured Ho
Slide 18: Decorative Products
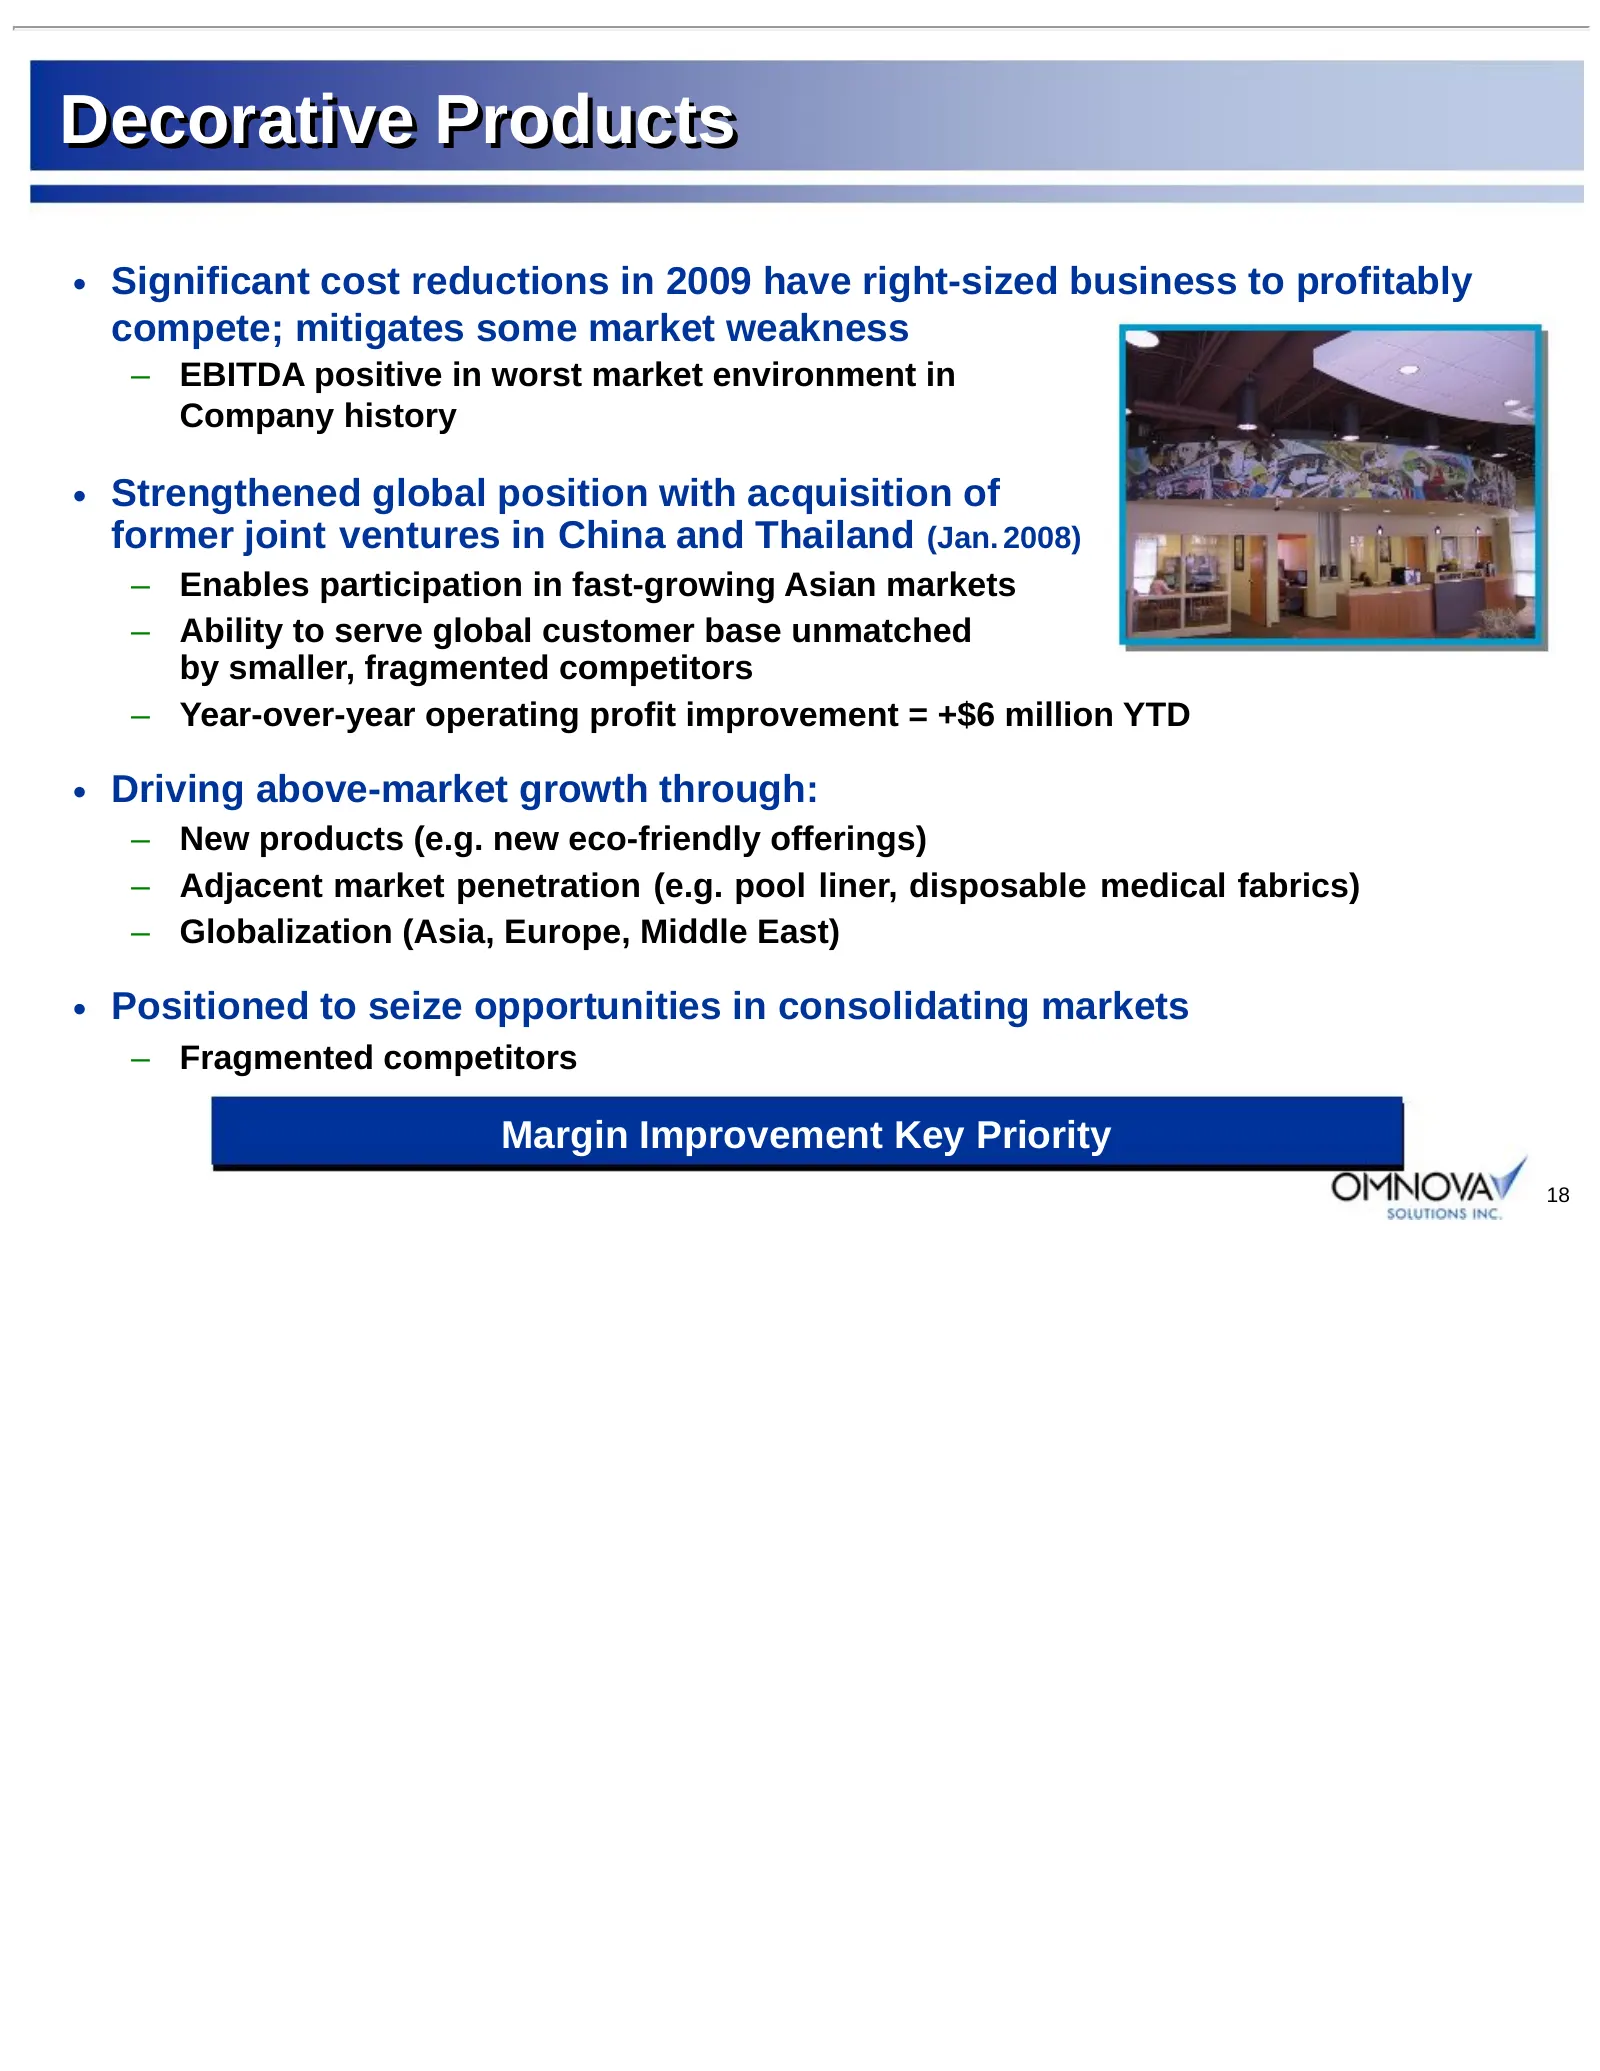
Decorative Products • Significant cost reductions in 2009 have right-sized business to profitably compete; mitigates some market weakness – EBITDA positive in worst market environment in Company history • Strengthened global position with acquisition of former joint ventures in China and Thailand (J
Slide 19: Competitive Landscape – Recent Competitor Exits
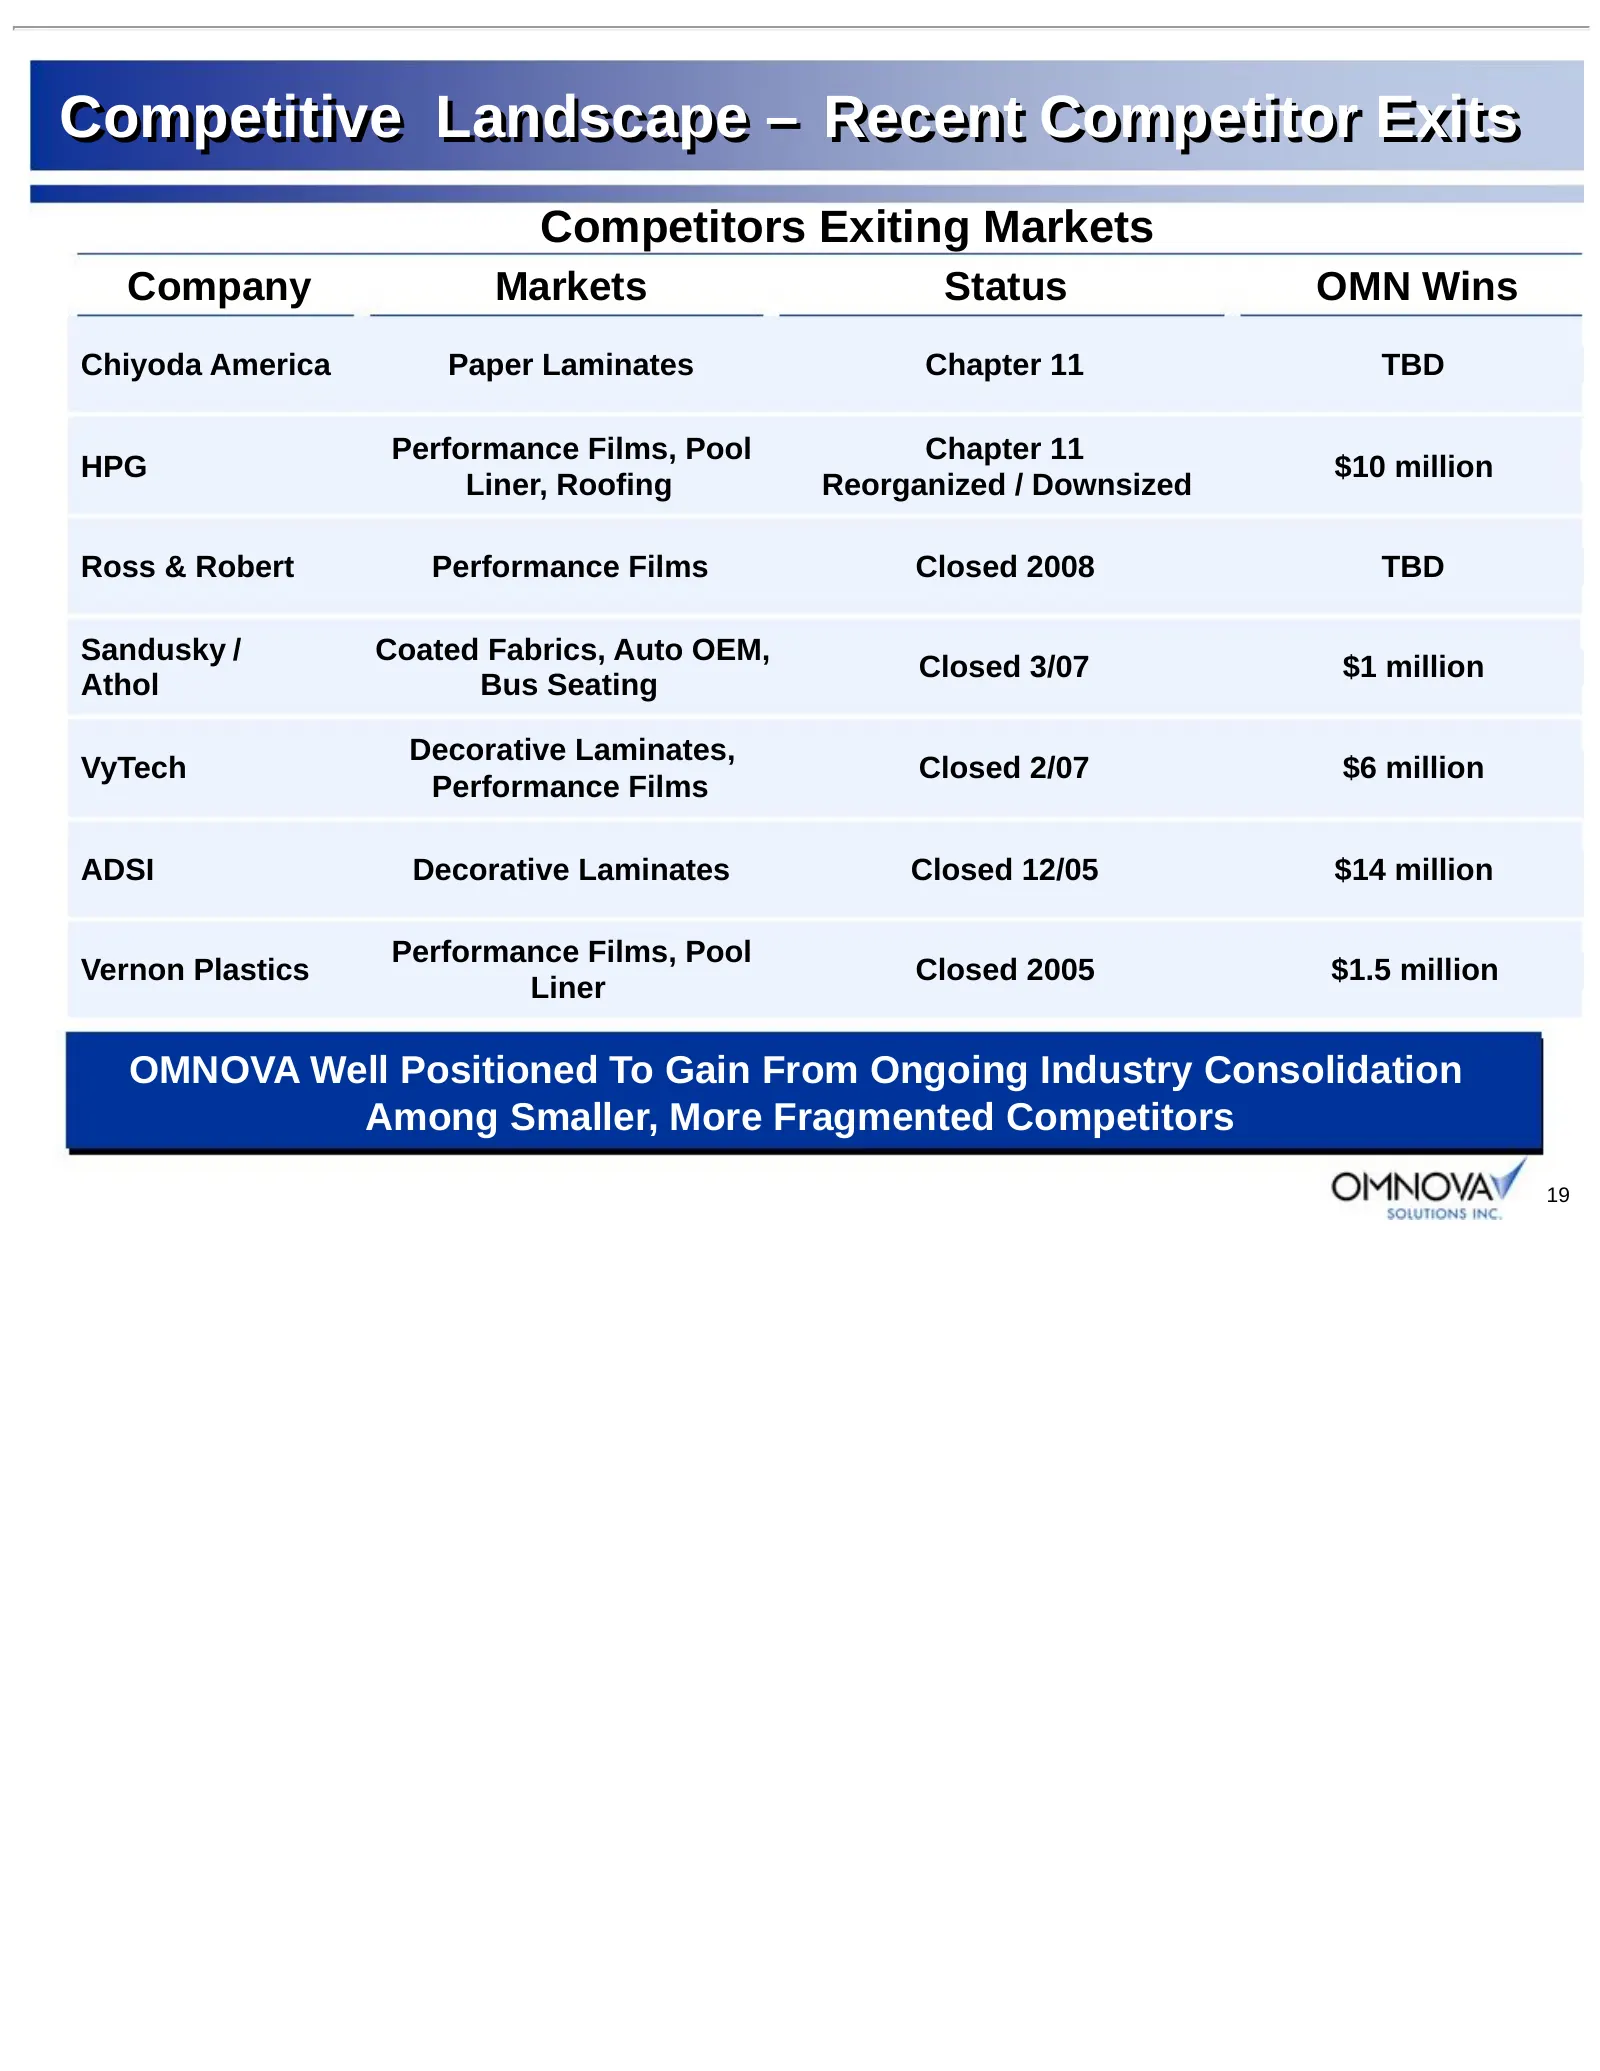
Competitive Landscape – Recent Competitor Exits Competitors Exiting Markets Company Markets Status OMN Wins Chiyoda America Paper Laminates Chapter 11 TBD Performance Films, Pool Chapter 11 HPG $10 million Liner, Roofing Reorganized / Downsized Ross & Robert Performance Films Closed 2008 TBD Sandusk
Slide 20: Decorative Products – New Product Examples
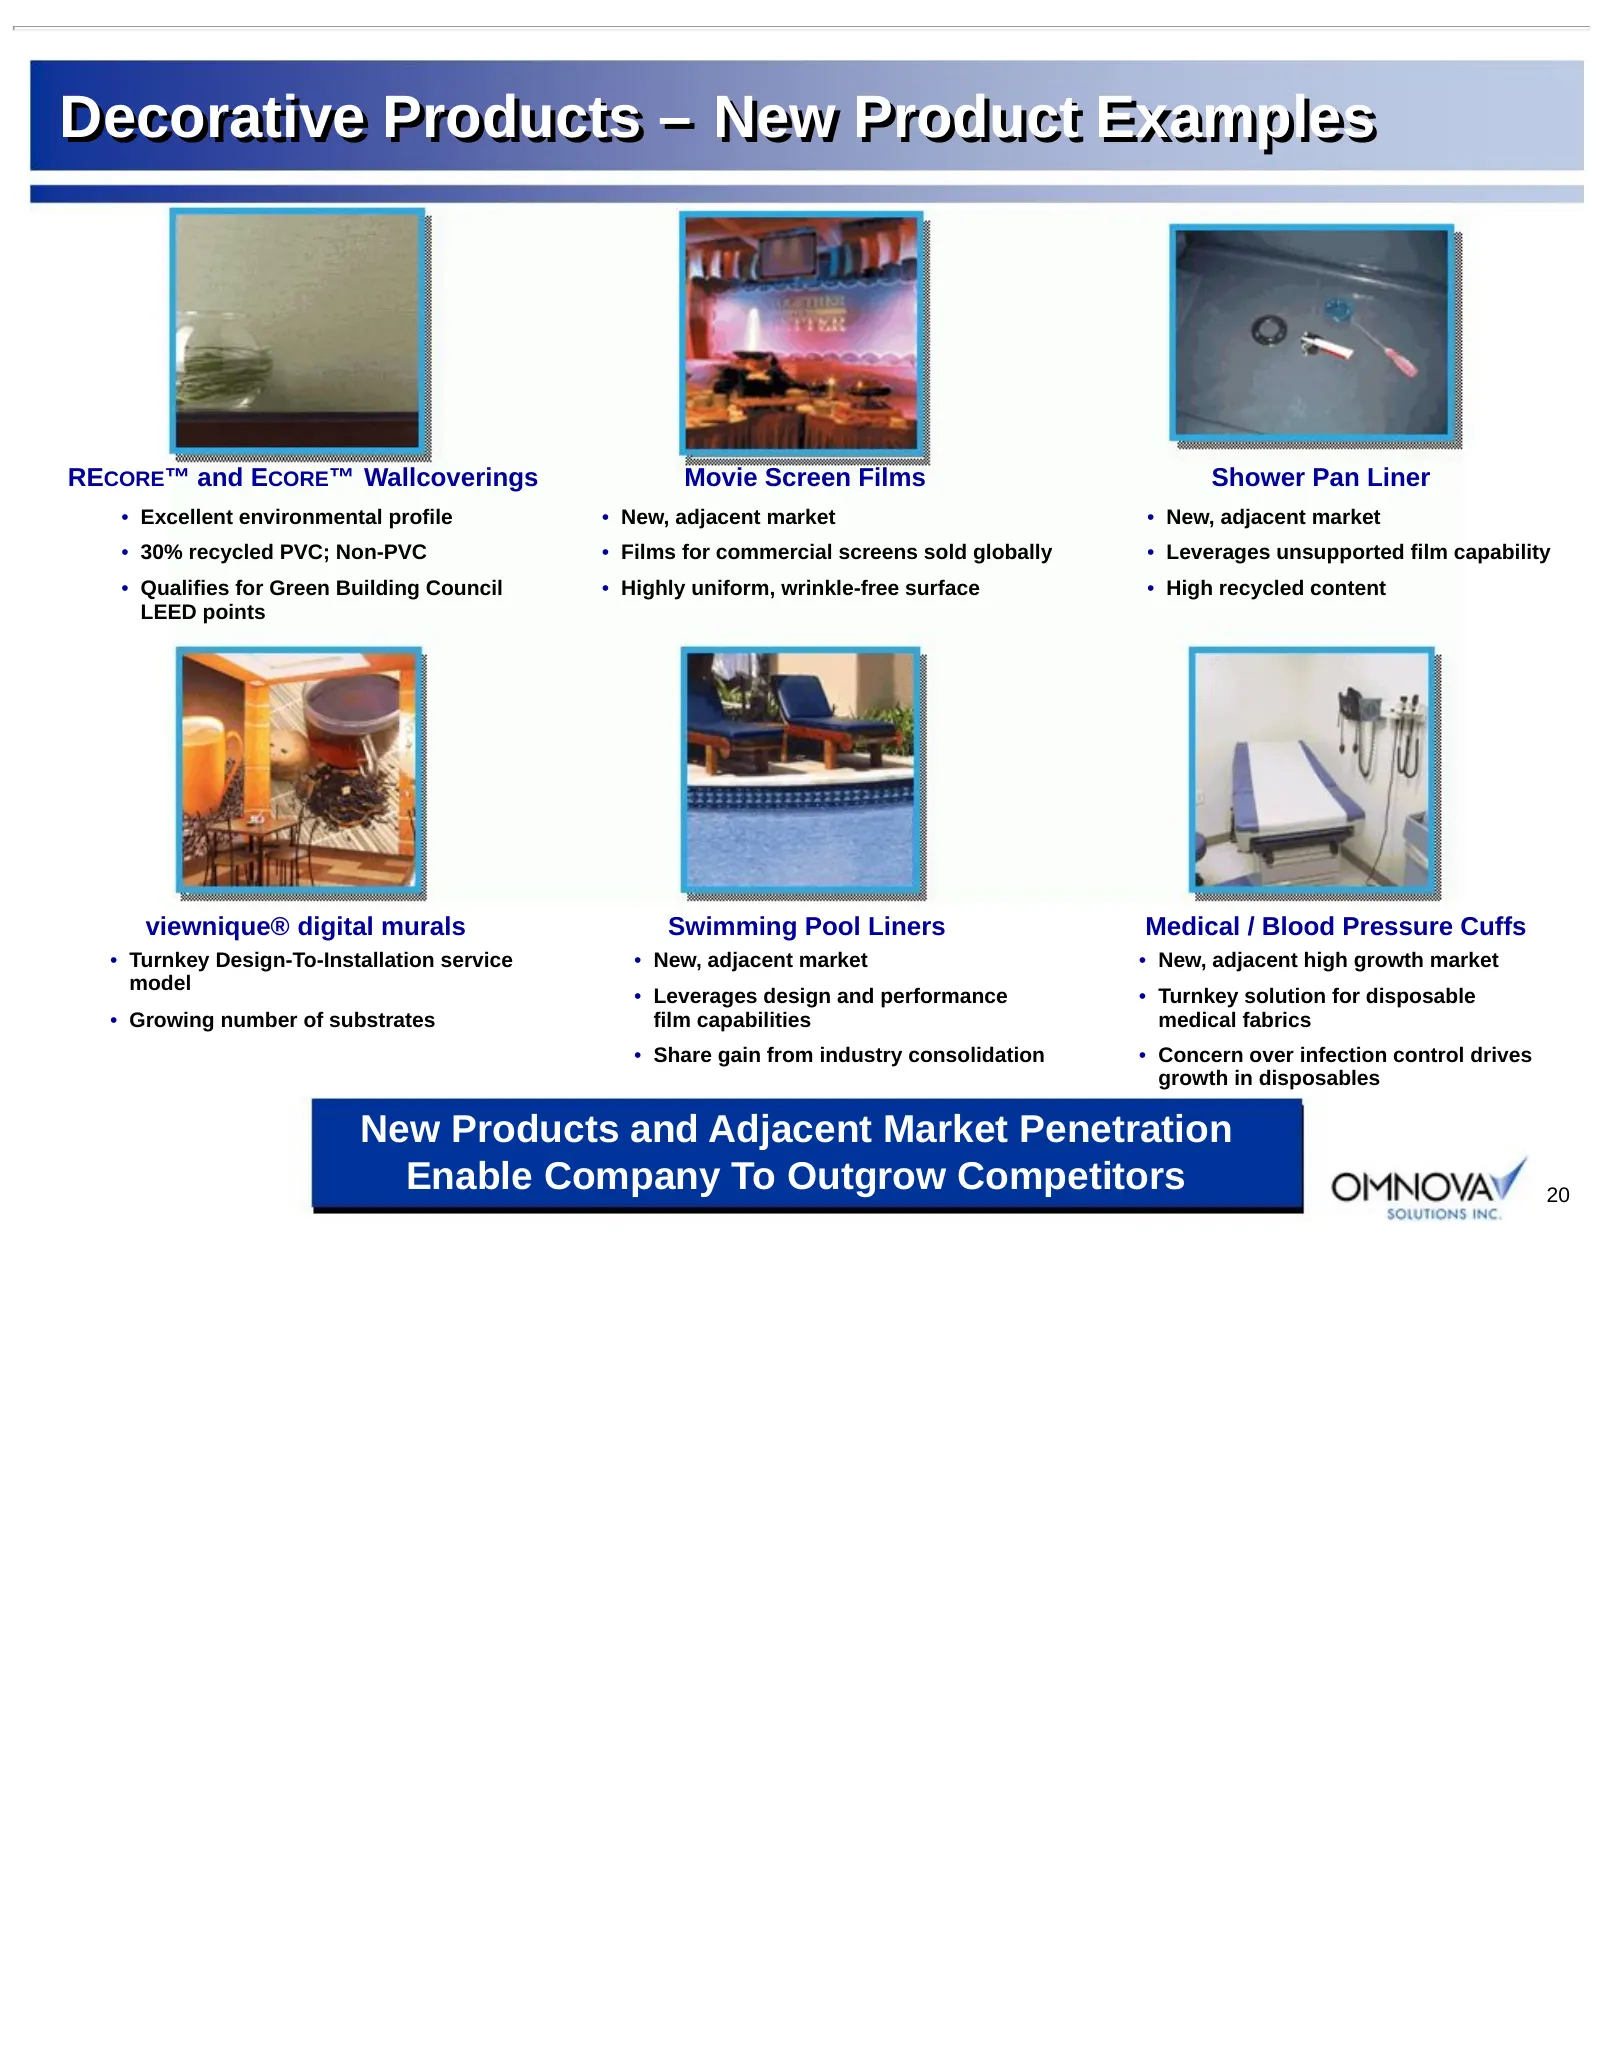
Decorative Products – New Product Examples RECORE™ and ECORE™ Wallcoverings Movie Screen Films Shower Pan Liner • Excellent environmental profile • New, adjacent market • New, adjacent market • 30% recycled PVC; Non-PVC • Films for commercial screens sold globally • Leverages unsupported film capabi
Slide 21: Why Invest In OMNOVA?
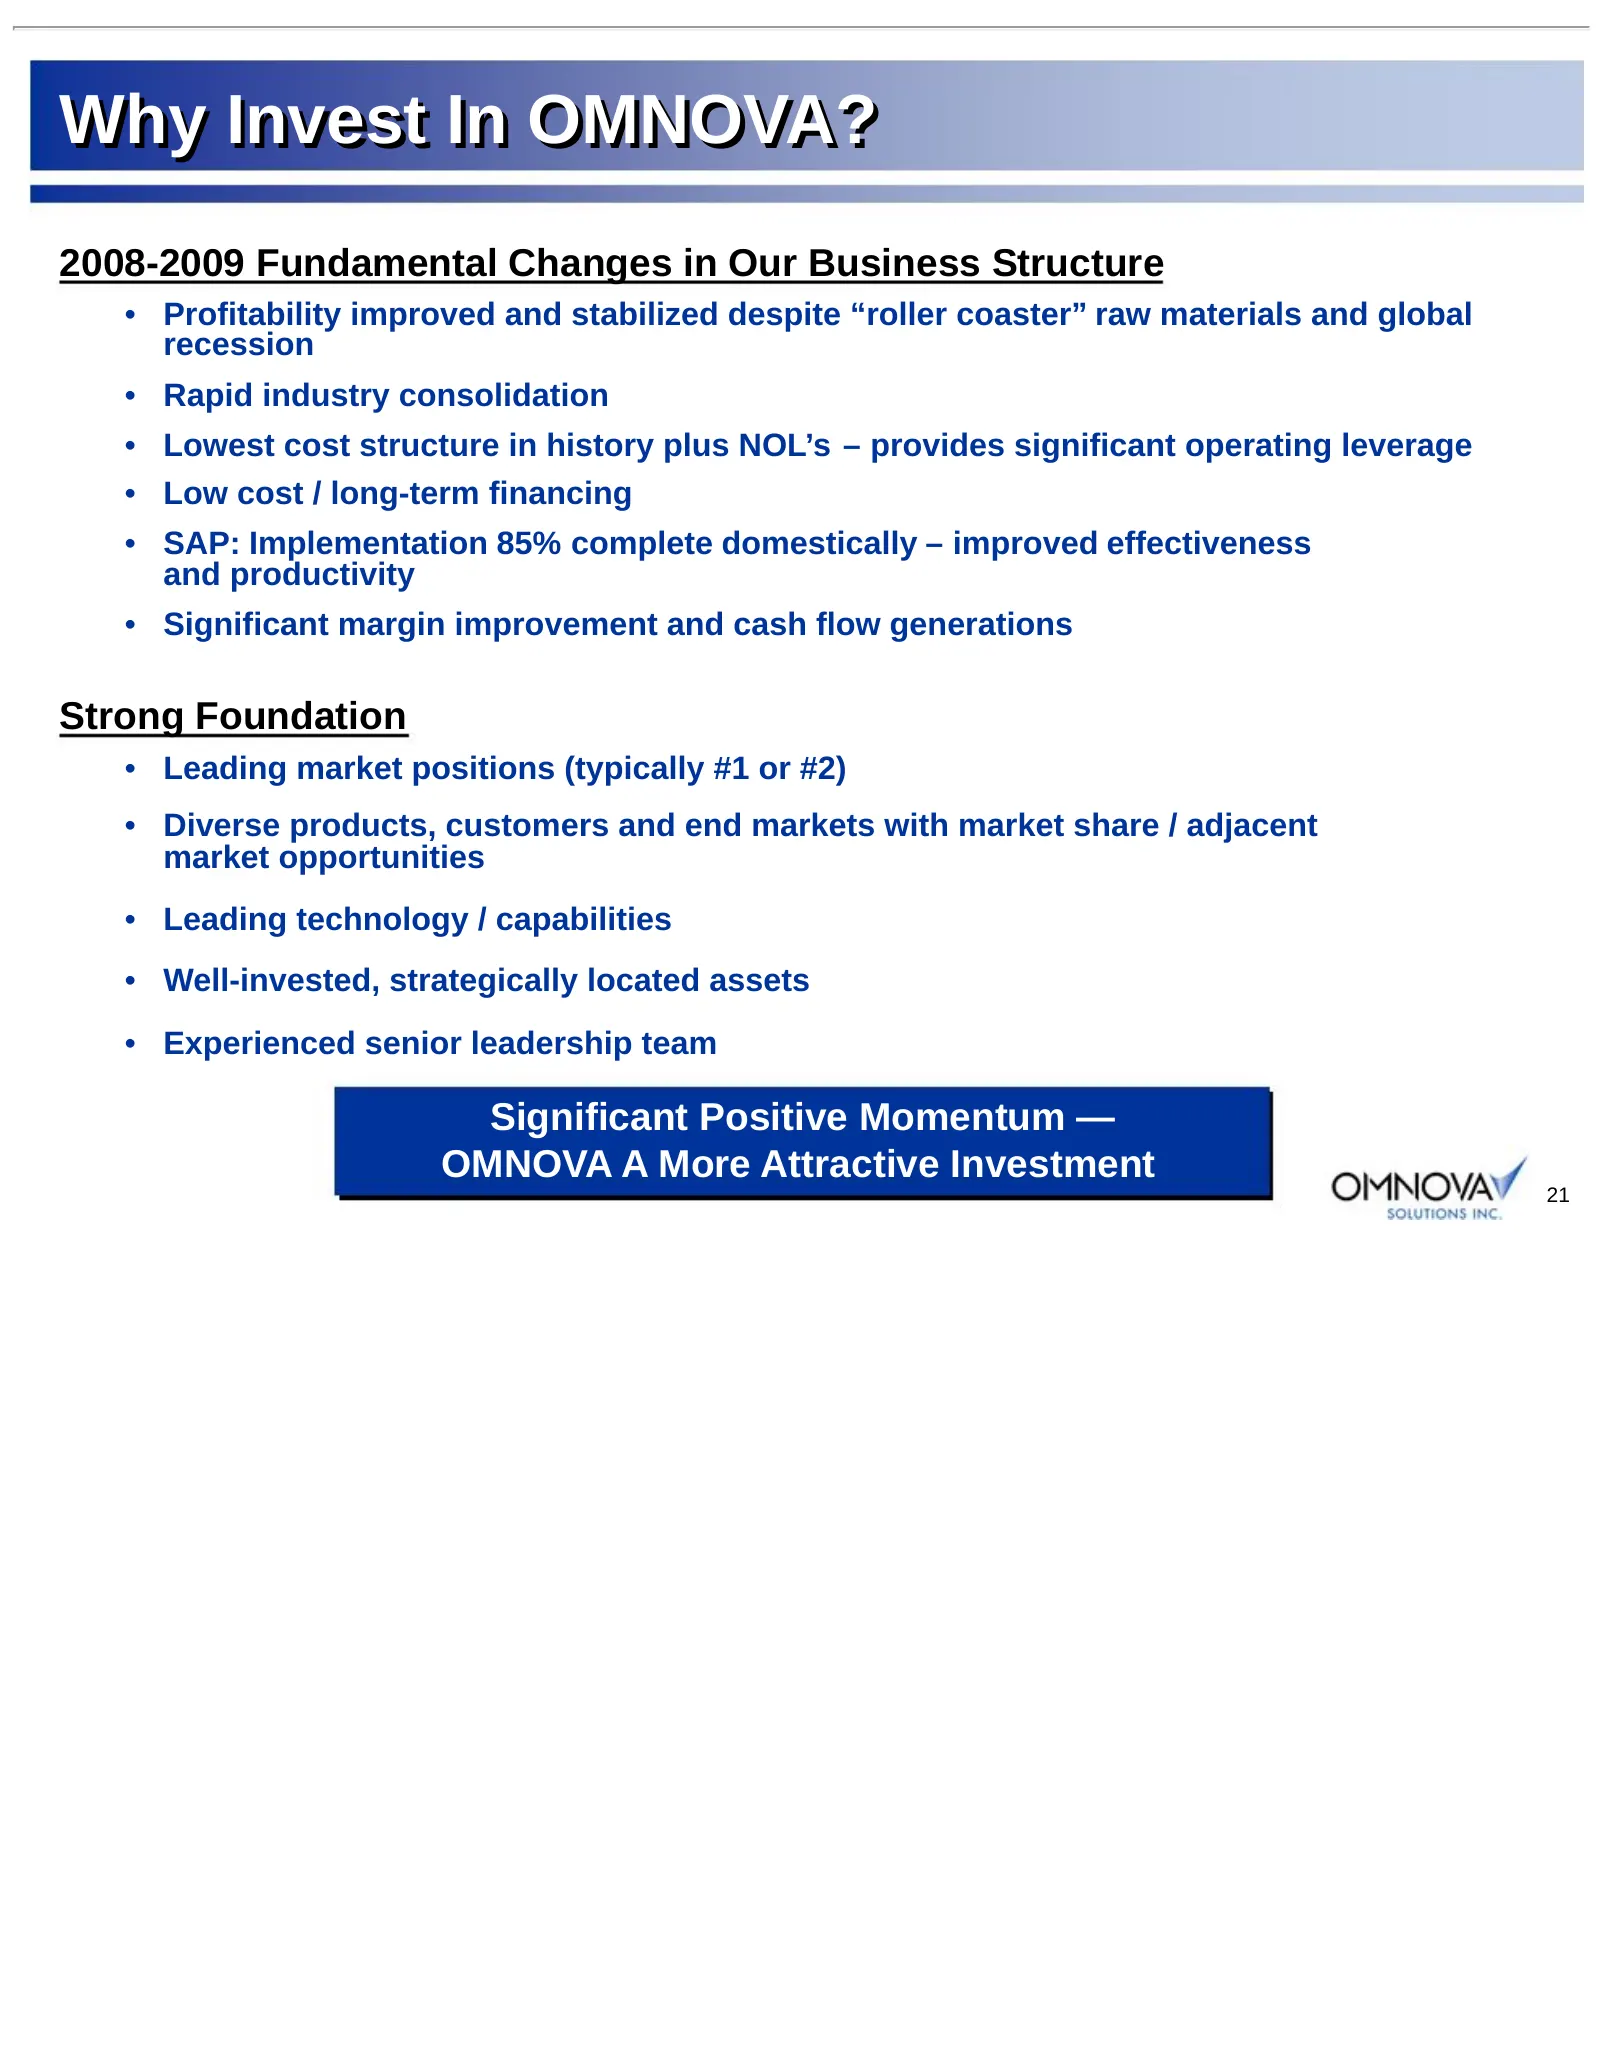
Why Invest In OMNOVA? 2008-2009 Fundamental Changes in Our Business Structure • Profitability improved and stabilized despite “roller coaster” raw materials and global recession • Rapid industry consolidation • Lowest cost structure in history plus NOL’s – provides significant operating leverage • L
Slide 22: Appendix
Appendix OMNOVAY 2. SOLUTIONS INC.
Slide 23: Appendix — Non-GAAP Financial Measures
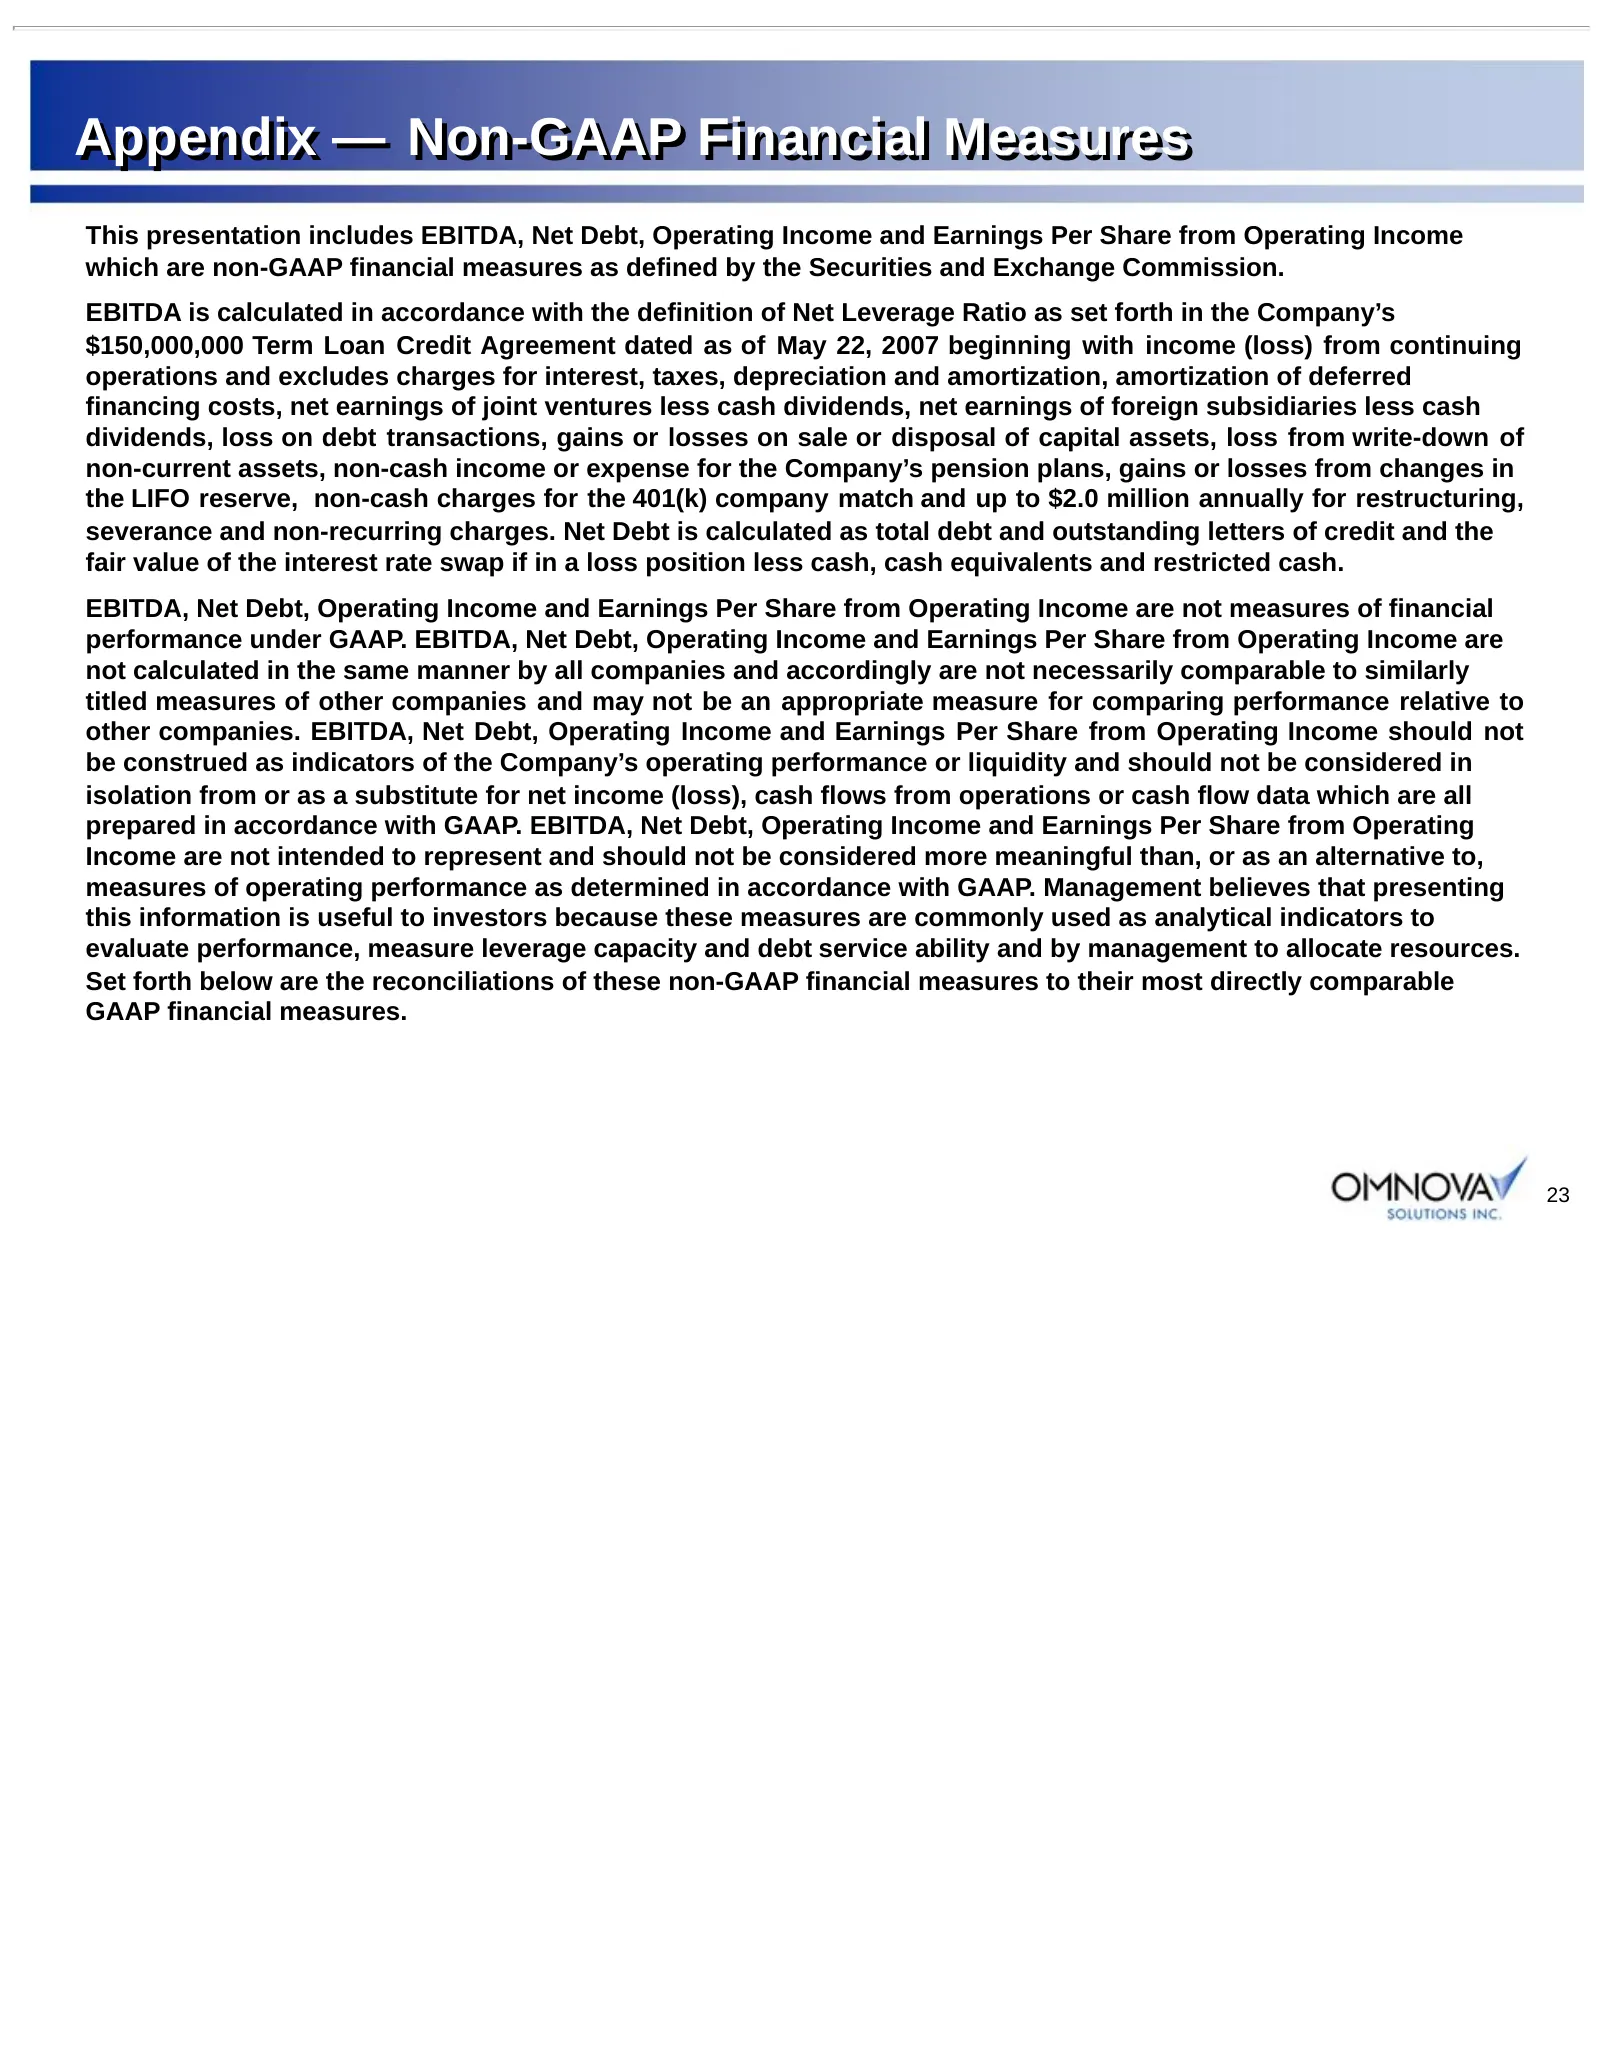
Appendix — Non-GAAP Financial Measures This presentation includes EBITDA, Net Debt, Operating Income and Earnings Per Share from Operating Income which are non-GAAP financial measures as defined by the Securities and Exchange Commission. EBITDA is calculated in accordance with the definition of Net
Slide 24: Appendix 1 — EBITDA and Net Debt
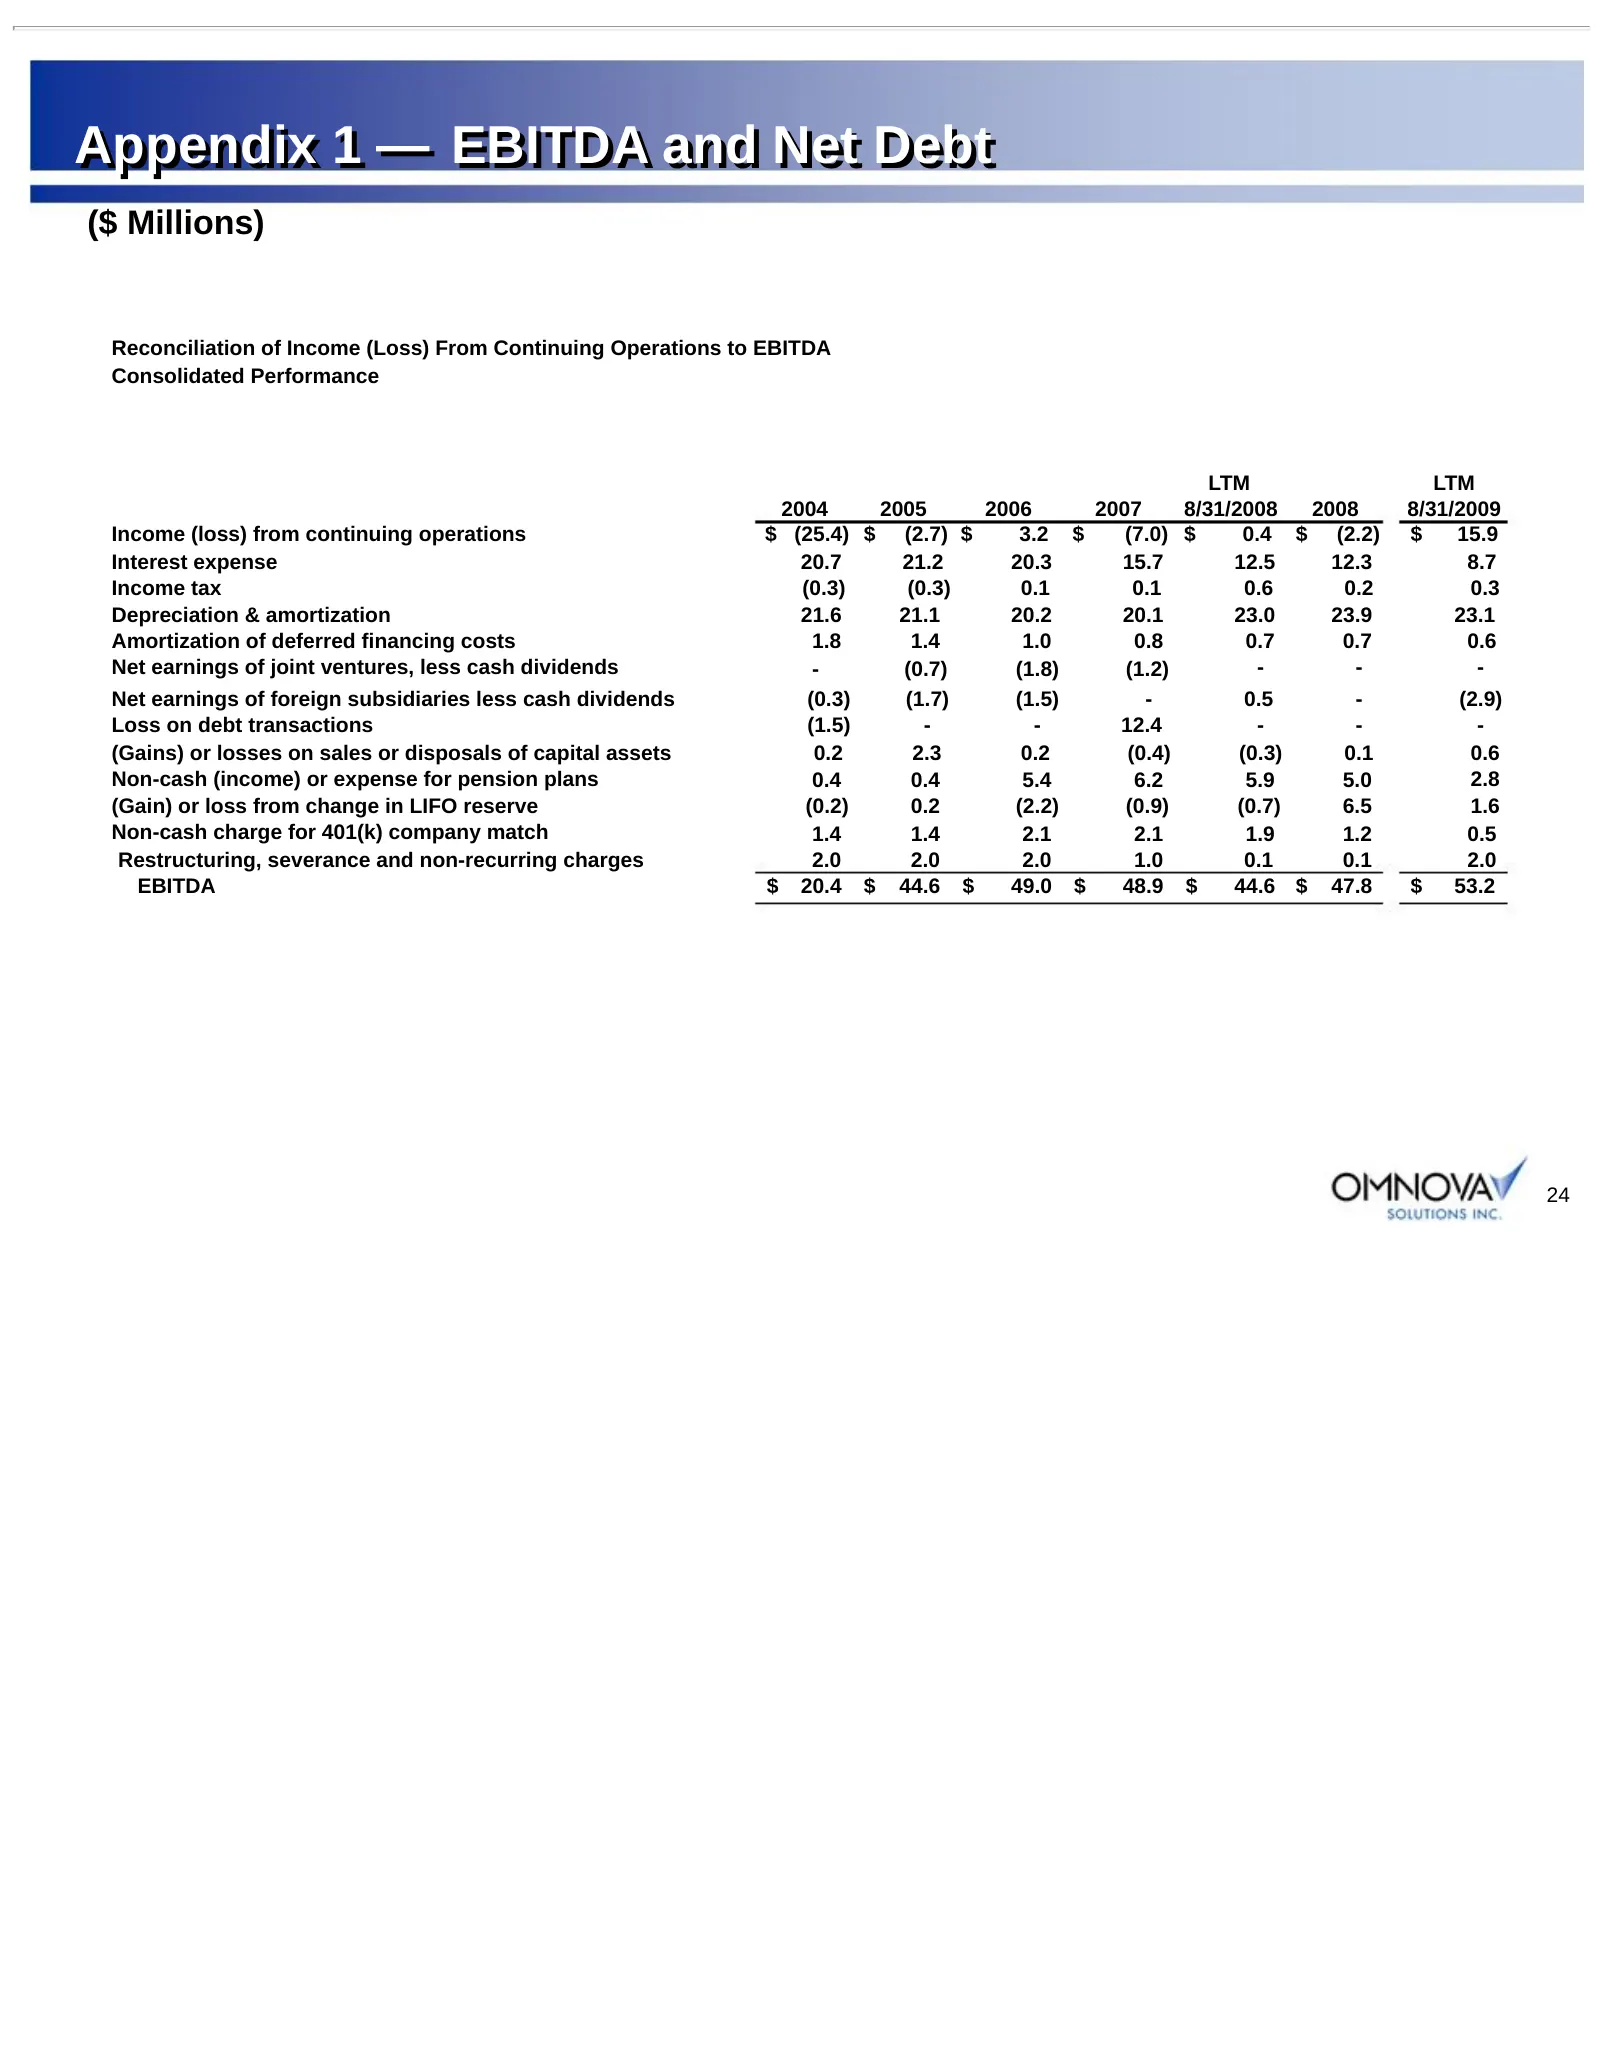
Appendix 1 — EBITDA and Net Debt ($ Millions) Reconciliation of Income (Loss) From Continuing Operations to EBITDA Consolidated Performance LTM LTM 2004 2005 2006 2007 8/31/2008 2008 8/31/2009 Income (loss) from continuing operations $ (25.4) $ (2.7) $ 3.2 $ (7.0) $ 0.4 $ (2.2) $ 15.9 Interest expen
Slide 25: Appendix 1 — EBITDA and Net Debt (continued)
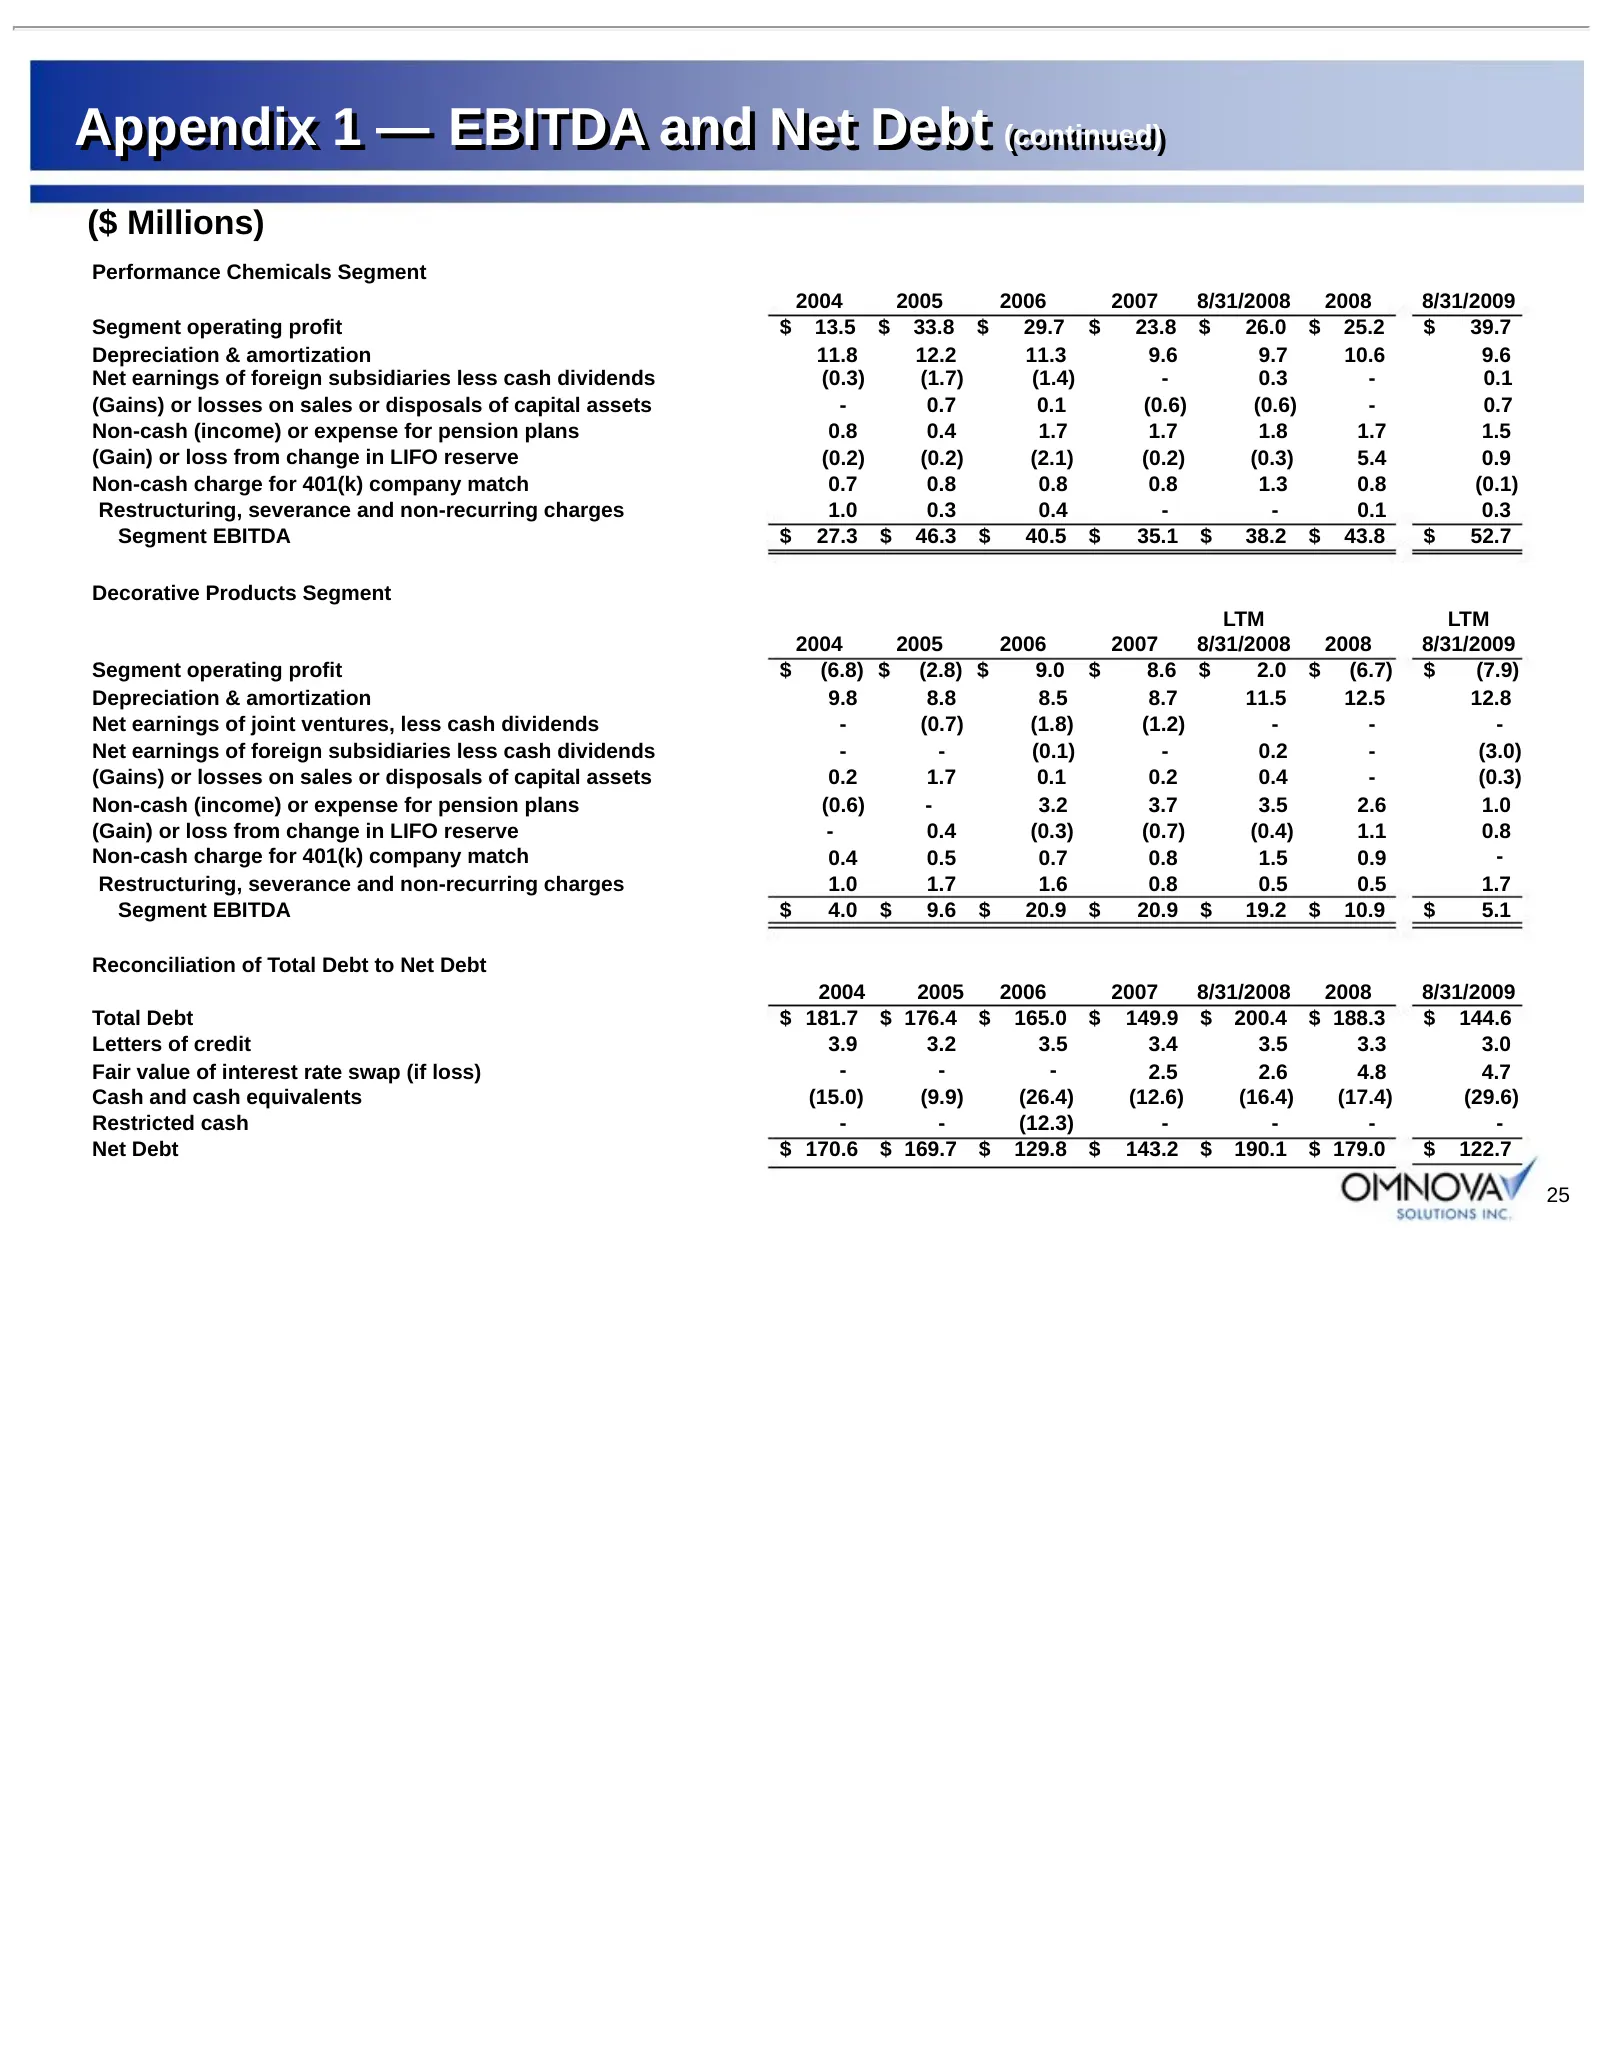
Appendix 1 — EBITDA and Net Debt (continued) (continued) ($ Millions) Performance Chemicals Segment 2004 2005 2006 2007 8/31/2008 2008 8/31/2009 Segment operating profit $ 13.5 $ 33.8 $ 29.7 $ 23.8 $ 26.0 $ 25.2 $ 39.7 Depreciation & amortization 11.8 12.2 11.3 9.6 9.7 10.6 9.6 Net earnings of forei
Slide 26: Appendix 2 — Net Leverage Ratio Calculation
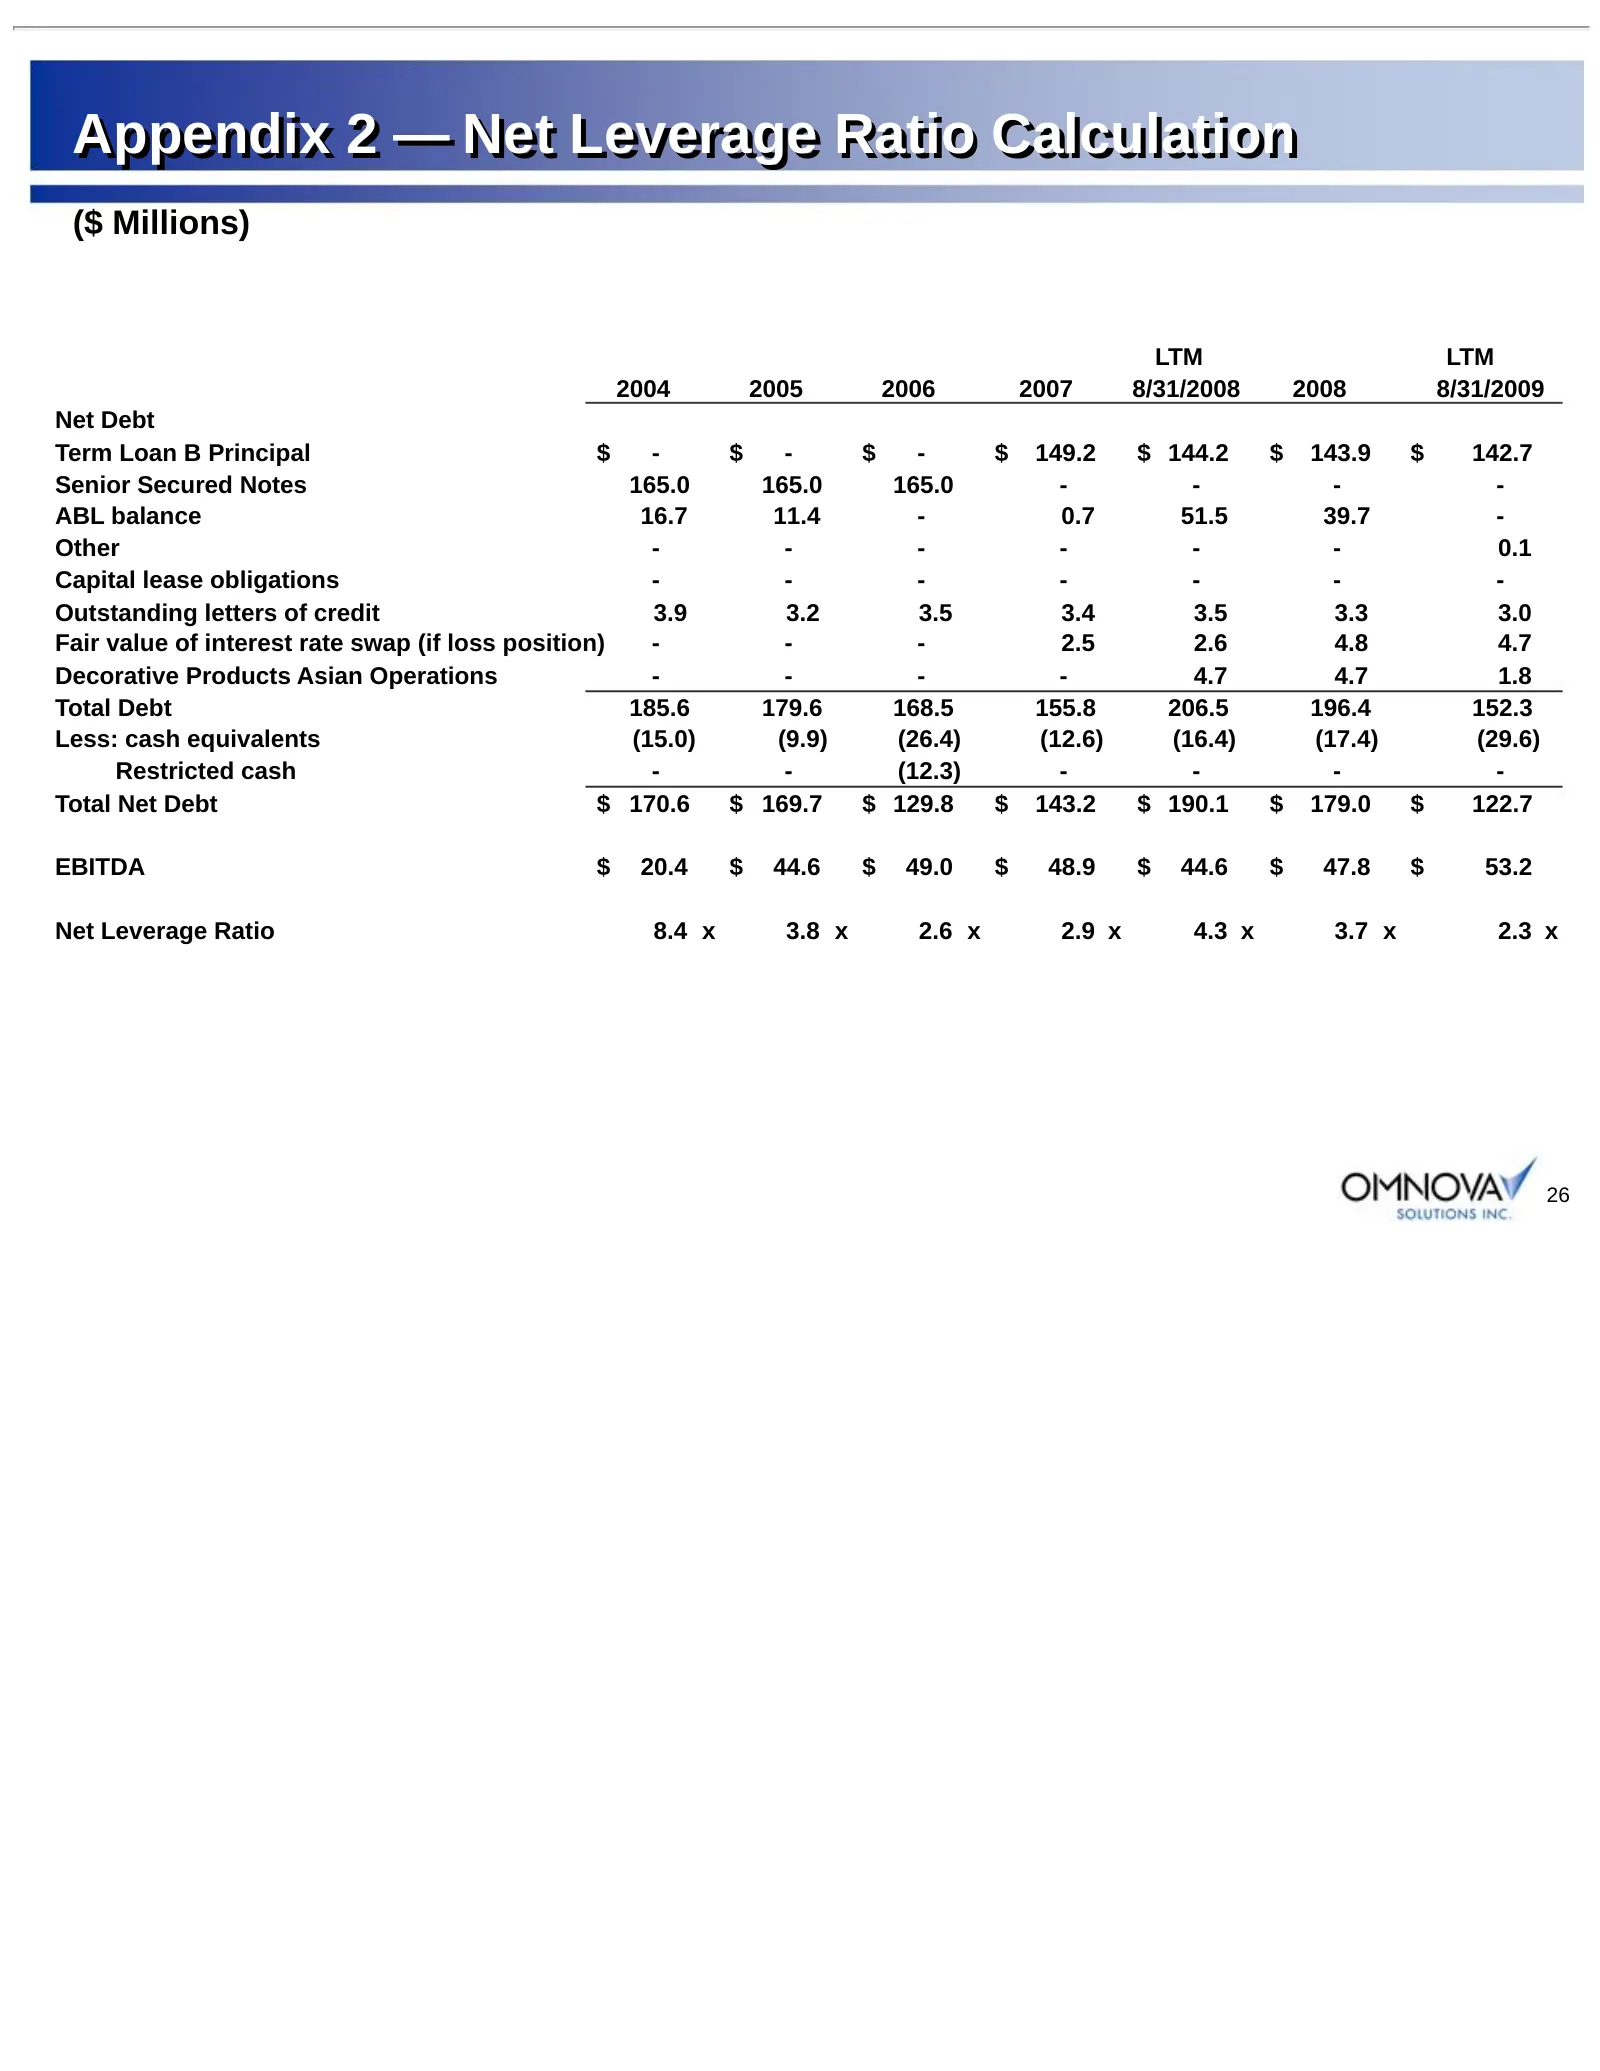
Appendix 2 — Net Leverage Ratio Calculation ($ Millions) LTM LTM 2004 2005 2006 2007 8/31/2008 2008 8/31/2009 Net Debt Term Loan B Principal $ - $ - $ - $ 149.2 $ 144.2 $ 143.9 $ 142.7 Senior Secured Notes 165.0 165.0 165.0 - - - - ABL balance 16.7 11.4 - 0.7 51.5 39.7 - Other - - - - - - 0.1 Capita
Slide 27: Appendix 3 — Operating Income and Earnings Per Share From Operating Income
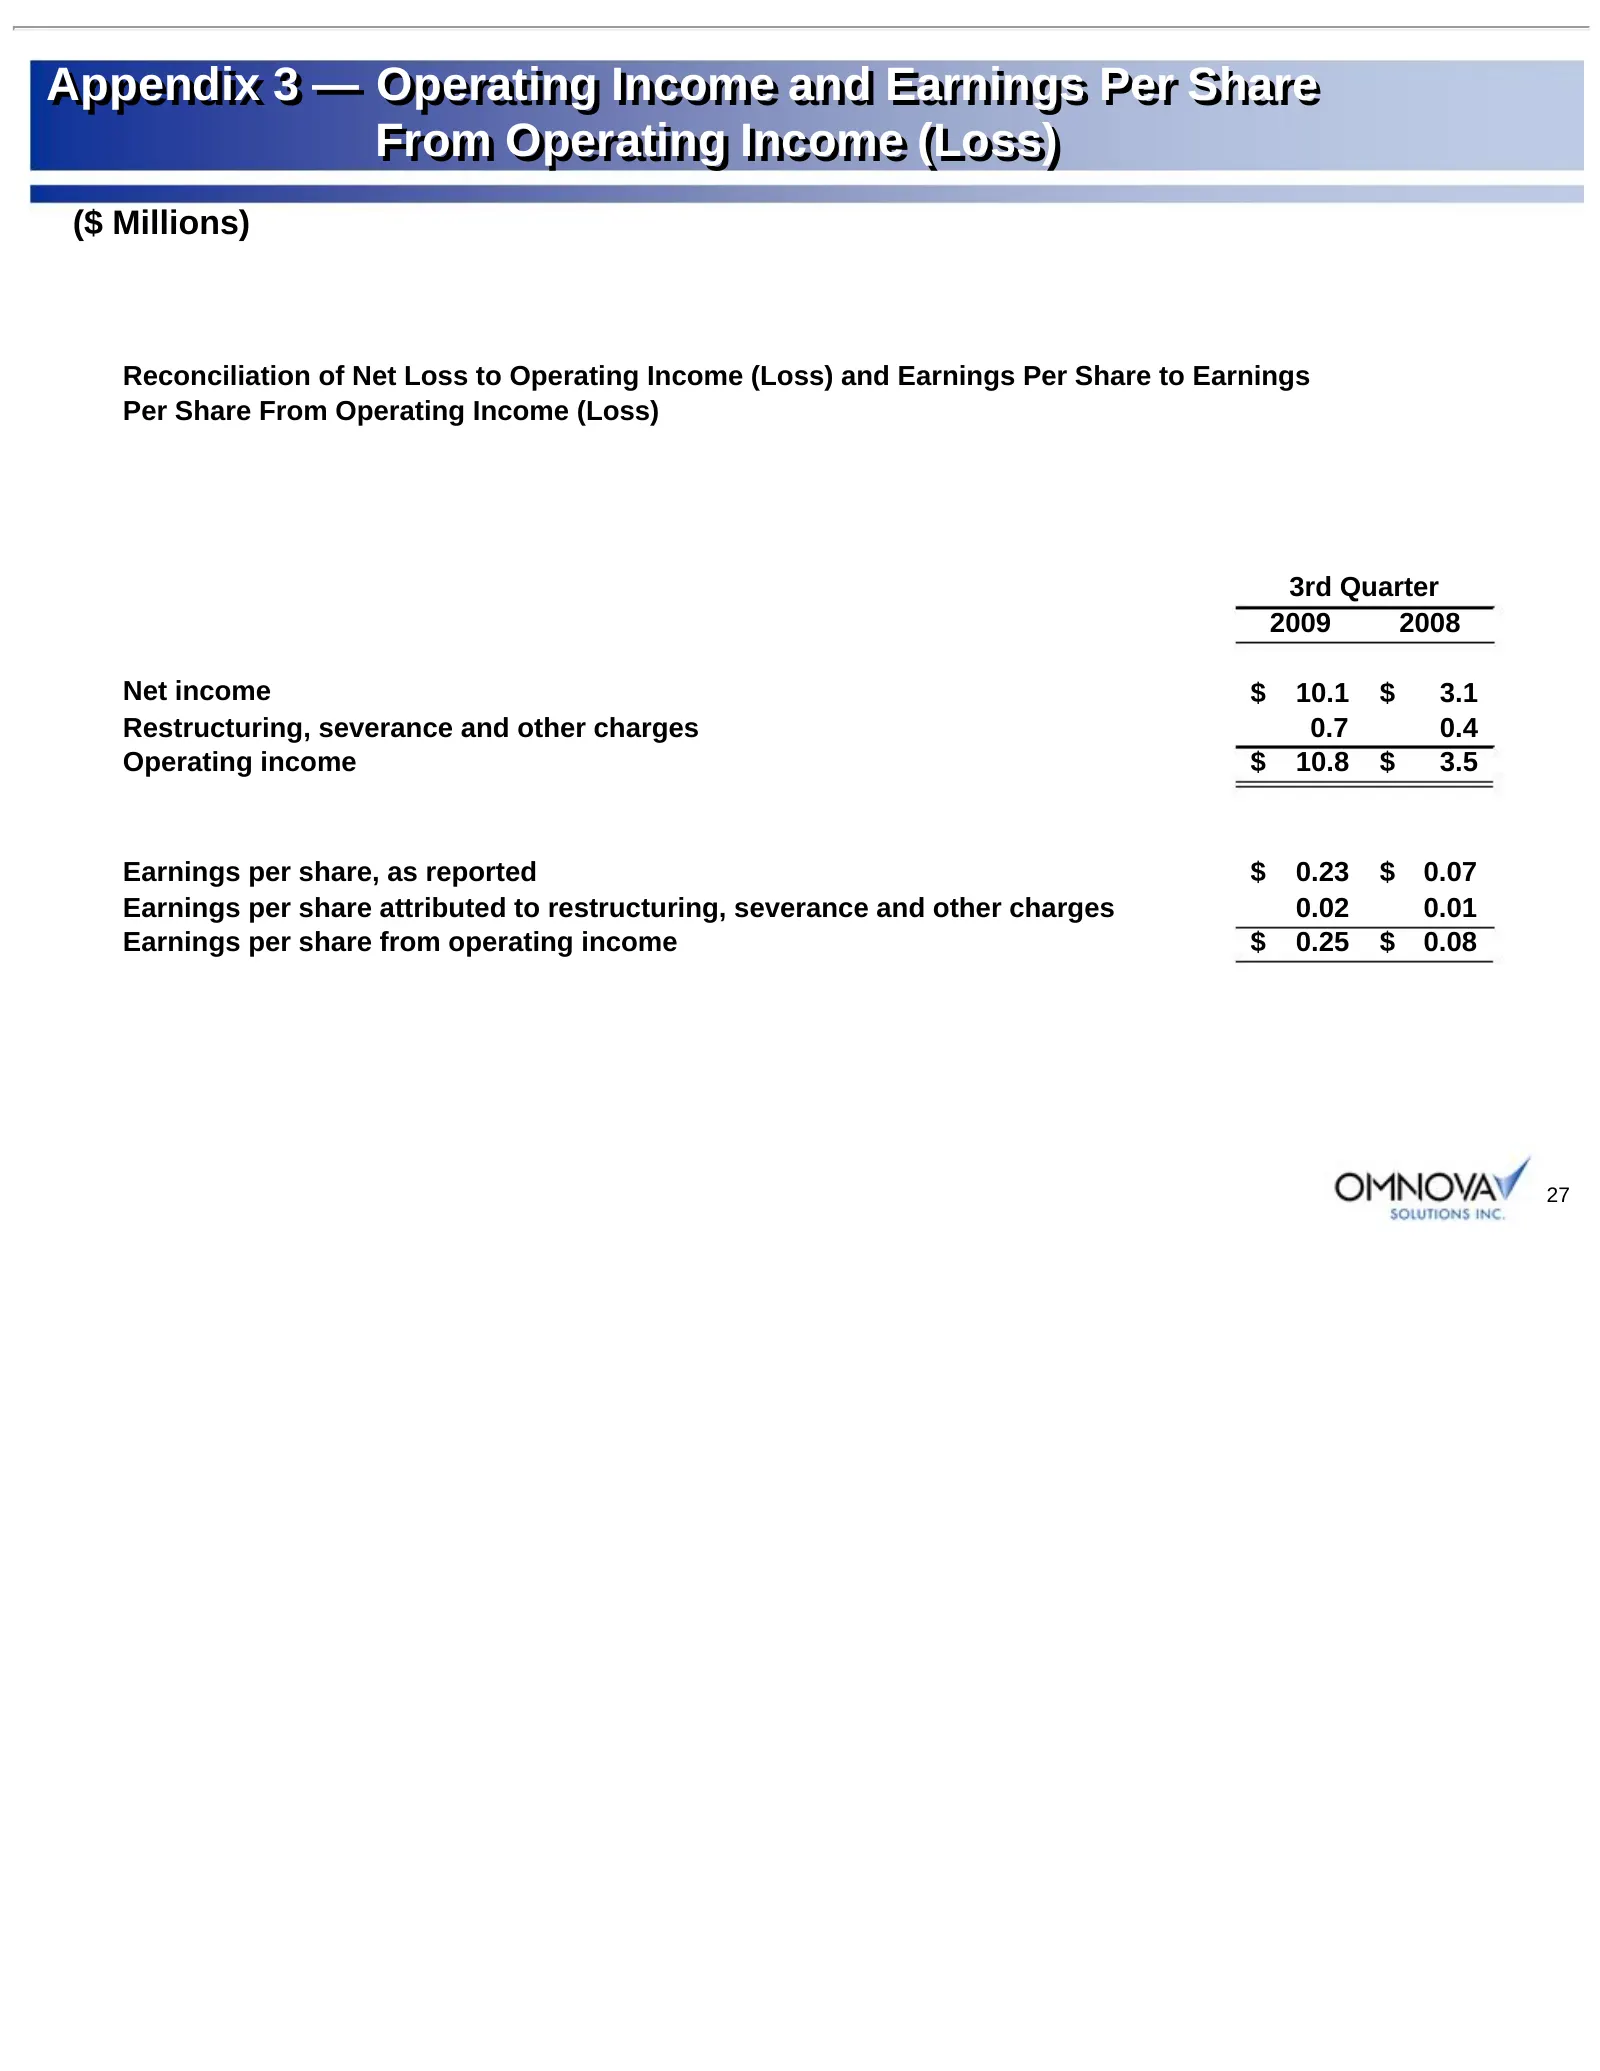
Appendix Appendix 33 — — Operating Operating Income Income and and Earnings Earnings Per Per Share Share From From Operating Operating Income Income (Loss) (Loss) ($ Millions) Reconciliation of Net Loss to Operating Income (Loss) and Earnings Per Share to Earnings Per Share From Operating Income (Lo

Slide 28: OMNOVA Solutions Inc.
OMNOVAWY SOLUTIONS INC.
Source: SEC EDGAR · 8-K filed Oct 1, 2009
More decks from OMNOVA Solutions Inc
 Merger or Acquisition (July 2019)24 slides · Jul 3, 2019
 Q1 2019 Earnings Presentation32 slides · Mar 27, 2019
 Investor Presentation (February 2019)34 slides · Feb 22, 2019
 Q3 2018 Earnings Presentation32 slides · Sep 26, 2018
 Investor Presentation (July 2018)32 slides · Jul 20, 2018
 Investor Presentation (April 2018)32 slides · Apr 11, 2018