Approach Resources — IPAA's Oil & Gas Investment Symposium 2013
29 slides from Approach Resources's conference presentation, Apr 15, 2013
Slide 1: Approach Resources Inc. IPAA's Oil & Gas Investment Symposium
Approach Resources Inc. IPAA’S OIL & GAS INVESTMENT SYMPOSIUM NEW YORK APRIL 15, 2013 Exhibit 99.2
Slide 2: Forward-Looking Statements
Forward-Looking Statements ‘This presentation contains forward-looking statements wihin the meaning of Secton 27A ofthe Secures Act of 1083 and Section 21E of the Secures Exchange Act of 1924. Al siemens, ether than statements of historical fas, nlued in hs presentation that address aches, evens or
Slide 3: Company Overview
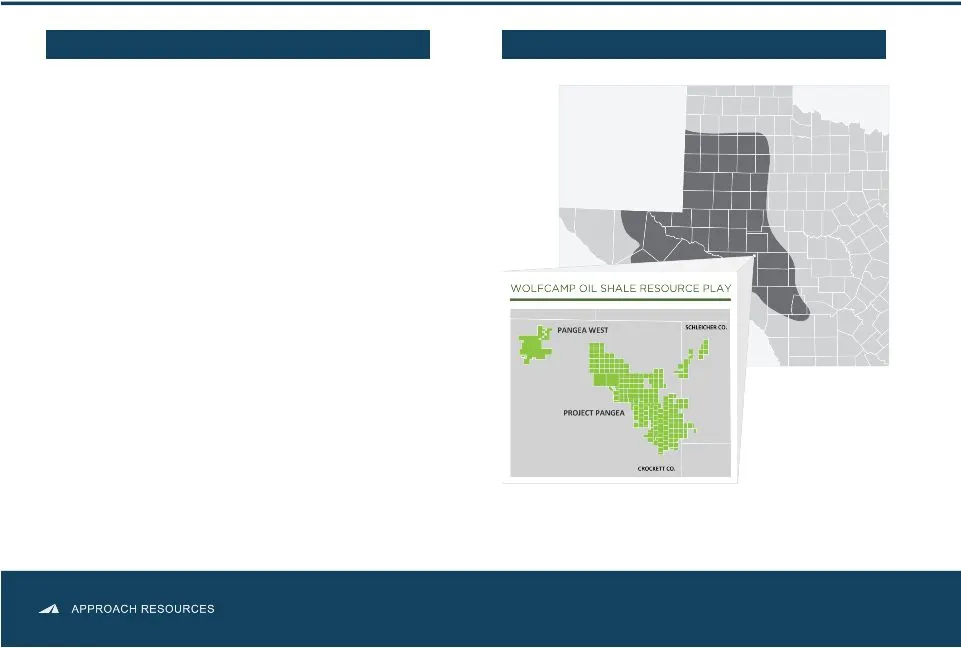
3 AREX OVERVIEW ASSET OVERVIEW Notes: Proved reserves and acreage as of 12/31/2012. All Boe and Mcfe calculations are based on a 6 to 1 conversion ratio. Enterprise value is equal to market capitalization using the closing share price of $24.75 per share on 4/8/2013, plus net debt as of 12/31/2012.
Slide 4: Reserve Growth
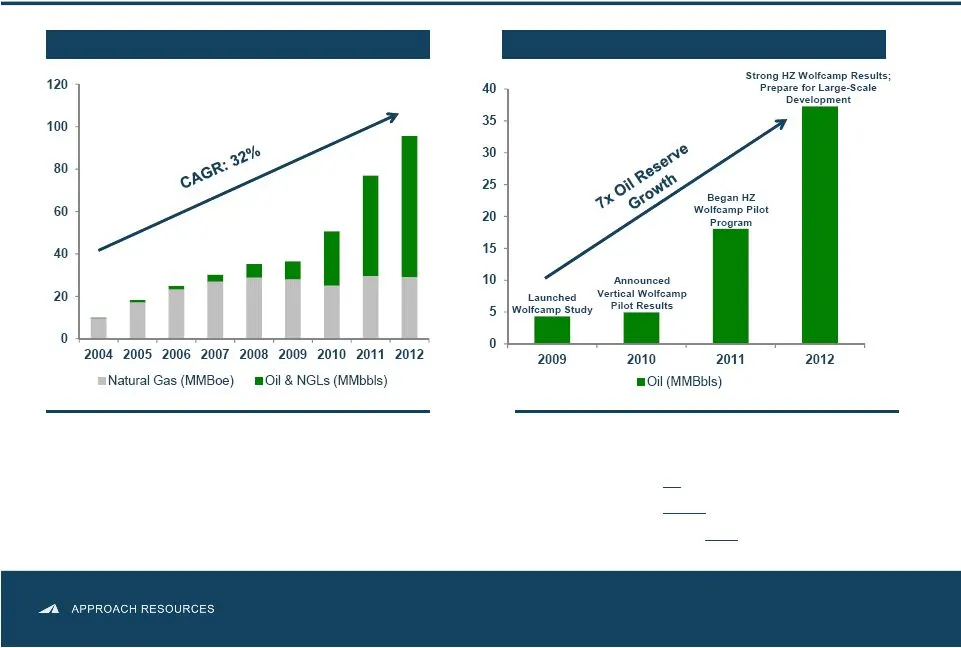
4 RESERVE GROWTH OIL RESERVE GROWTH Notes: See “F&D Costs Reconciliation” slide in appendix. Reserve Growth • YE’12 reserves up 24% YoY • Replaced 1,346% of reserves at a drill-bit F&D cost of $7.45/Boe • 60.1 MMBoe proved reserves booked to Wolffork/Wolfcamp oil shale play • Strong organic reserve
Slide 5: Production Growth
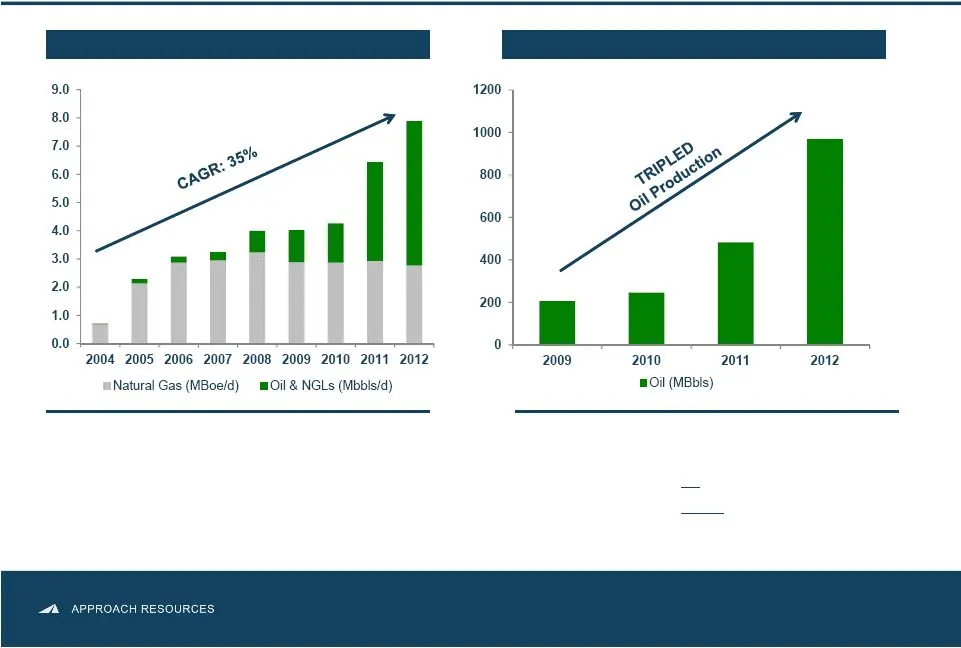
5 PRODUCTION GROWTH OIL PRODUCTION GROWTH Production Growth 3.6 MMBoe – 3.9 MMBoe in 2013 2013E Production mix ~70% liquids • Strong organic production growth driven by oil from horizontal Wolfcamp shale • Oil production up 3x since 2009 • Oil production up 101% over 2011 • 2012 production increased
Slide 6: Low-Cost Operator
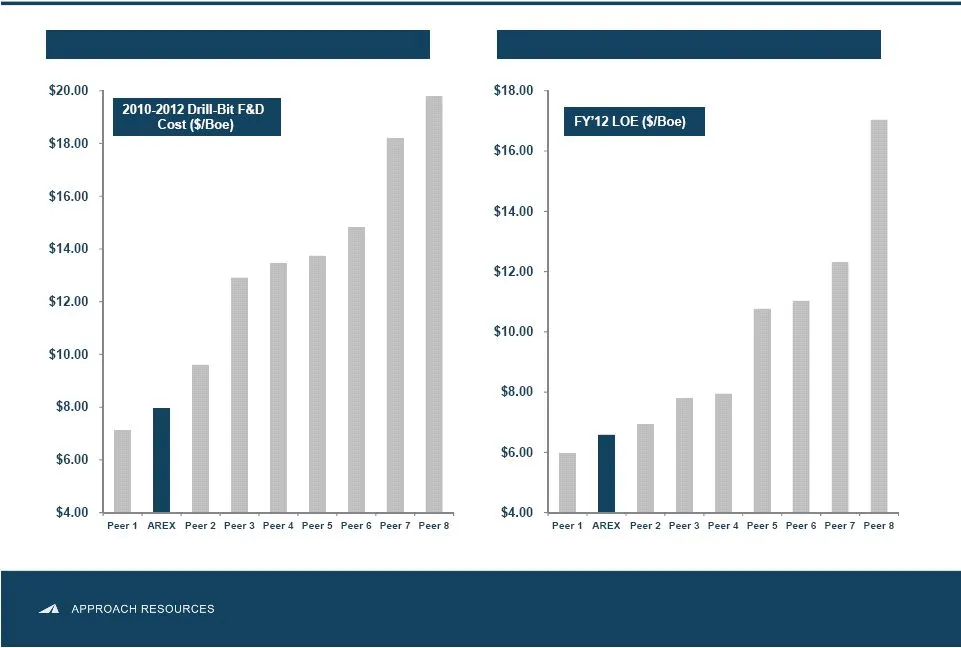
Notes: Peers include CXO, FANG, KOG, LPI, OAS, PXD, ROSE and SM. Data based on SEC filings for twelve months ending December 31, 2012. 3-YR AVERAGE F&D COSTS ($/Boe) LEASE OPERATING EXPENSE ($/Boe) 6 Low-Cost Operator
Slide 7: AREX Wolfcamp Oil Shale Resource Play
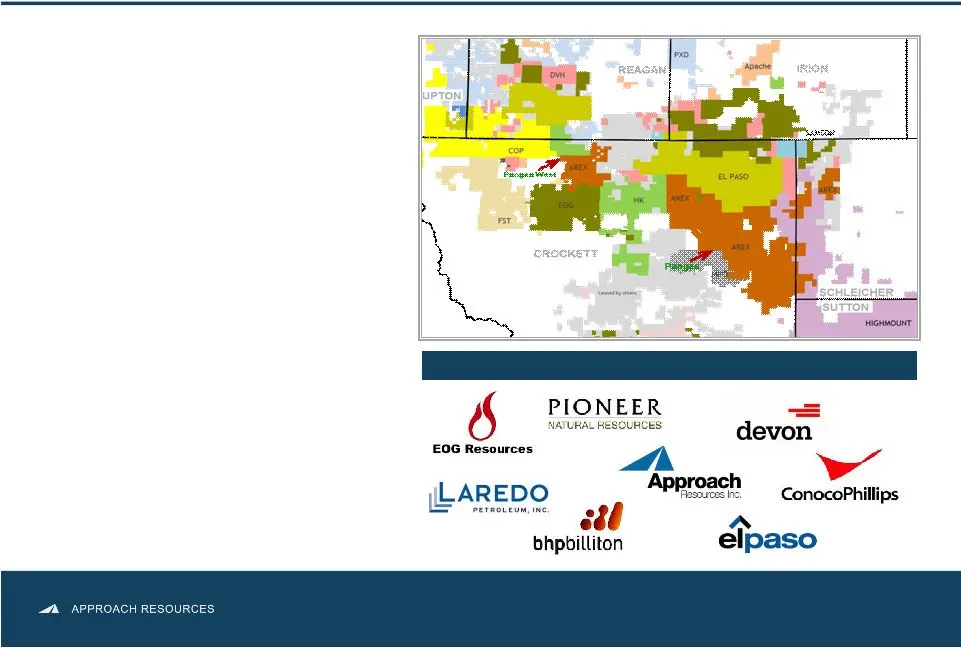
7 ACTIVE PARTICIPANTS IN THE PLAY Source: Rig data from Schlumberger and Iberia. AREX Wolfcamp Oil Shale Resource Play Large, primarily contiguous acreage position Oil-rich, multiple pay zones 167,000 gross (148,000 net) acres Low acreage cost ~$500 per acre 940+ MMBoe gross, unrisked resource poten
Slide 8: AREX Drilling Locations, Targets & Resource Potential
8 Notes: Potential locations based on 120-acre spacing for HZ Wolfcamp, 20-acre spacing for Vertical Wolffork, 20 to 40-acre spacing for Vertical Wolffork Recompletions and 40-acre spacing for Vertical Canyon Wolffork. No Wolfcamp or Wolffork locations assigned to south Project Pangea. TARGET DRLLIN
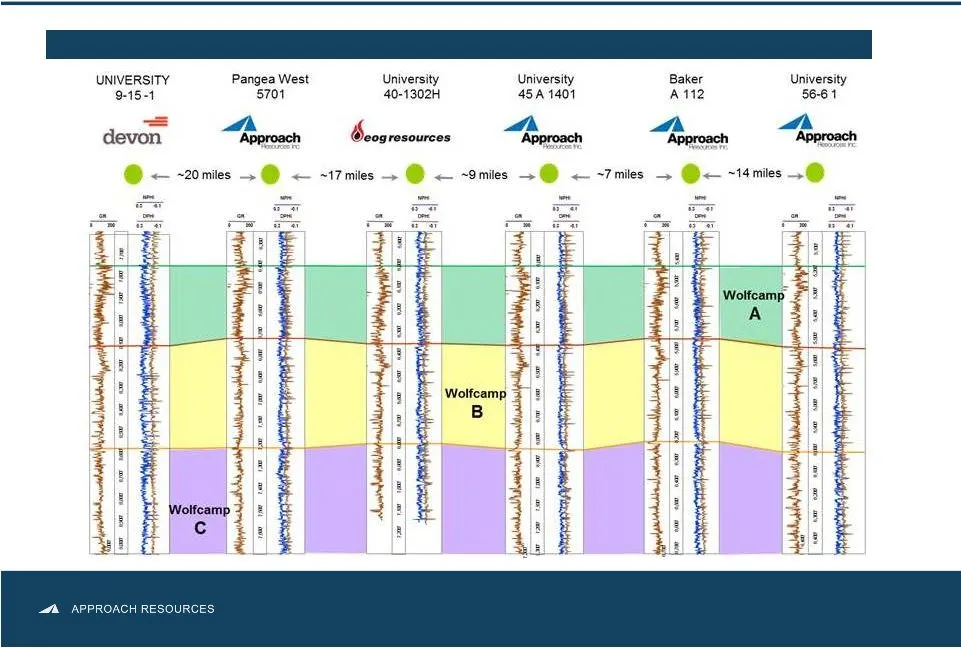
Slide 9: Wolfcamp Shale – Widespread, Thick, Consistent & Repeatable
9 WOLFCAMP SHALE – WIDESPREAD, THICK, CONSISTENT & REPEATABLE Wolfcamp Oil Shale Play
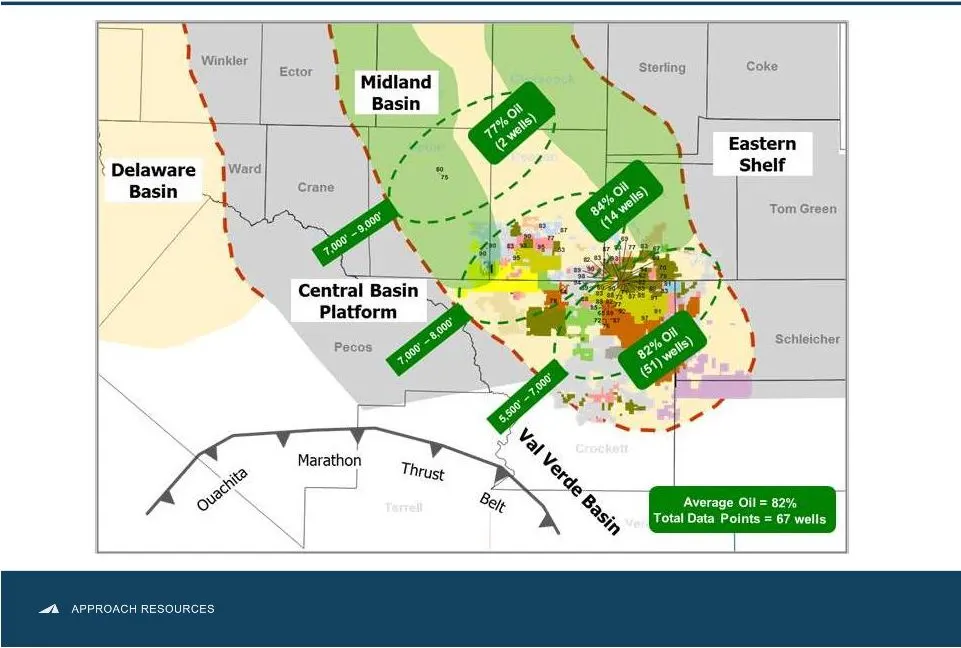
Slide 10: Horizontal Wolfcamp – 82% of IP is Oil
10 Source: Publicly available regulatory filings, company presentations. Horizontal Wolfcamp – 82% of IP is Oil Sutton
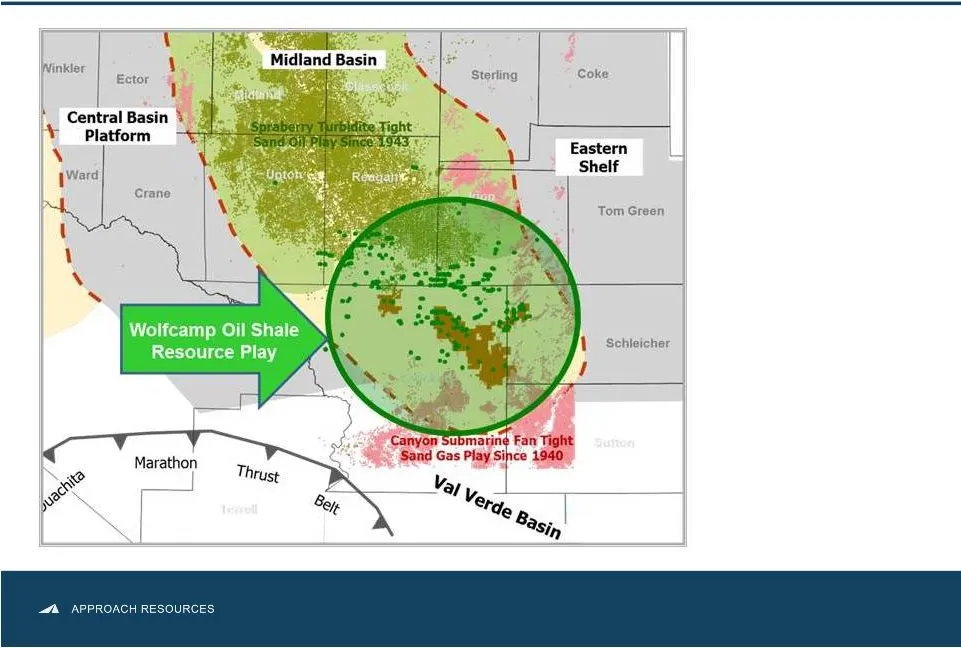
Slide 11: Misconception vs. Facts
11 Misconception vs. Facts Misconception: Wells are gassier as the play moves southward • Gassier wells are historical Canyon, Strawn and Ellenburger wells • The Wolfcamp Shale is located in peak oil and early wet gas window. Wolfcamp wells are expected to produce approximately 58% oil and ~80% liqu
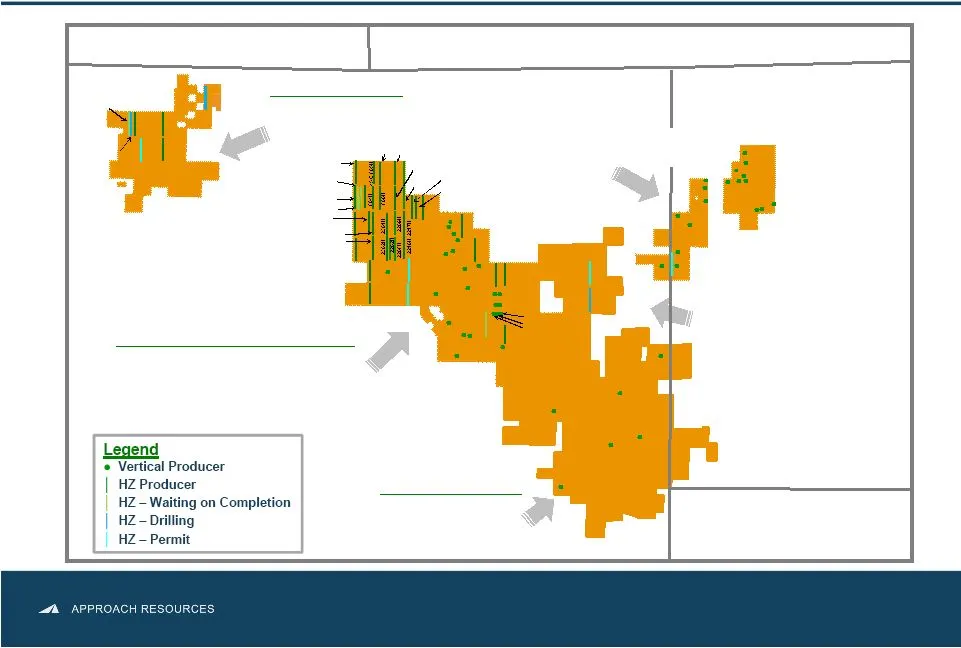
Slide 12: AREX HZ Wolfcamp Activity
12 Notes: Acreage as of 12/31/2012. AREX HZ Wolfcamp Activity Pangea West North & Central Pangea South Pangea • 18,000 gross acres • Pad drilling with A/B and A/C “stacked” laterals Schleicher Crockett Irion Reagan • 3-D seismic interpretation completed • Drilling HZ pilot well • 59,000 gross acres
Slide 13: Continued Strong Well Results – Tracking Above the Type Curve
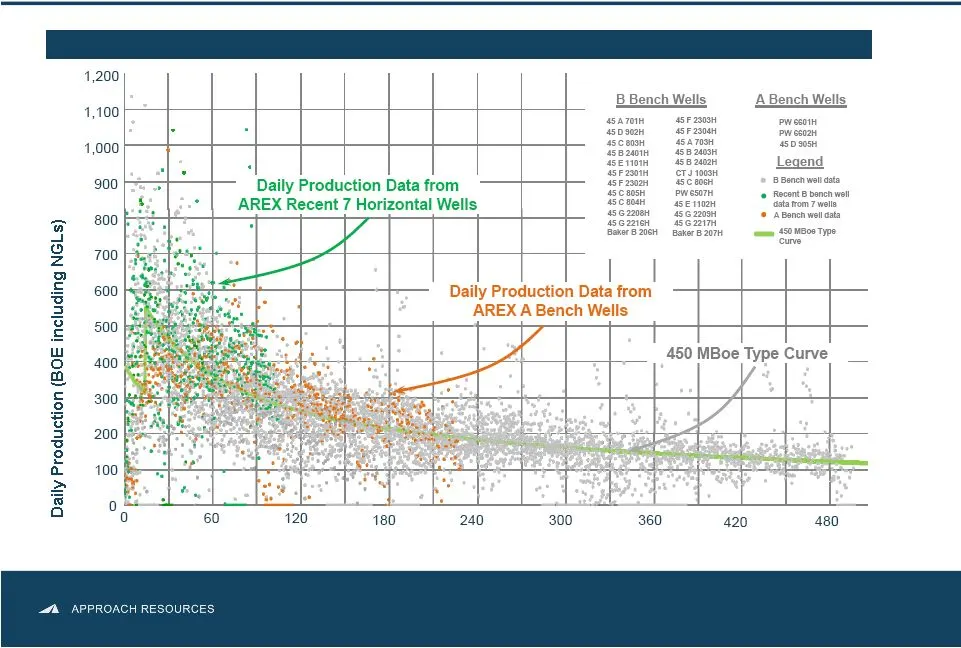
13 CONTINUED STRONG WELLS RESULTS – TRACKING ABOVE THE TYPE CURVE HZ Wolfcamp Well Performance Time (Days)
Slide 14: Wolfcamp Stacked Pay Zones
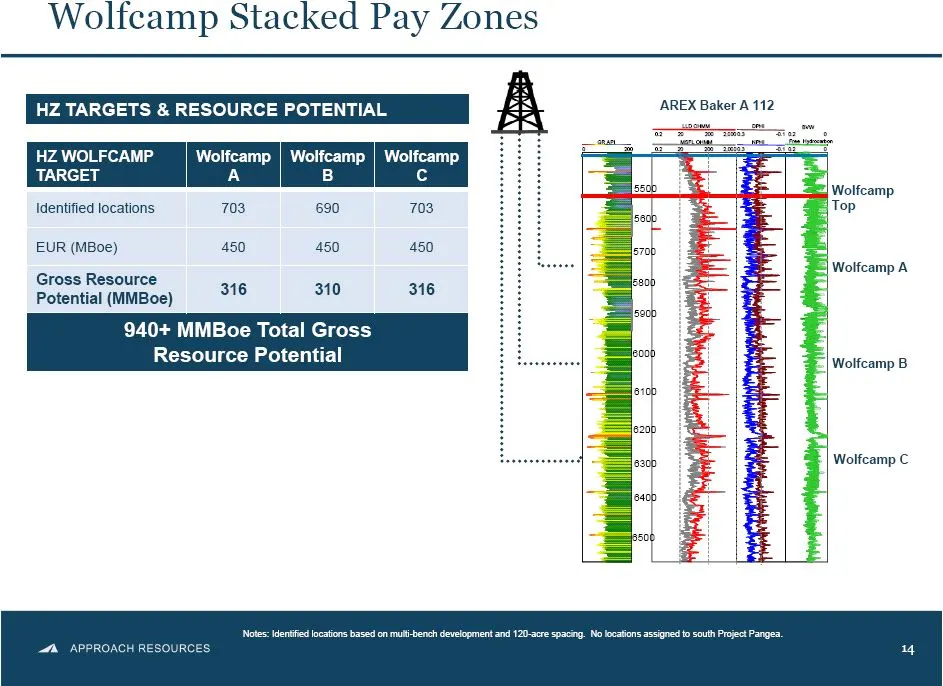
Wolfcamp Stacked Pay Zones HZ TARGETS & RESOURCE POTENTIAL HZ WOLFCAMP ere ieee TARGET Identified locations EUR (MBoe) 450 450 450 Gross Resource Potential (MMBoe) ore 10 ib 940+ MMBoe Total Gross Resource Potential AREX Baker A112 Wolfcamp Top Wolfcamp A Wolfcamp B Wolfcamp C "Notes: Kentfid ocaton
Slide 15: Microseismic Data – Wolfcamp A & B
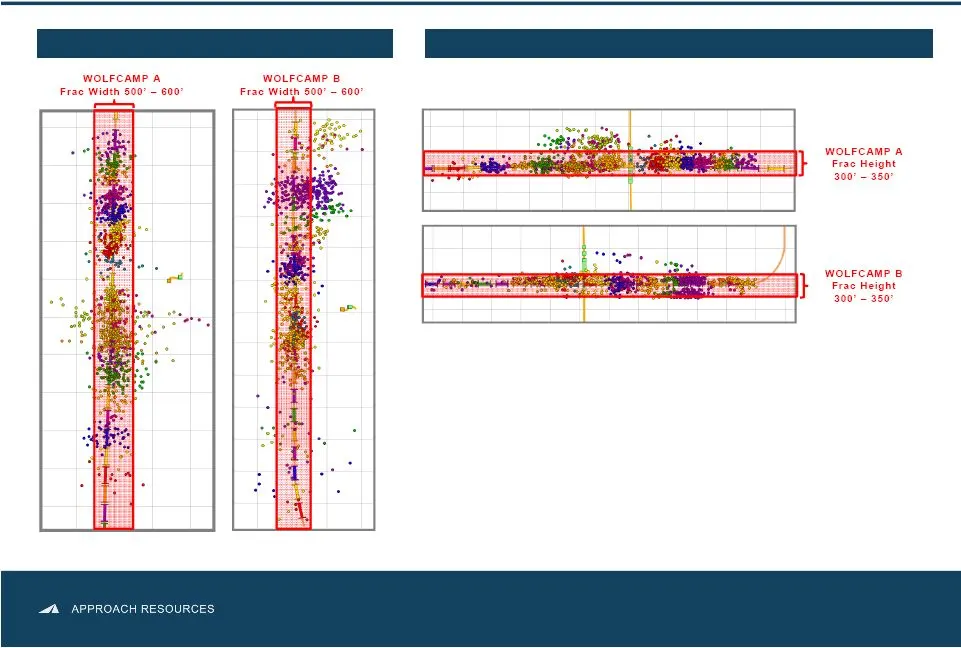
15 MAP VIEW X-SECTION VIEW (LOOKING WEST) Microseismic Data – Wolfcamp A & B
Slide 16: Microseismic Data – Wolfcamp C
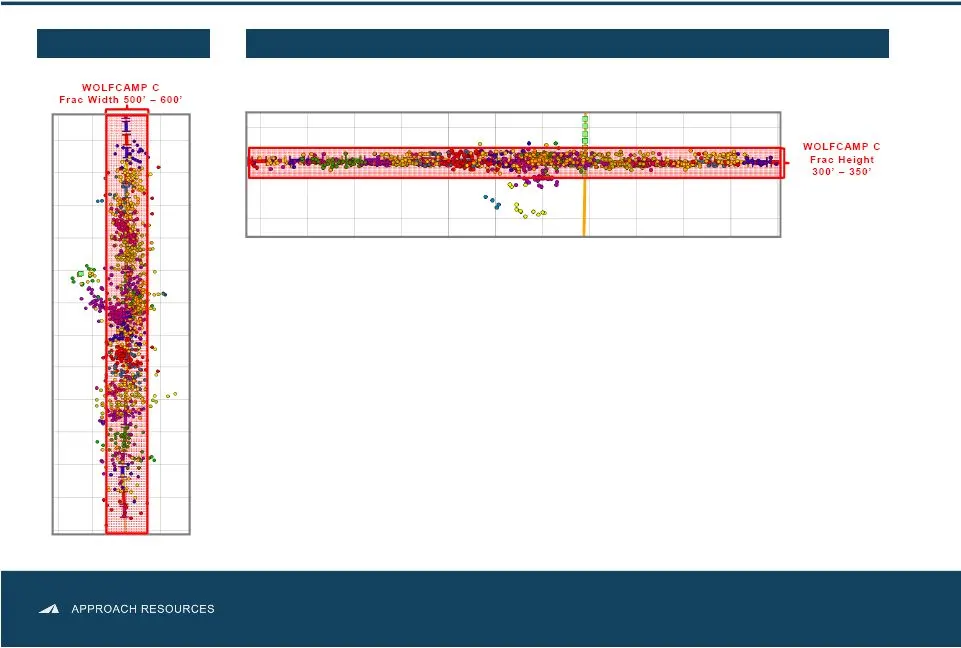
16 MAP VIEW X-SECTION VIEW (LOOKING WEST) Microseismic Data – Wolfcamp C
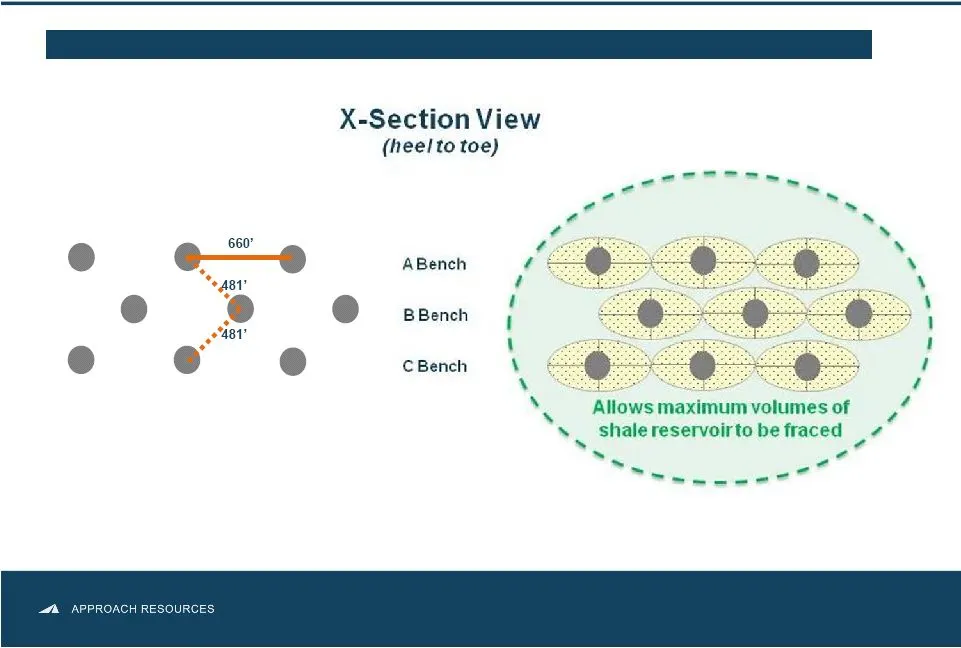
Slide 17: Chevron Stacking Development Pattern
17 CHEVRON STACKING DEVELOPMENT PATTERN Multiple Lateral Stacking – Effective Frac Volumes
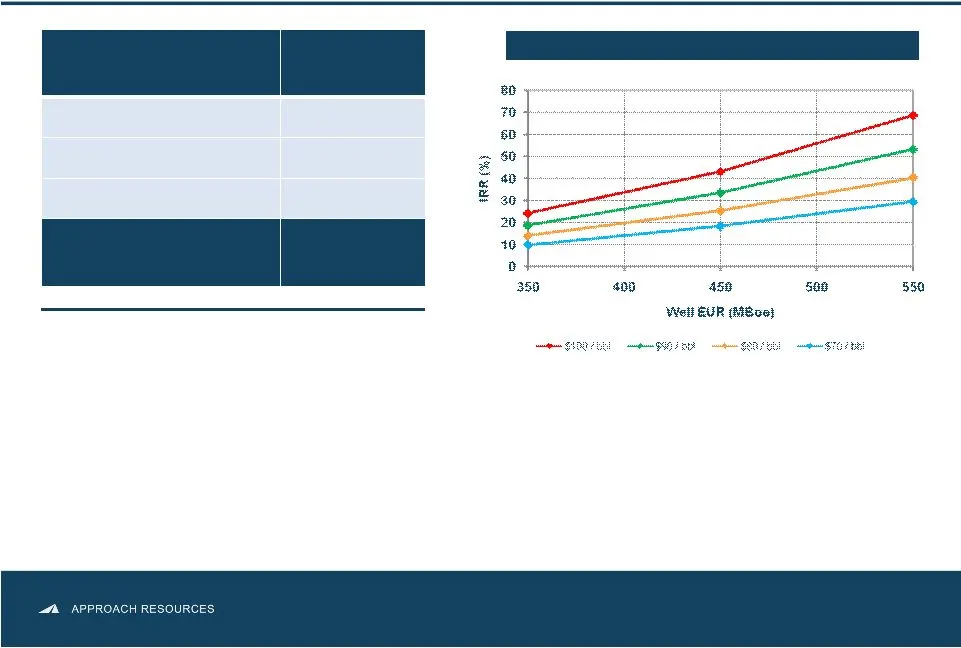
Slide 18: AREX HZ Wolfcamp Economics
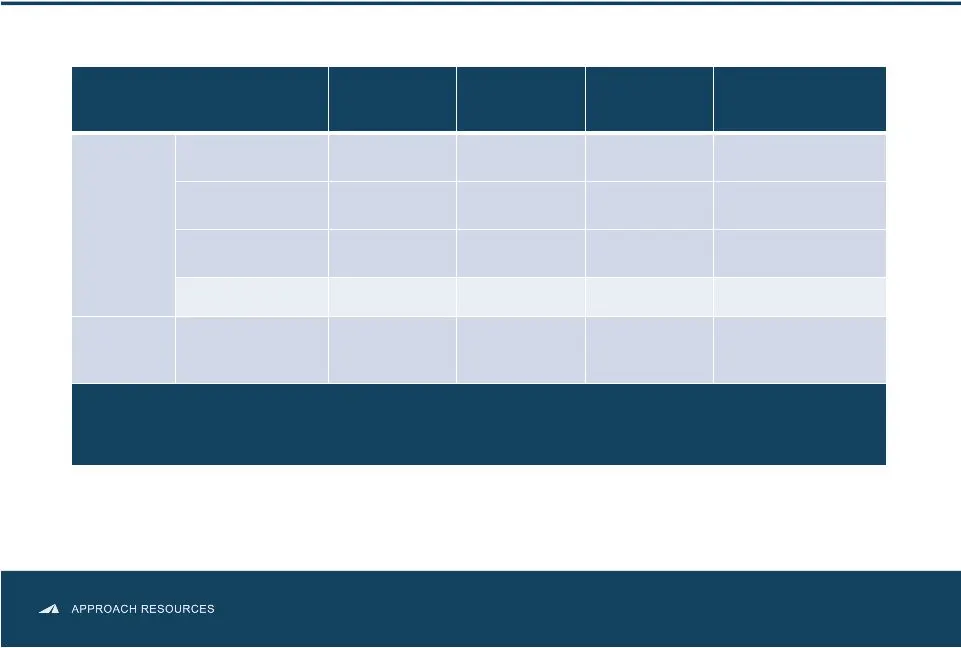
18 Notes: Identified locations based on multi-bench development and 120-acre spacing for HZ Wolfcamp. No locations assigned to south Project Pangea. HZ Wolfcamp Economics assume NYMEX-Henry Hub strip and NGL price based on 40% of WTI. Play Type Horizontal Wolfcamp Gross Resource Potential 940+ MMBoe
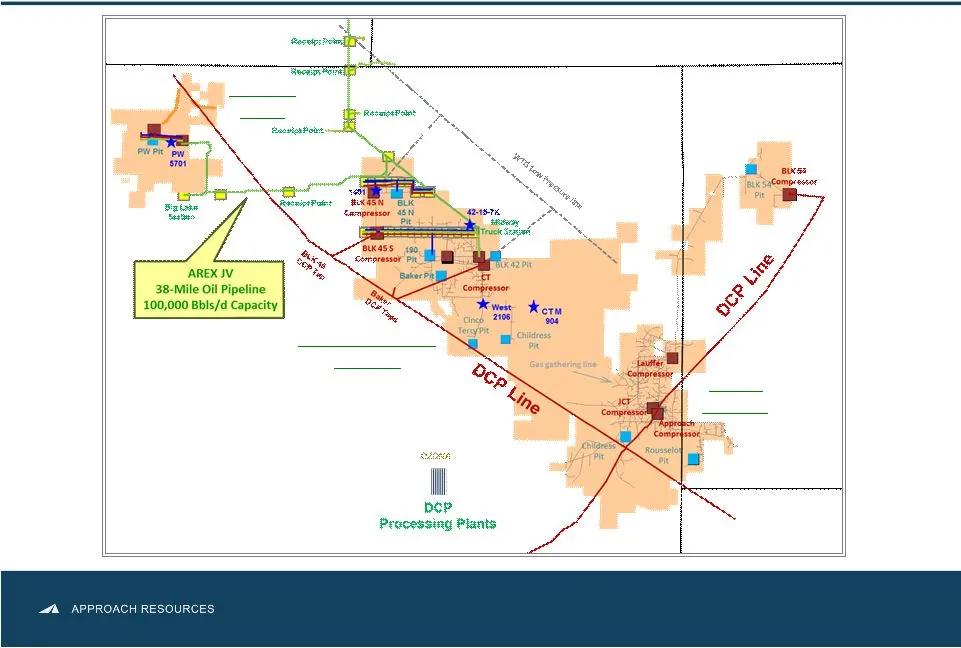
Slide 19: Infrastructure for Large-Scale Development
19 Infrastructure for Large-Scale Development • Reducing D&C Cost to $5.5 MM or lower • Reducing LOE • Minimizing truck traffic and surface disturbance • Increasing project profit margin Pangea West South Pangea Schleicher Crockett Irion Reagan Sutton North & Central Pangea
Slide 20: Infrastructure & Equipment Projects
20 BENEFITS Infrastructure and equipment projects are key to large-scale field development and to reducing D&C costs as well as LOE cost PROJECTS Infrastructure & Equipment Projects • Safely and securely transport water across Project Pangea and Pangea West • Reduce time and money spent on water hau
Slide 21: Creating Value Through Growth
21 Creating Value Through Growth • Concentrated geographic footprint in the Midland Basin • Strong growth track record at competitive costs • Detailed technical evaluation led to discovery of growth potential in the Wolfcamp oil shale resource play • Rigorous pilot program de-risked ~107,000 gross a

Slide 22: Financial Information: Non-GAAP Reconciliations
Financial Information NON-GAAP RECONCILIATIONS
Slide 23: 2013 Capital Budget
23 2013 Capital Budget • 2013 Capital budget $260 MM, approx. 90% for HZ Wolfcamp • 3 HZ rigs in the Wolfcamp shale • Targeting 30%+ production growth Key takeaways: • Targeting Wolfcamp A, B and C • Testing “stacked” lateral development concept • 2013 Production guidance 3.6 MMBoe – 3.9 MMBoe • 201
Slide 24: 2013 Guidance
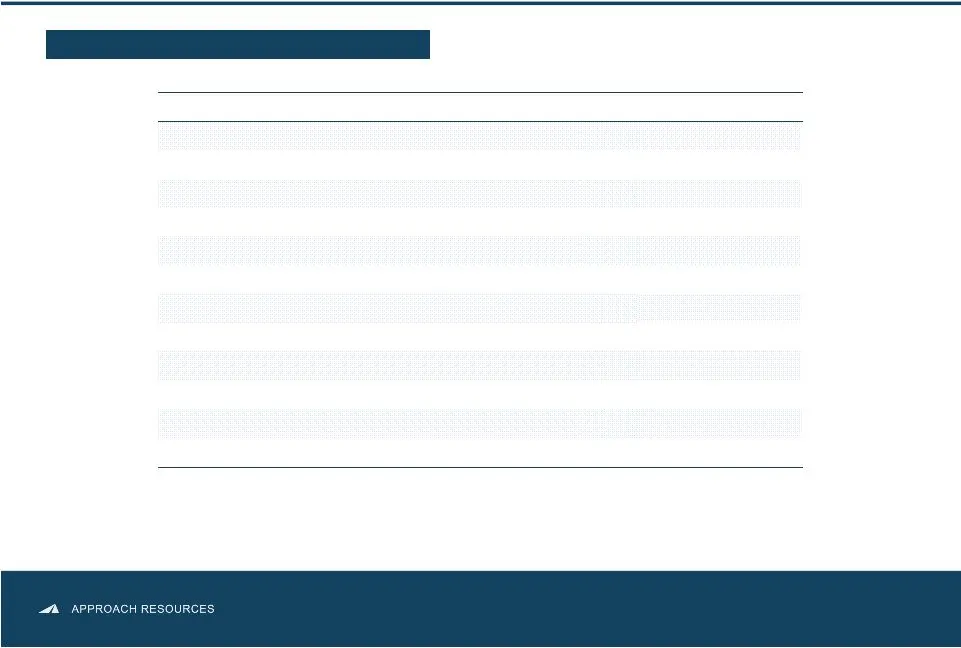
24 2013 GUIDANCE 2013 Operating and Financial Guidance 2013 Guidance Production Total (MBoe) 3,600 – 3,900 Percent Oil & NGLs 70% Operating costs and expenses ($/per Boe) Lease operating $ 7.00 – 8.00 Production and ad valorem taxes $ 3.00 – 4.50 Exploration $ 2.00 – 3.00 General and administrative
Slide 25: Current Hedge Position
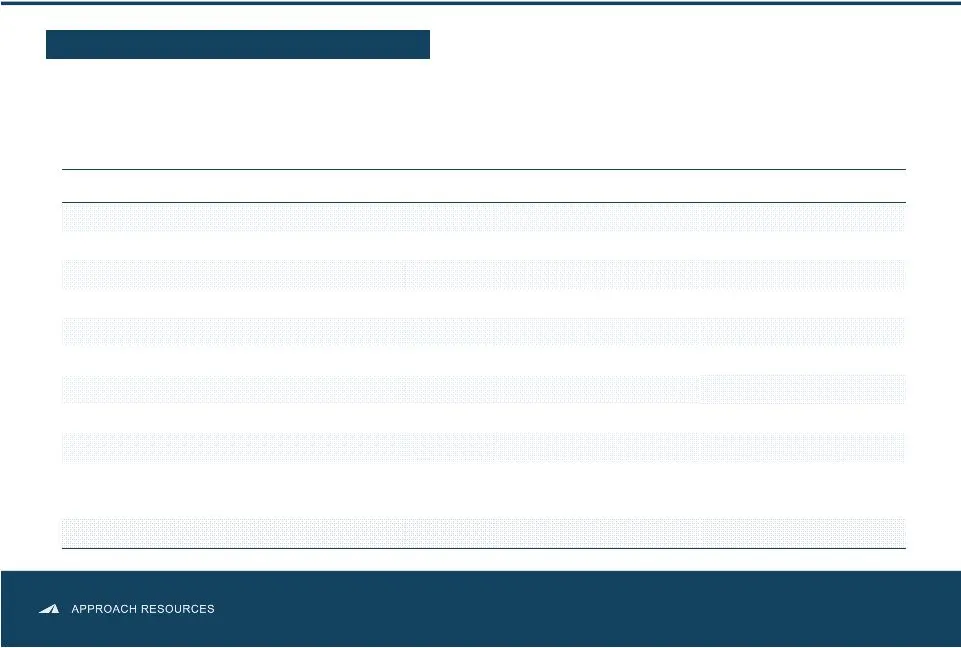
25 CURRENT HEDGE POSITION Hedge Position Commodity and Time Period Type Volume Price Crude Oil 2013 Collar 650 Bbls/d $90.00/Bbl - $105.80/Bbl 2013 Collar 450 Bbls/d $90.00/Bbl - $101.45/Bbl February 2013 – December 2013 Collar 1,200 Bbls/d $90.35/Bbl - $100.35/Bbl 2014 Collar 550 Bbls/d $90.00/Bbl
Slide 26: Capitalization & Performance Metrics
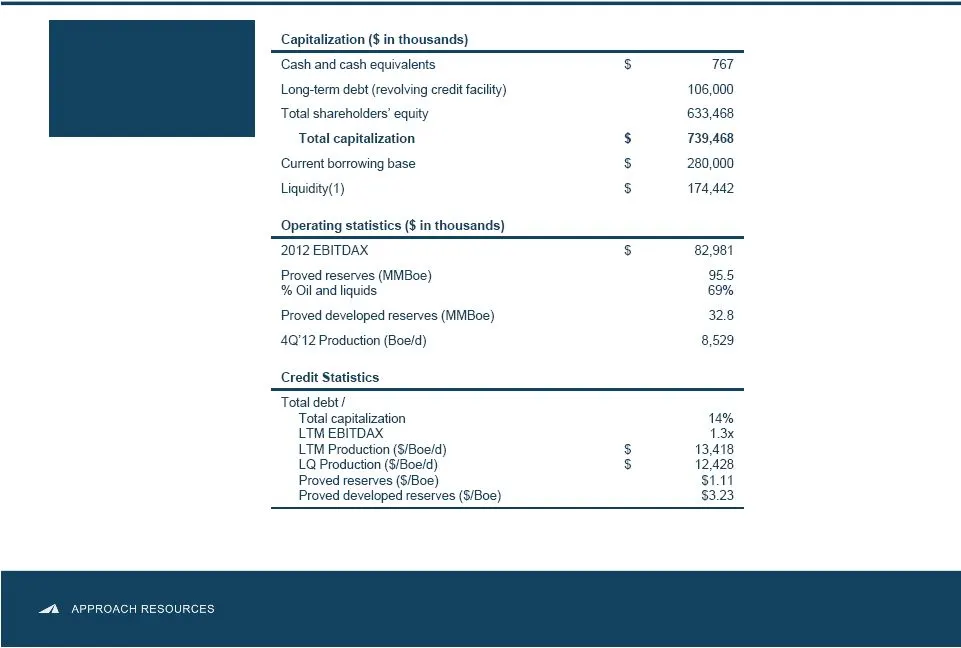
26 CAPITALIZATION & PERFORMANCE METRICS (1) Liquidity calculated as the sum of current borrowing base and cash and cash equivalents less long-term debt and unused letters of credit. Unused letters of credit currently total $325,000. Conservative Financial Strategy & Capitalization
Slide 27: EBITDAX (unaudited)
27 EBITDAX (unaudited) We define EBITDAX as net income, plus (1) exploration expense, (2) impairment expense, (3) depletion, depreciation and amortization expense, (4) share- based compensation expense, (5) unrealized (gain) loss on commodity derivatives, (6) gain on sale of oil and gas properties,
Slide 28: F&D Costs Reconciliation (unaudited)
28 F&D Costs Reconciliation (unaudited) We believe that providing measures of finding and development, or F&D, cost is useful to assist an evaluation of how much it costs the Company, on a per Boe basis, to add proved reserves. However, these measures are provided in addition to, and not as an alter

Slide 29: Contact Information
Contact Information MEGAN P. HAYS Manager, Investor Relations & Corporate Communications 817.989.9000 x2108 [email protected] www.approachresources.com
Source: SEC EDGAR · 8-K filed Apr 15, 2013
More decks from Approach Resources Inc
 Investor Presentation (January 2017)46 slides · Jan 9, 2017
 Proxy Contest (January 2017)47 slides · Jan 5, 2017
 Investor Presentation (December 2016)45 slides · Dec 20, 2016
 Q3 2016 Earnings Presentation33 slides · Nov 3, 2016
 Q3 2015 Earnings Presentation19 slides · Nov 5, 2015
 Q2 2015 Earnings Presentation21 slides · Aug 6, 2015