Macrovision Corp
Macrovision — Debt Investor Presentation (April 2008)
52 slides from Macrovision's debt investor presentation, Apr 8, 2008

Slide 1: Filed by Macrovision Solutions Corporation Pursuant to Rule 425
Filed by Macrovision Solutions Corporation Pursuant to Rule 425 under the Securities Act of 1933 and deemed filed pursuant to Rule 14a-6 under the Securities Exchange Act of 1934 Subject Companies: Macrovision Corporation (Commission File No. 000-22023), Gemstar-TV Guide International, Inc. (Commiss
Slide 2: Lenders Presentation April 9, 2008
Lenders Presentation April 9, 2008 © 2008 Macrovision Corporation | Company Confidential 1
Slide 3: Safe Harbor Statement
Safe Harbor Statement Statements contained in this document regarding the consummation and potential timing and benefits of the pending acquisition are forward-looking statements within the meaning of Section 27A of the Securities Act of 1933, as amended, Section 21E of the Securities and Exchange A
Slide 4: Additional Information
Additional Information Macrovision Solutions Corporation has filed a Registration Statement on Form S-4 (Registration No. 333-148825) containing a joint proxy statement-prospectus regarding the proposed transaction and other documents regarding the proposed transaction with the Securities and Exchan
Slide 5: Introduction
Introduction JPMorgan © 2008 Macrovision Corporation | Company Confidential 4
Slide 6: Transaction Overview
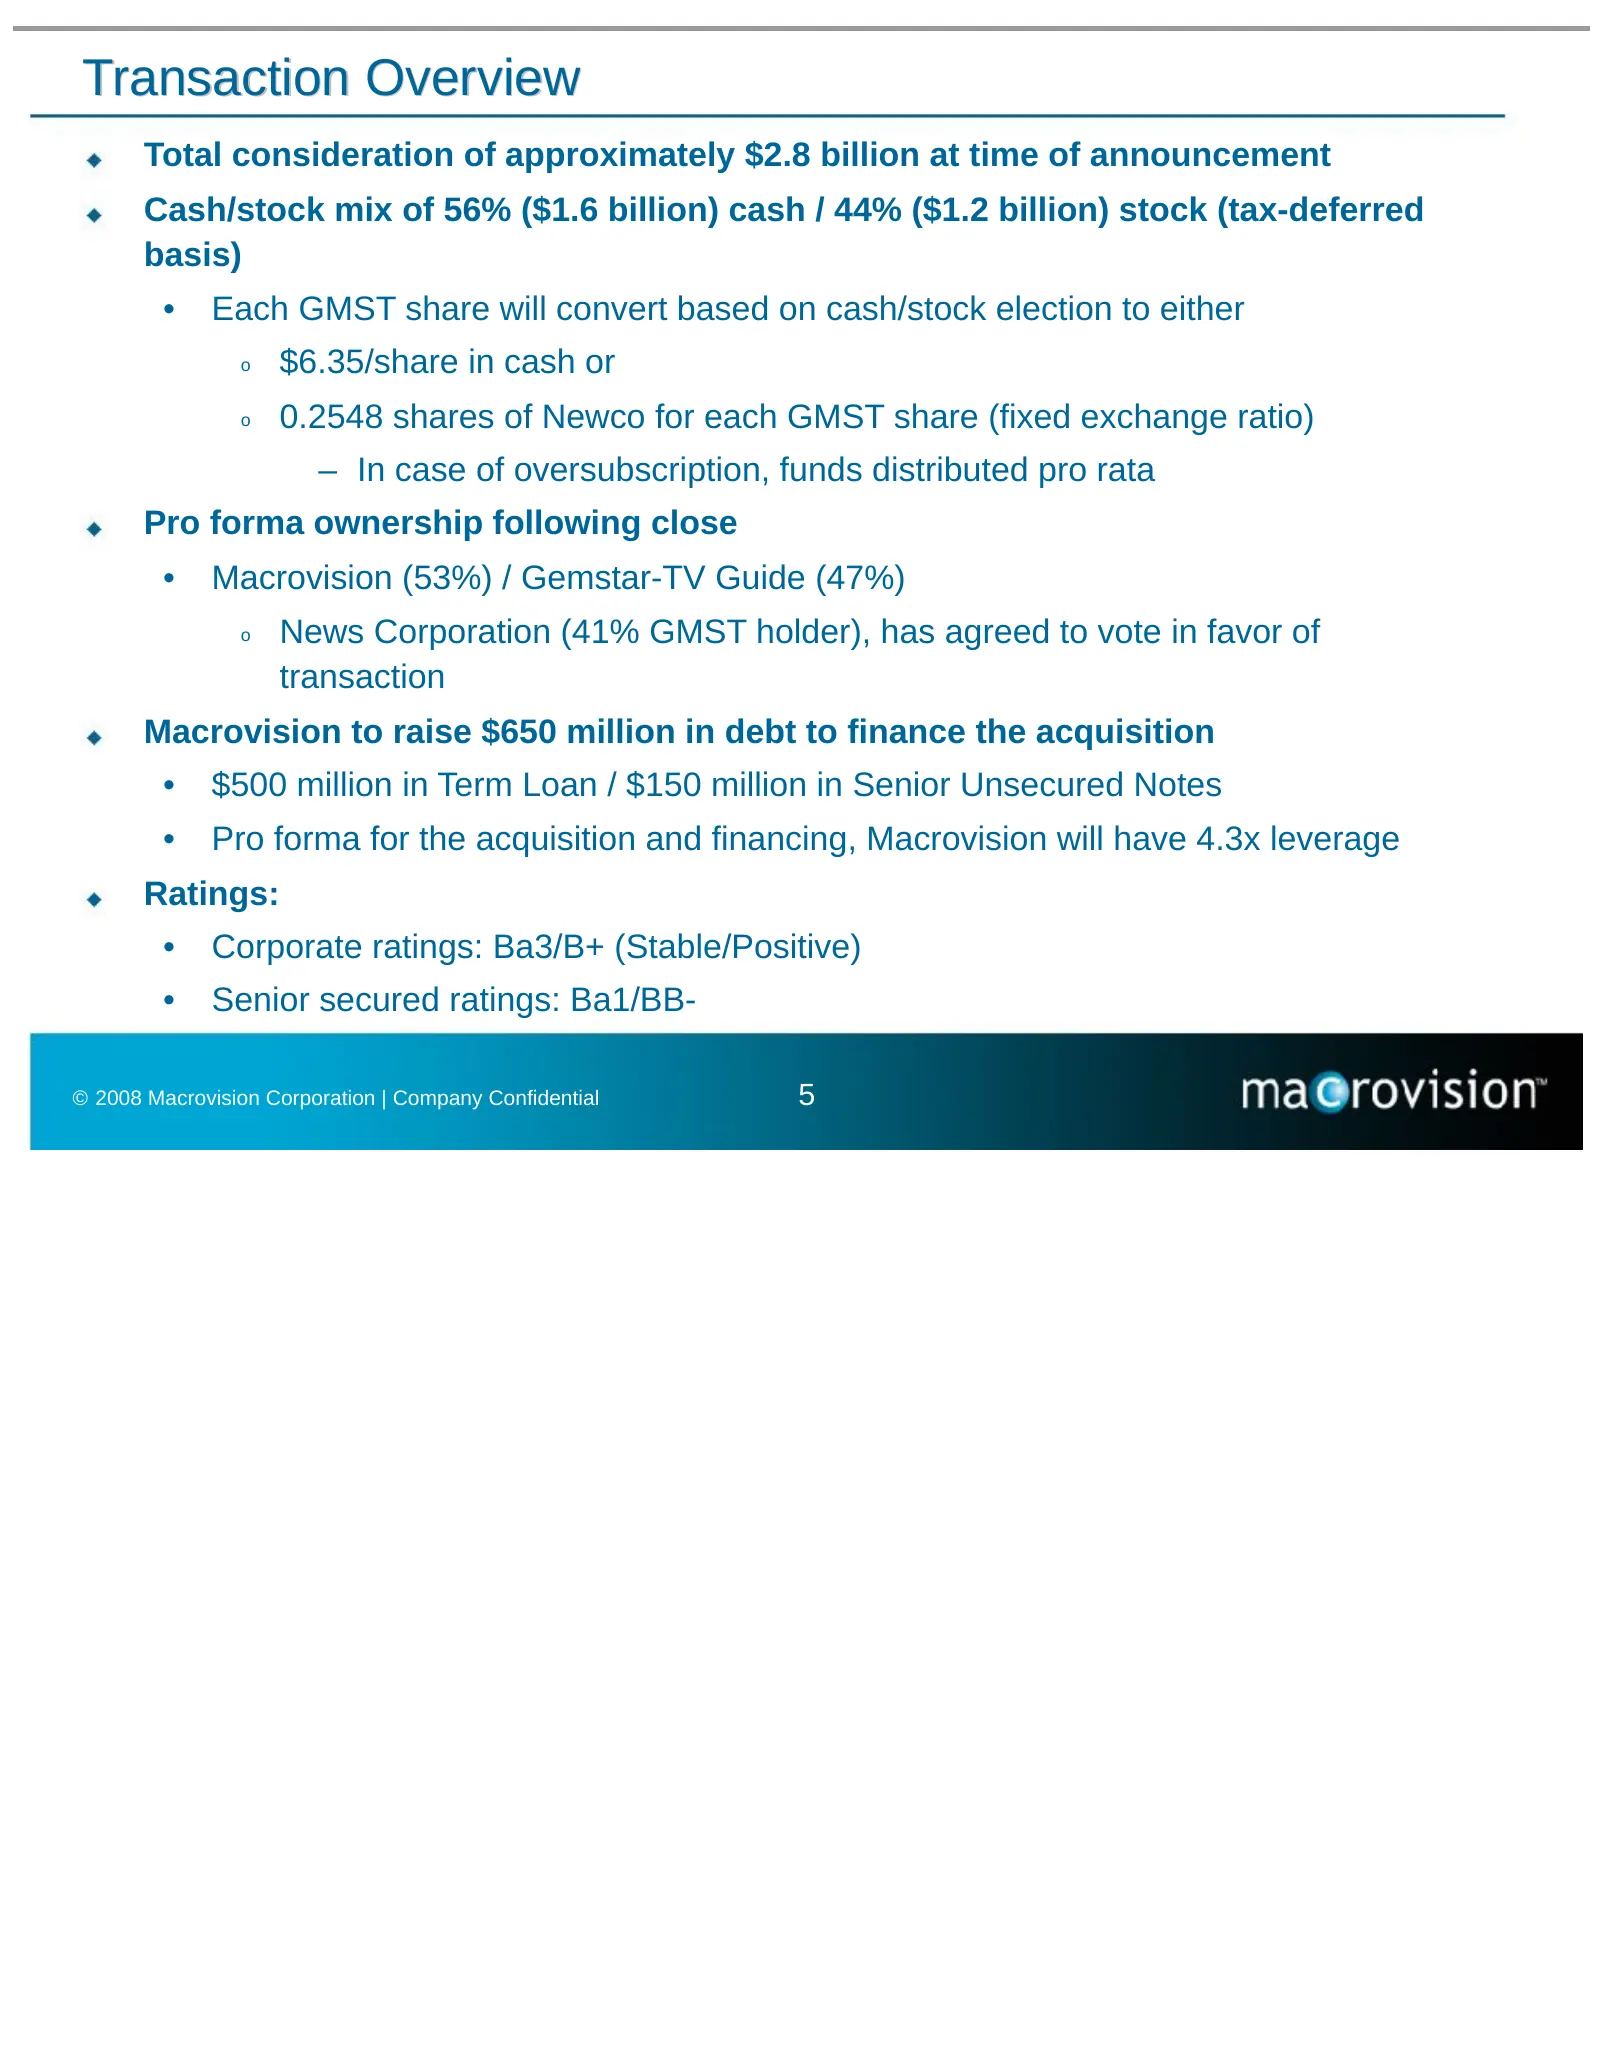
Transaction Overview Total consideration of approximately $2.8 billion at time of announcement Cash/stock mix of 56% ($1.6 billion) cash / 44% ($1.2 billion) stock (tax-deferred basis) • Each GMST share will convert based on cash/stock election to either o $6.35/share in cash or o 0.2548 shares of N
Slide 7: Source & Uses and Pro Forma Capitalization
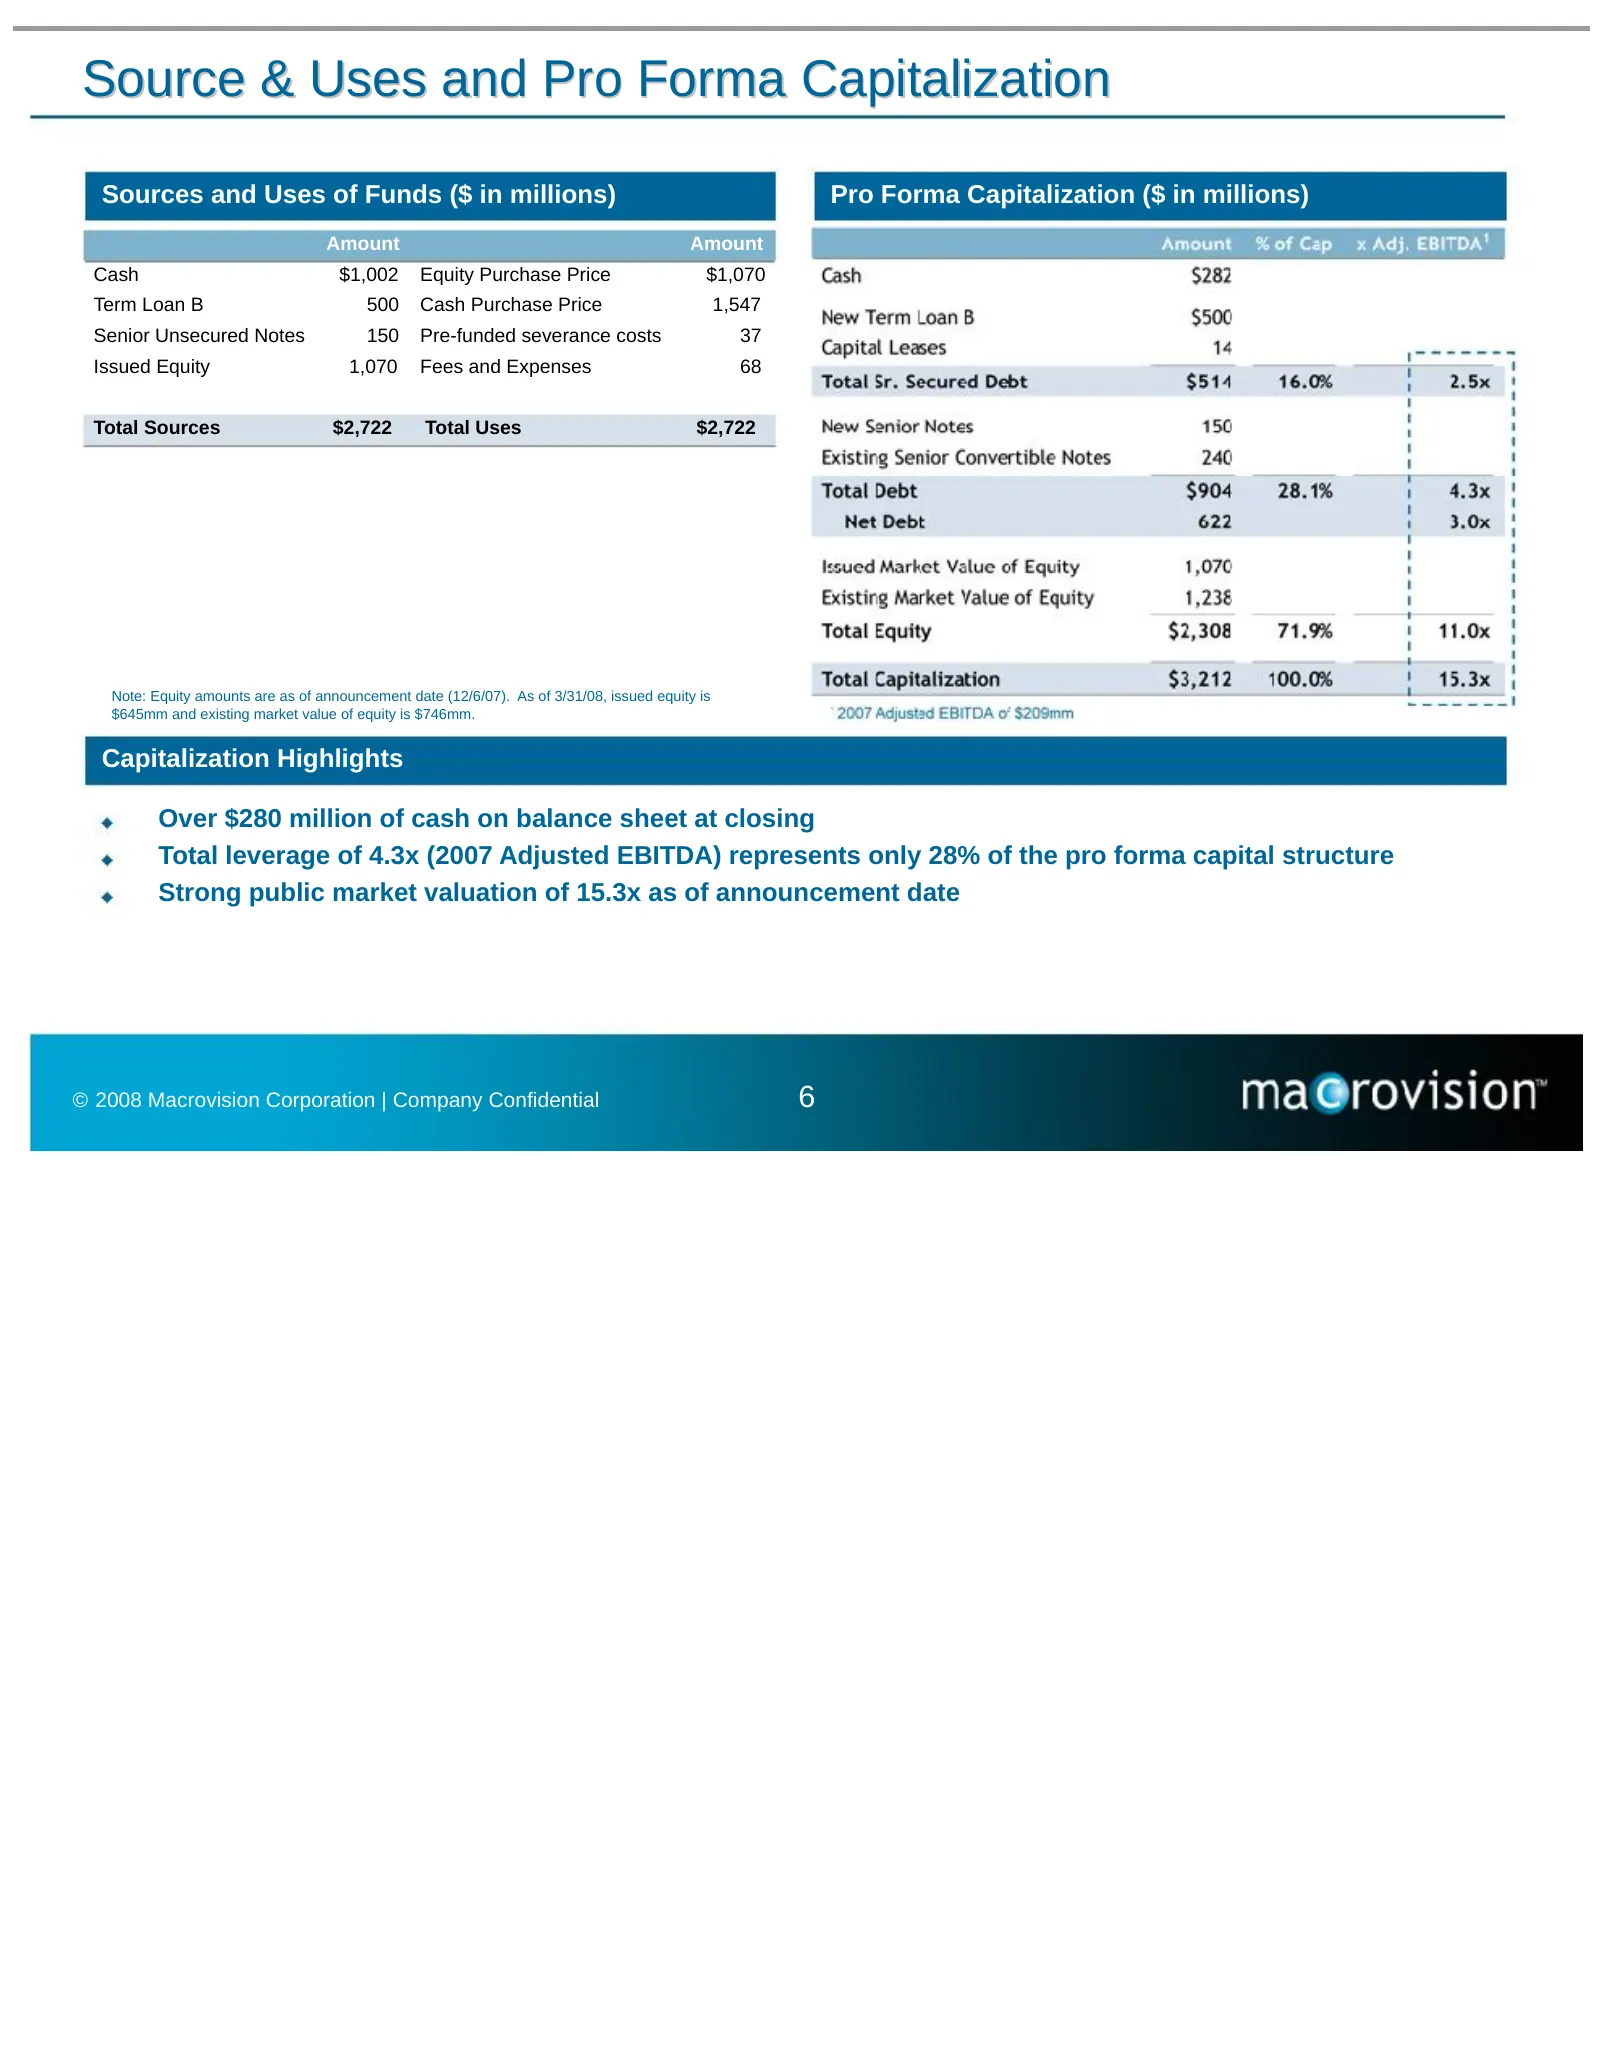
Source & Uses and Pro Forma Capitalization Sources and Uses of Funds ($ in millions) Pro Forma Capitalization ($ in millions) Amount Amount Cash $1,002 Equity Purchase Price $1,070 Term Loan B 500 Cash Purchase Price 1,547 Senior Unsecured Notes 150 Pre-funded severance costs 37 Issued Equity 1,070
Slide 8: Executive Summary
Executive Summary Fred Amoroso, CEO, Macrovision © 2008 Macrovision Corporation | Company Confidential 7
Slide 9: Macrovision Solutions Overview
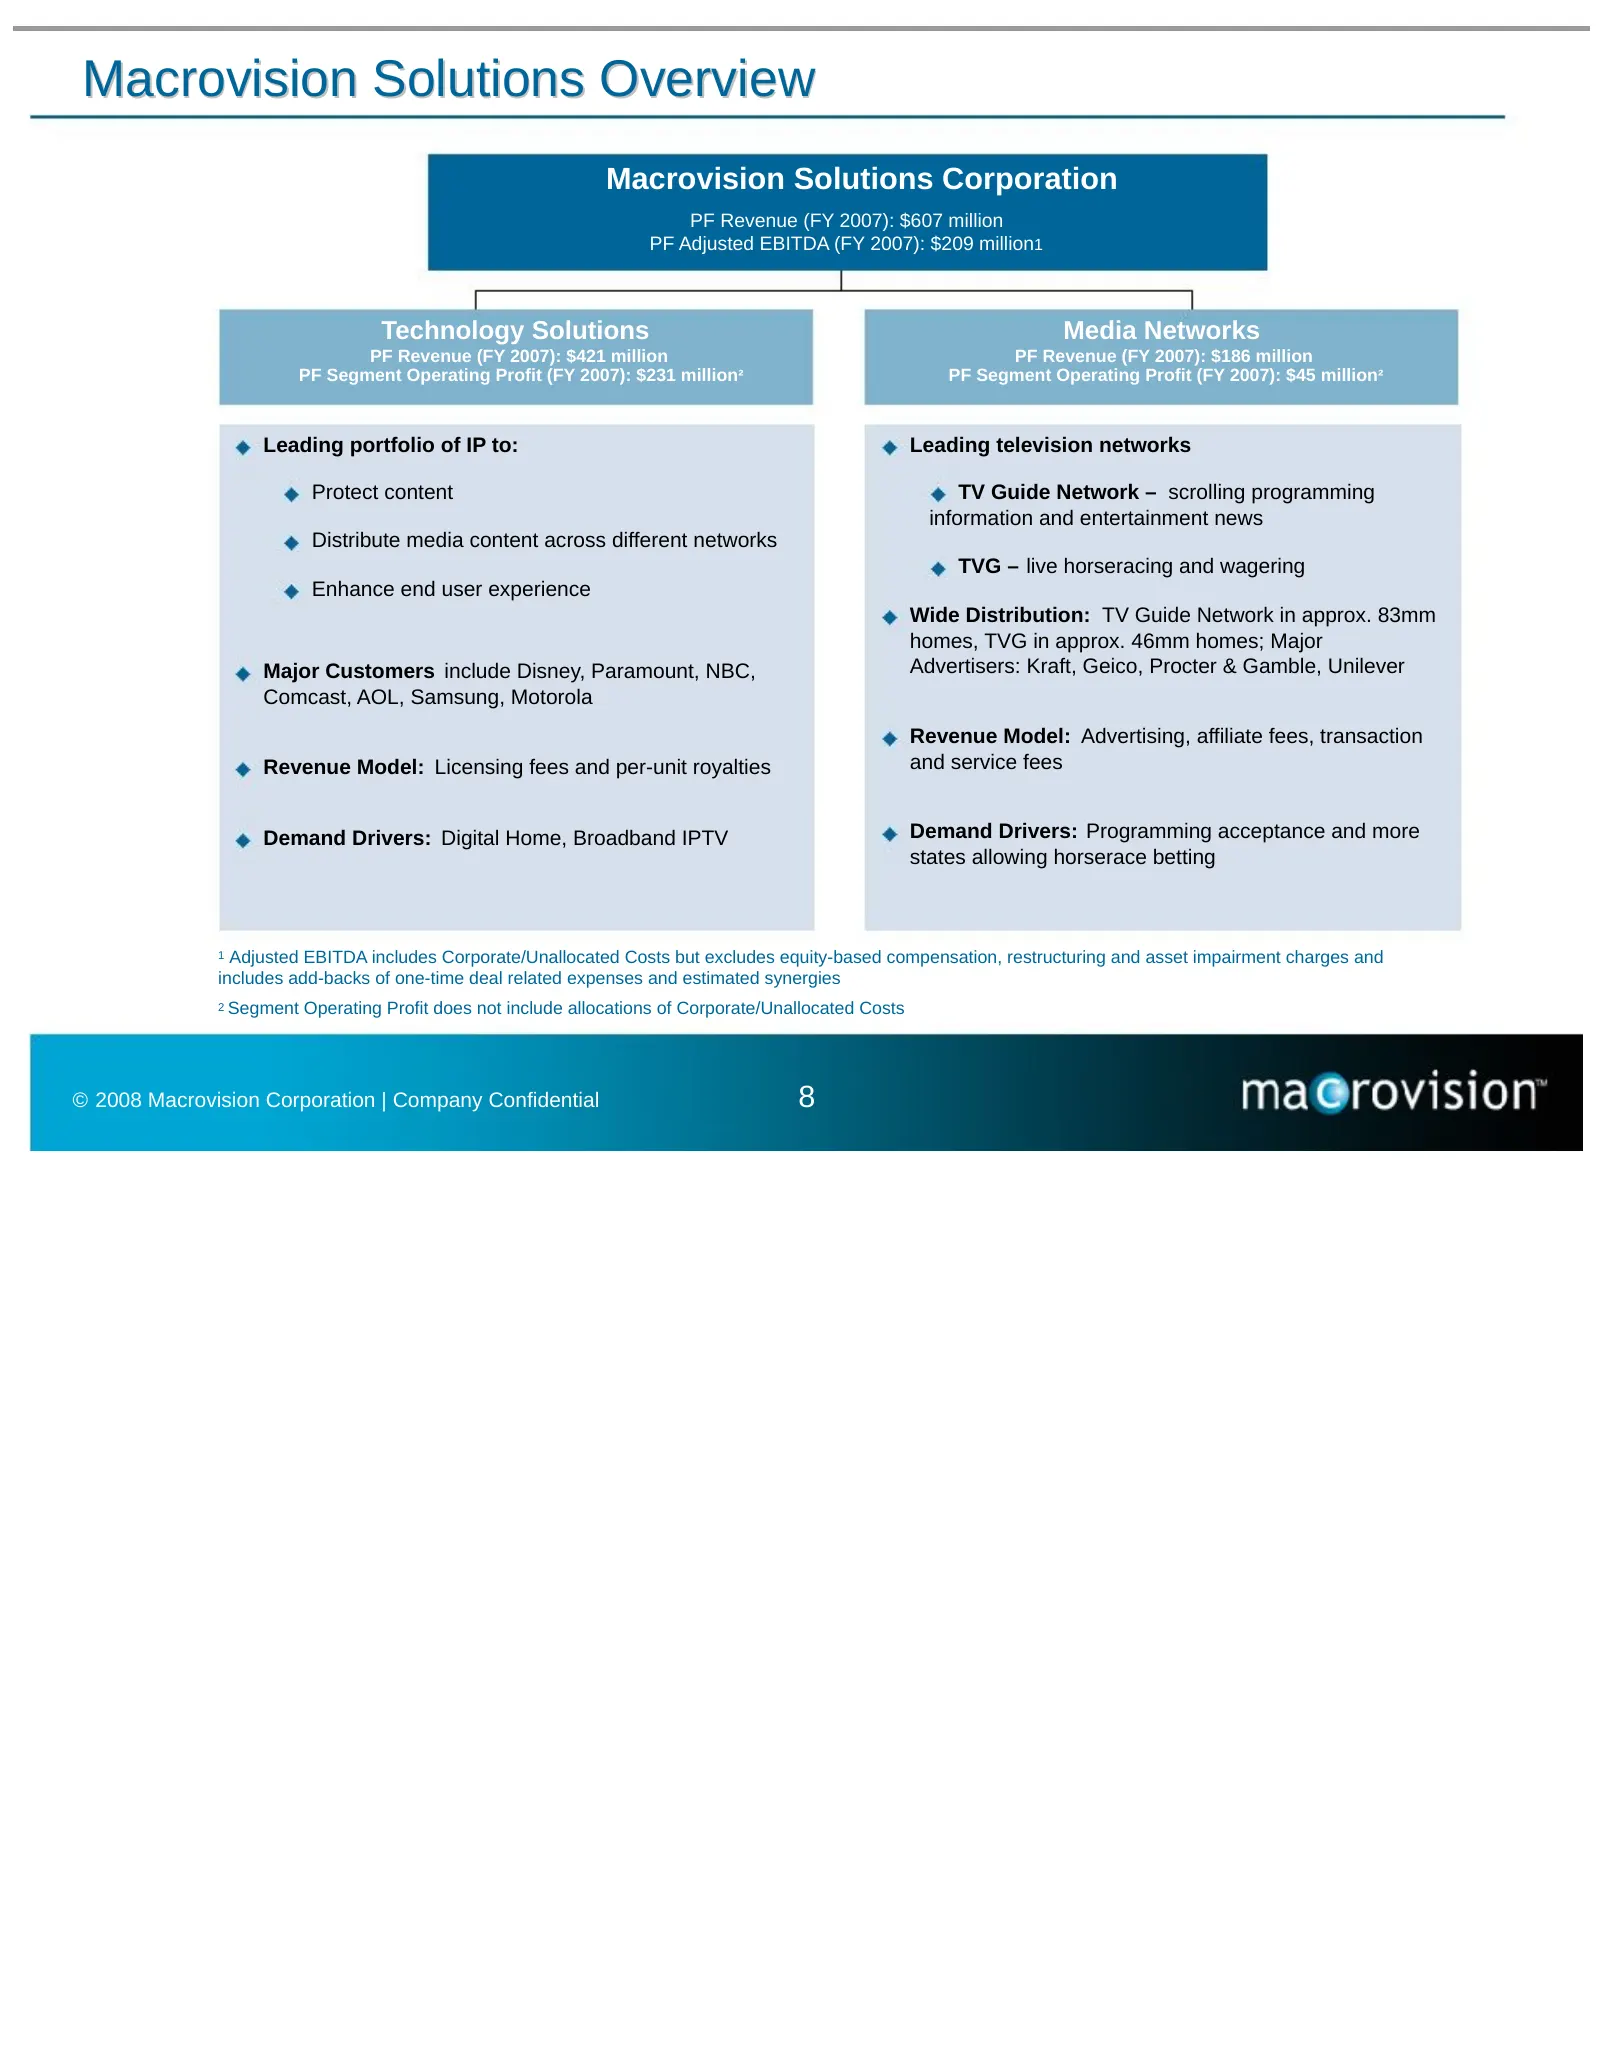
Macrovision Solutions Overview Macrovision Solutions Corporation PF Revenue (FY 2007): $607 million PF Adjusted EBITDA (FY 2007): $209 million1 Technology Solutions Media Networks PF Revenue (FY 2007): $421 million PF Revenue (FY 2007): $186 million PF Segment Operating Profit (FY 2007): $231 millio
Slide 10: Macrovision Solutions Recurring Revenue Model
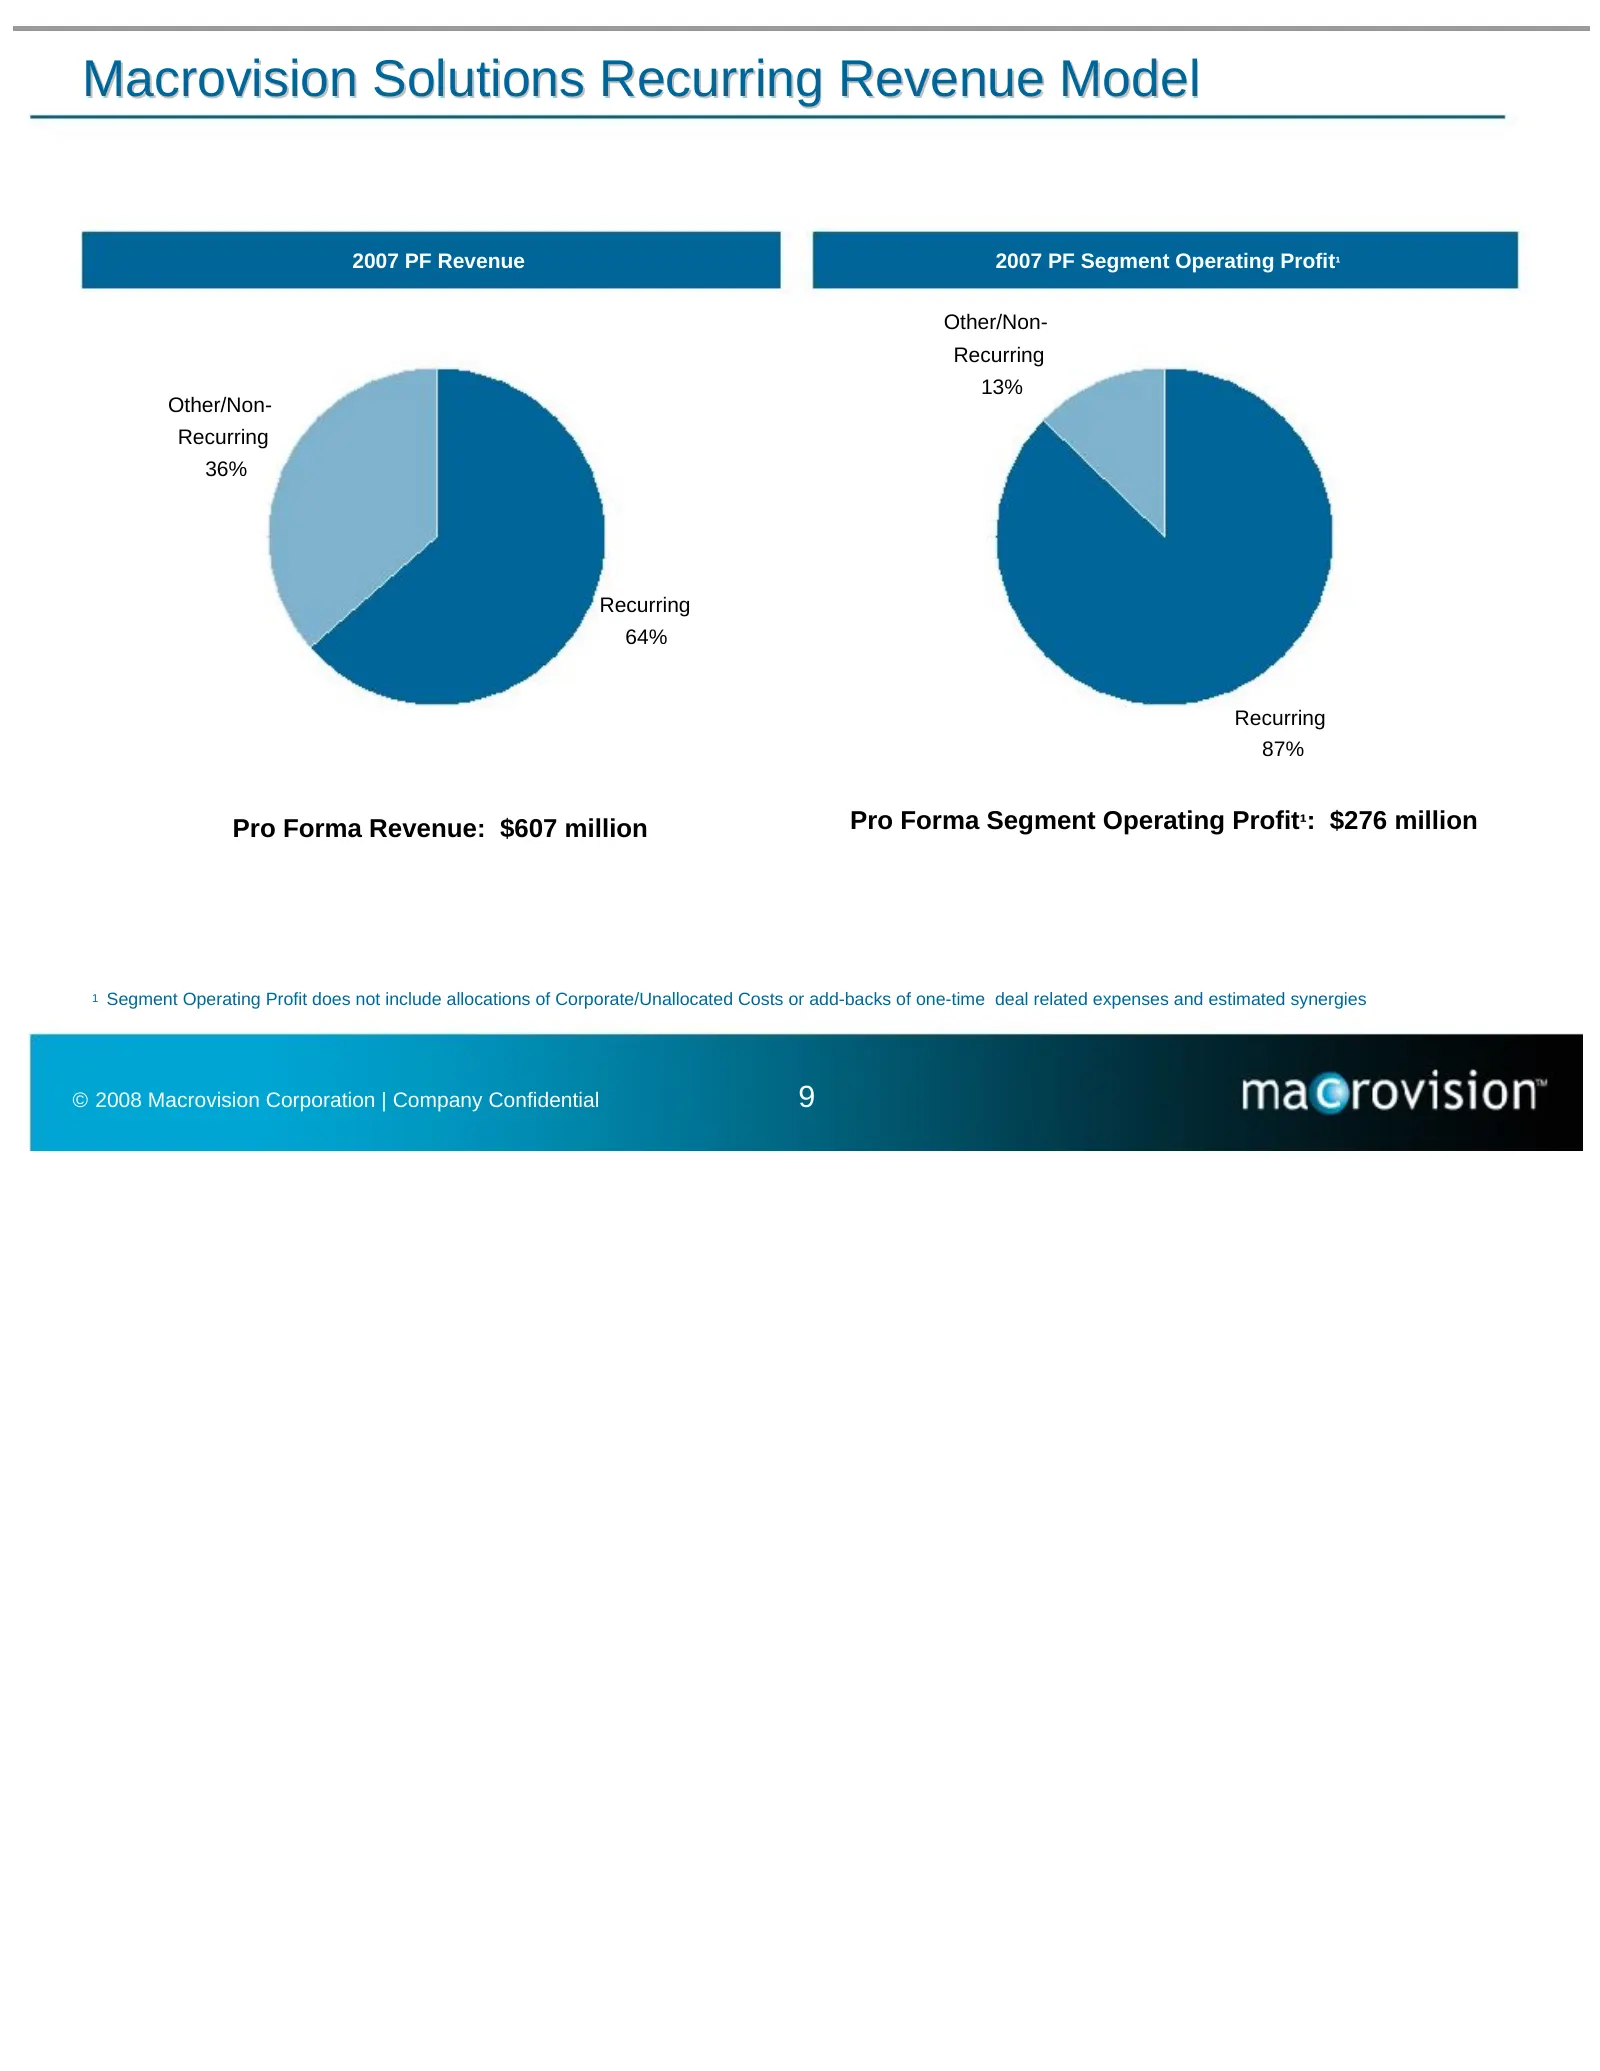
Macrovision Solutions Recurring Revenue Model 2007 PF Revenue 2007 PF Segment Operating Profit¹ Other/Non- Recurring 13% Other/Non- Recurring 36% Recurring 64% Recurring 87% Pro Forma Revenue: $607 million Pro Forma Segment Operating Profit¹: $276 million 1 Segment Operating Profit does not include
Slide 11: Strategic Rationale
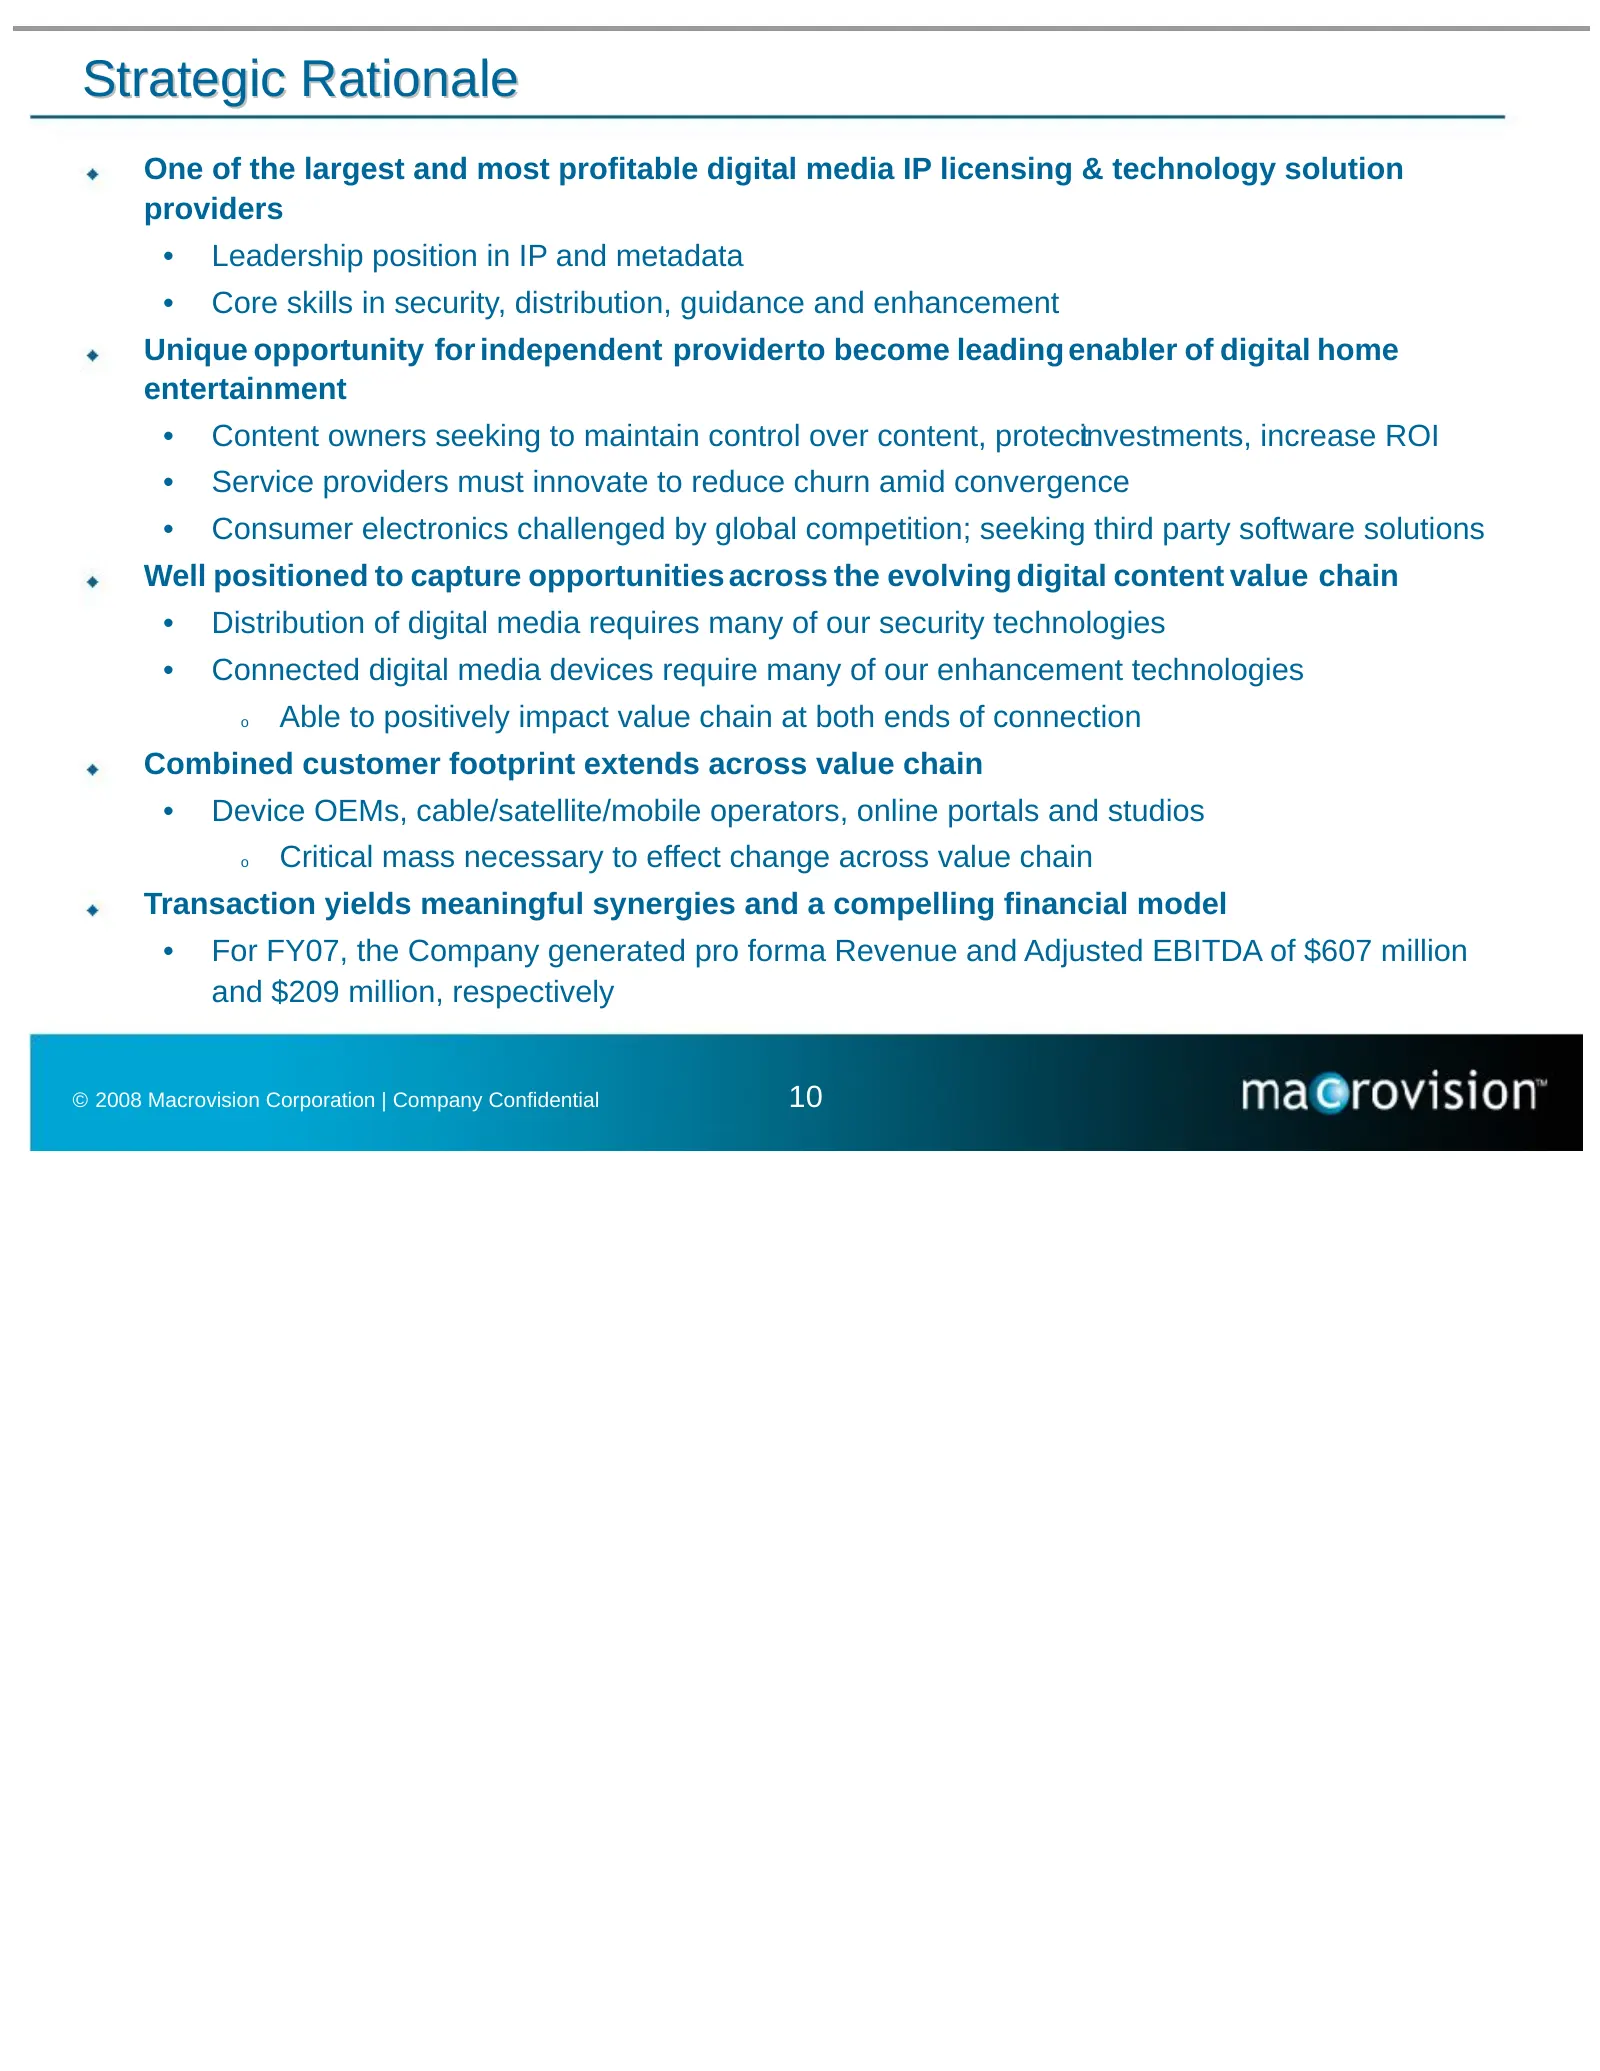
Strategic Rationale One of the largest and most profitable digital media IP licensing & technology solution providers • Leadership position in IP and metadata • Core skills in security, distribution, guidance and enhancement Unique opportunity-for independent-providerto become leading enabler of dig
Slide 12: Executive Management Team
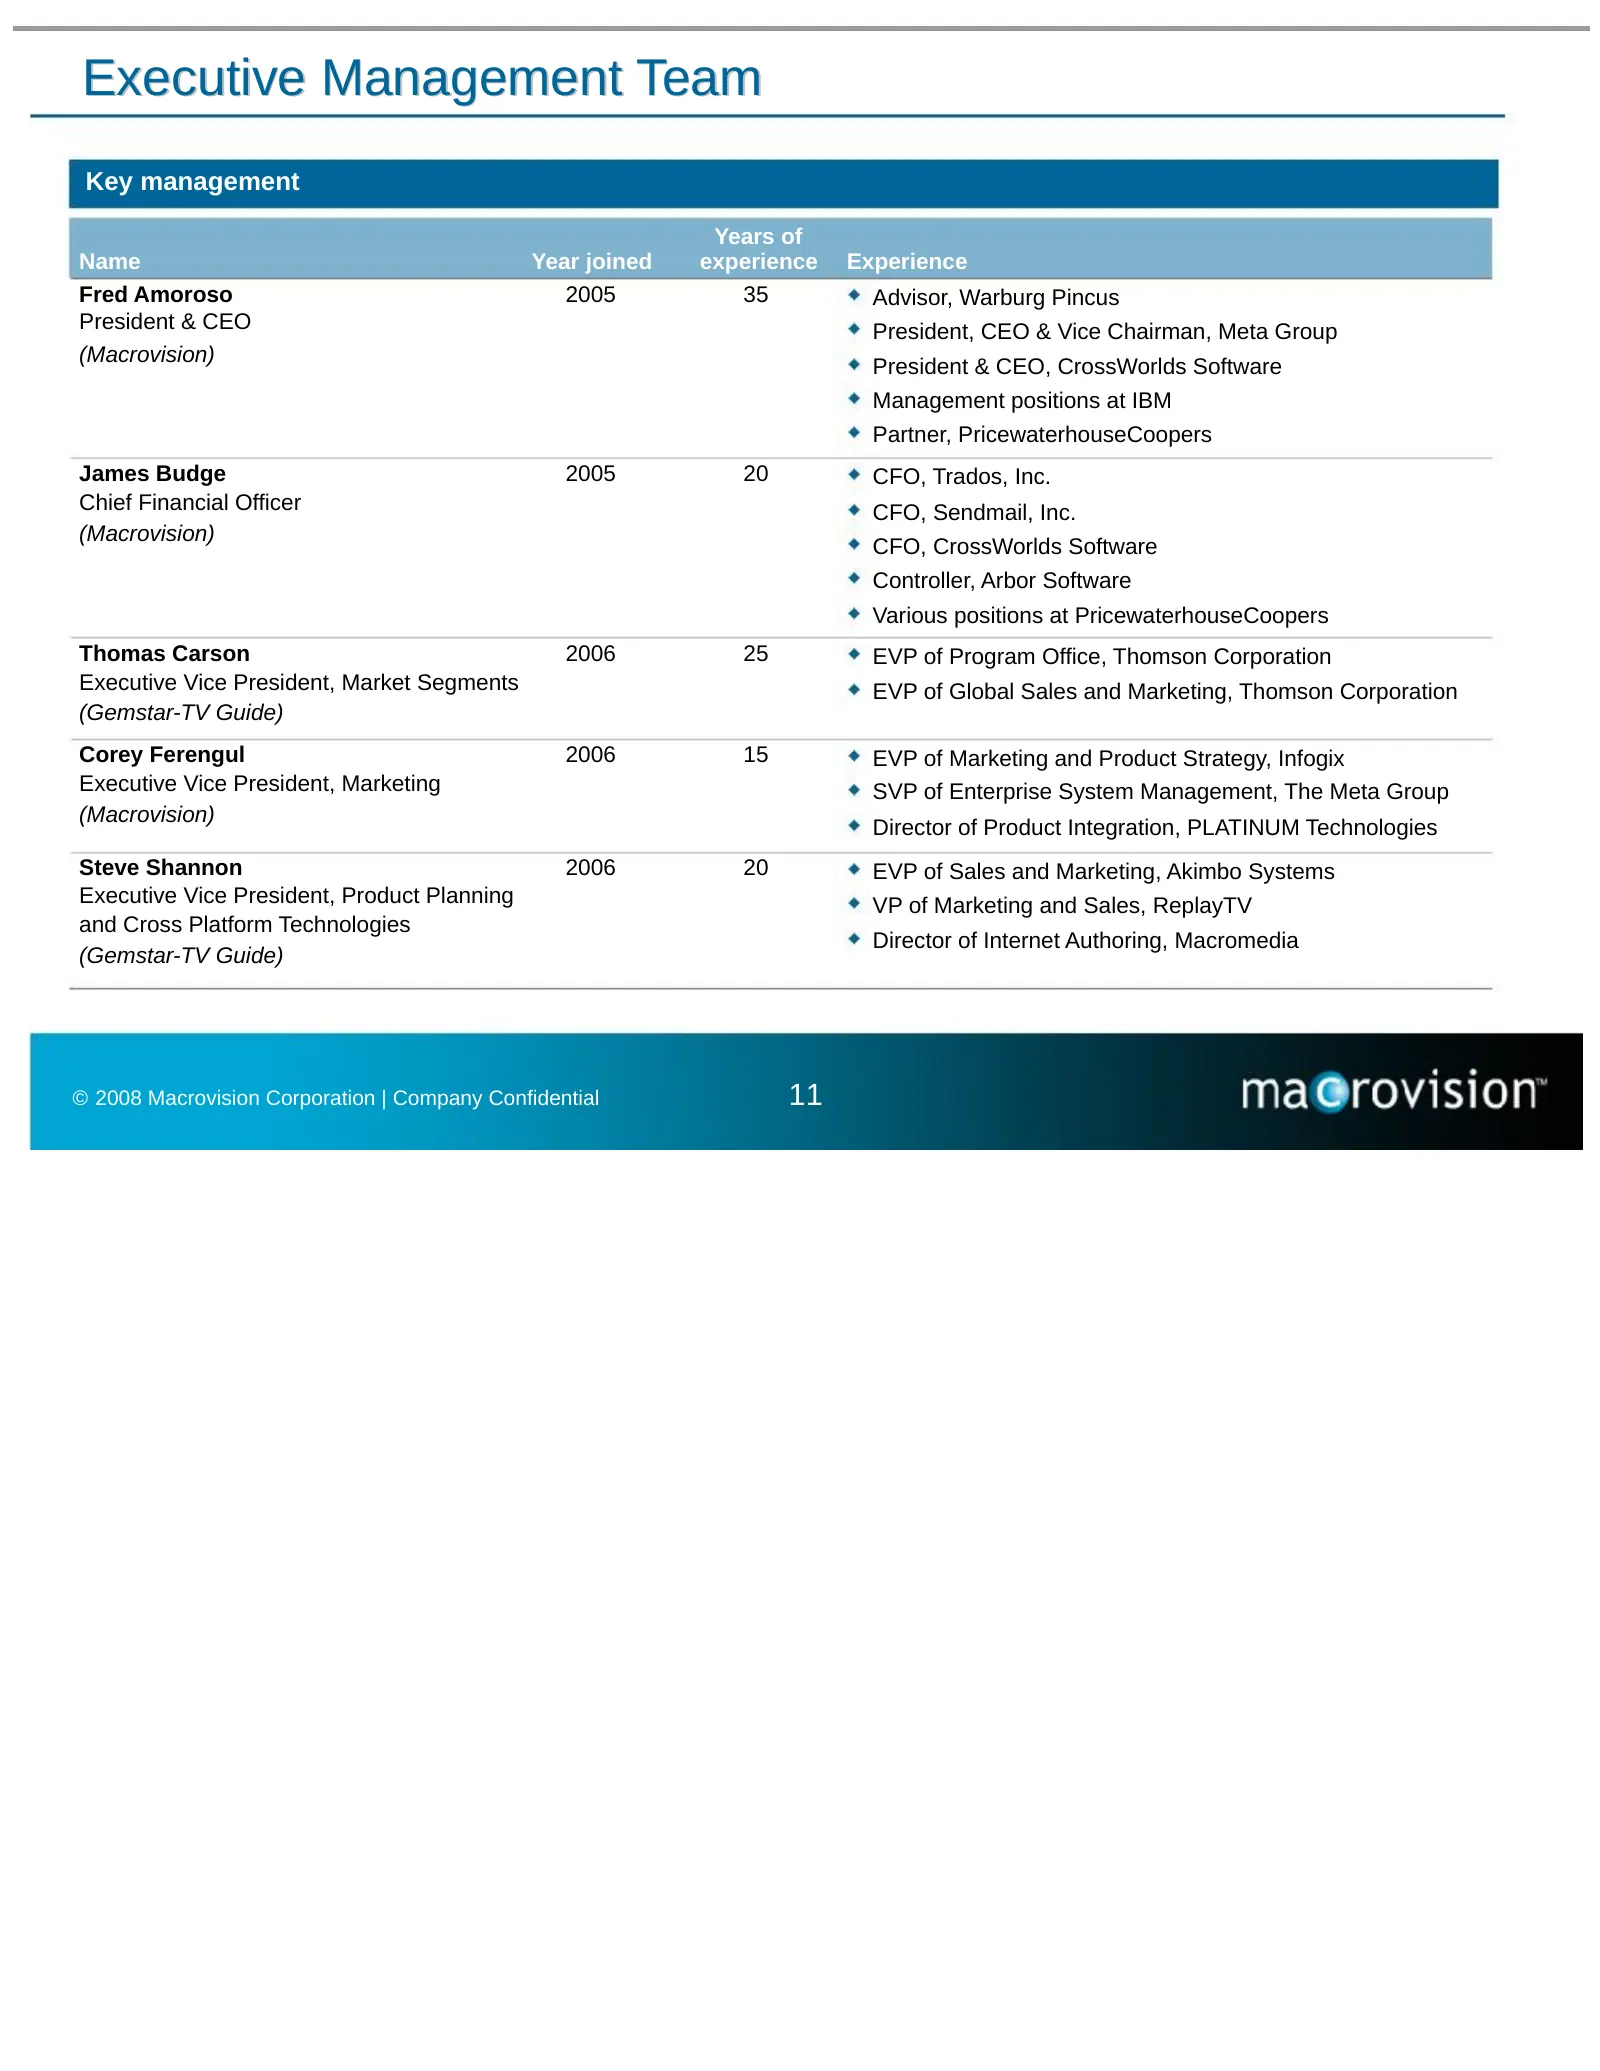
Executive Management Team Key management Years of Name Year joined experience Experience Fred Amoroso 2005 35 Advisor, Warburg Pincus President & CEO President, CEO & Vice Chairman, Meta Group (Macrovision) President & CEO, CrossWorlds Software Management positions at IBM Partner, PricewaterhouseCoo
Slide 13: Key Investment Highlights
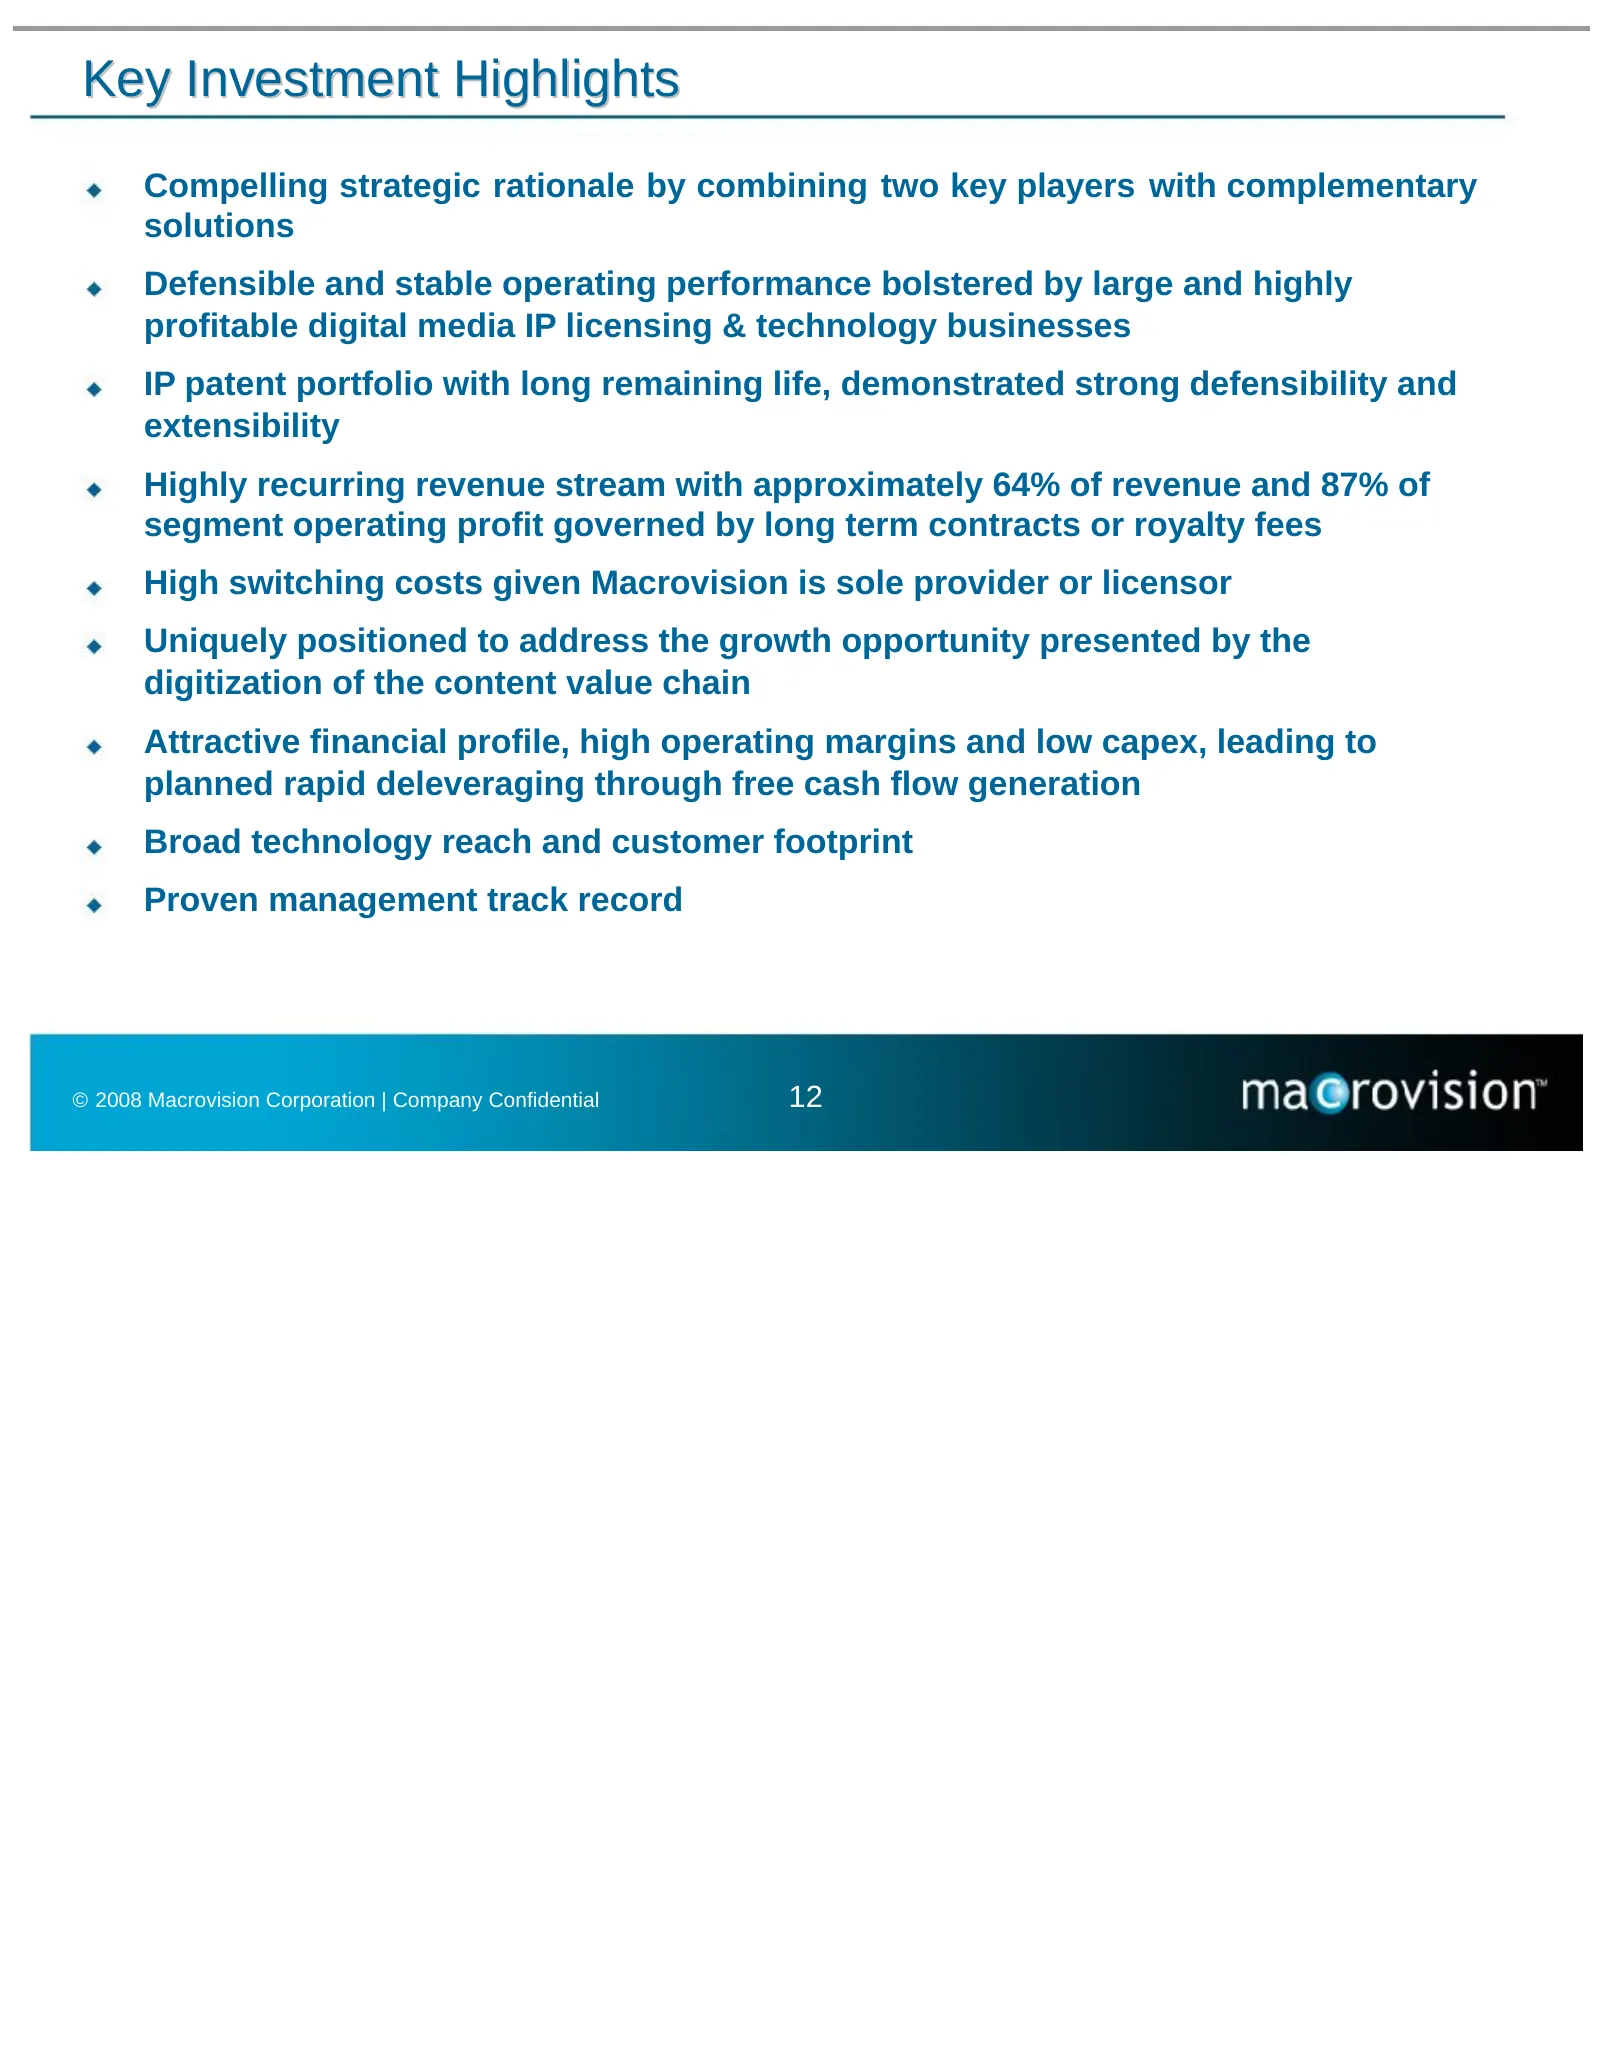
Key Investment Highlights Compelling strategic rationale by combining two key players with complementary solutions Defensible and stable operating performance bolstered by large and highly profitable digital media IP licensing & technology businesses IP patent portfolio with long remaining life, dem
Slide 14: Industry Overview
Industry Overview Fred Amoroso, CEO, Macrovision © 2008 Macrovision Corporation | Company Confidential 13
Slide 15: Market Transformation
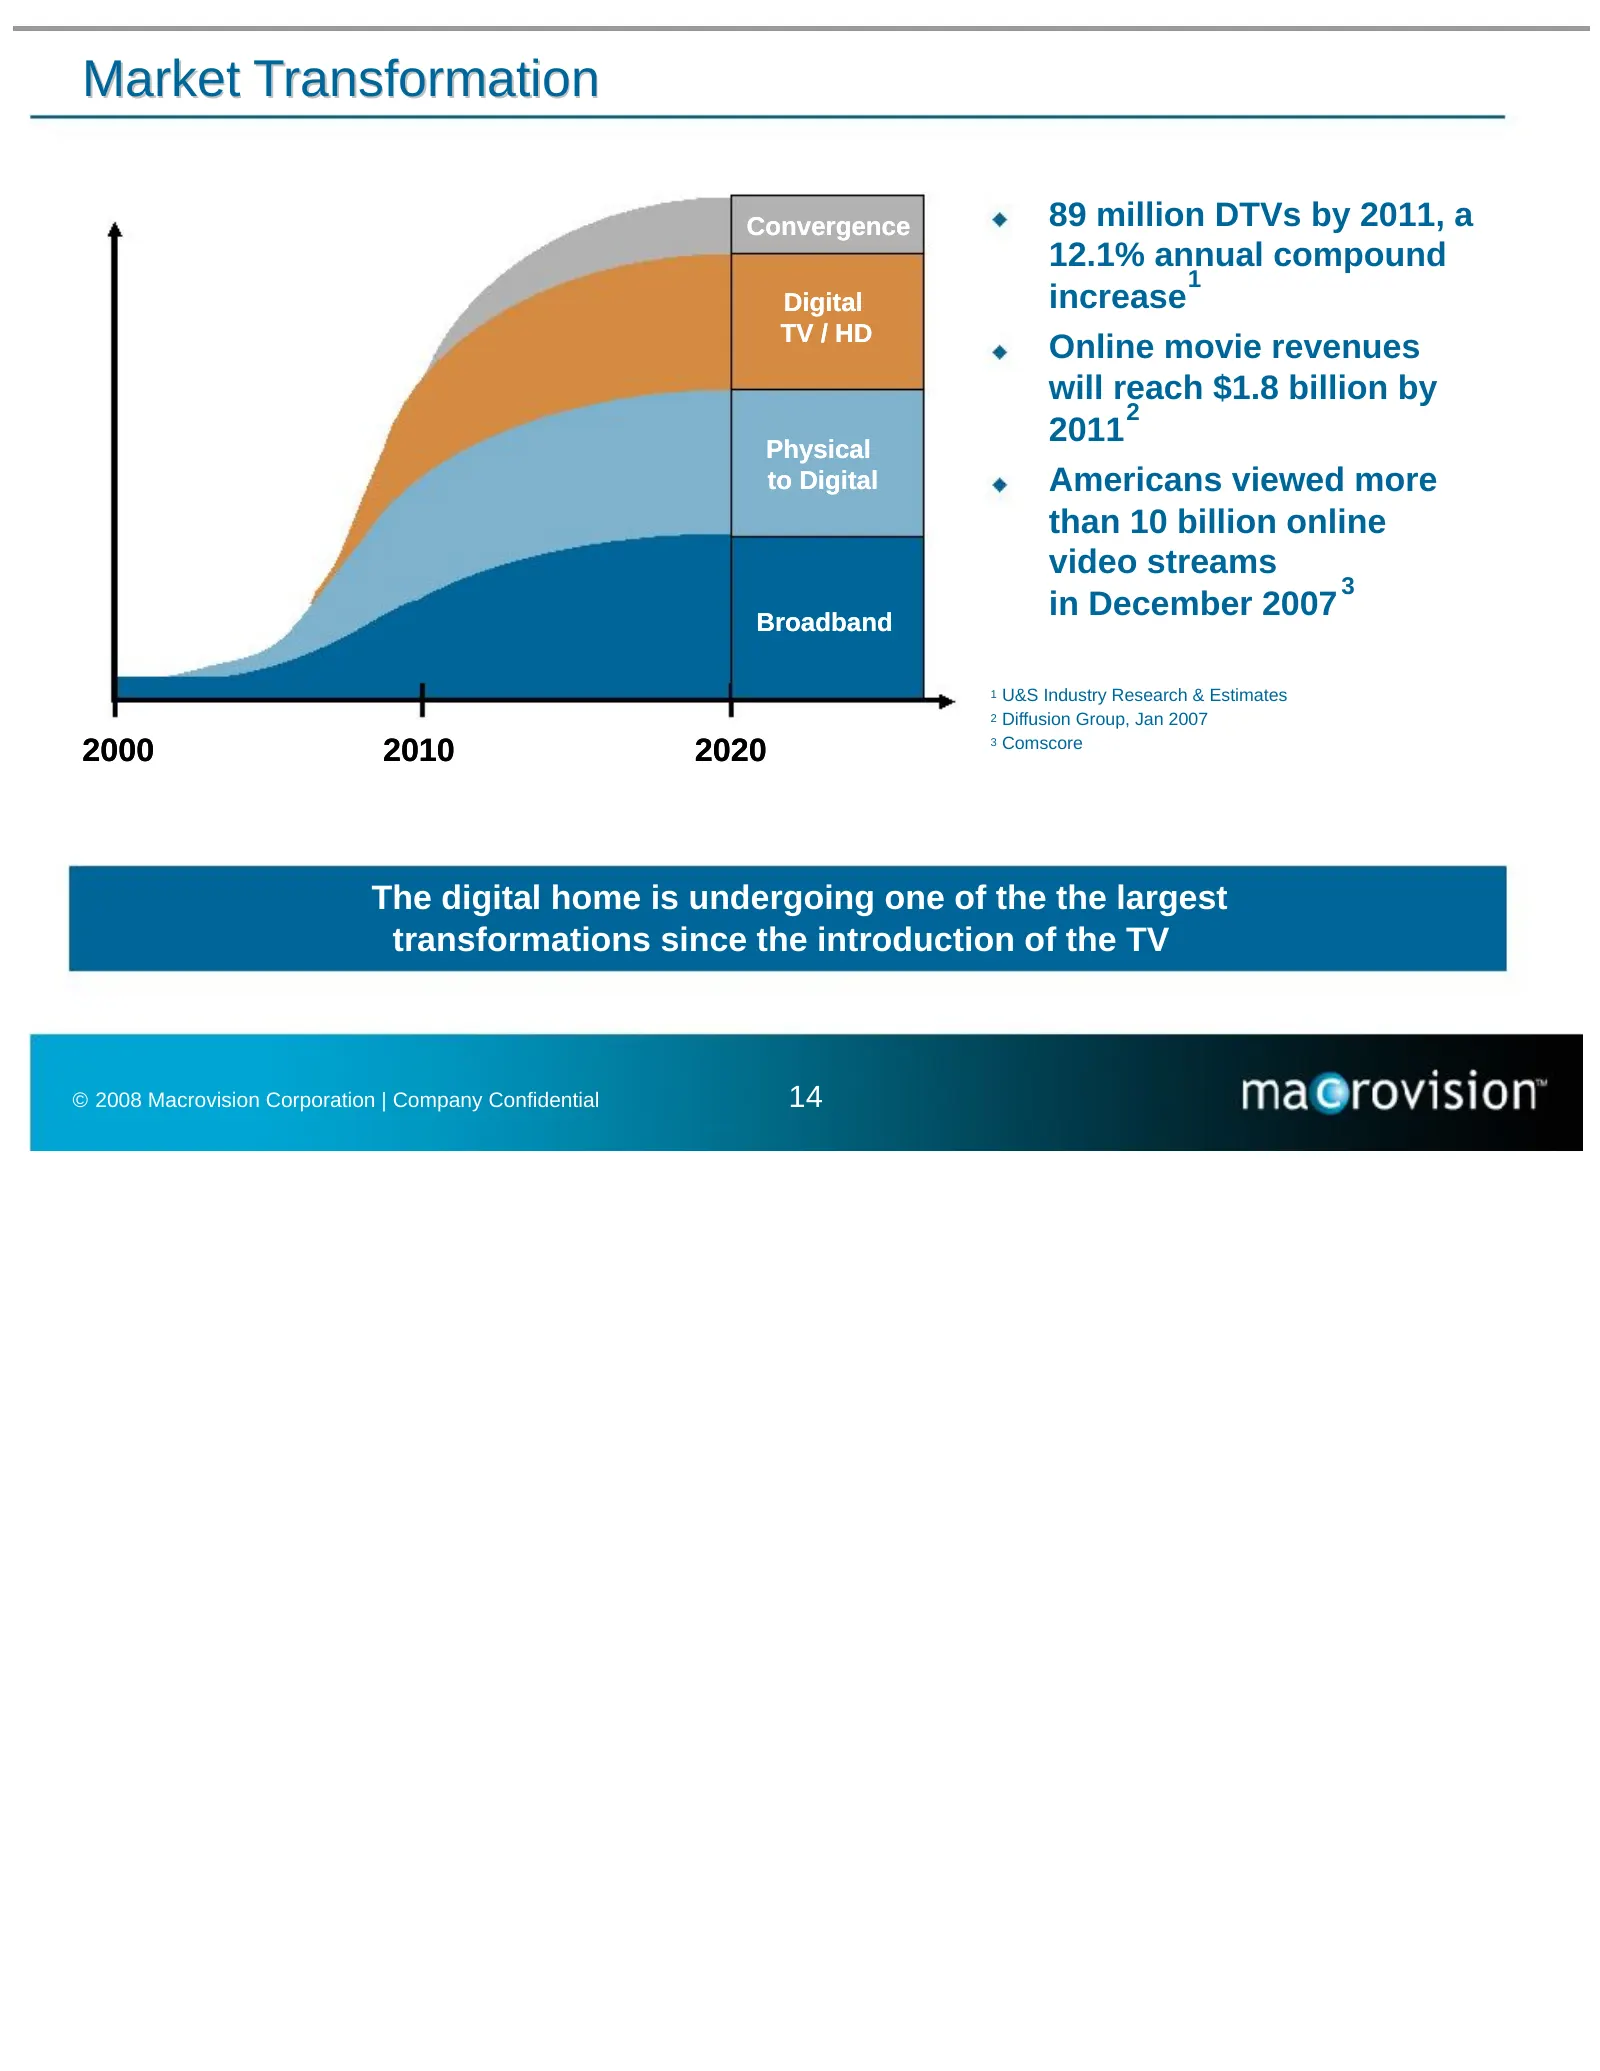
Market Transformation Convergence 89 million DTVs by 2011, a 12.1% annual compound 1 Digital increase TV / HD Online movie revenues will reach $1.8 billion by 2 2011 Physical to Digital Americans viewed more than 10 billion online video streams 3 Broadband in December 2007 1 U&S Industry Research &
Slide 16: Growing Demand for Digital Products and Services
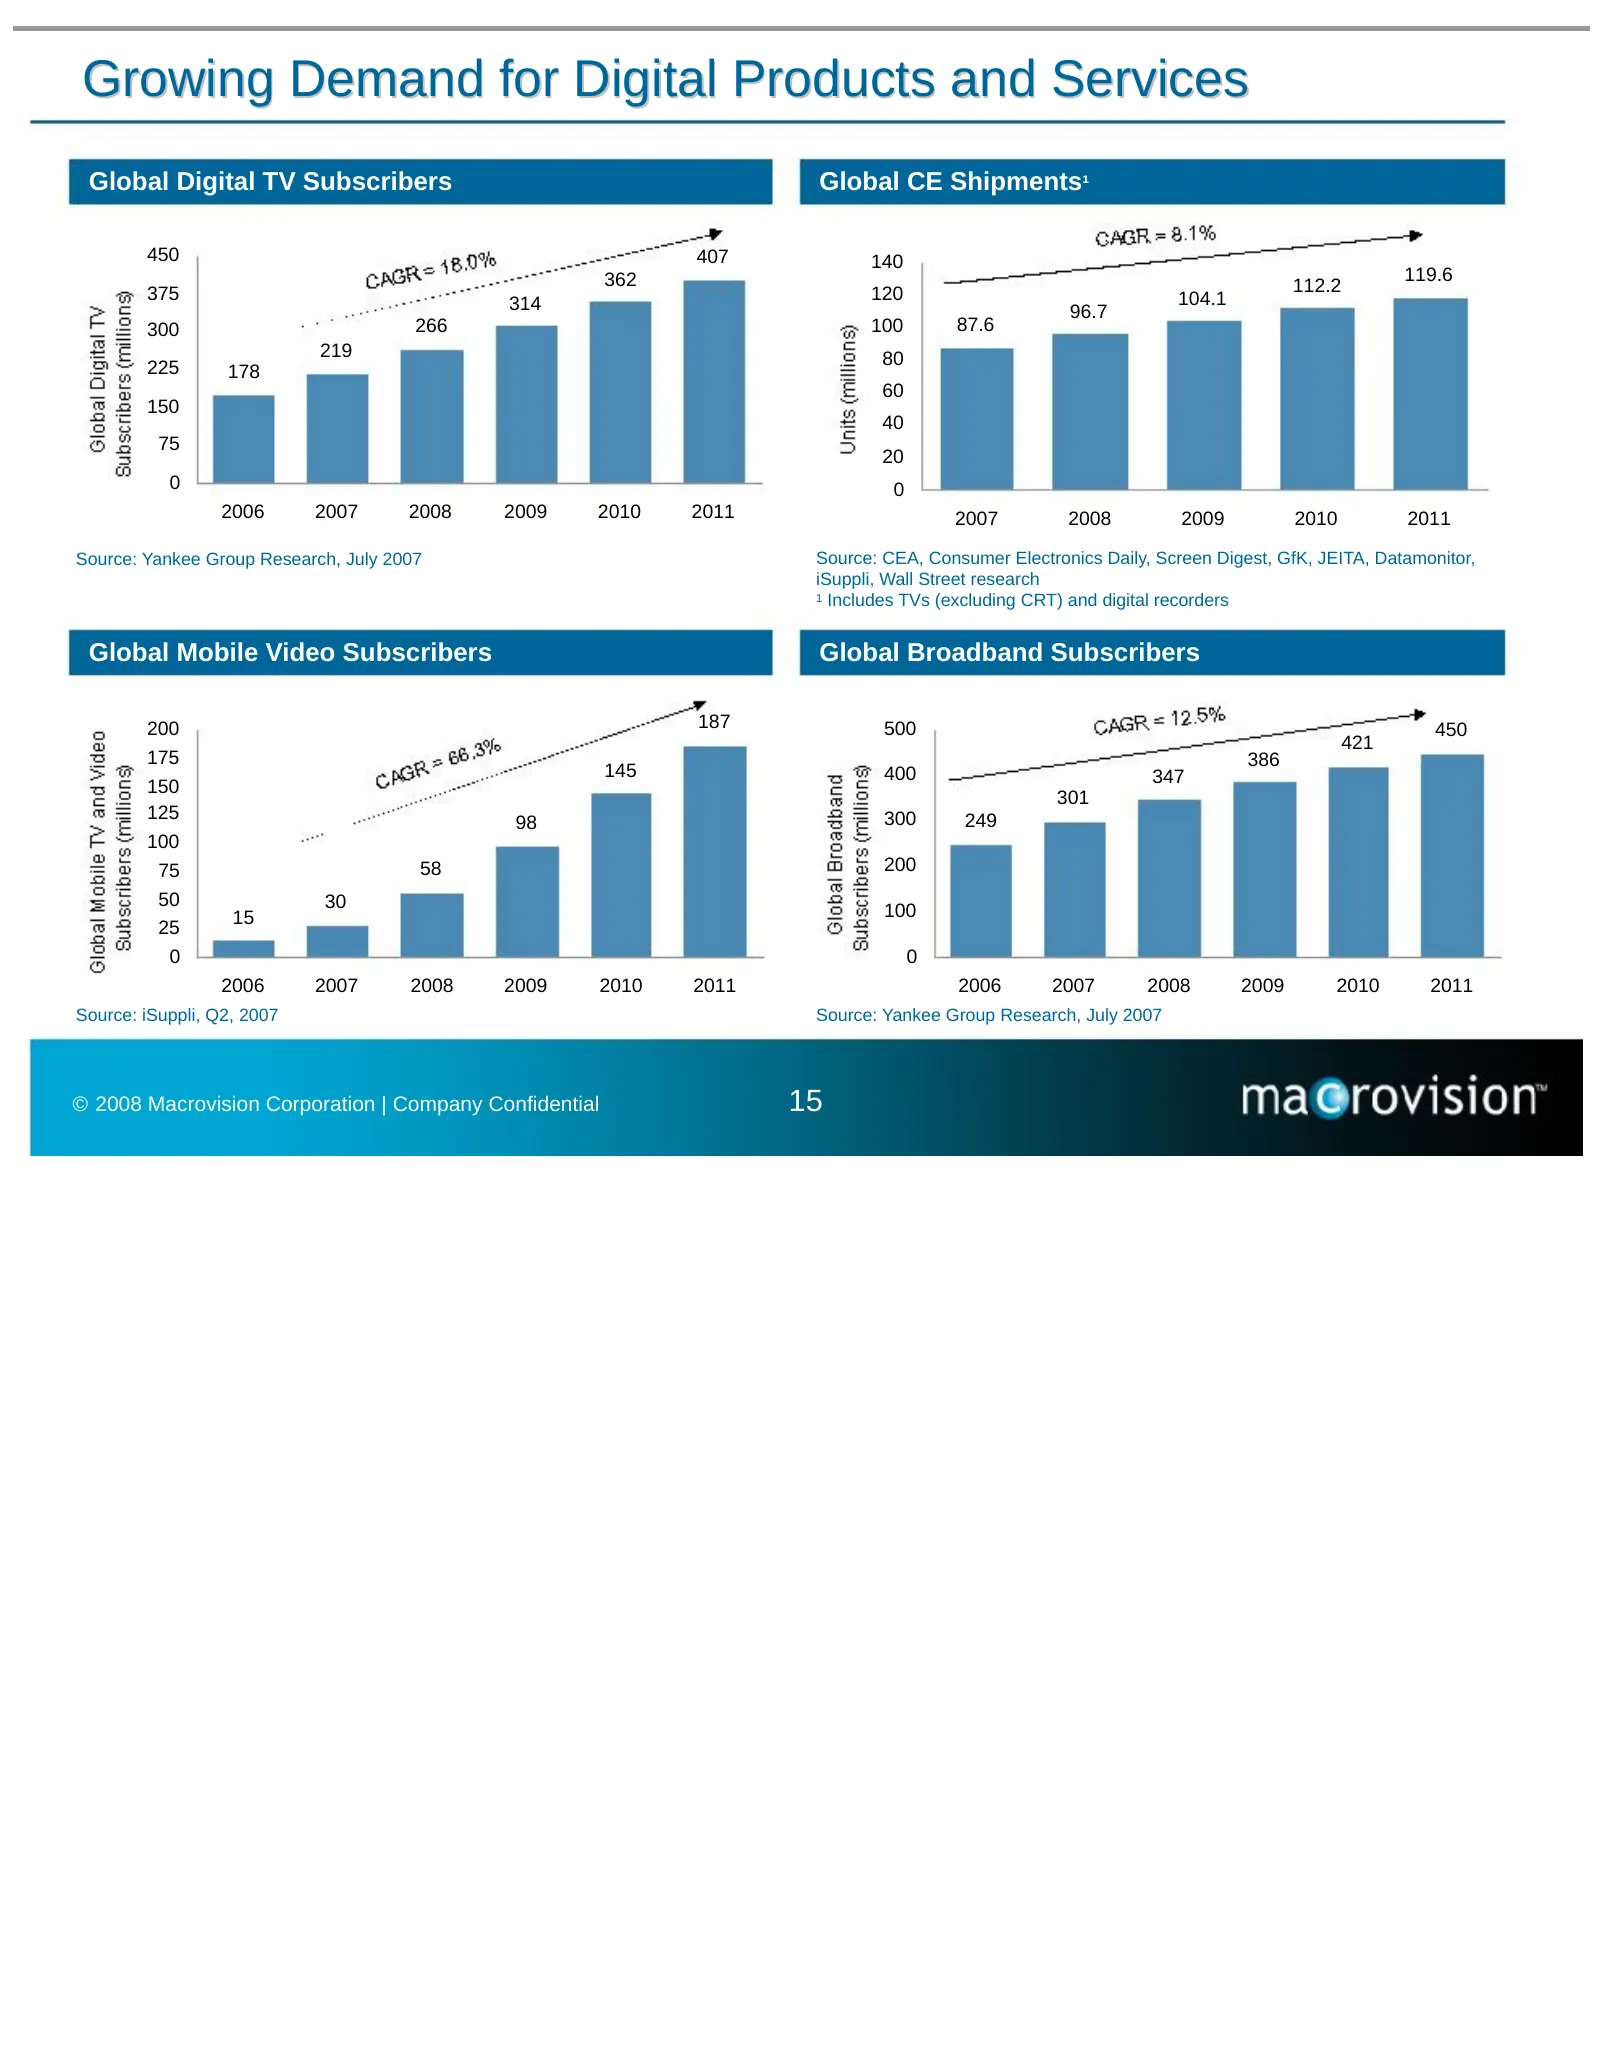
Growing Demand for Digital Products and Services Global Digital TV Subscribers Global CE Shipments¹ 450 407 140 362 119.6 375 120 112.2 314 104.1 96.7 300 266 100 87.6 219 80 225 178 60 150 40 75 20 0 0 2006 2007 2008 2009 2010 2011 2007 2008 2009 2010 2011 Source: Yankee Group Research, July 2007 S
Slide 17: Technology Solutions Market Segment Overview – Guidance
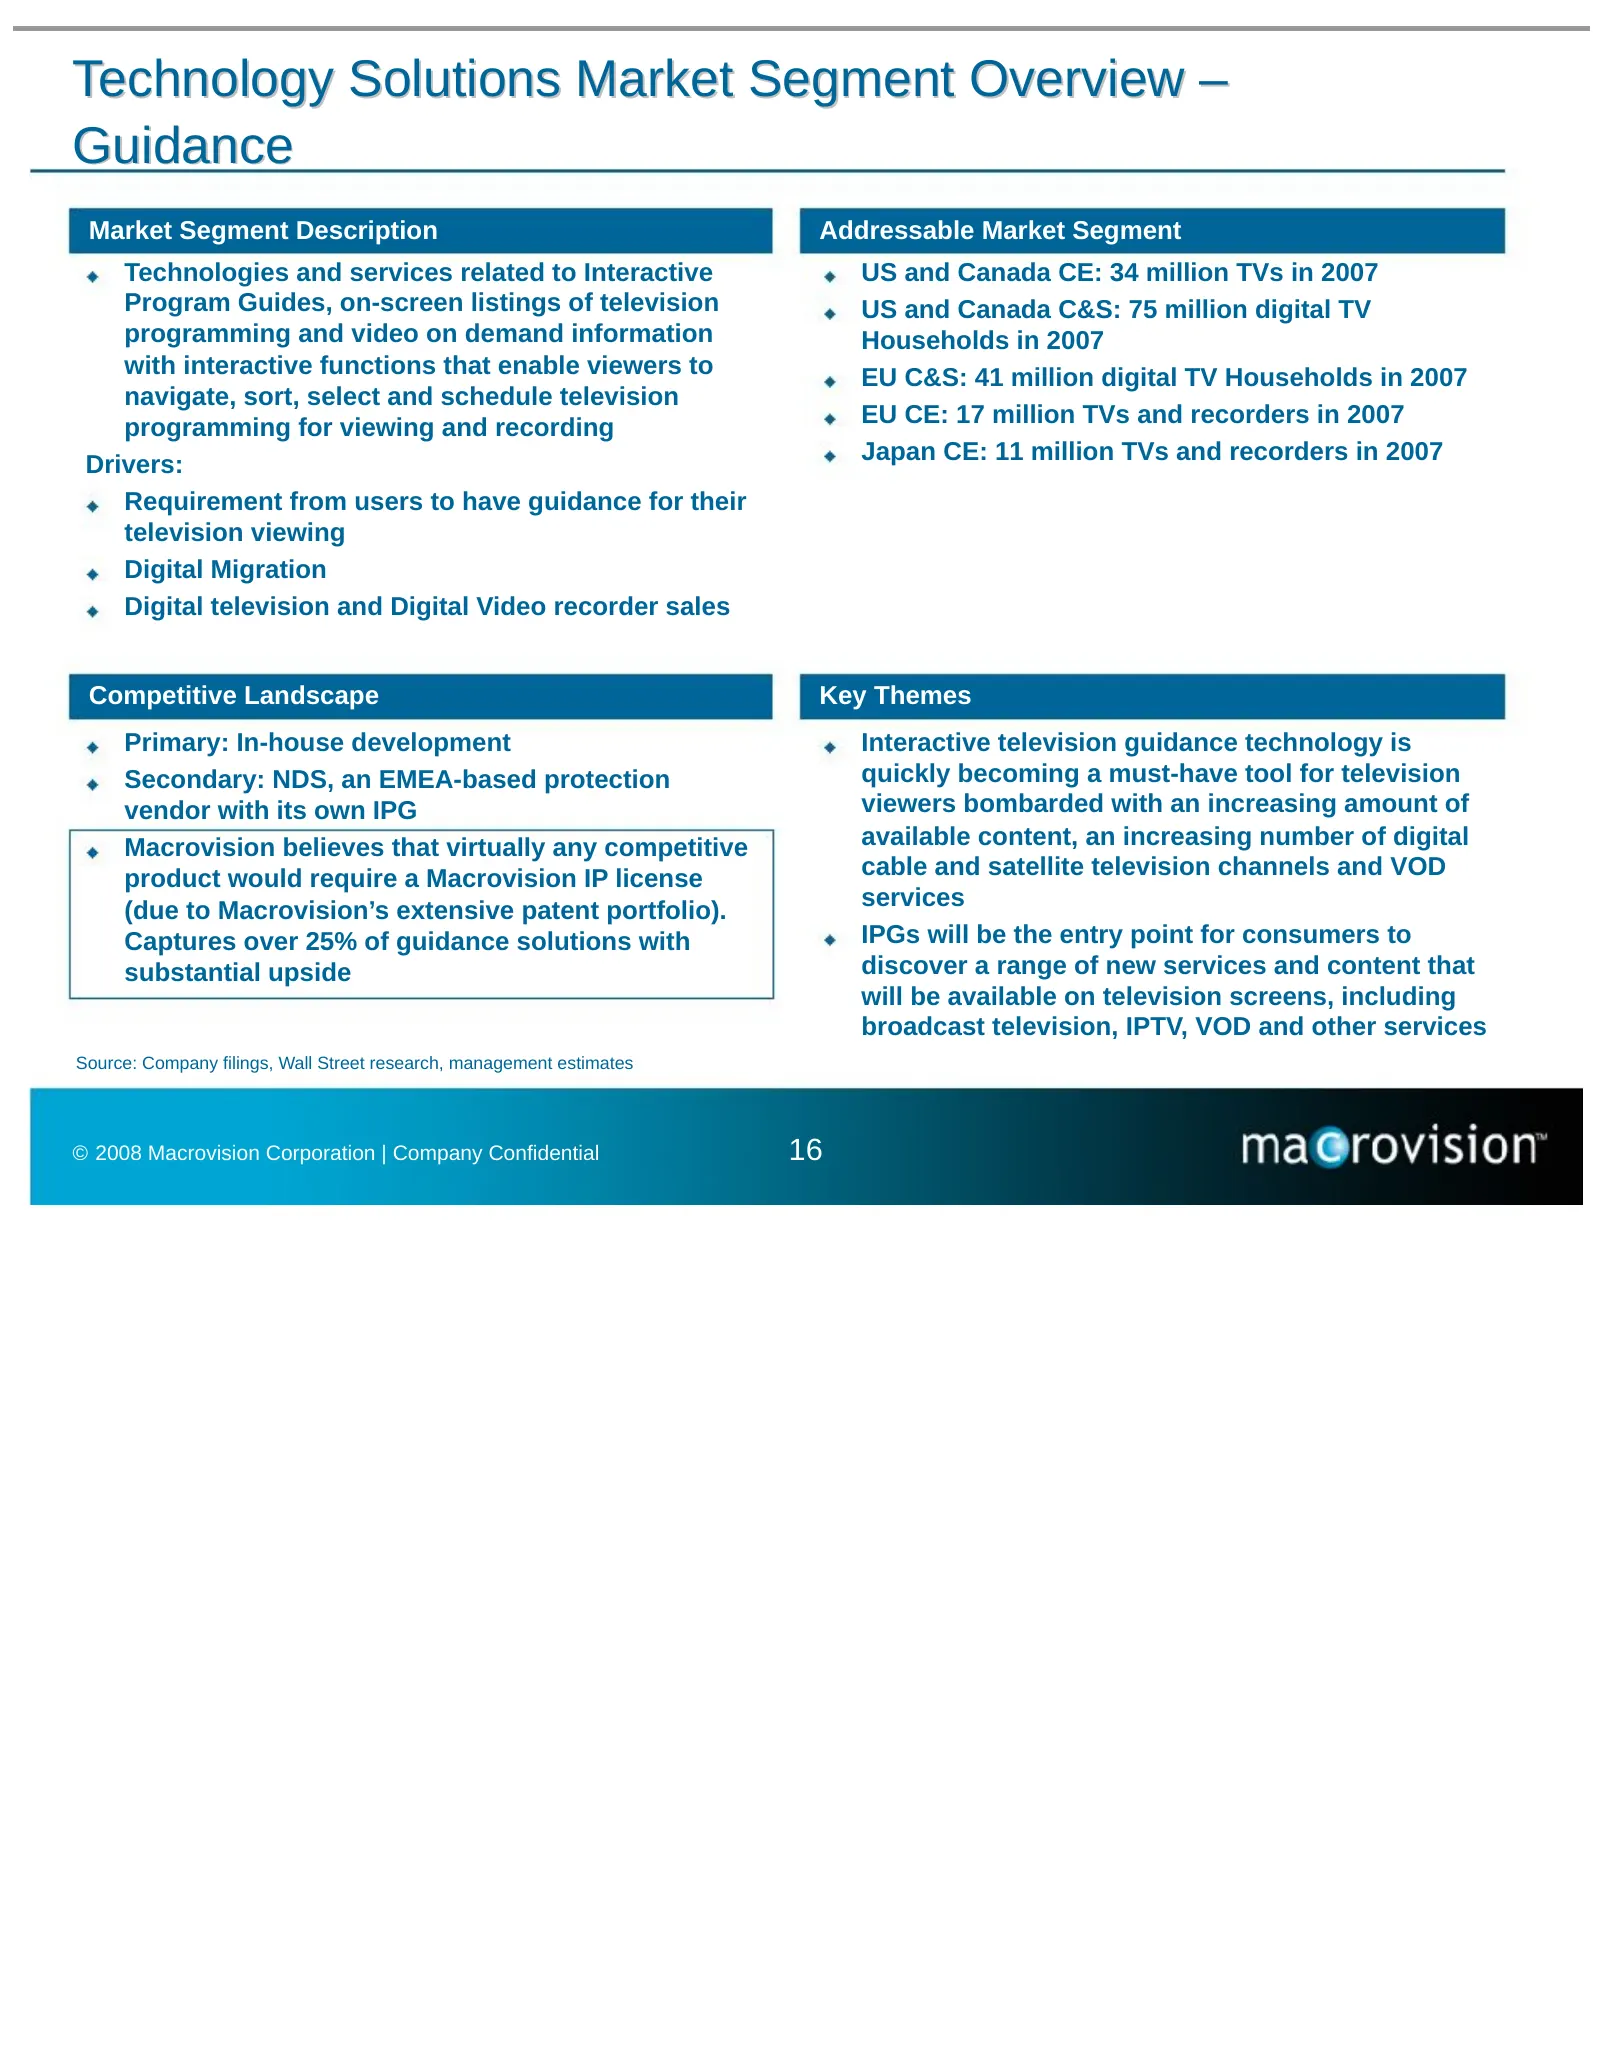
Technology Solutions Market Segment Overview – Guidance Market Segment Description Addressable Market Segment Technologies and services related to Interactive US and Canada CE: 34 million TVs in 2007 Program Guides, on-screen listings of television US and Canada C&S: 75 million digital TV programmin
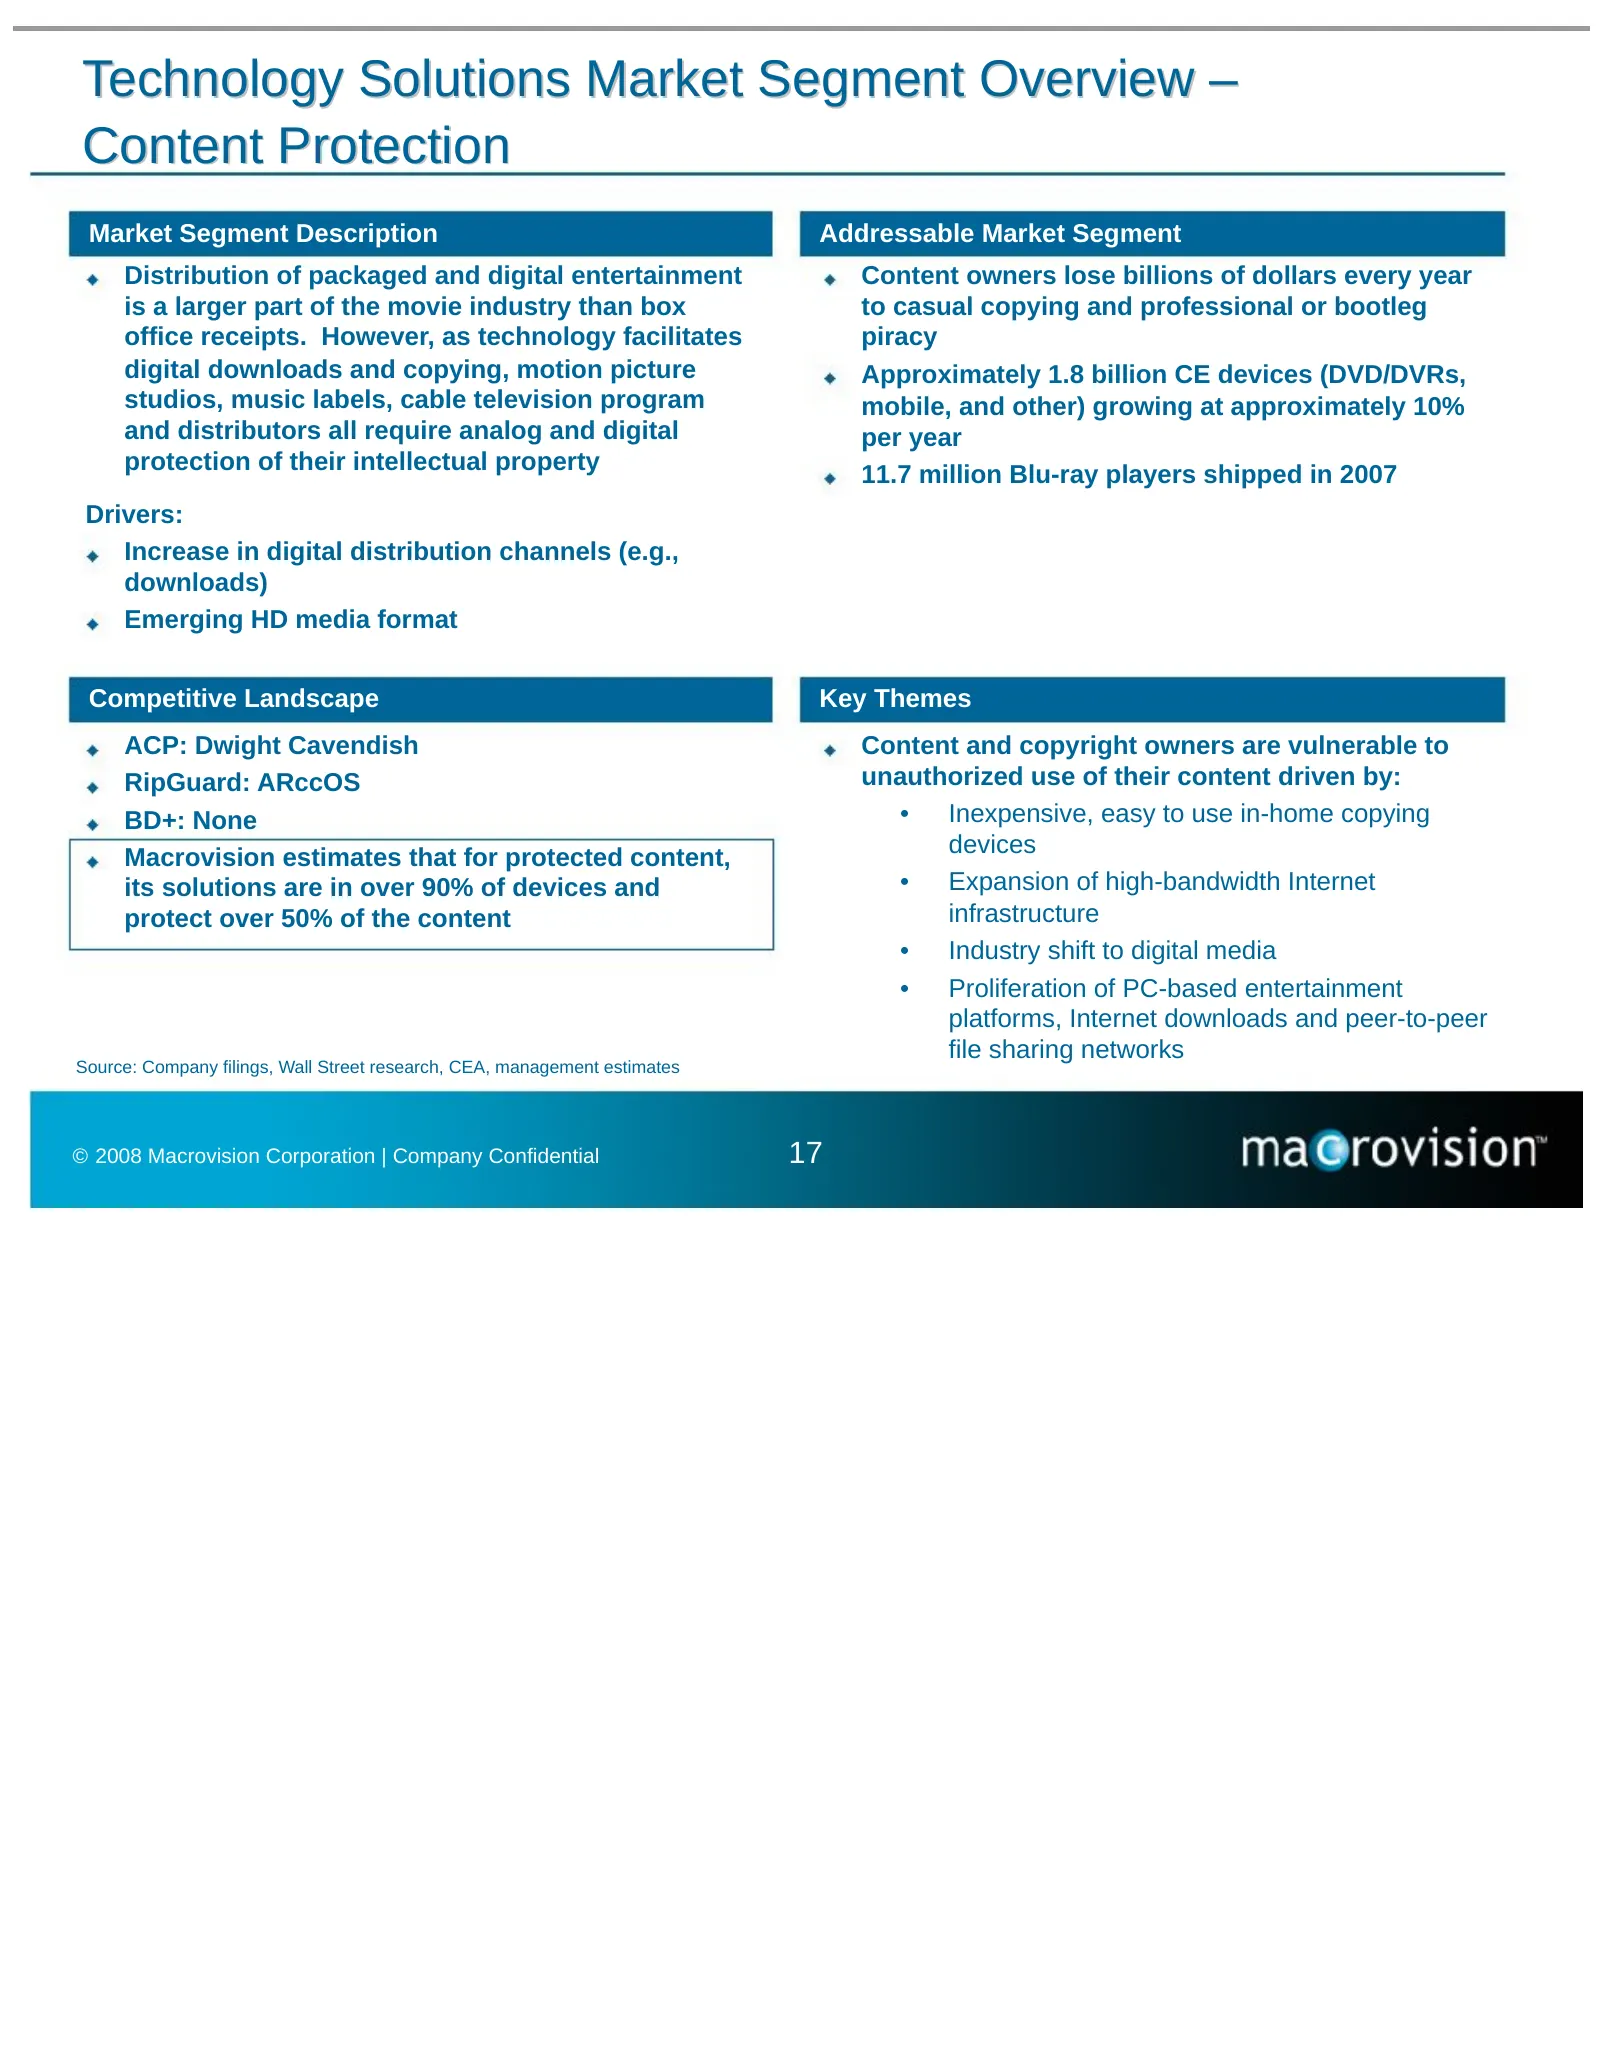
Slide 18: Technology Solutions Market Segment Overview – Content Protection
Technology Solutions Market Segment Overview – Content Protection Market Segment Description Addressable Market Segment Distribution of packaged and digital entertainment Content owners lose billions of dollars every year is a larger part of the movie industry than box to casual copying and professi
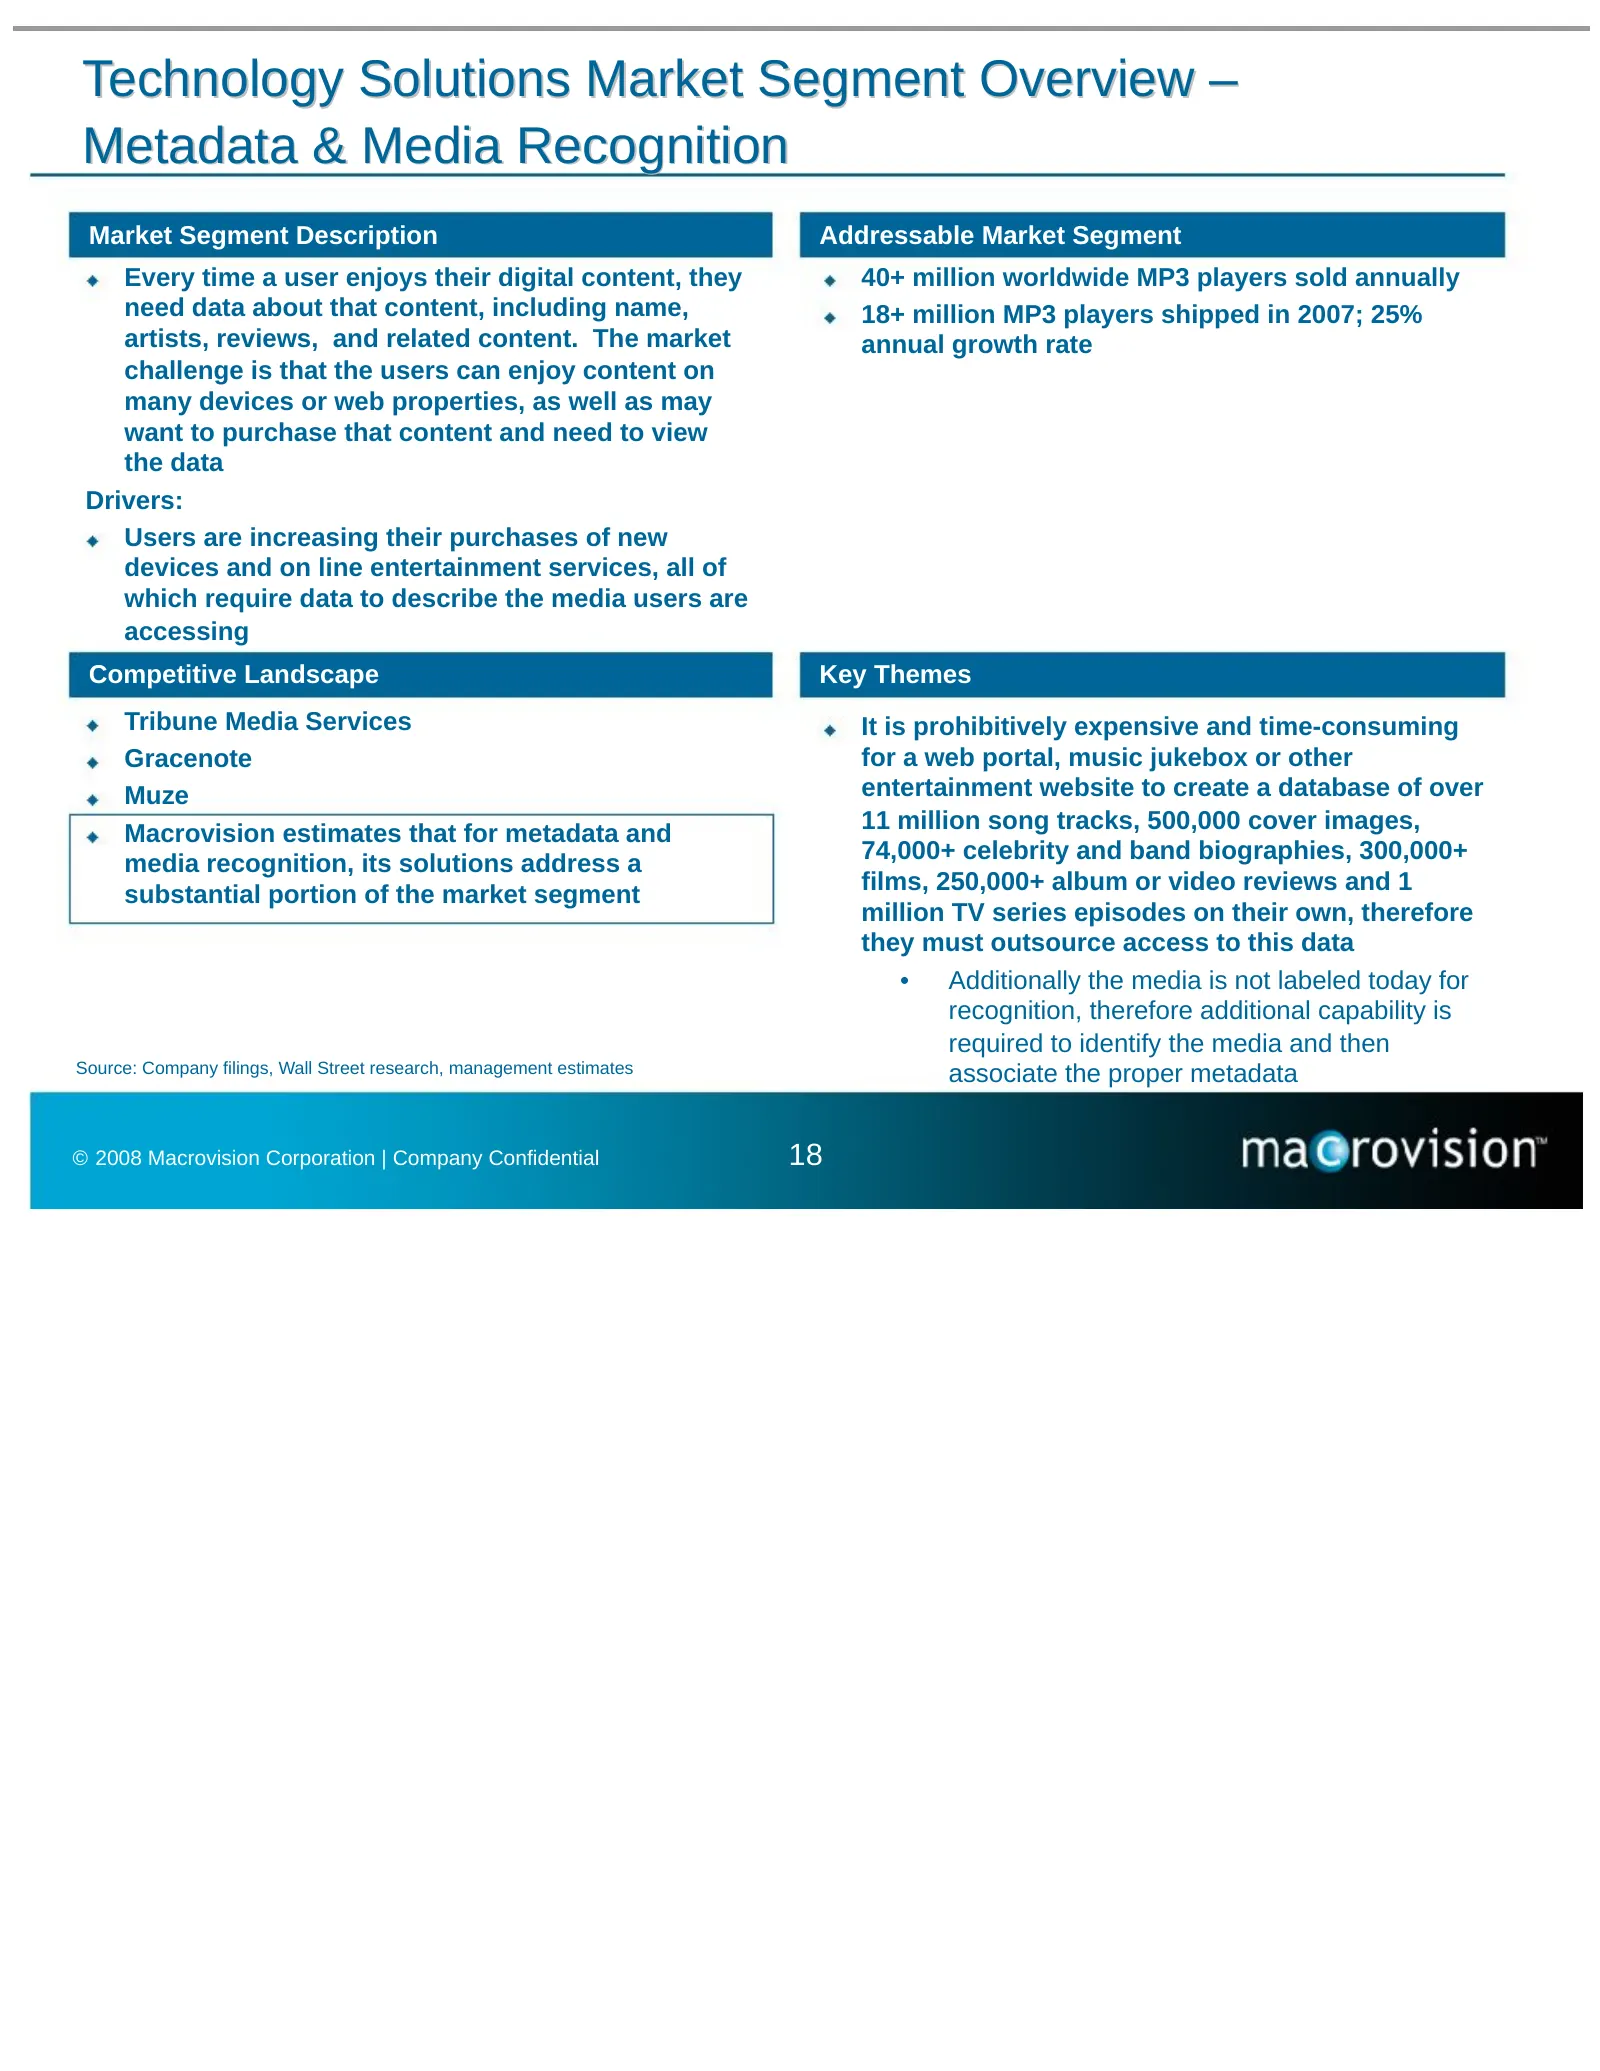
Slide 19: Technology Solutions Market Segment Overview – Metadata & Media Recognition
Technology Solutions Market Segment Overview – Metadata & Media Recognition Market Segment Description Addressable Market Segment Every time a user enjoys their digital content, they 40+ million worldwide MP3 players sold annually need data about that content, including name, 18+ million MP3 players
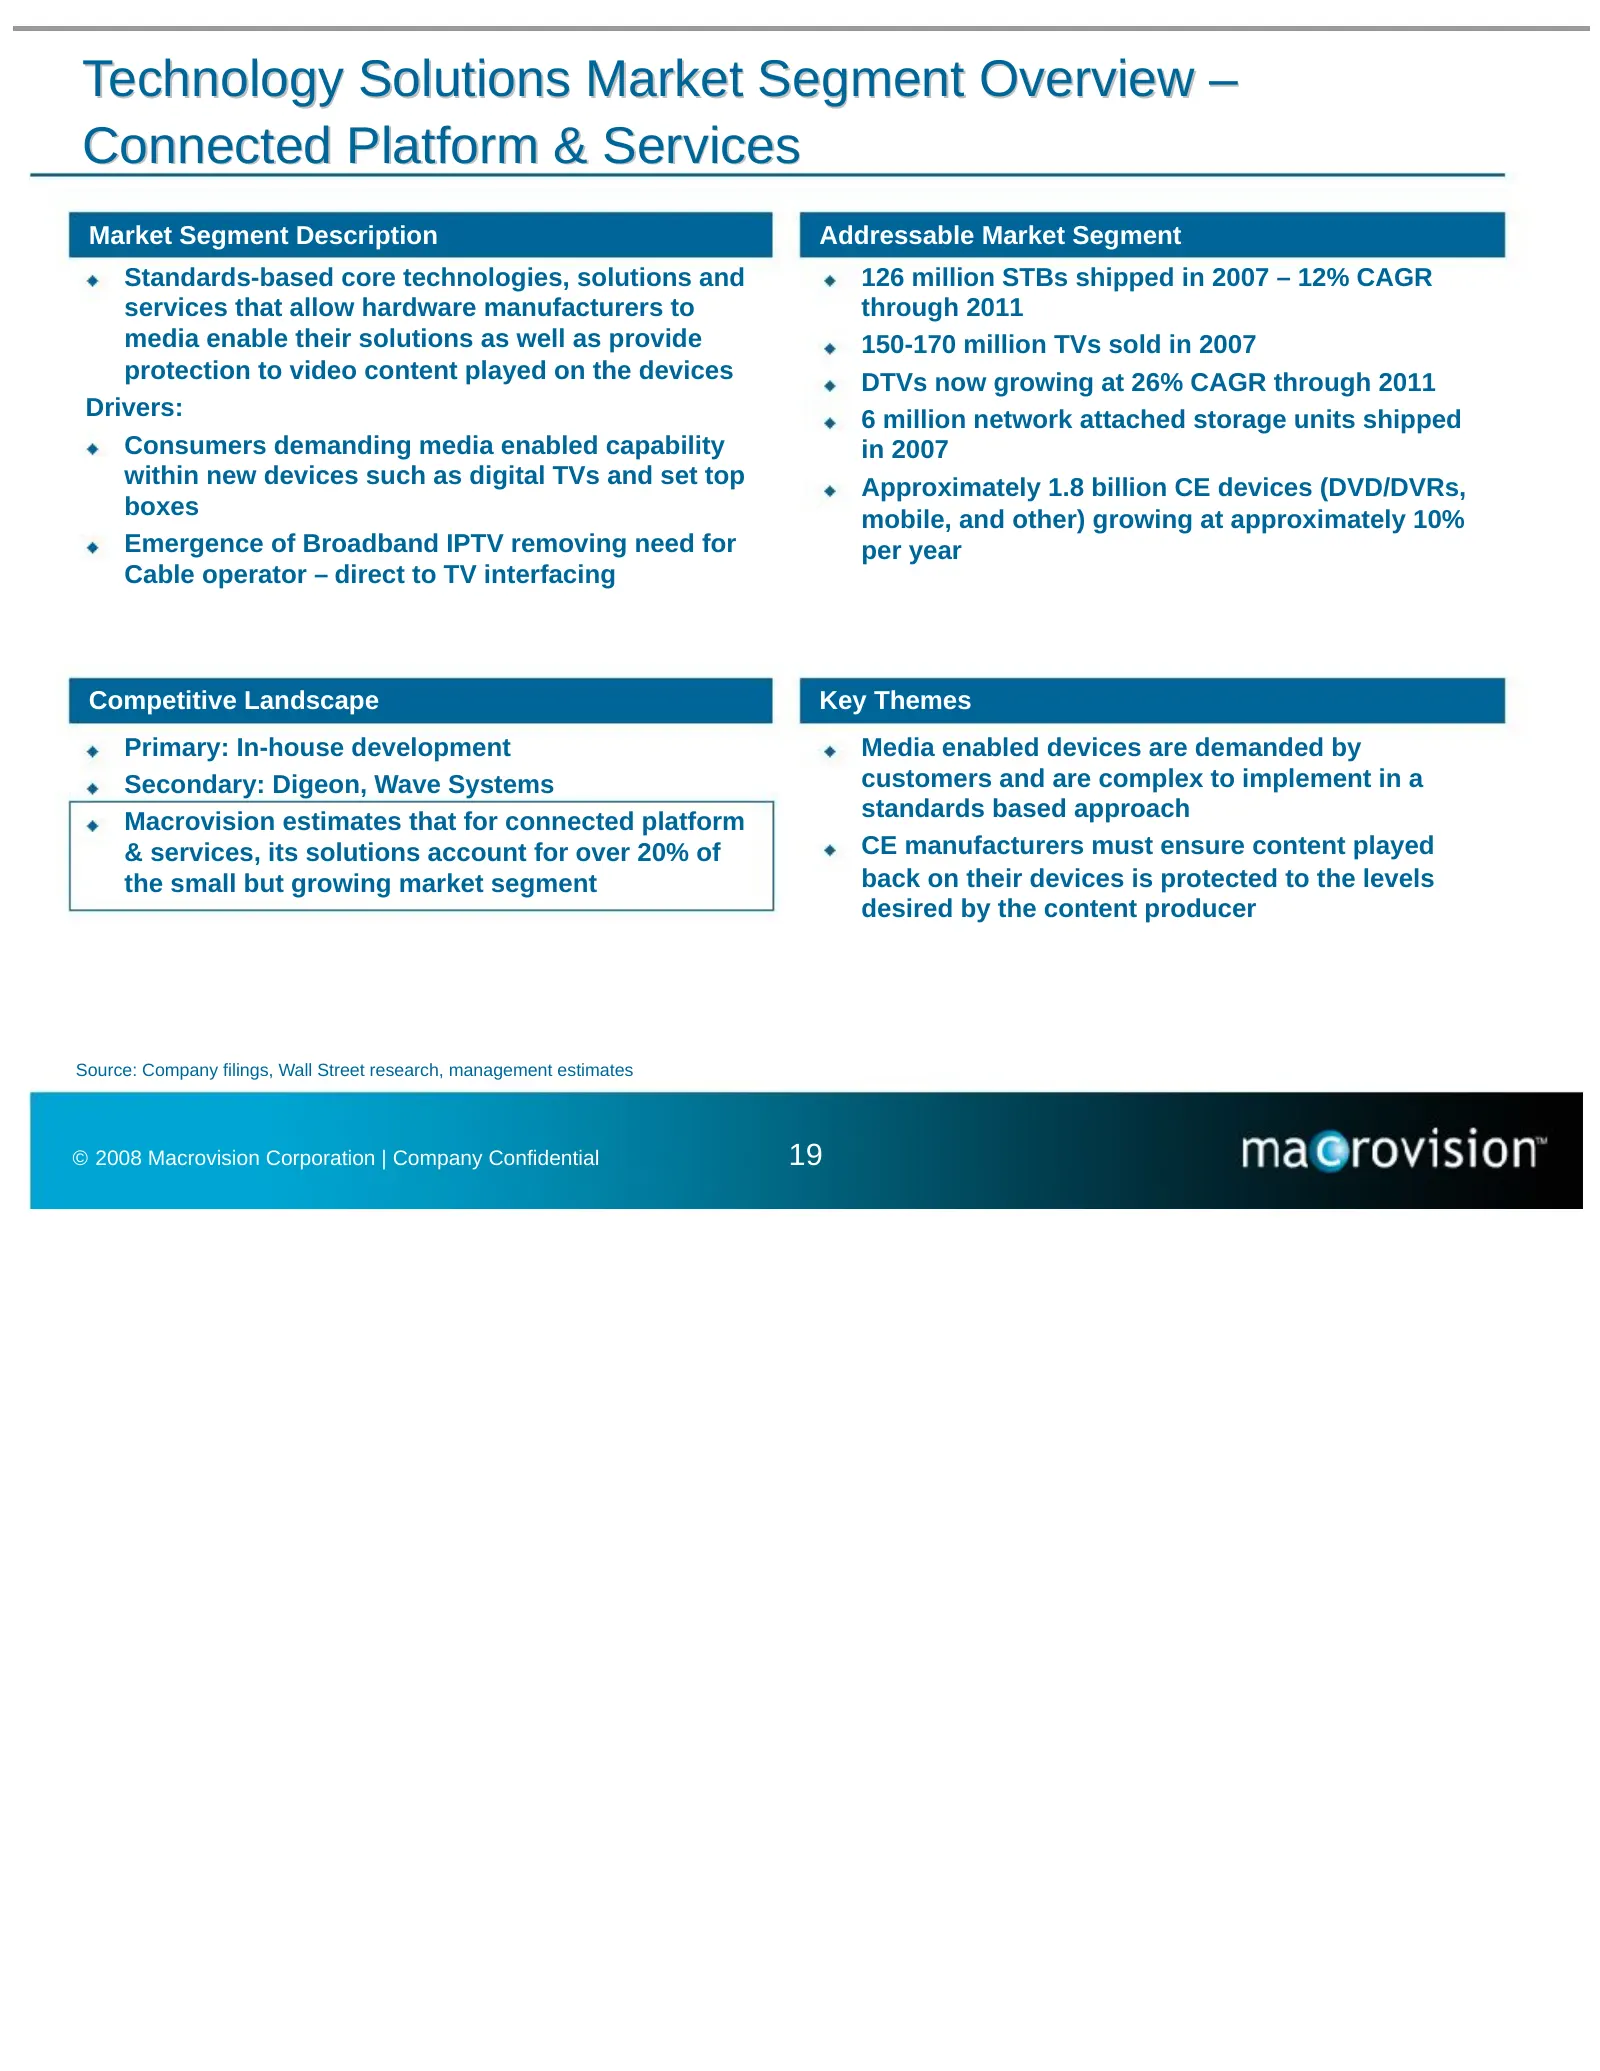
Slide 20: Technology Solutions Market Segment Overview – Connected Platform & Services
Technology Solutions Market Segment Overview – Connected Platform & Services Market Segment Description Addressable Market Segment Standards-based core technologies, solutions and 126 million STBs shipped in 2007 – 12% CAGR services that allow hardware manufacturers to through 2011 media enable thei
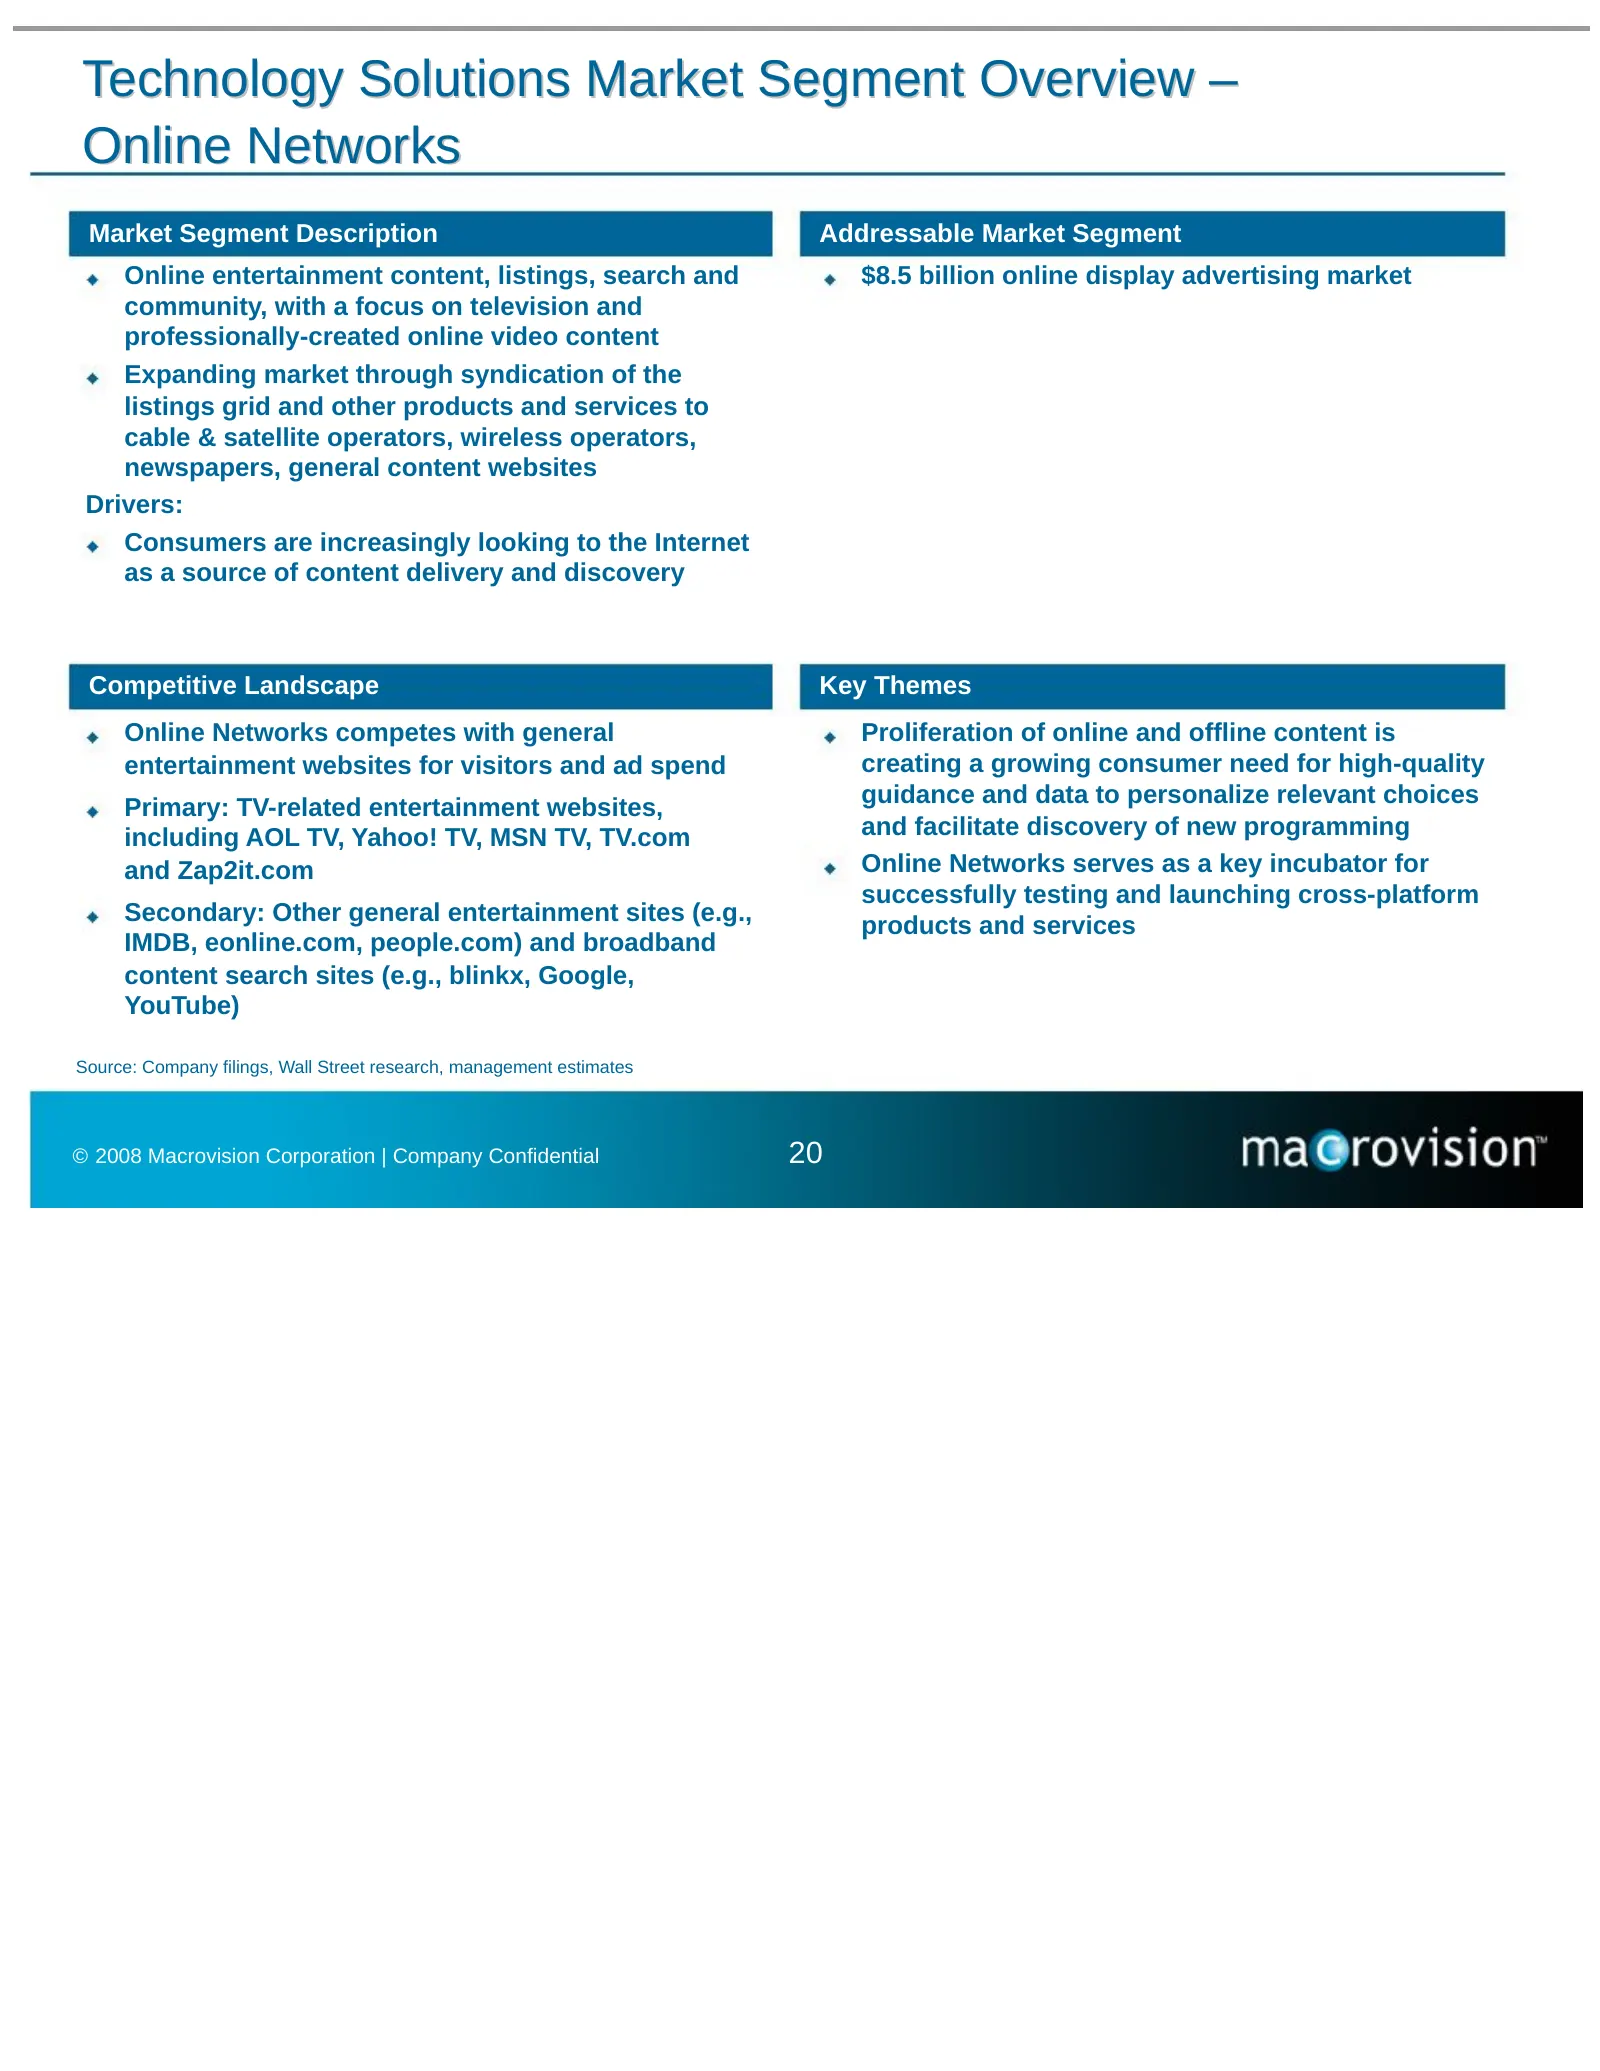
Slide 21: Technology Solutions Market Segment Overview – Online Networks
Technology Solutions Market Segment Overview – Online Networks Market Segment Description Addressable Market Segment Online entertainment content, listings, search and $8.5 billion online display advertising market community, with a focus on television and professionally-created online video content
Slide 22: Company Overview
Company Overview Fred Amoroso, CEO, Macrovision © 2008 Macrovision Corporation | Company Confidential 21
Slide 23: Company Highlights
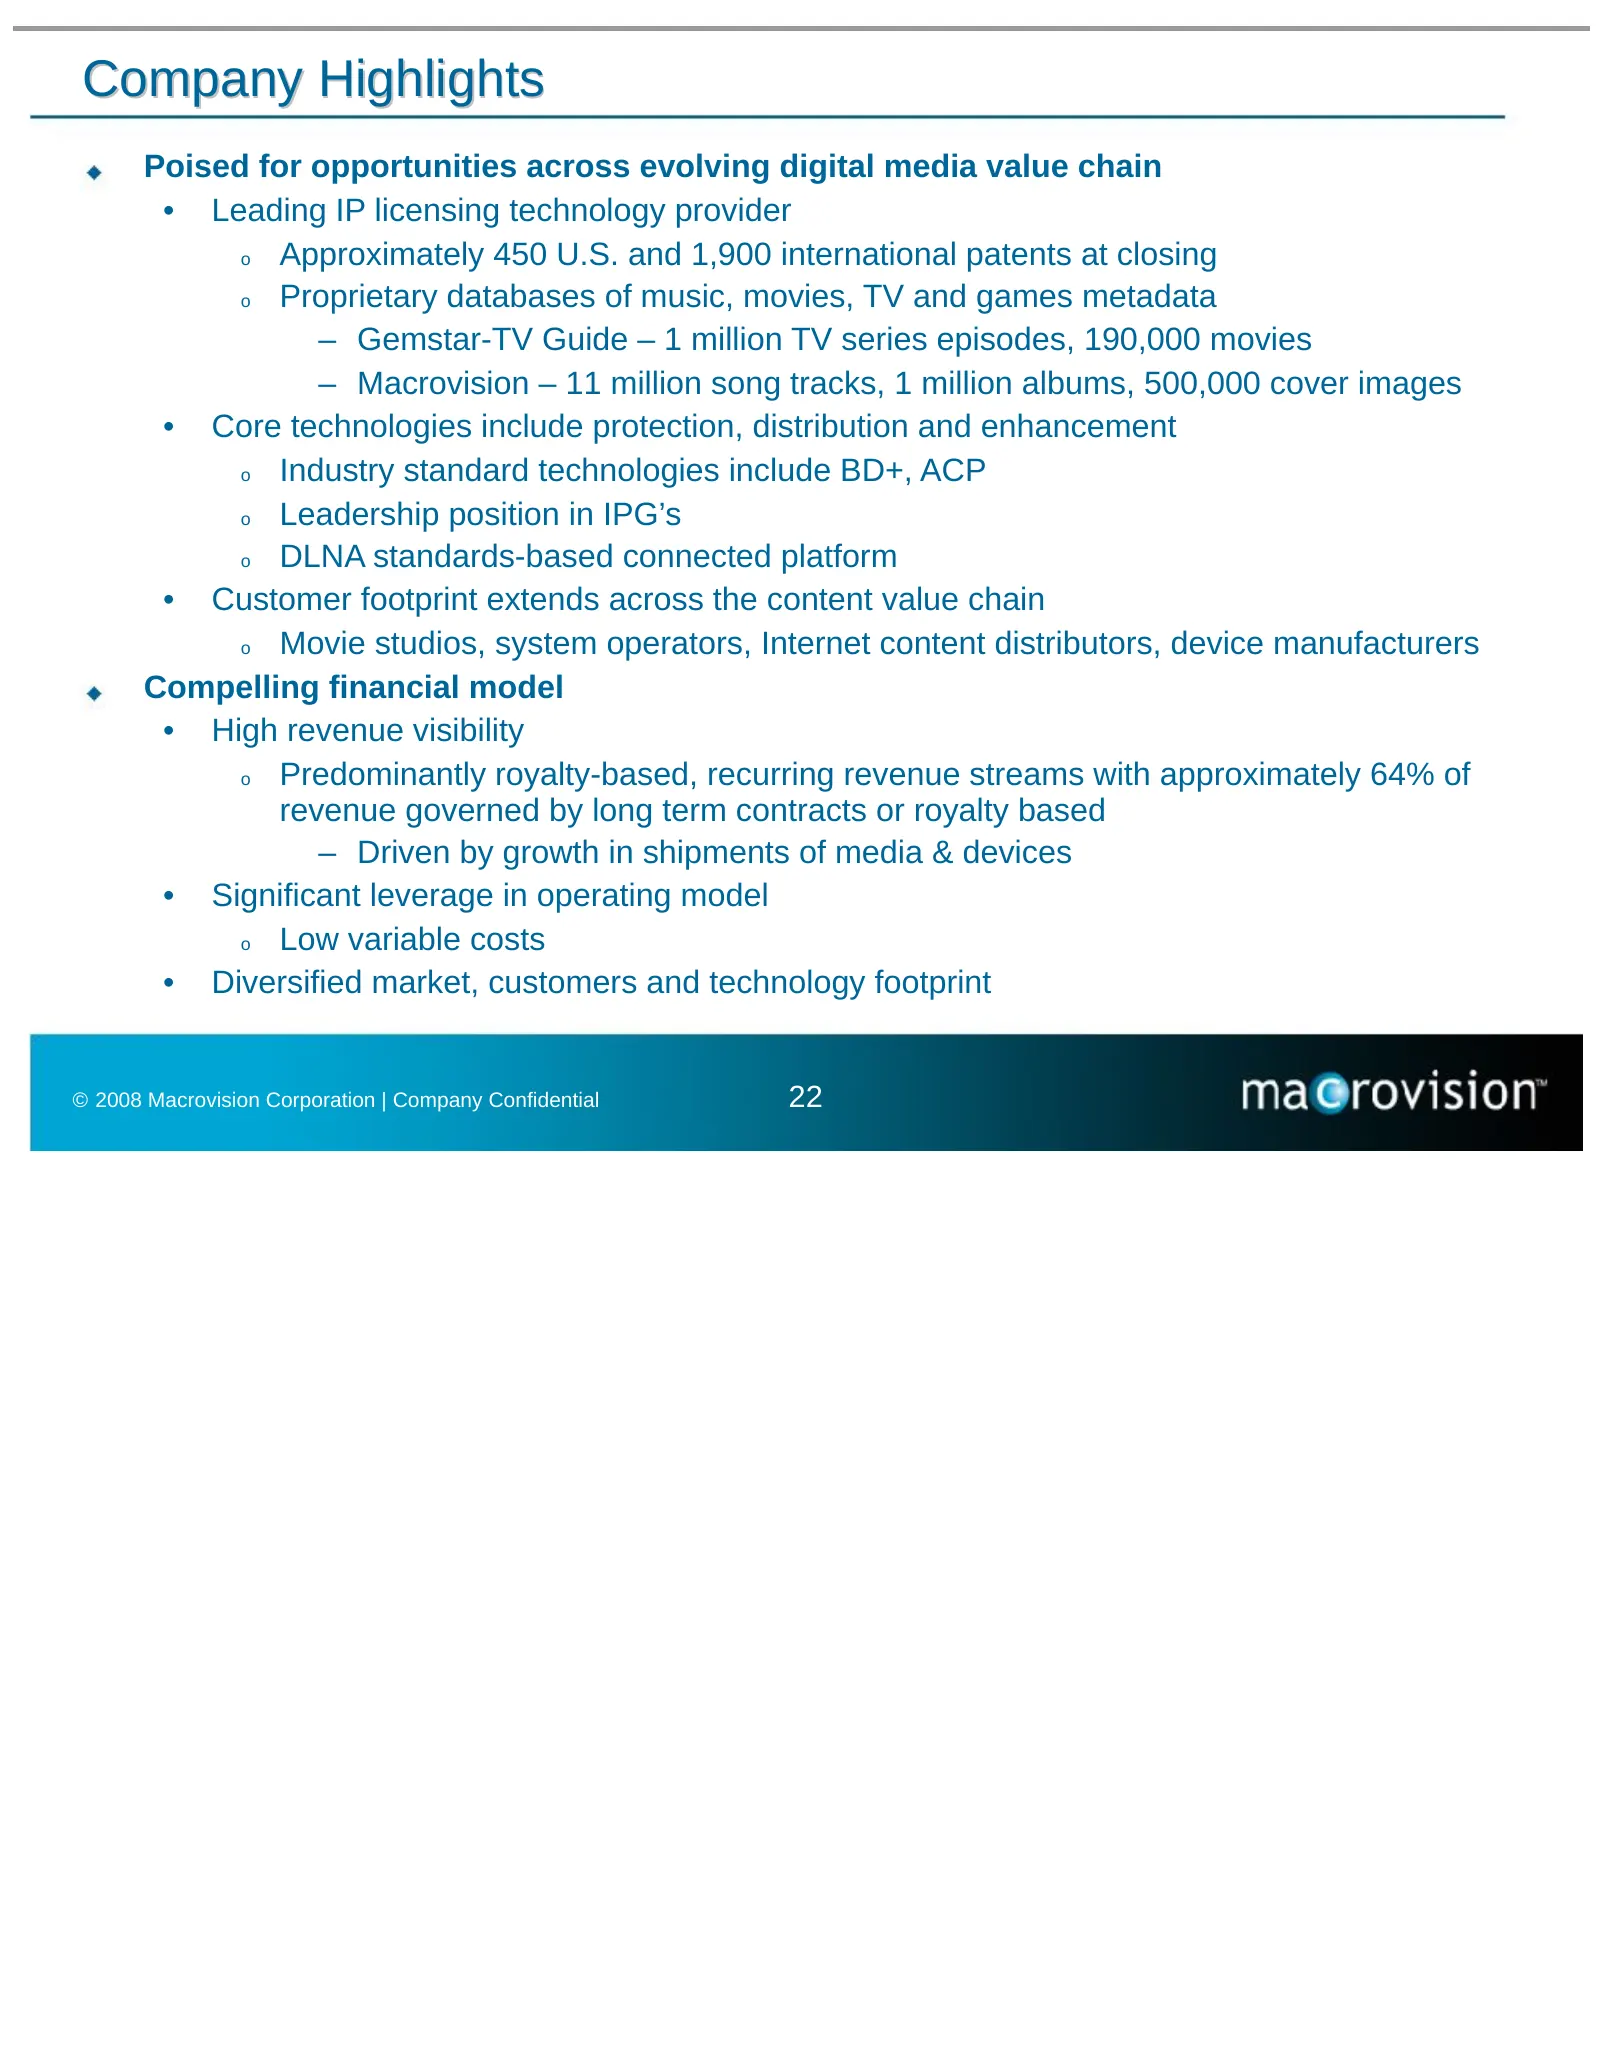
Company Highlights Poised for opportunities across evolving digital media value chain • Leading IP licensing technology provider o Approximately 450 U.S. and 1,900 international patents at closing o Proprietary databases of music, movies, TV and games metadata – Gemstar-TV Guide – 1 million TV serie
Slide 24: Company Focus
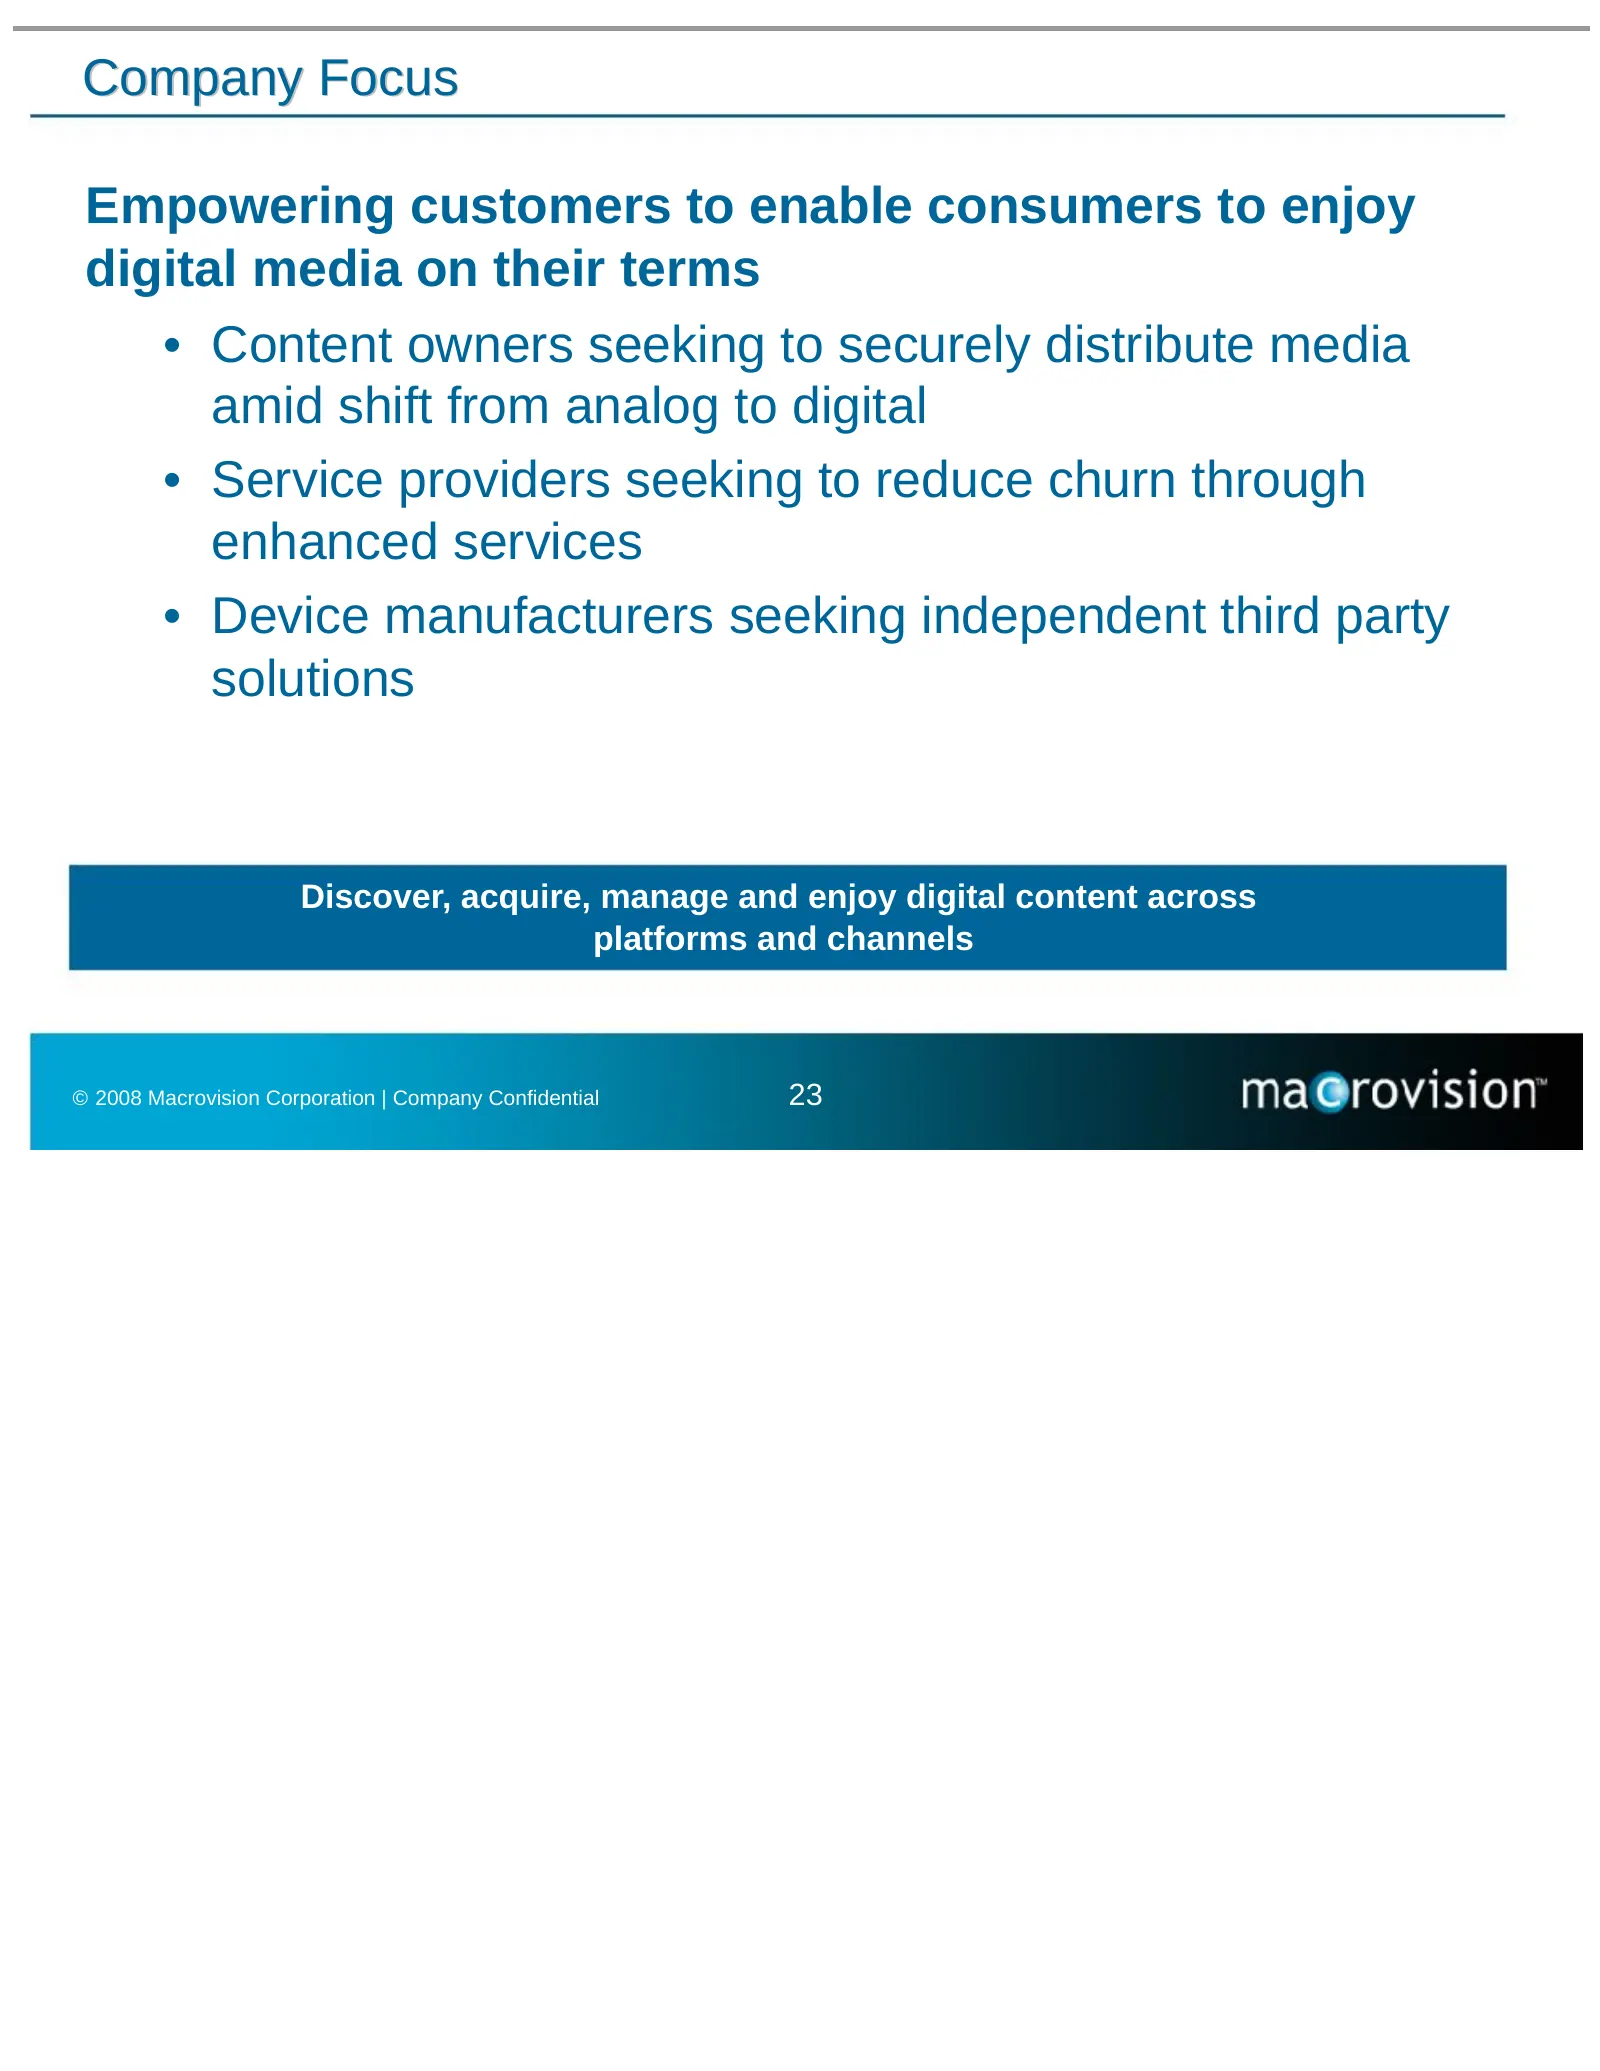
Company Focus Empowering customers to enable consumers to enjoy digital media on their terms • Content owners seeking to securely distribute media amid shift from analog to digital • Service providers seeking to reduce churn through enhanced services • Device manufacturers seeking independent third
Slide 25: A Combination of Macrovision and Gemstar Will Produce a Scaled Digital Media IP Licensing Company
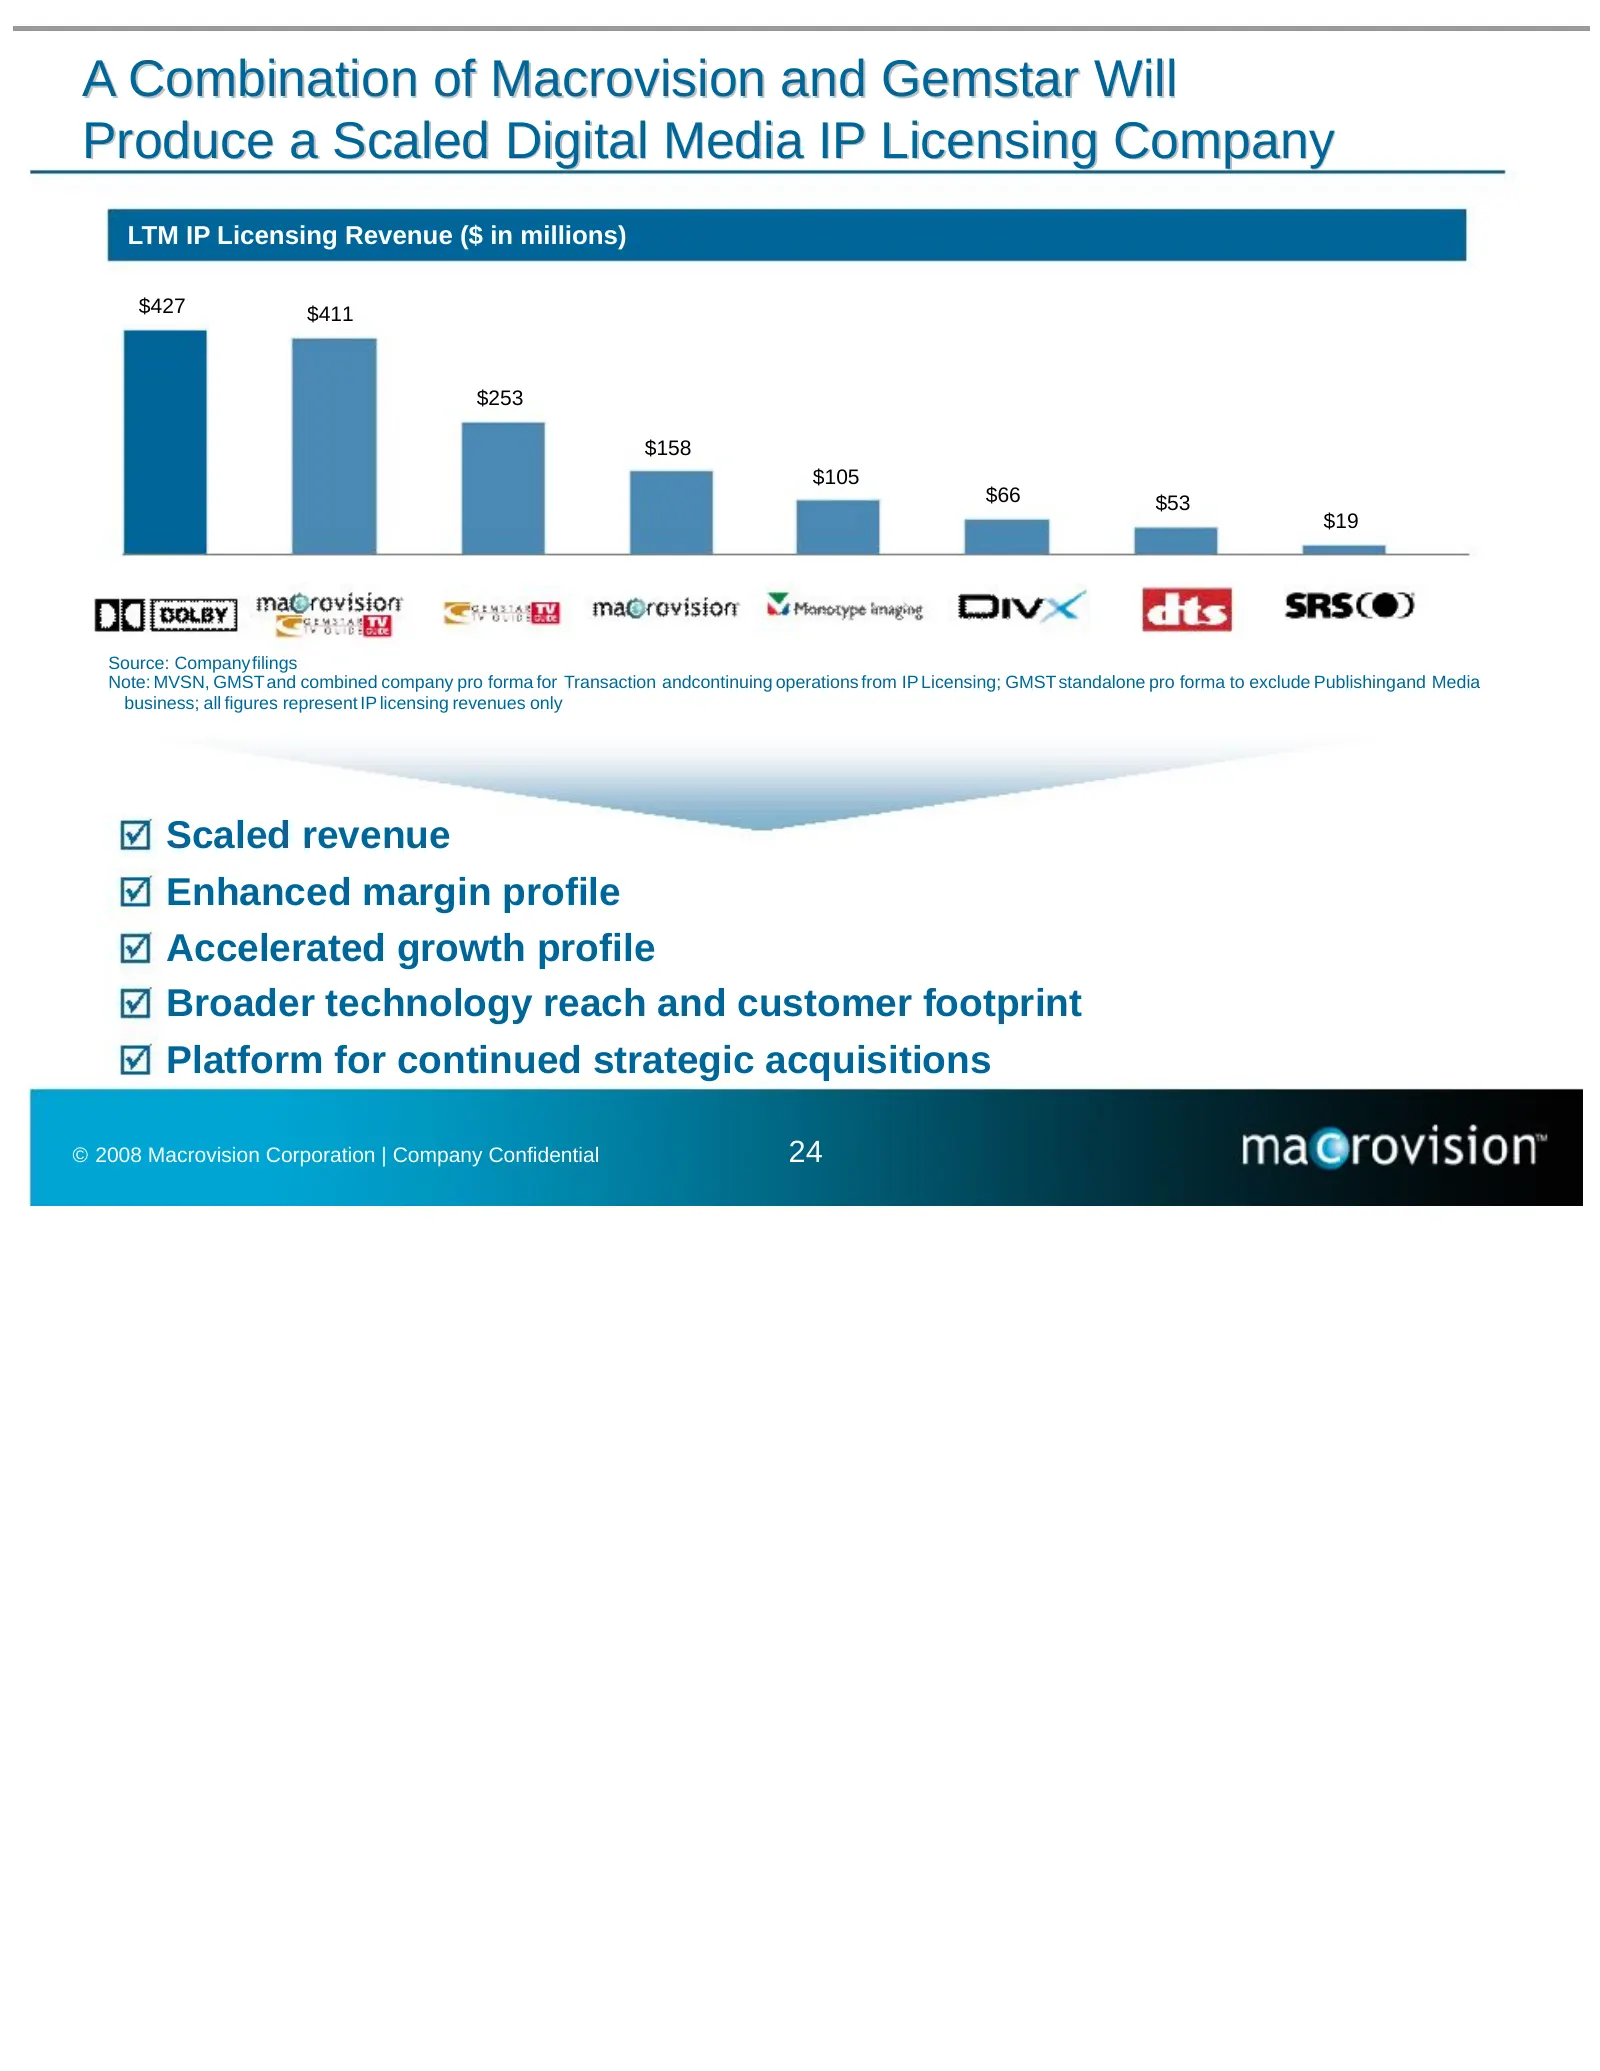
A Combination of Macrovision and Gemstar Will Produce a Scaled Digital Media IP Licensing Company LTM IP Licensing Revenue ($ in millions) $427 $411 $253 $158 $105 $66 $53 $19 Source: Companyfilings Note: MVSN, GMST and combined company pro forma for Transaction-andcontinuing operations from IP Lice
Slide 26: Macrovision’s Solutions
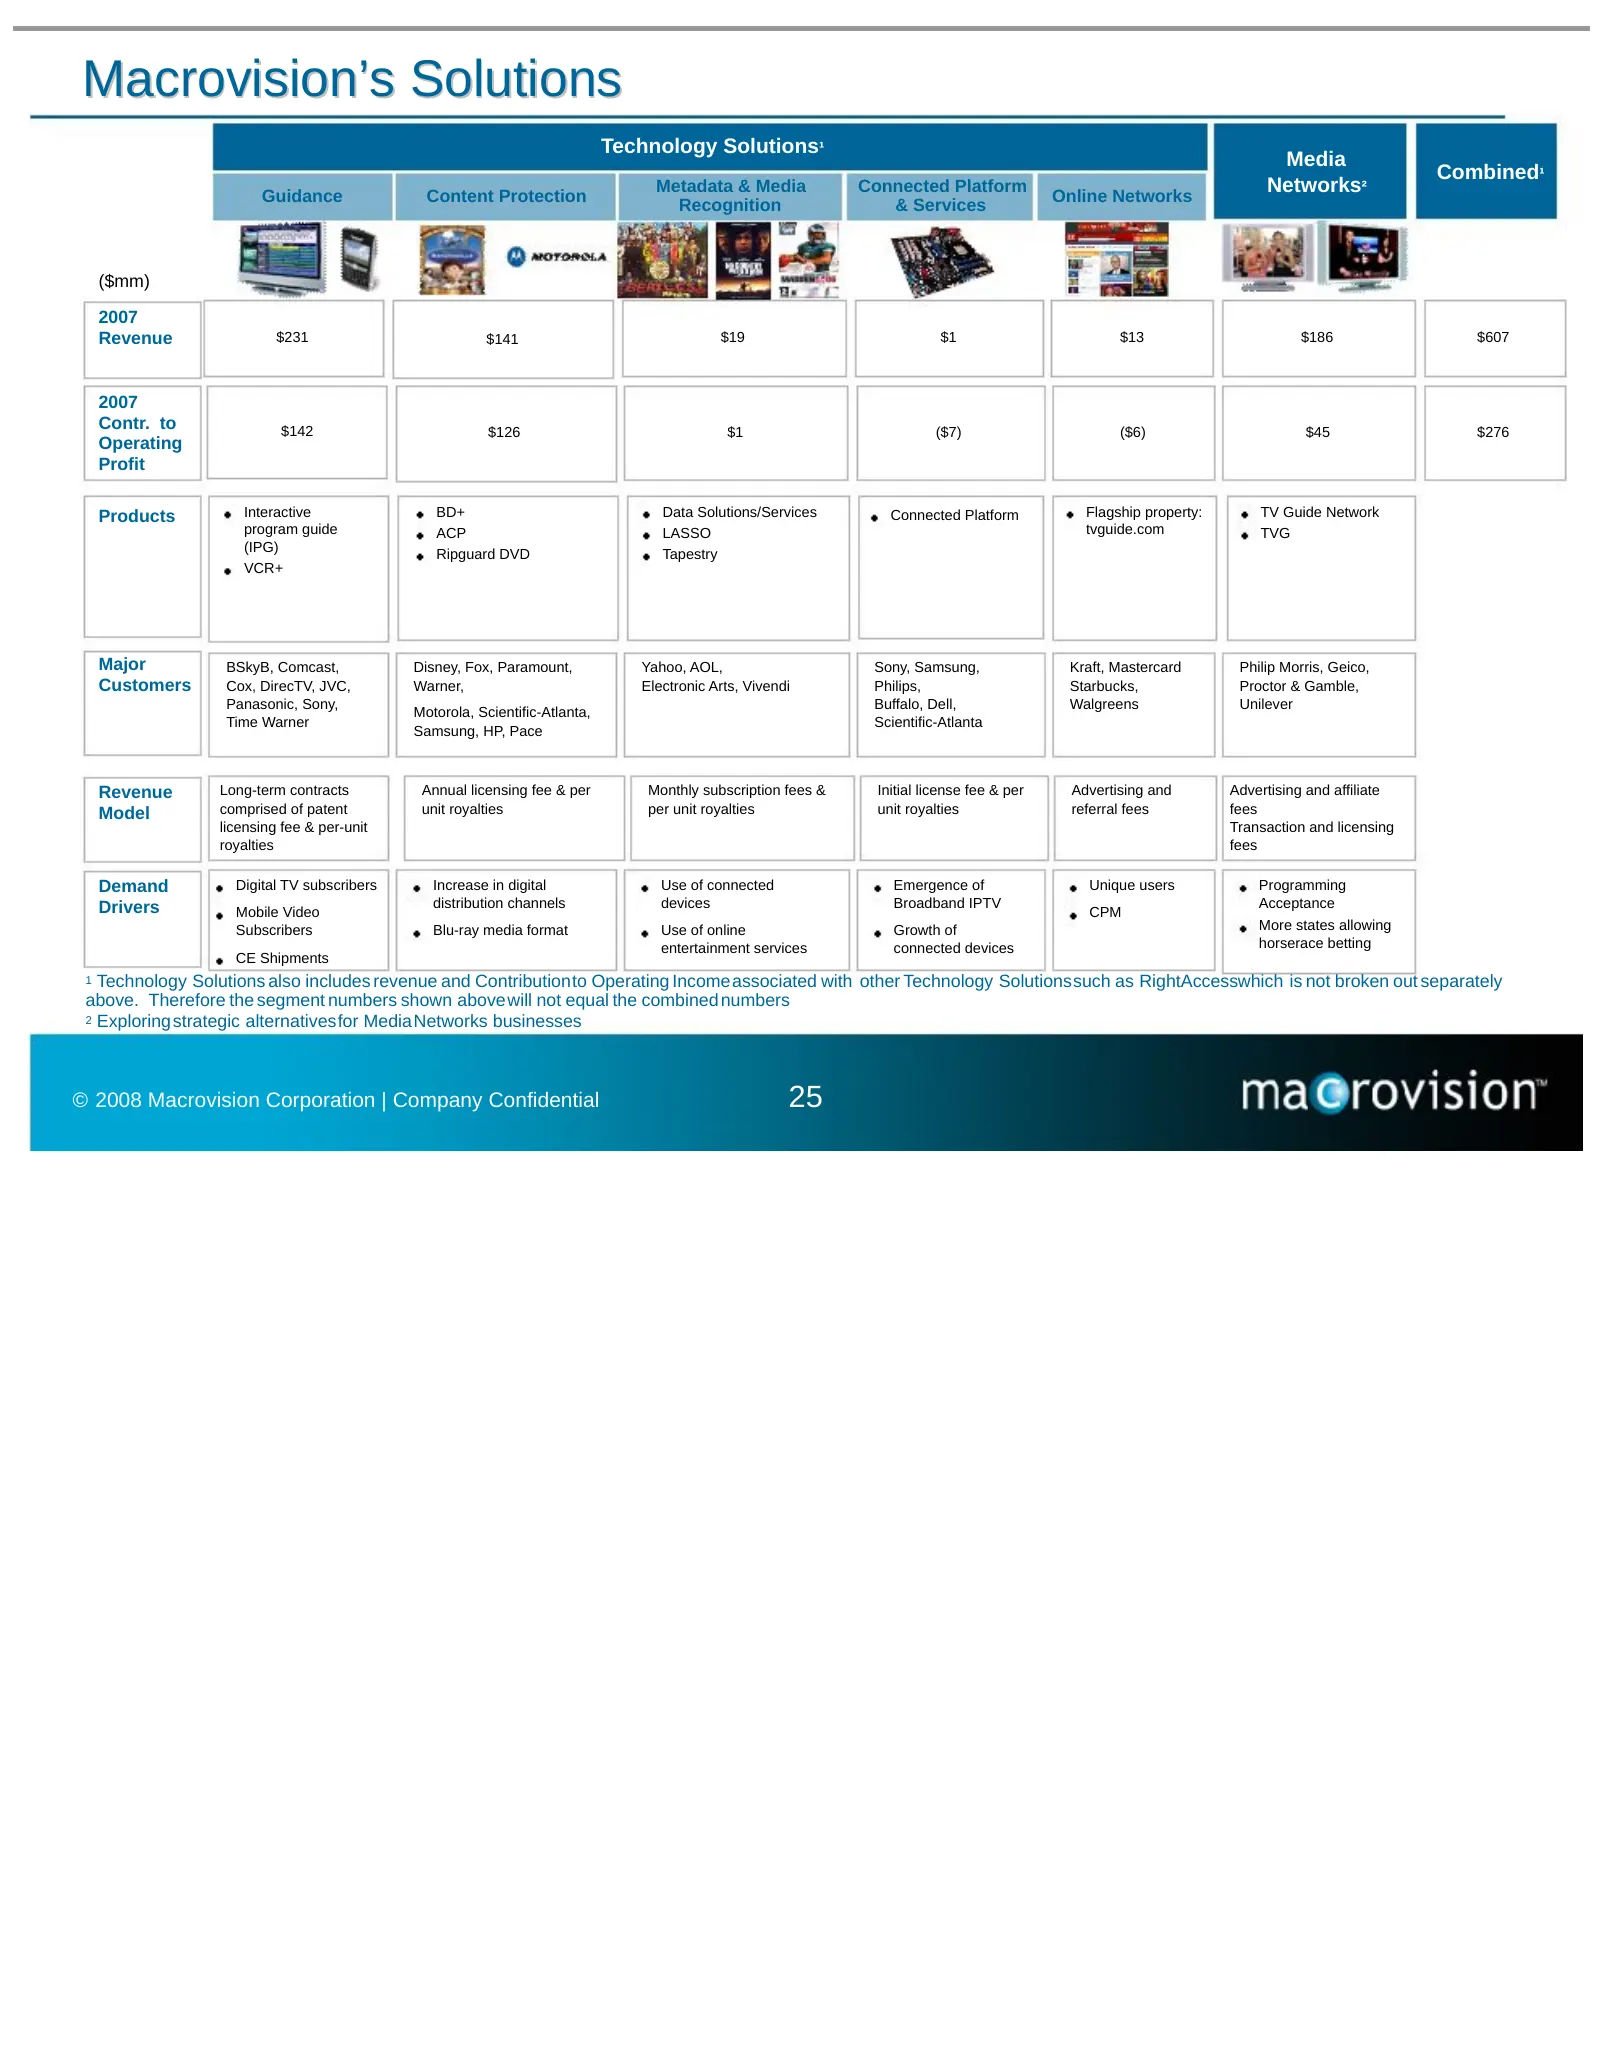
Macrovision’s Solutions Technology Solutions¹ Media Combined¹ Guidance Content Protection Metadata & Media Connected Platform Online Networks Networks² Recognition & Services ($mm) 2007 Revenue $231 $141 $19 $1 $13 $186 $607 2007 Contr. to $142 $126 $1 ($7) ($6) $45 $276 Operating Profit Products In
Slide 27: Technology Solutions Business Overview
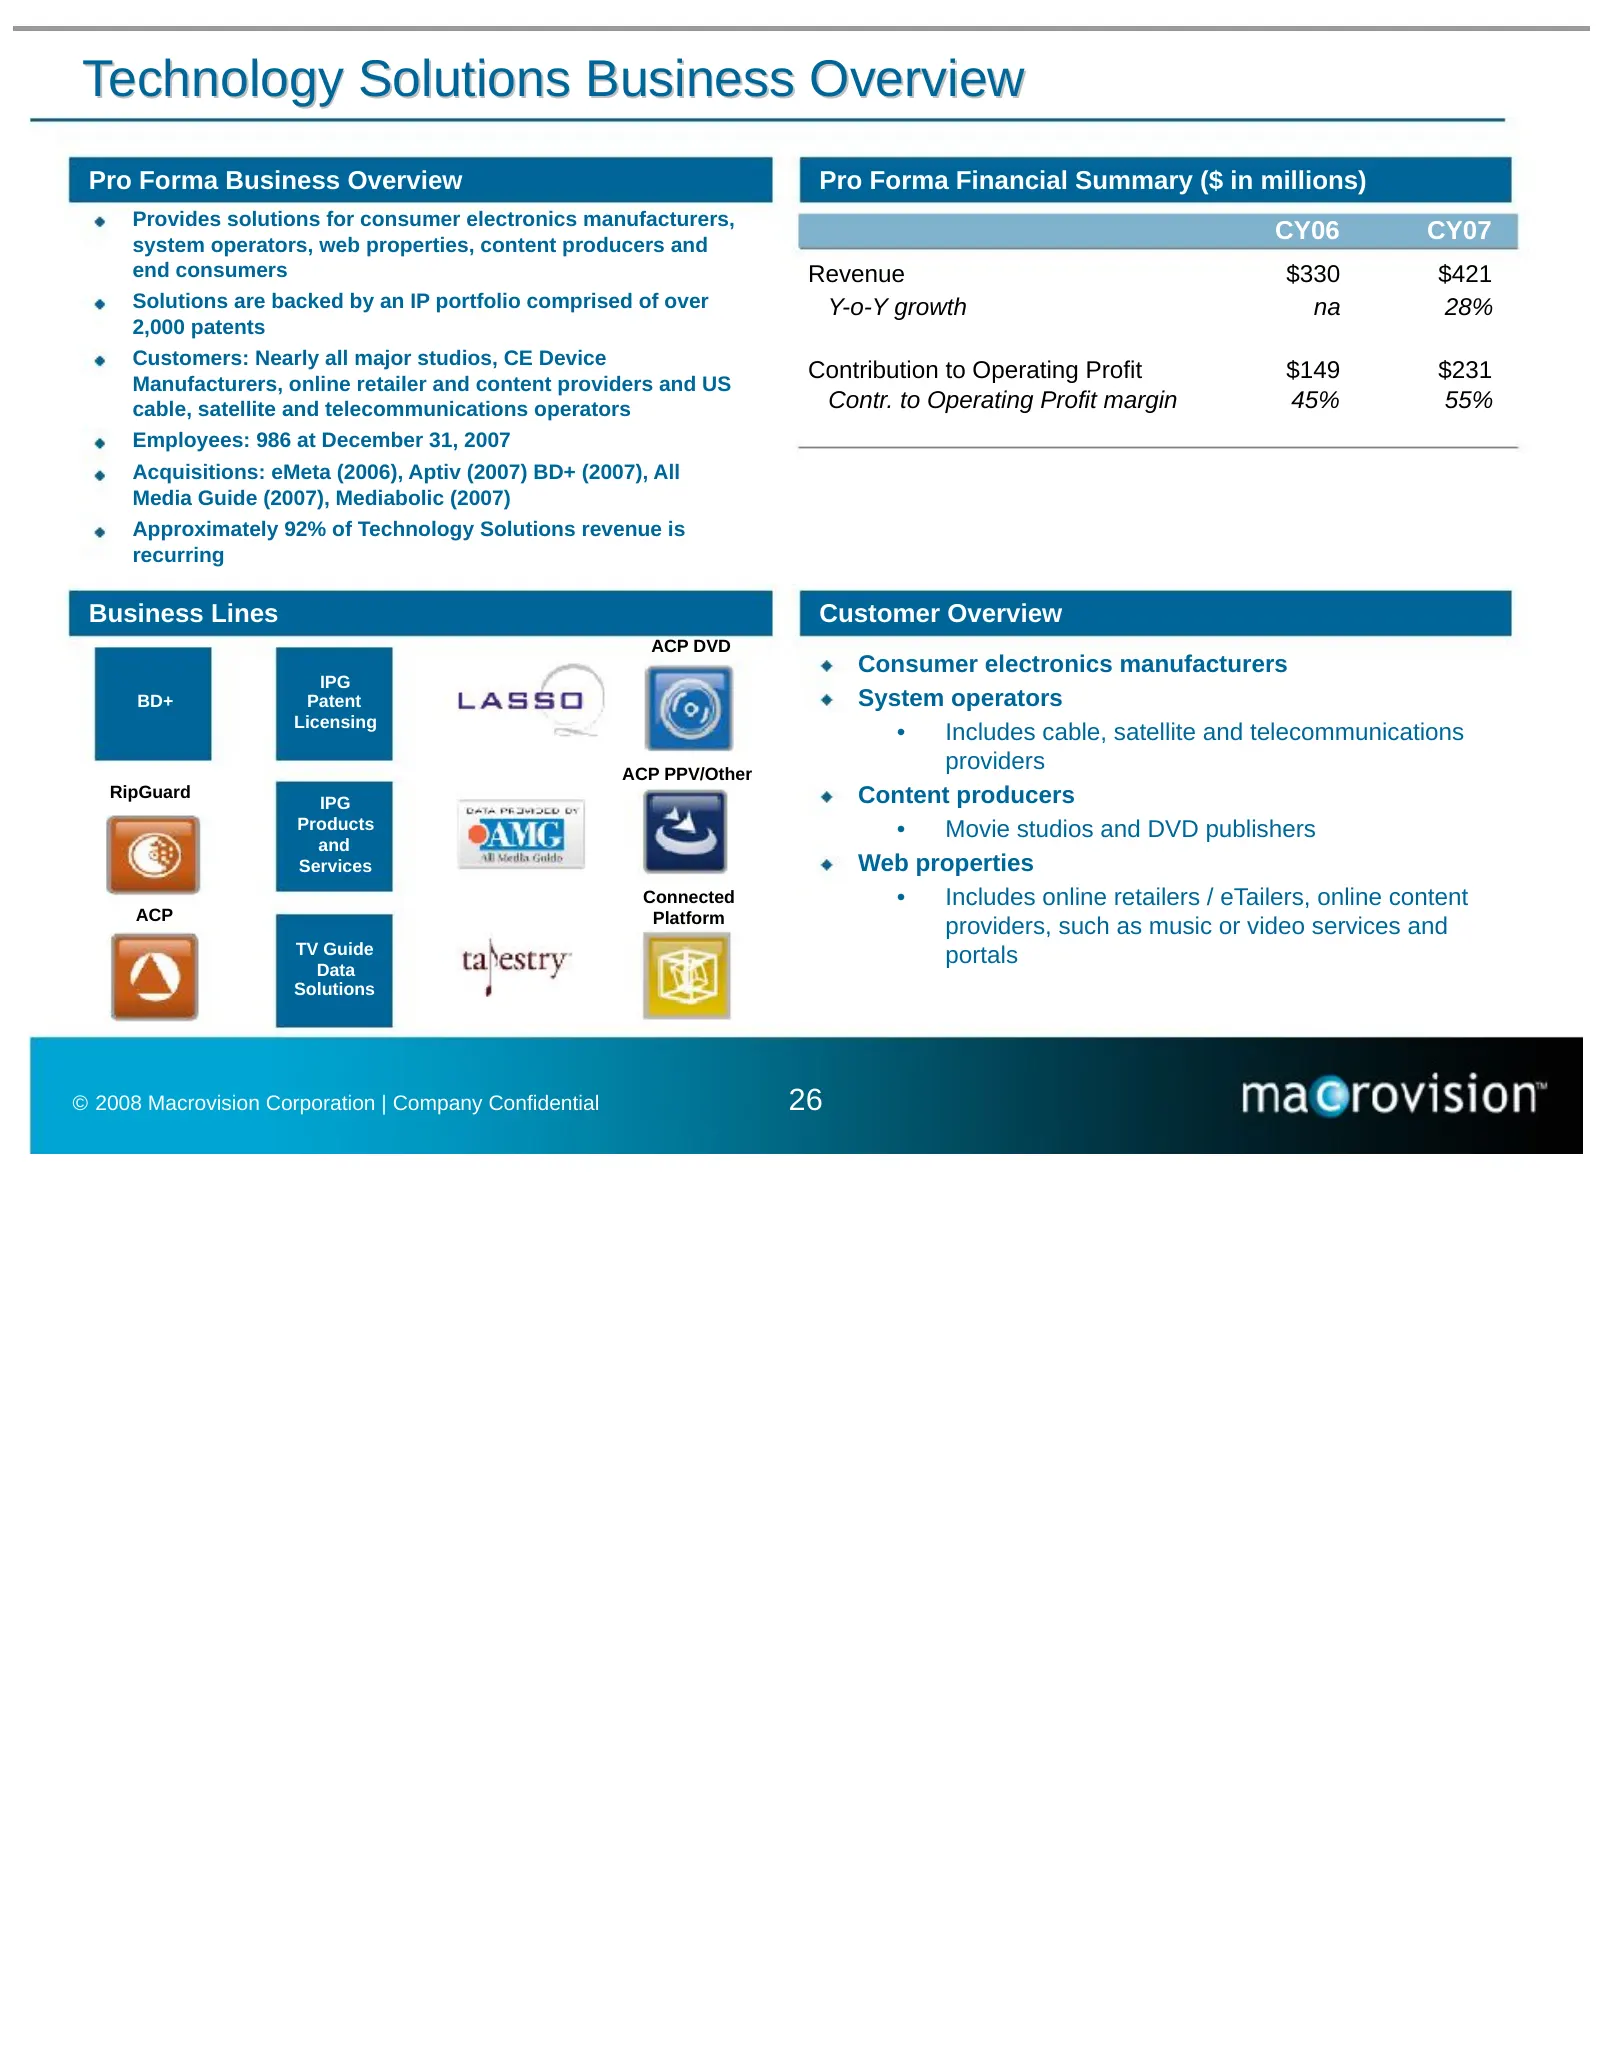
Technology Solutions Business Overview Pro Forma Business Overview Pro Forma Financial Summary ($ in millions) Provides solutions for consumer electronics manufacturers, CY06 CY07 system operators, web properties, content producers and end consumers Revenue $330 $421 Solutions are backed by an IP po
Slide 28: Technology Solutions Business Overview – Guidance
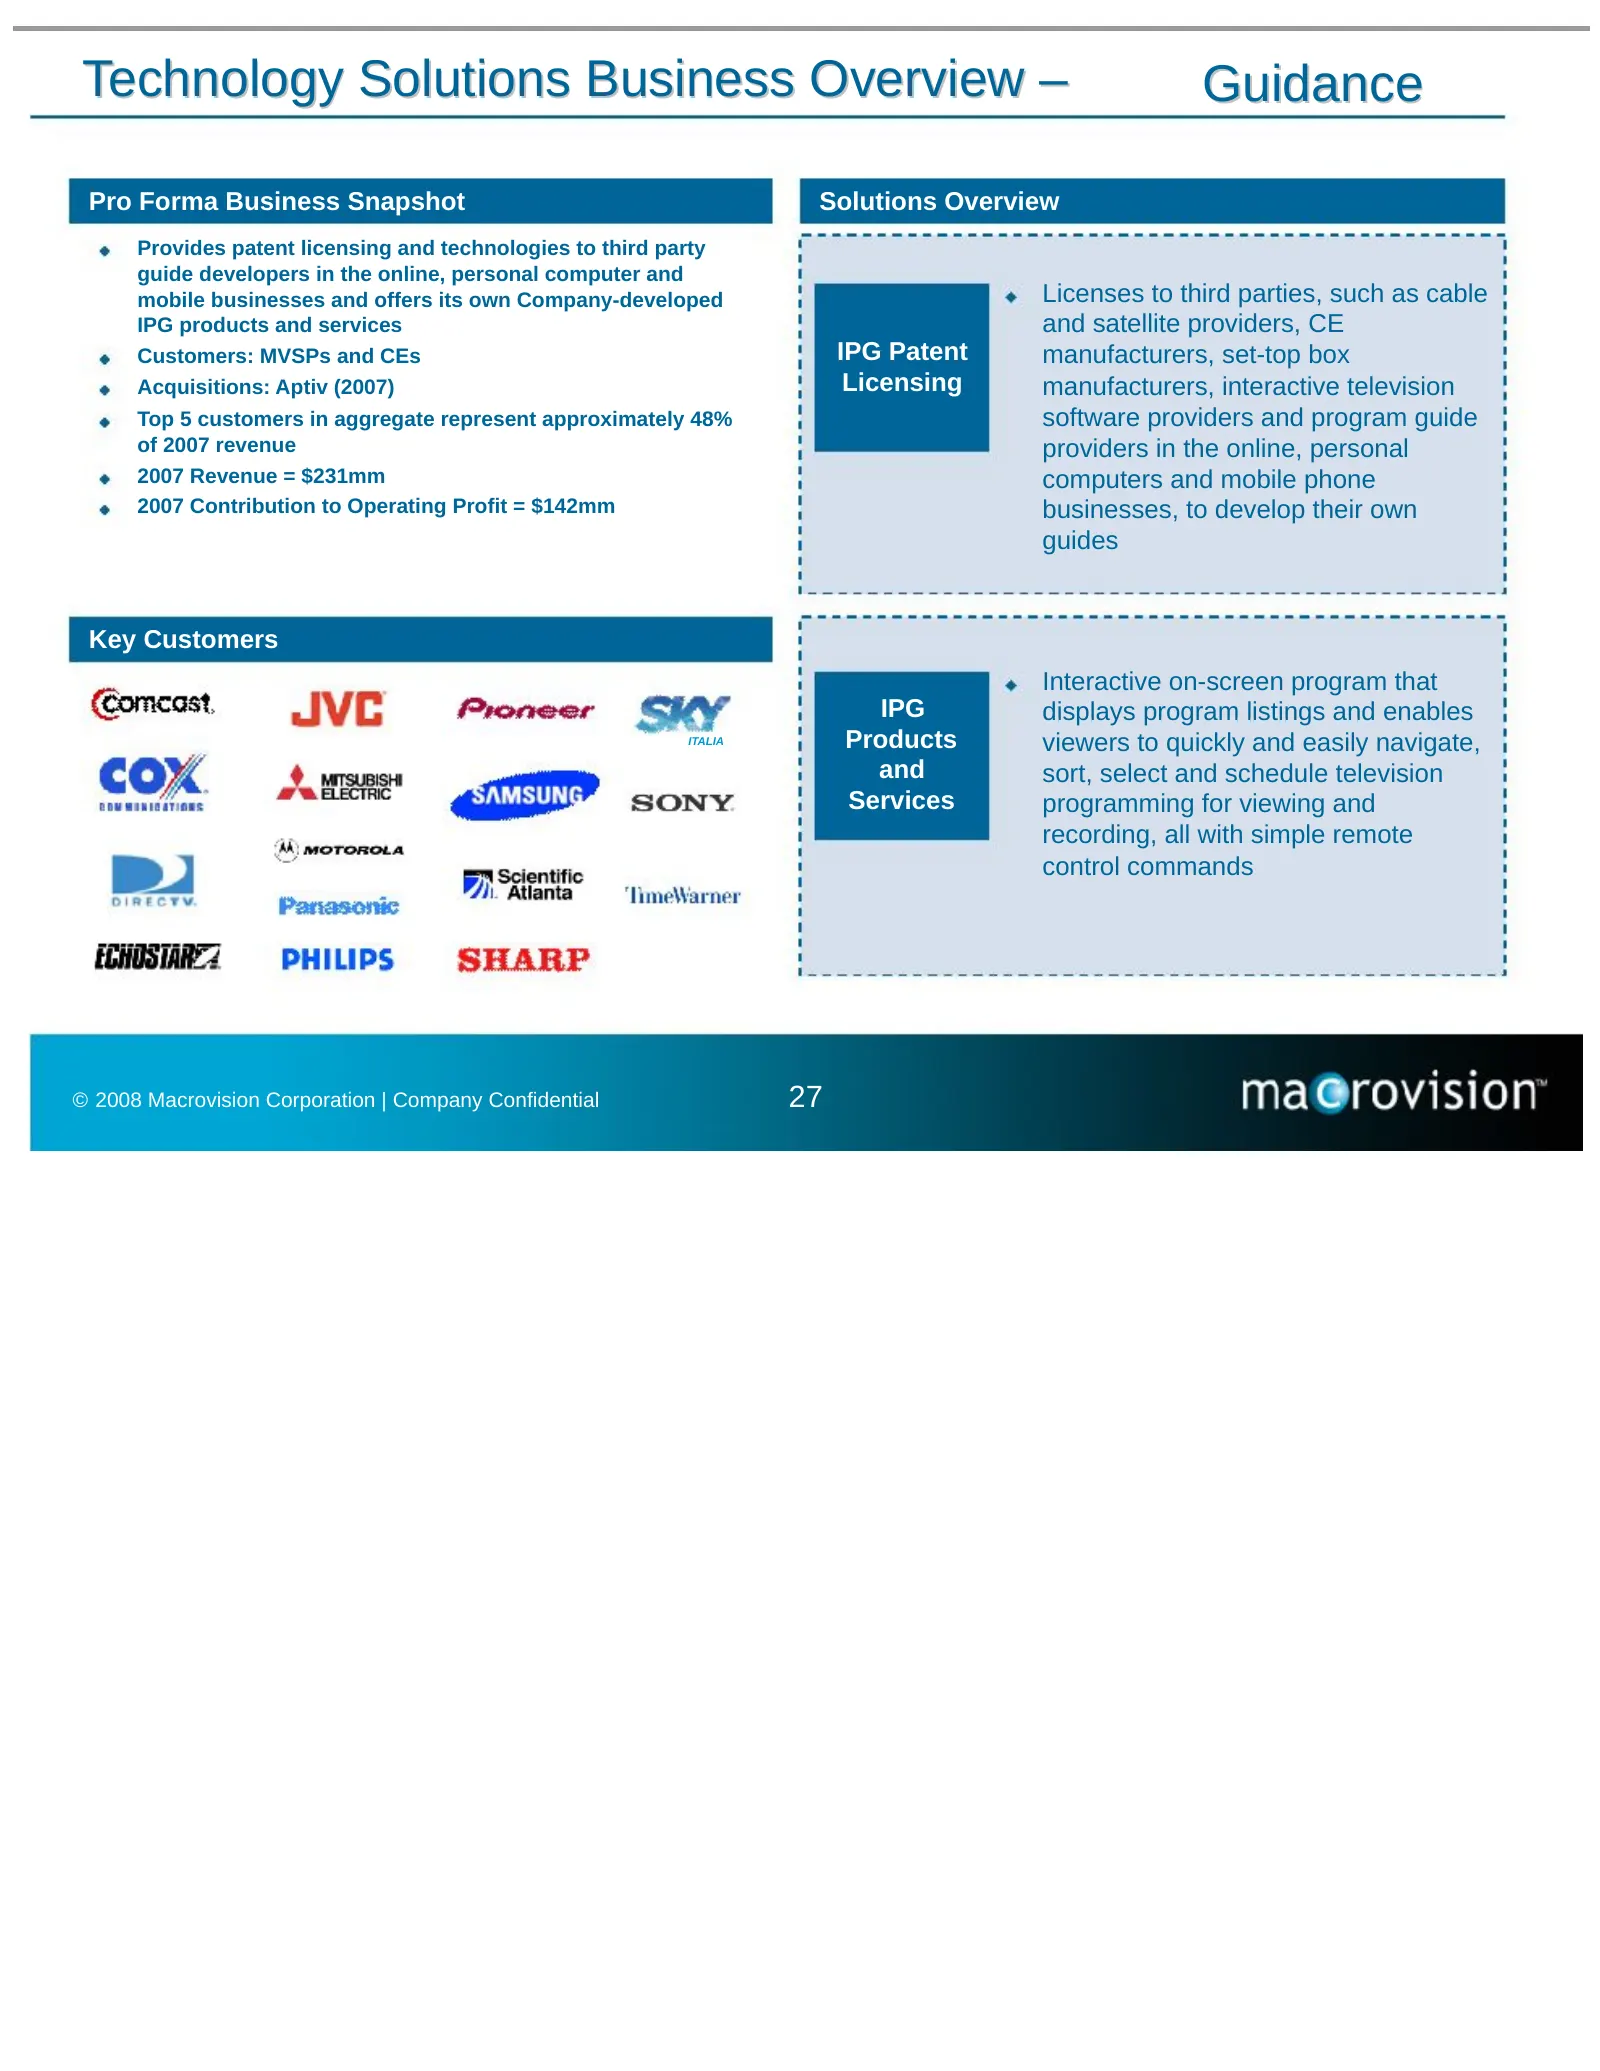
Technology Solutions Business Overview – Guidance Pro Forma Business Snapshot Solutions Overview Provides patent licensing and technologies to third party guide developers in the online, personal computer and mobile businesses and offers its own Company-developed Licenses to third parties, such as c
Slide 29: Technology Solutions Business Overview – Content Protection
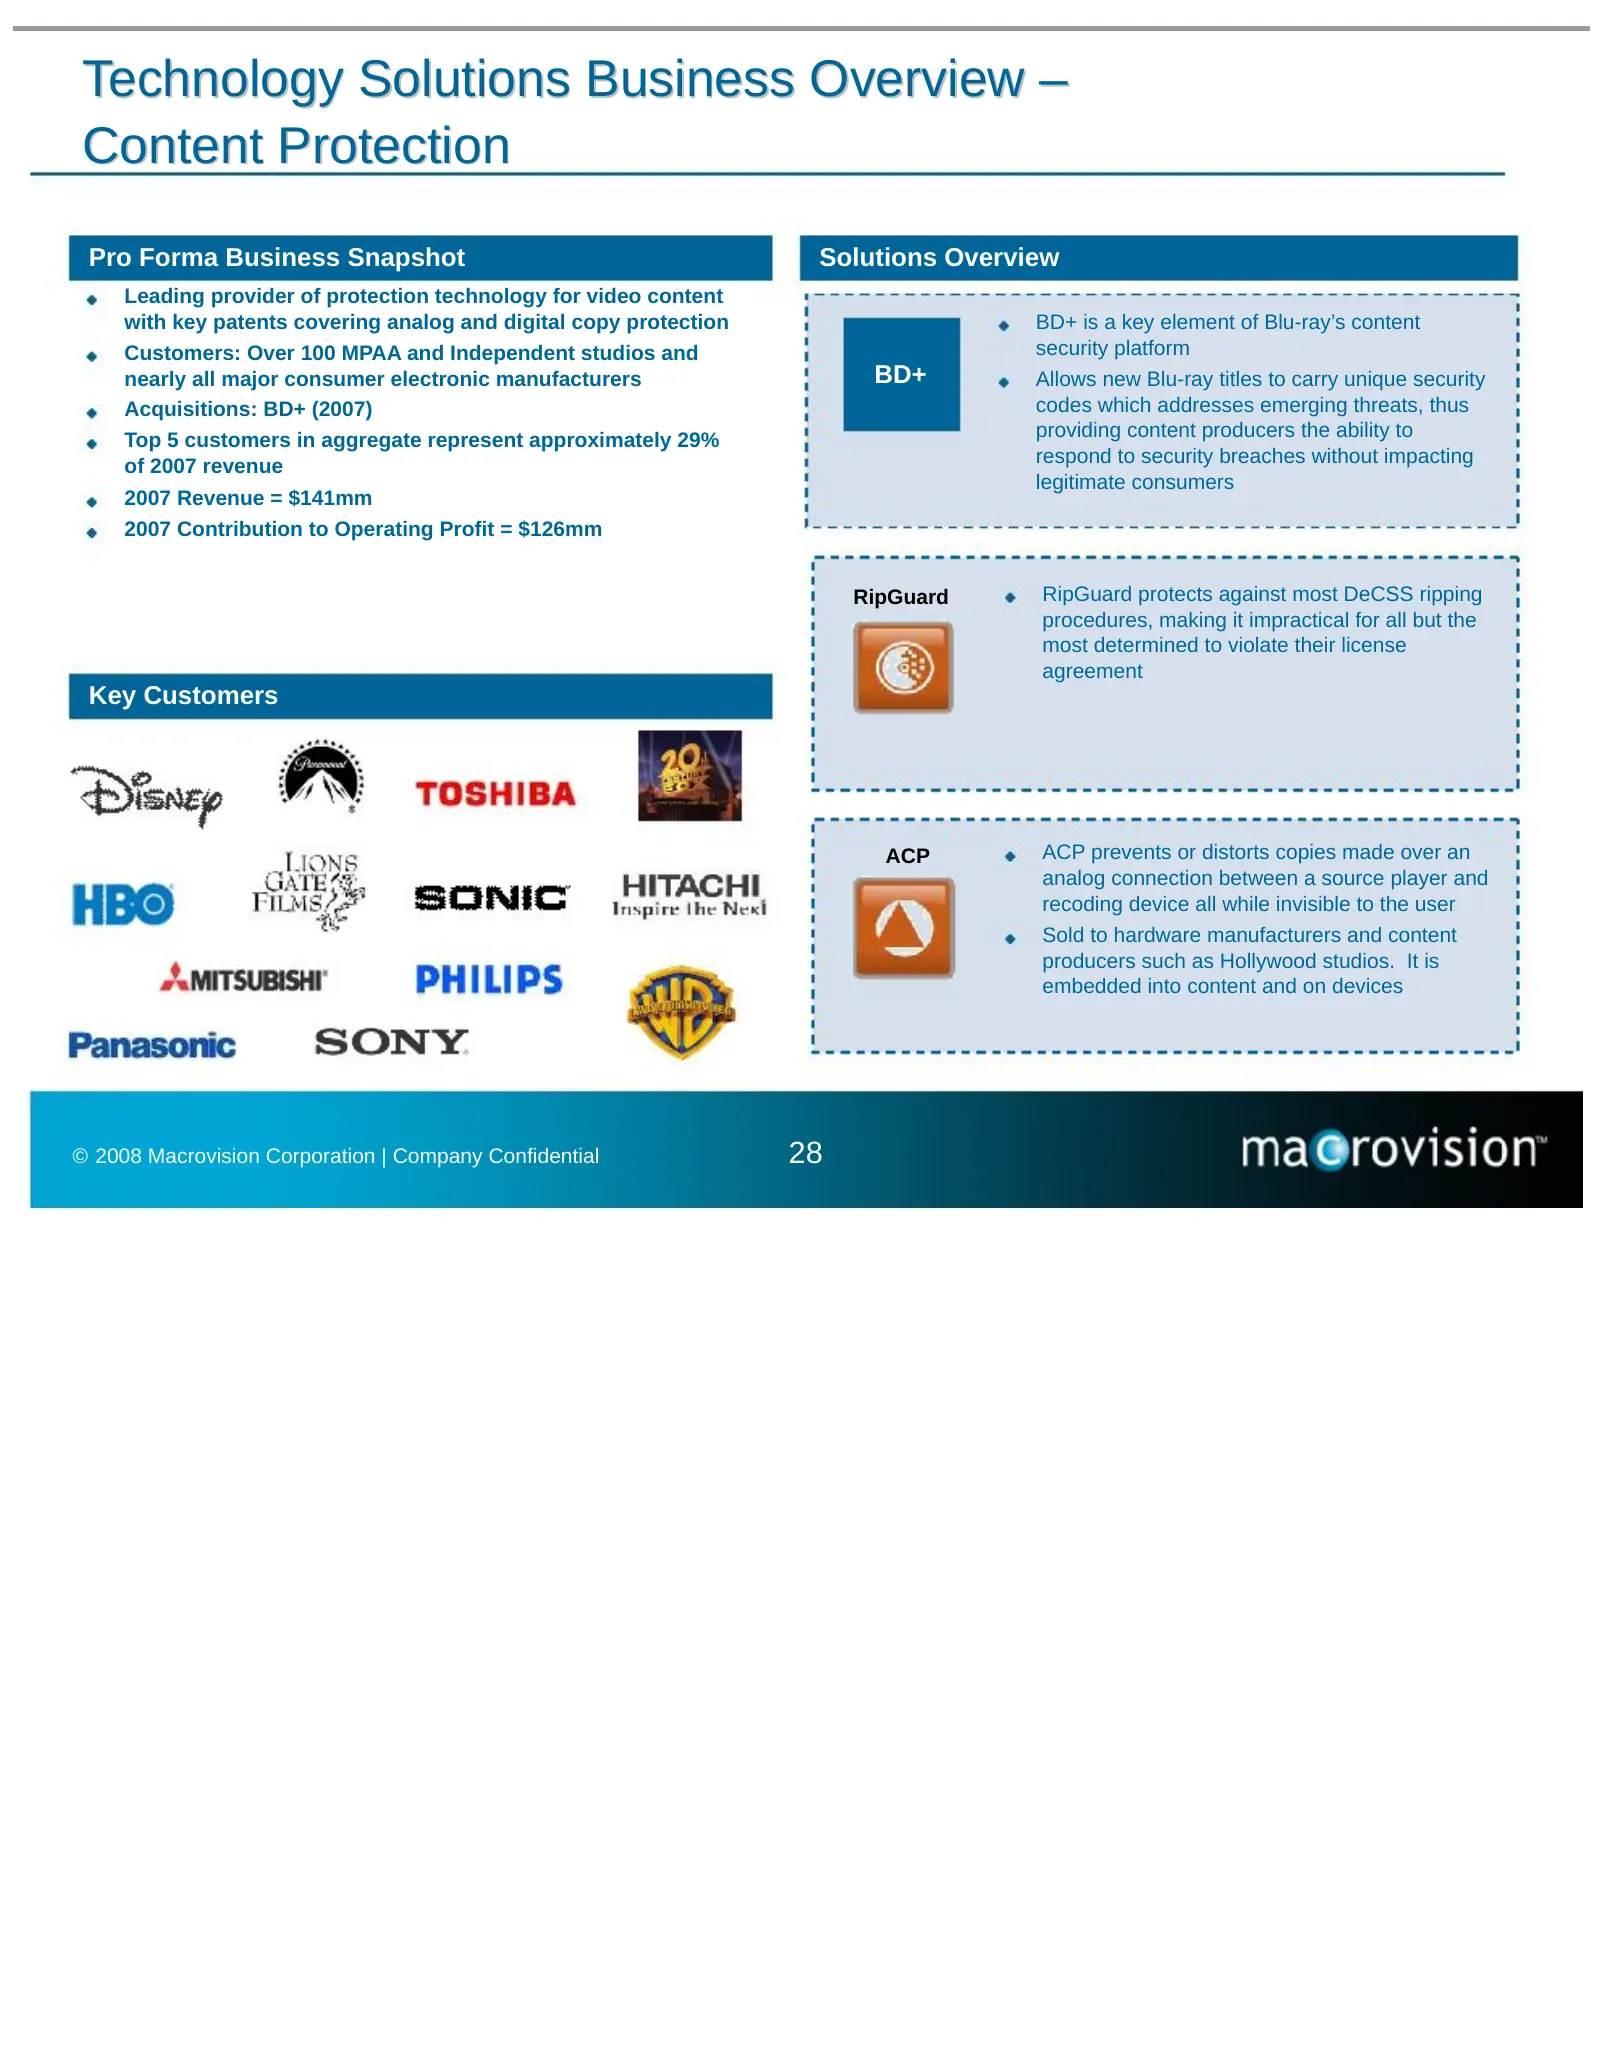
Technology Solutions Business Overview – Content Protection Pro Forma Business Snapshot Solutions Overview Leading provider of protection technology for video content with key patents covering analog and digital copy protection BD+ is a key element of Blu-ray’s content Customers: Over 100 MPAA and I
Slide 30: Technology Solutions Business Overview – Metadata & Media Recognition
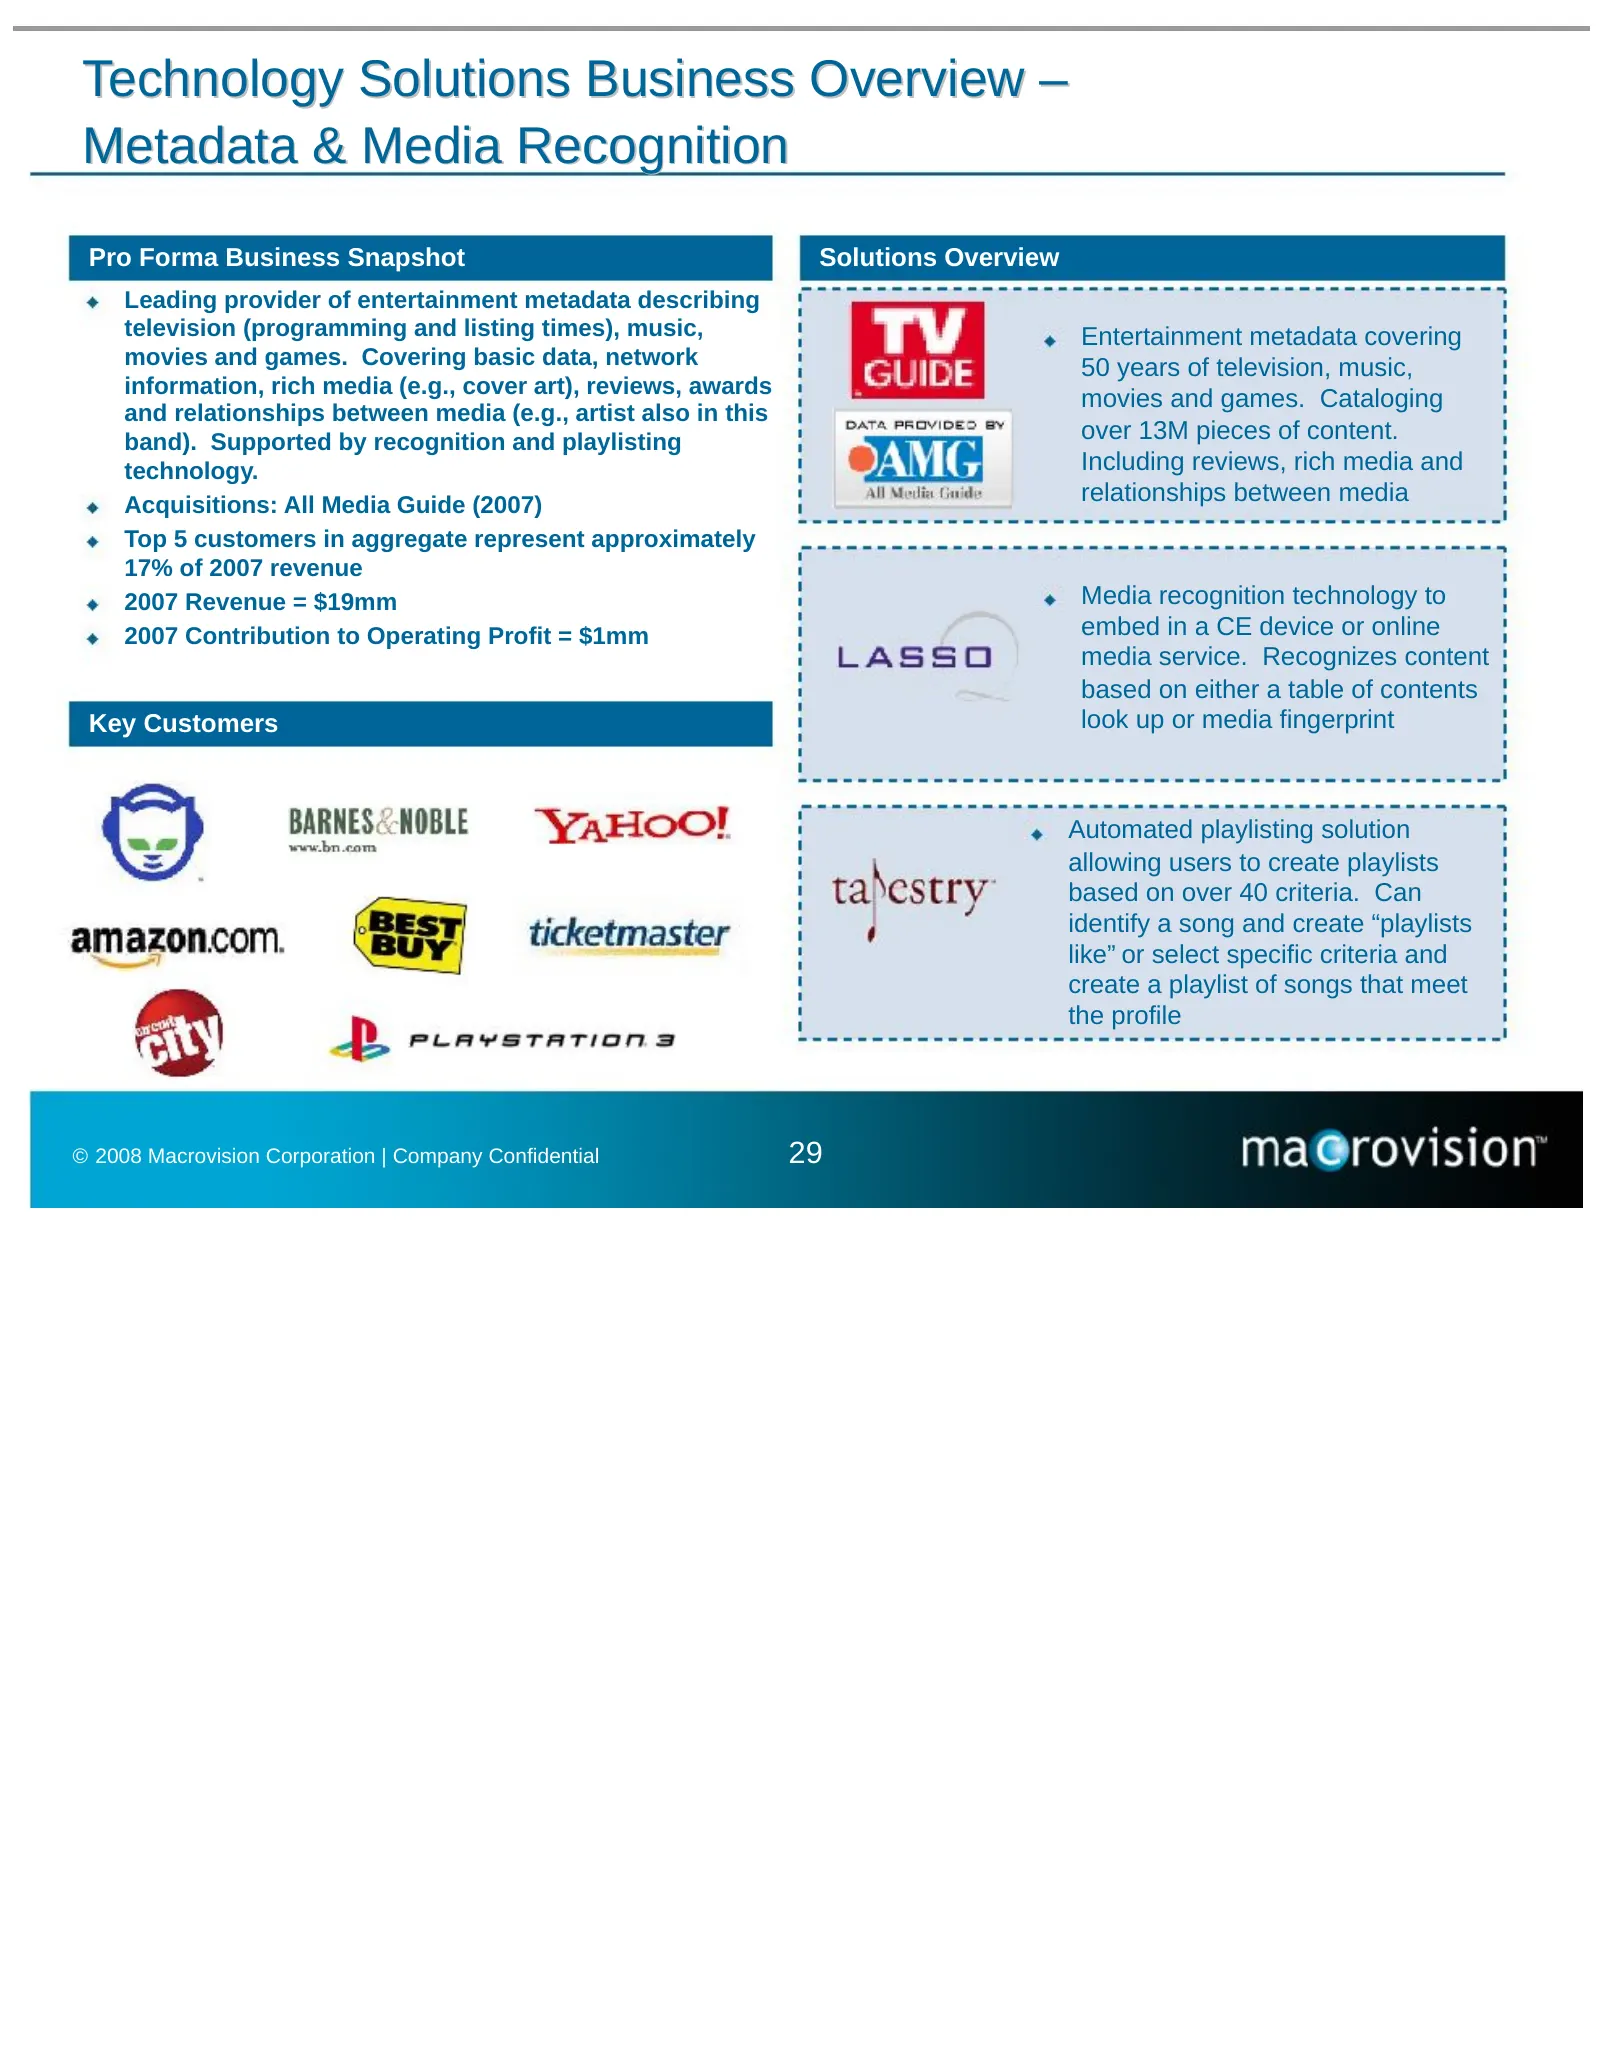
Technology Solutions Business Overview – Metadata & Media Recognition Pro Forma Business Snapshot Solutions Overview Leading provider of entertainment metadata describing television (programming and listing times), music, Entertainment metadata covering movies and games. Covering basic data, network
Slide 31: Technology Solutions Business Overview – Connected Platform & Services
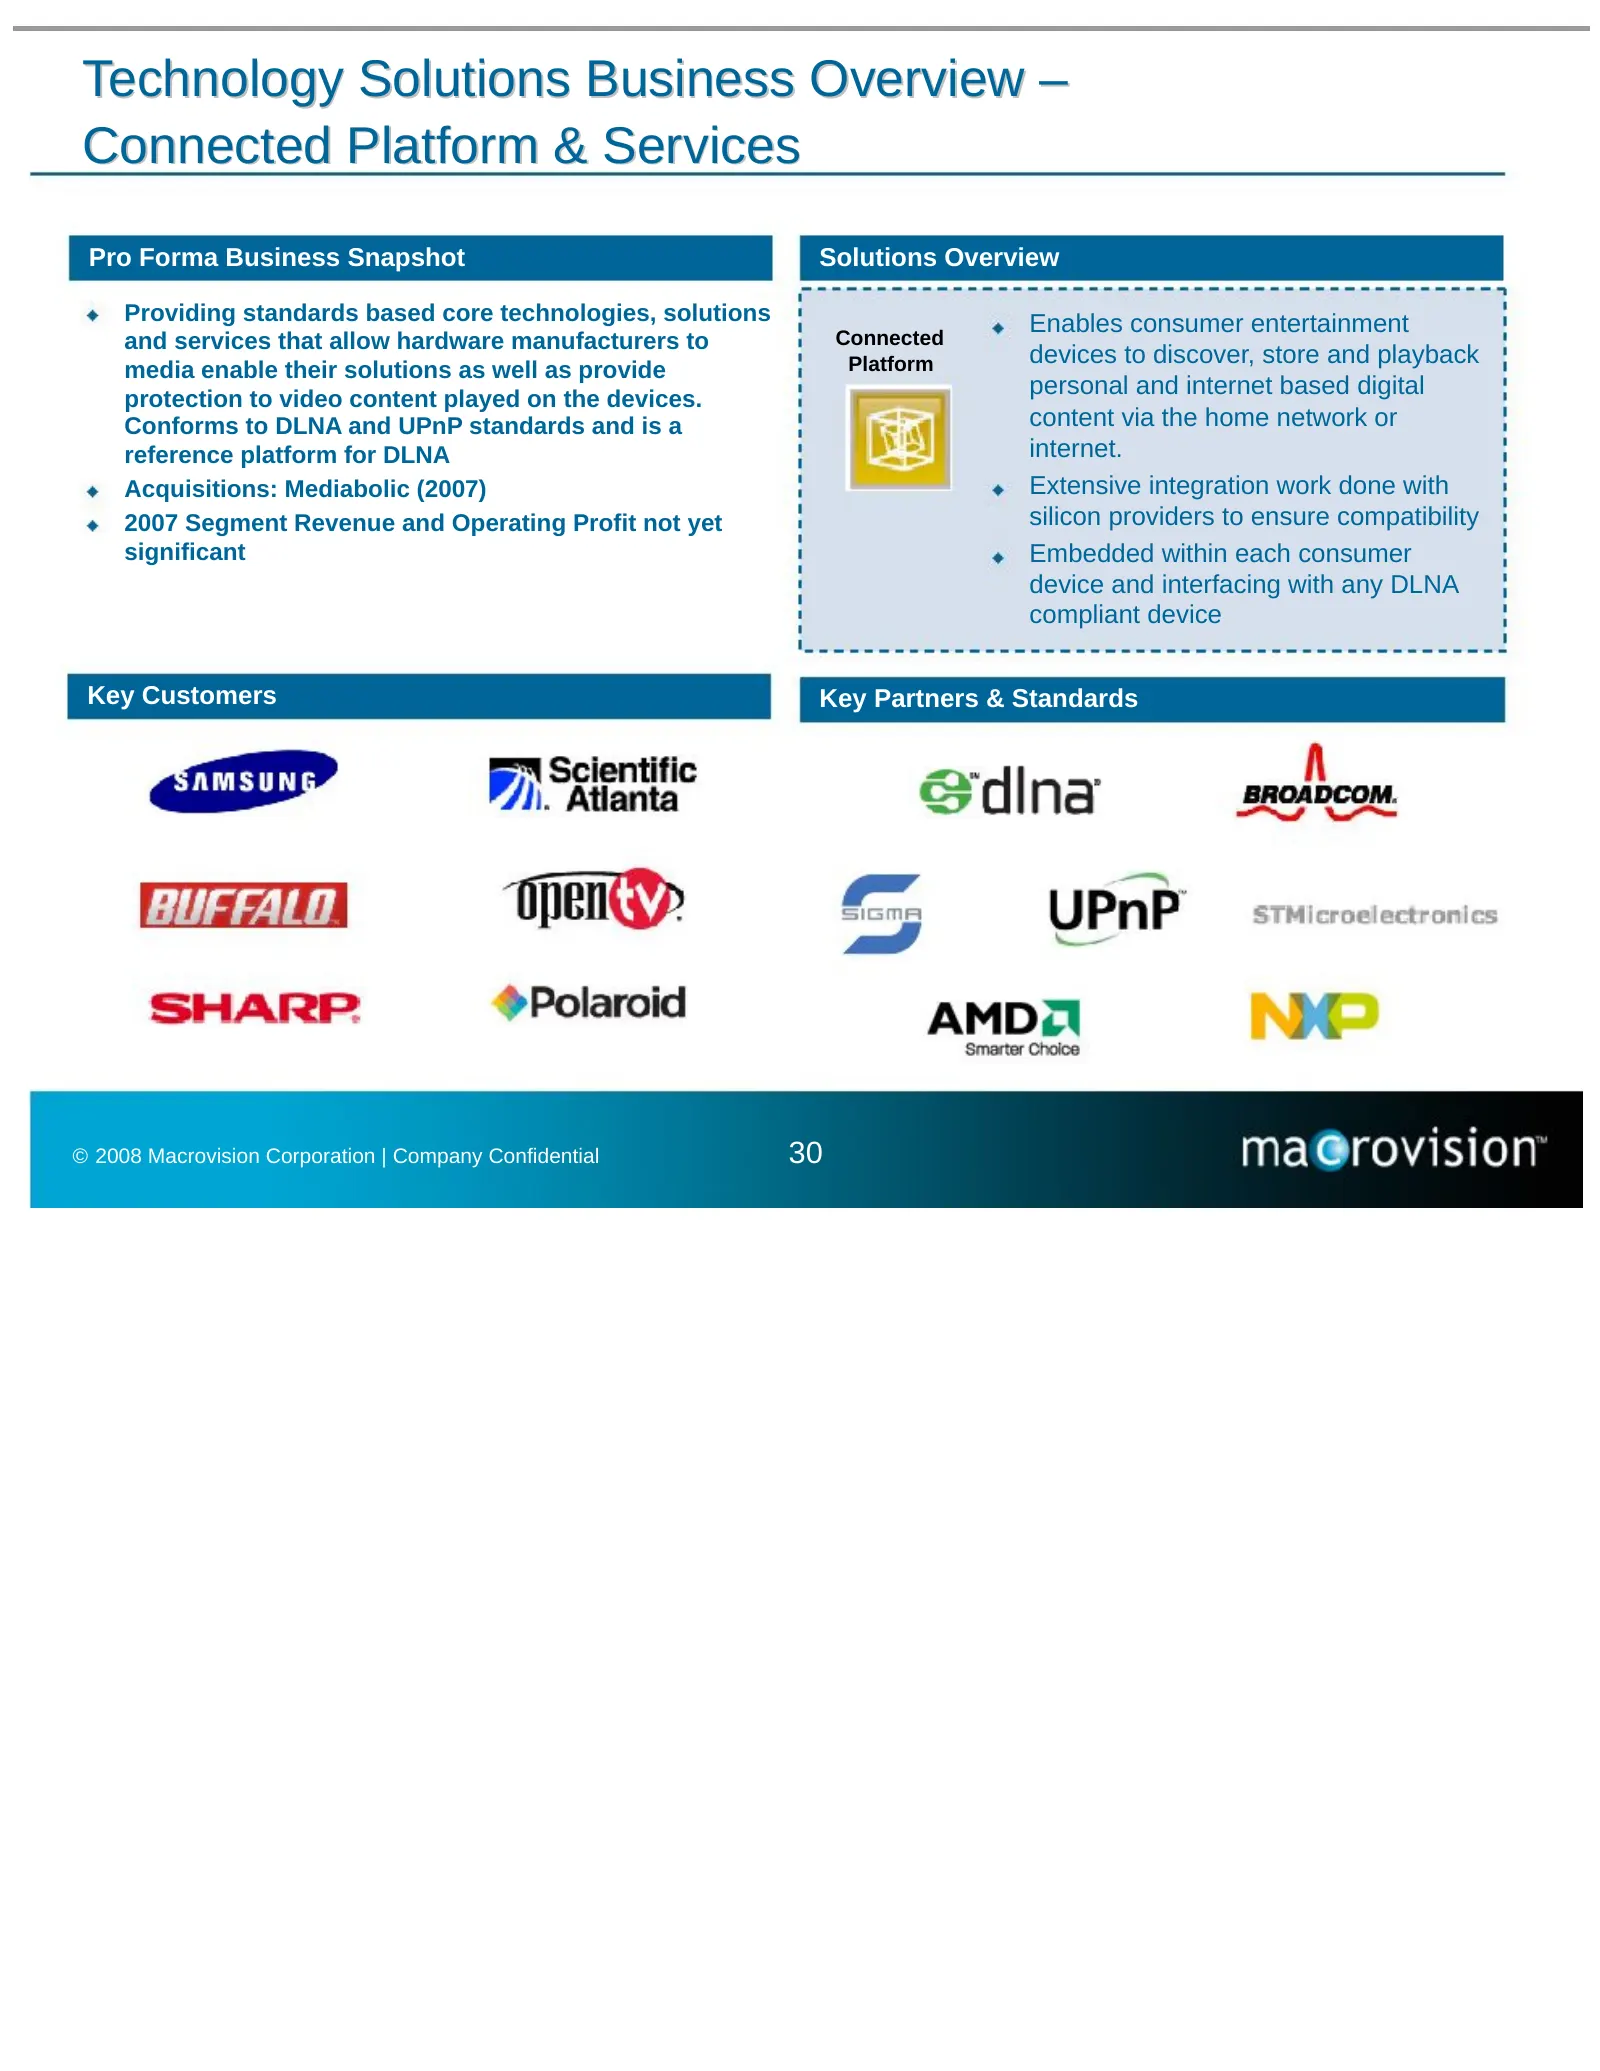
Technology Solutions Business Overview – Connected Platform & Services Pro Forma Business Snapshot Solutions Overview Providing standards based core technologies, solutions Enables consumer entertainment and services that allow hardware manufacturers to Connected Platform devices to discover, store
Slide 32: Technology Solutions Business Overview – Online Networks
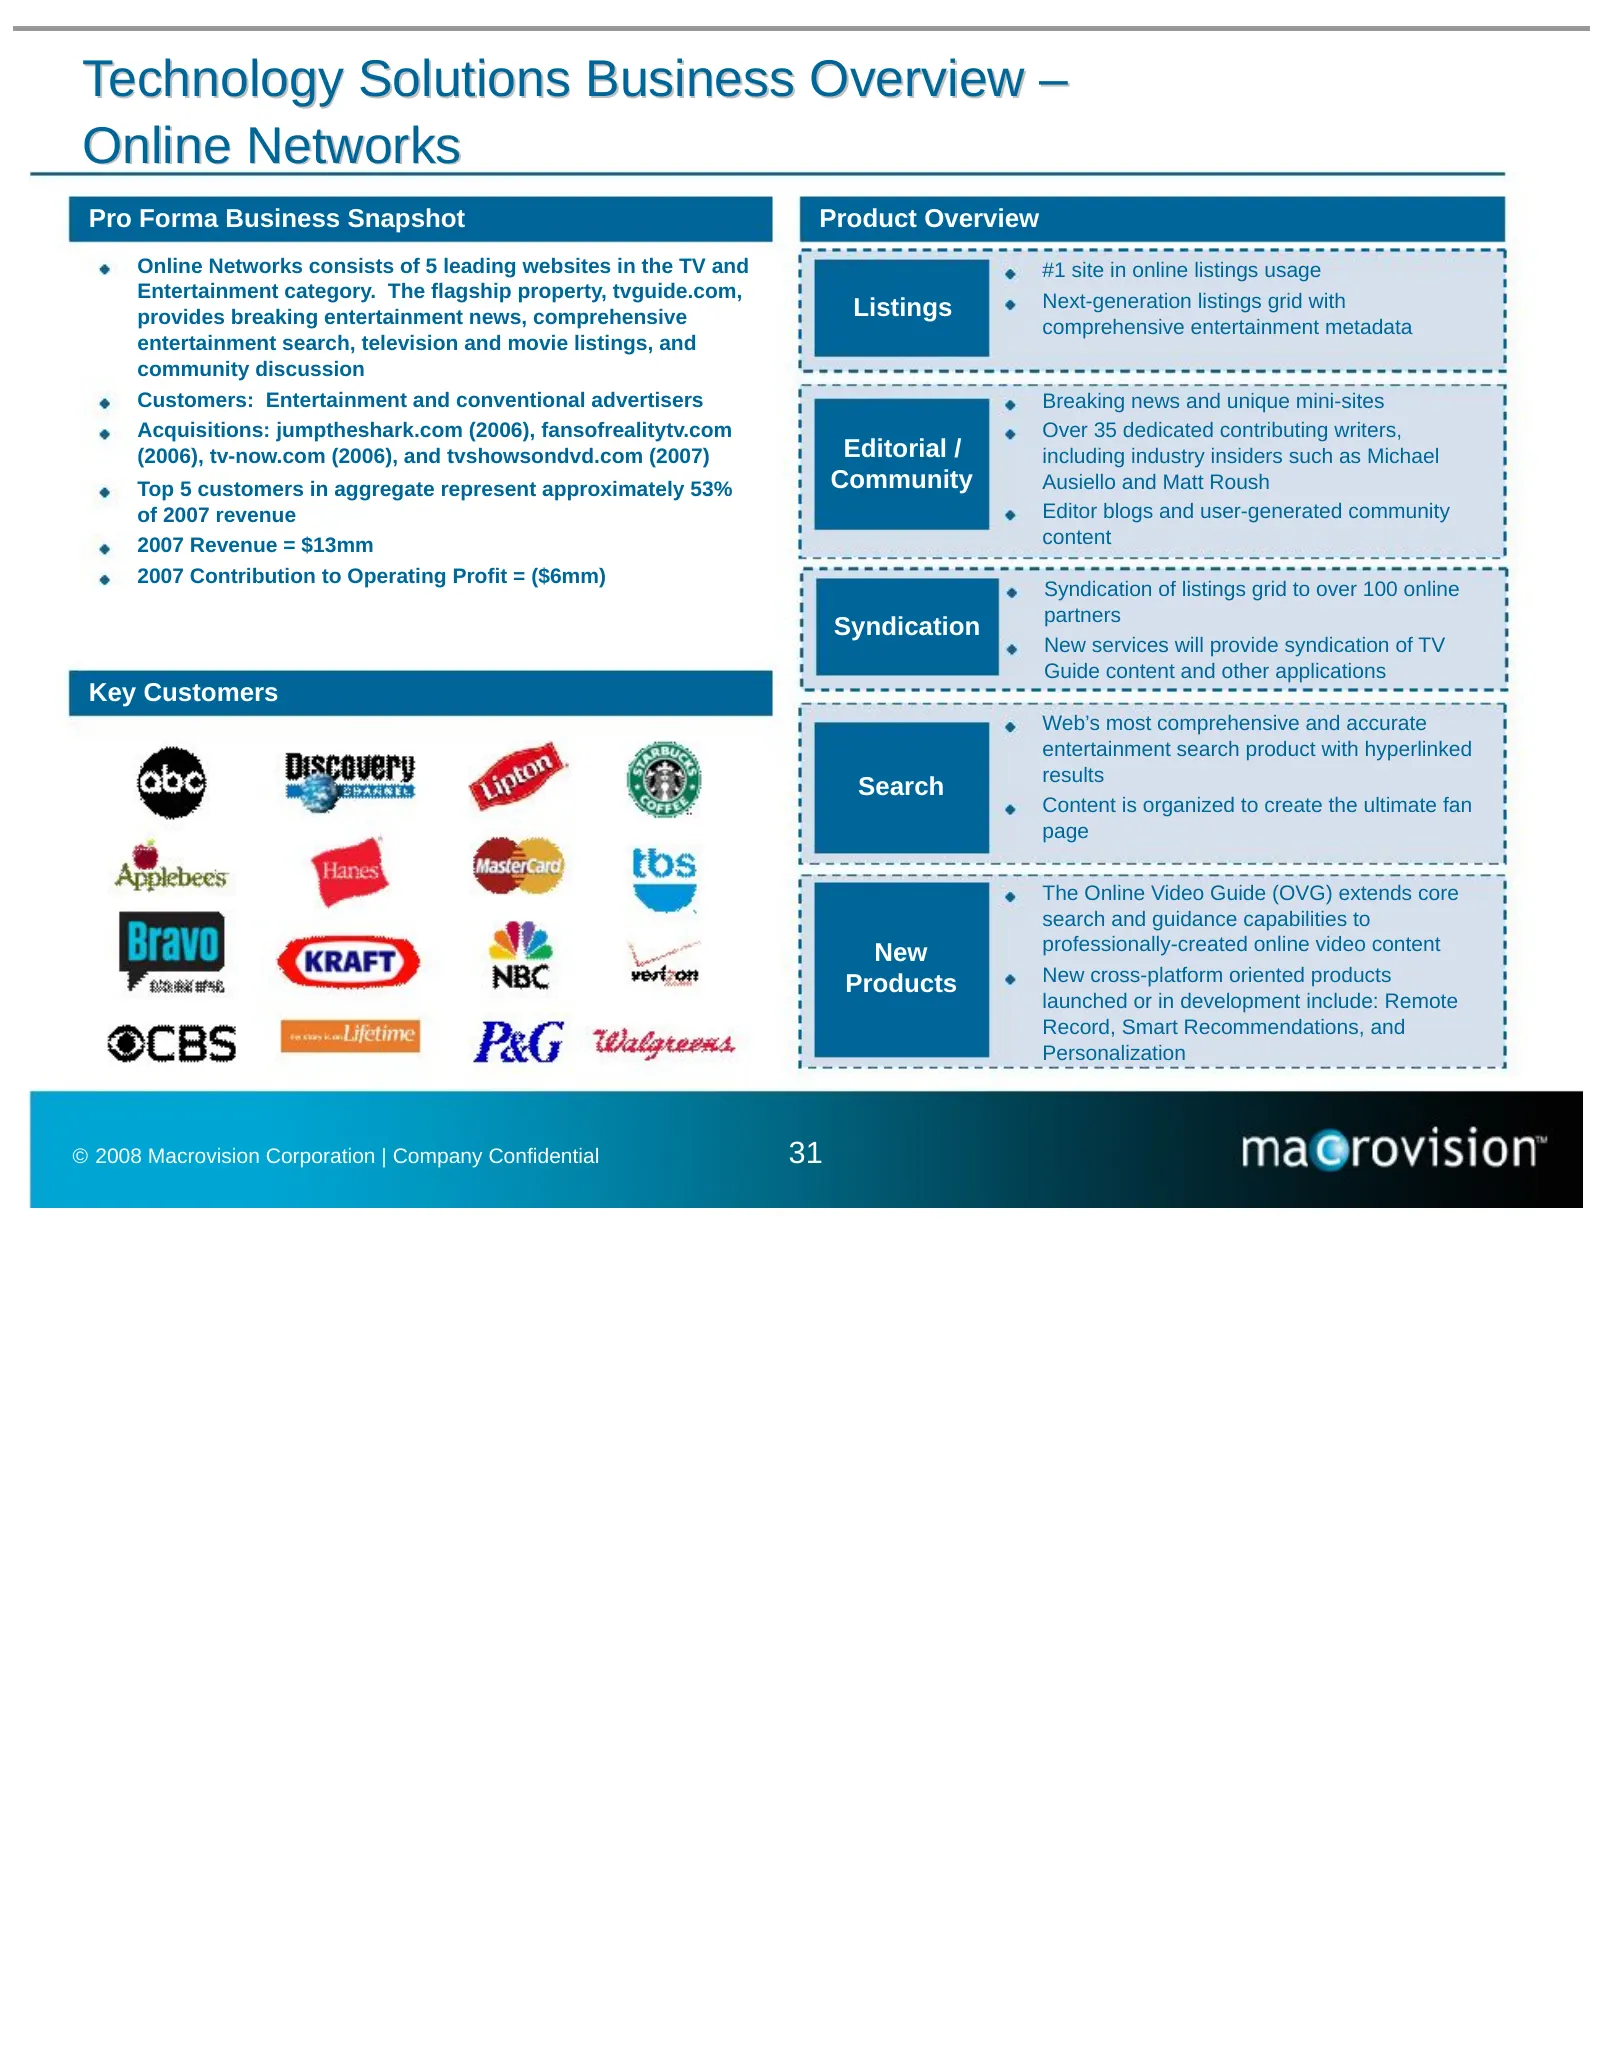
Technology Solutions Business Overview – Online Networks Pro Forma Business Snapshot Product Overview Online Networks consists of 5 leading websites in the TV and #1 site in online listings usage Entertainment category. The flagship property, tvguide.com, Next-generation listings grid with provides
Slide 33: Media Networks Overview
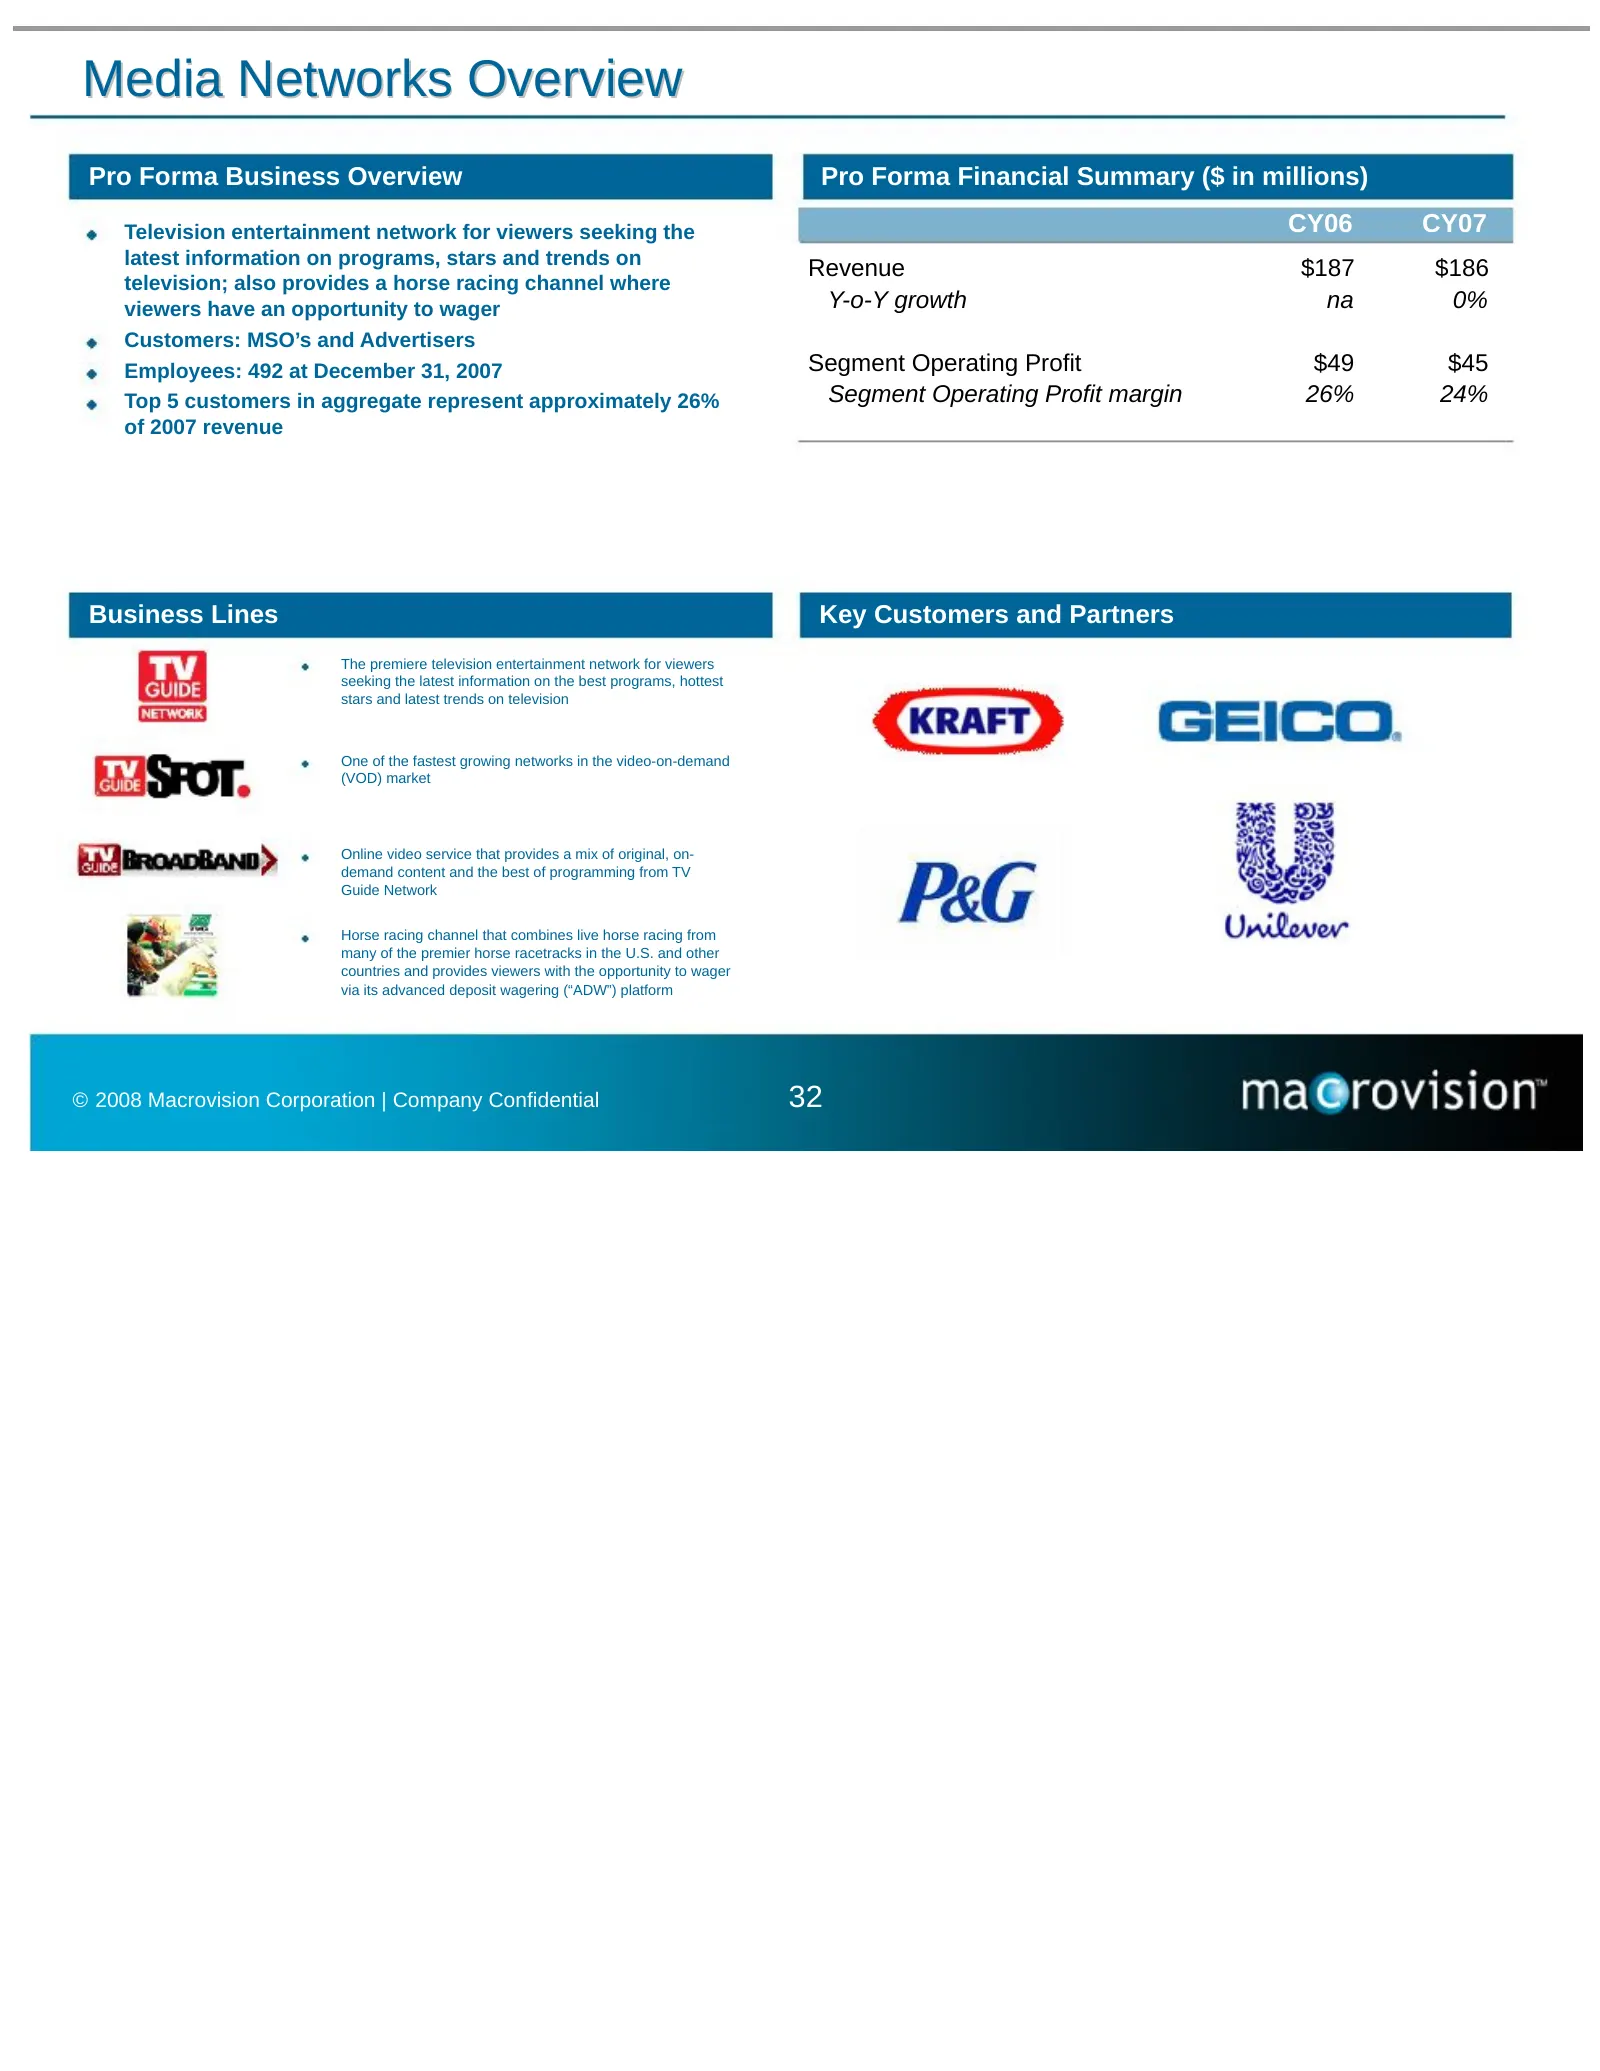
Media Networks Overview Pro Forma Business Overview Pro Forma Financial Summary ($ in millions) Television entertainment network for viewers seeking the CY06 CY07 latest information on programs, stars and trends on Revenue $187 $186 television; also provides a horse racing channel where viewers have
Slide 34: Backed by Strong Patent Portfolio
Backed by Strong Patent Portfolio • Combined Company’s patent portfolio will include more than 2,300 issued patents and nearly 1,500 pending applications worldwide o Generally, the portfolio includes coverage that is directed to the display of and interaction with, television program schedule inform
Slide 35: Attractive Growth Opportunities
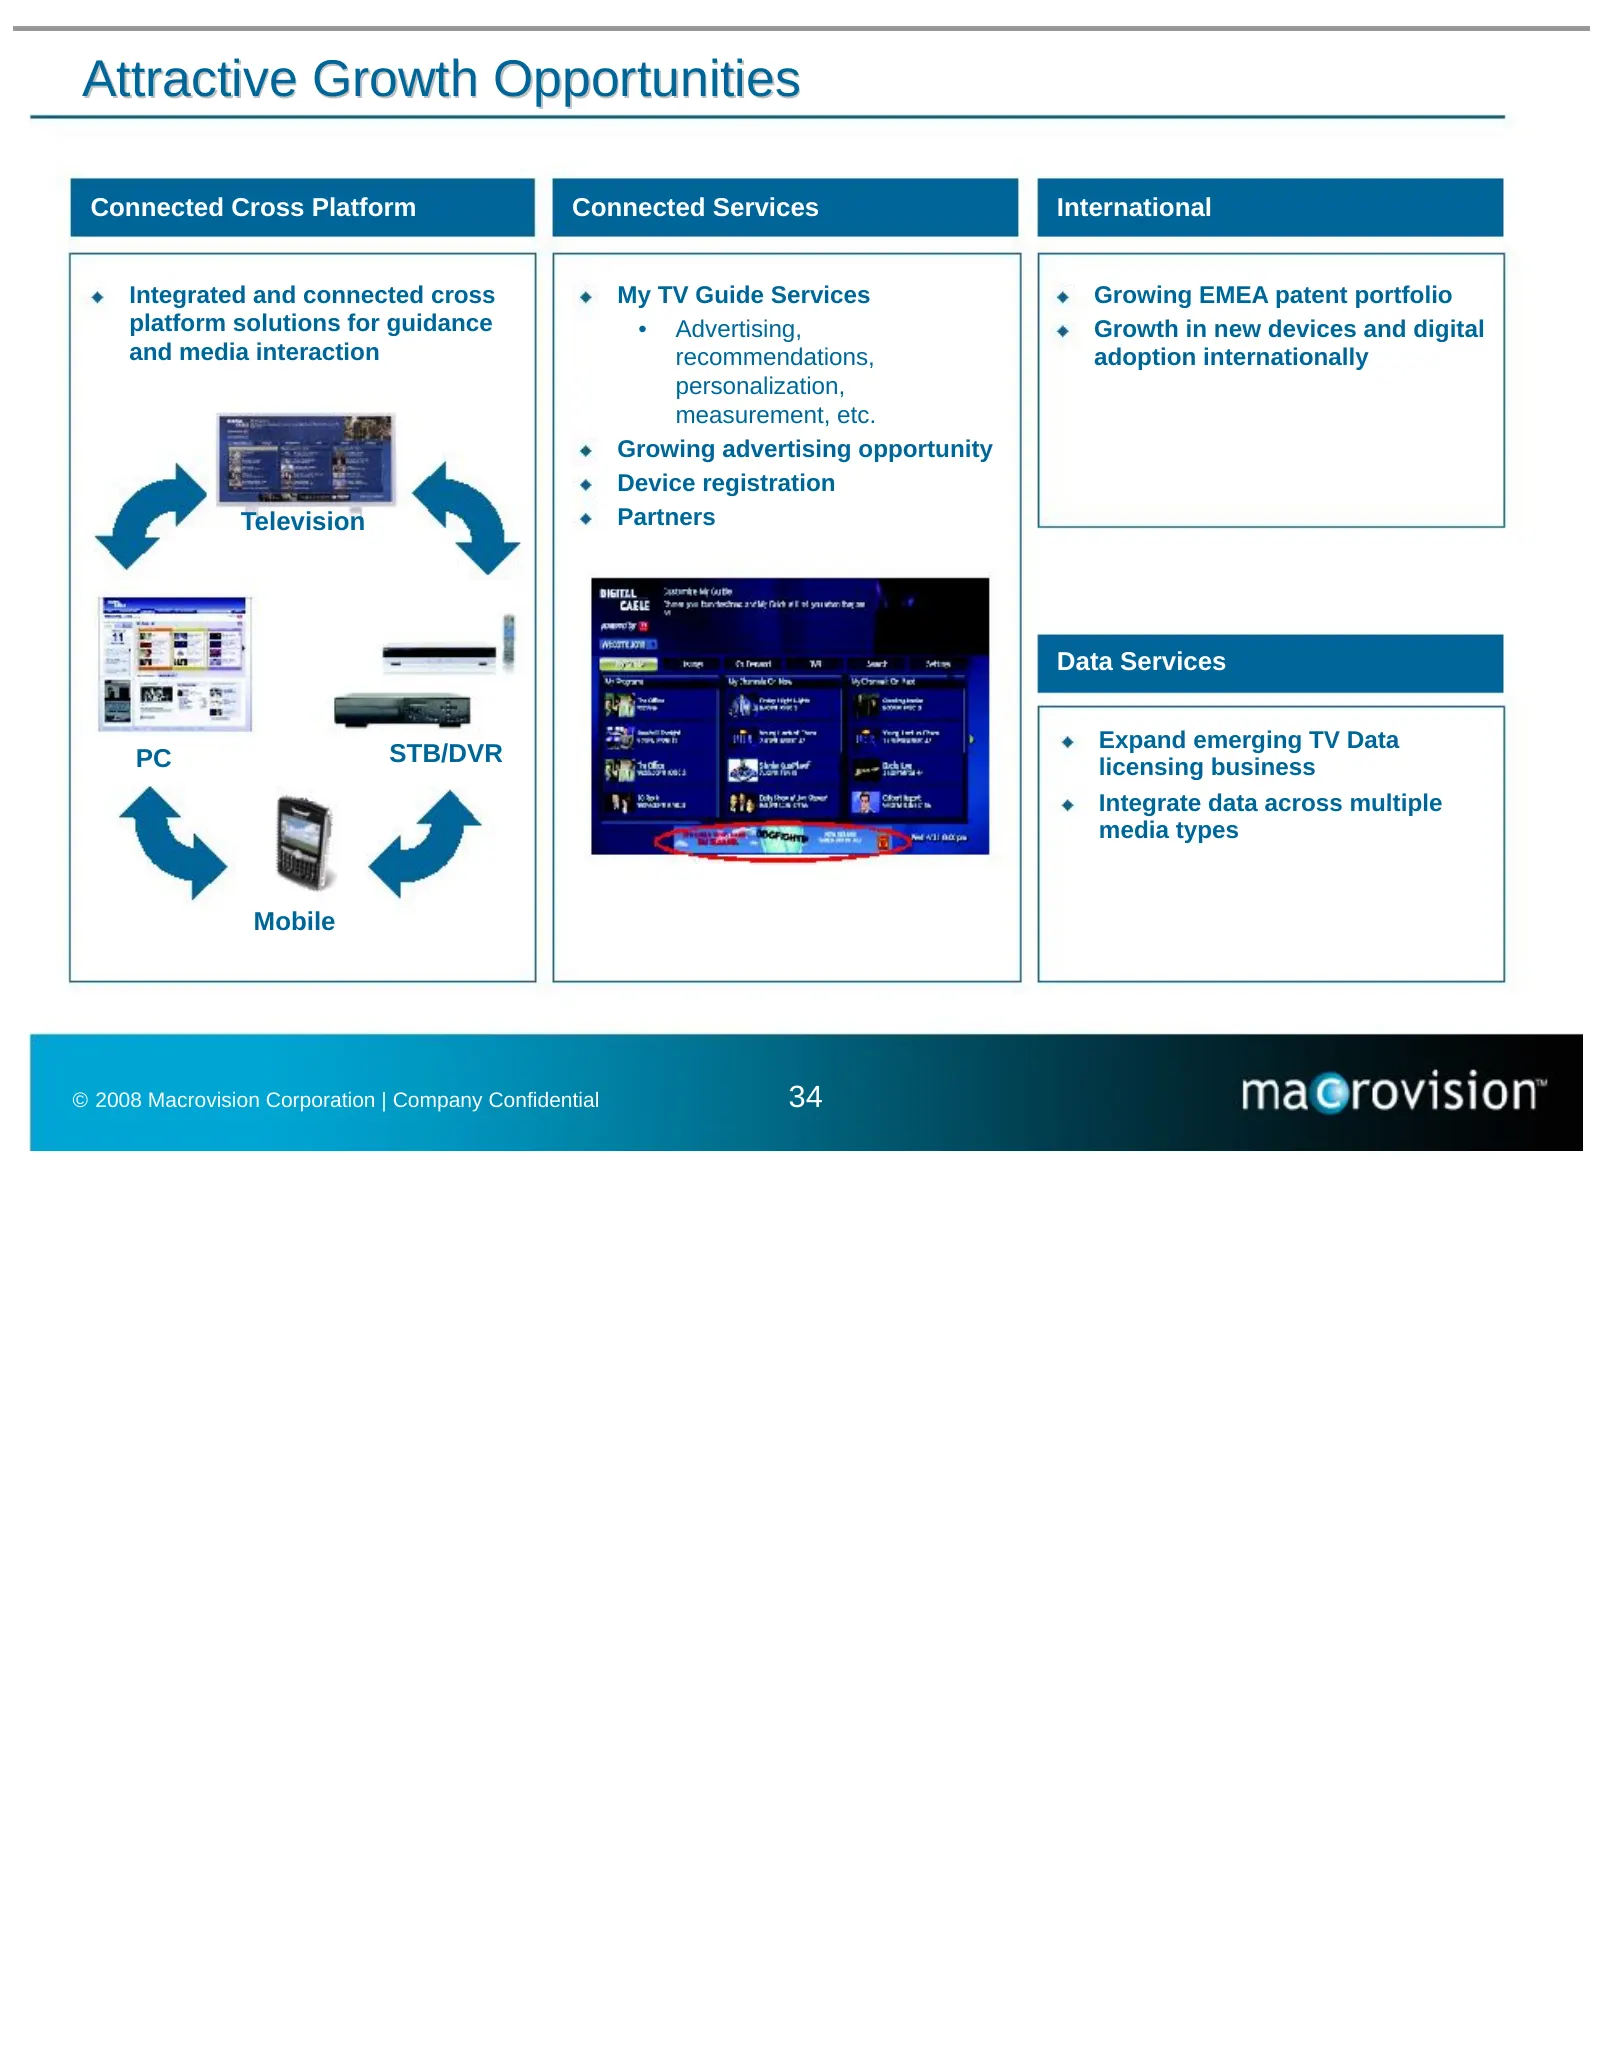
Attractive Growth Opportunities Connected Cross Platform Connected Services International Integrated and connected cross My TV Guide Services Growing EMEA patent portfolio platform solutions for guidance • Advertising, Growth in new devices and digital and media interaction recommendations, adoption
Slide 36: Synergies/Integration
Synergies/Integration Fred Amoroso, CEO, Macrovision © 2008 Macrovision Corporation | Company Confidential 35
Slide 37: Cost Synergies Summary
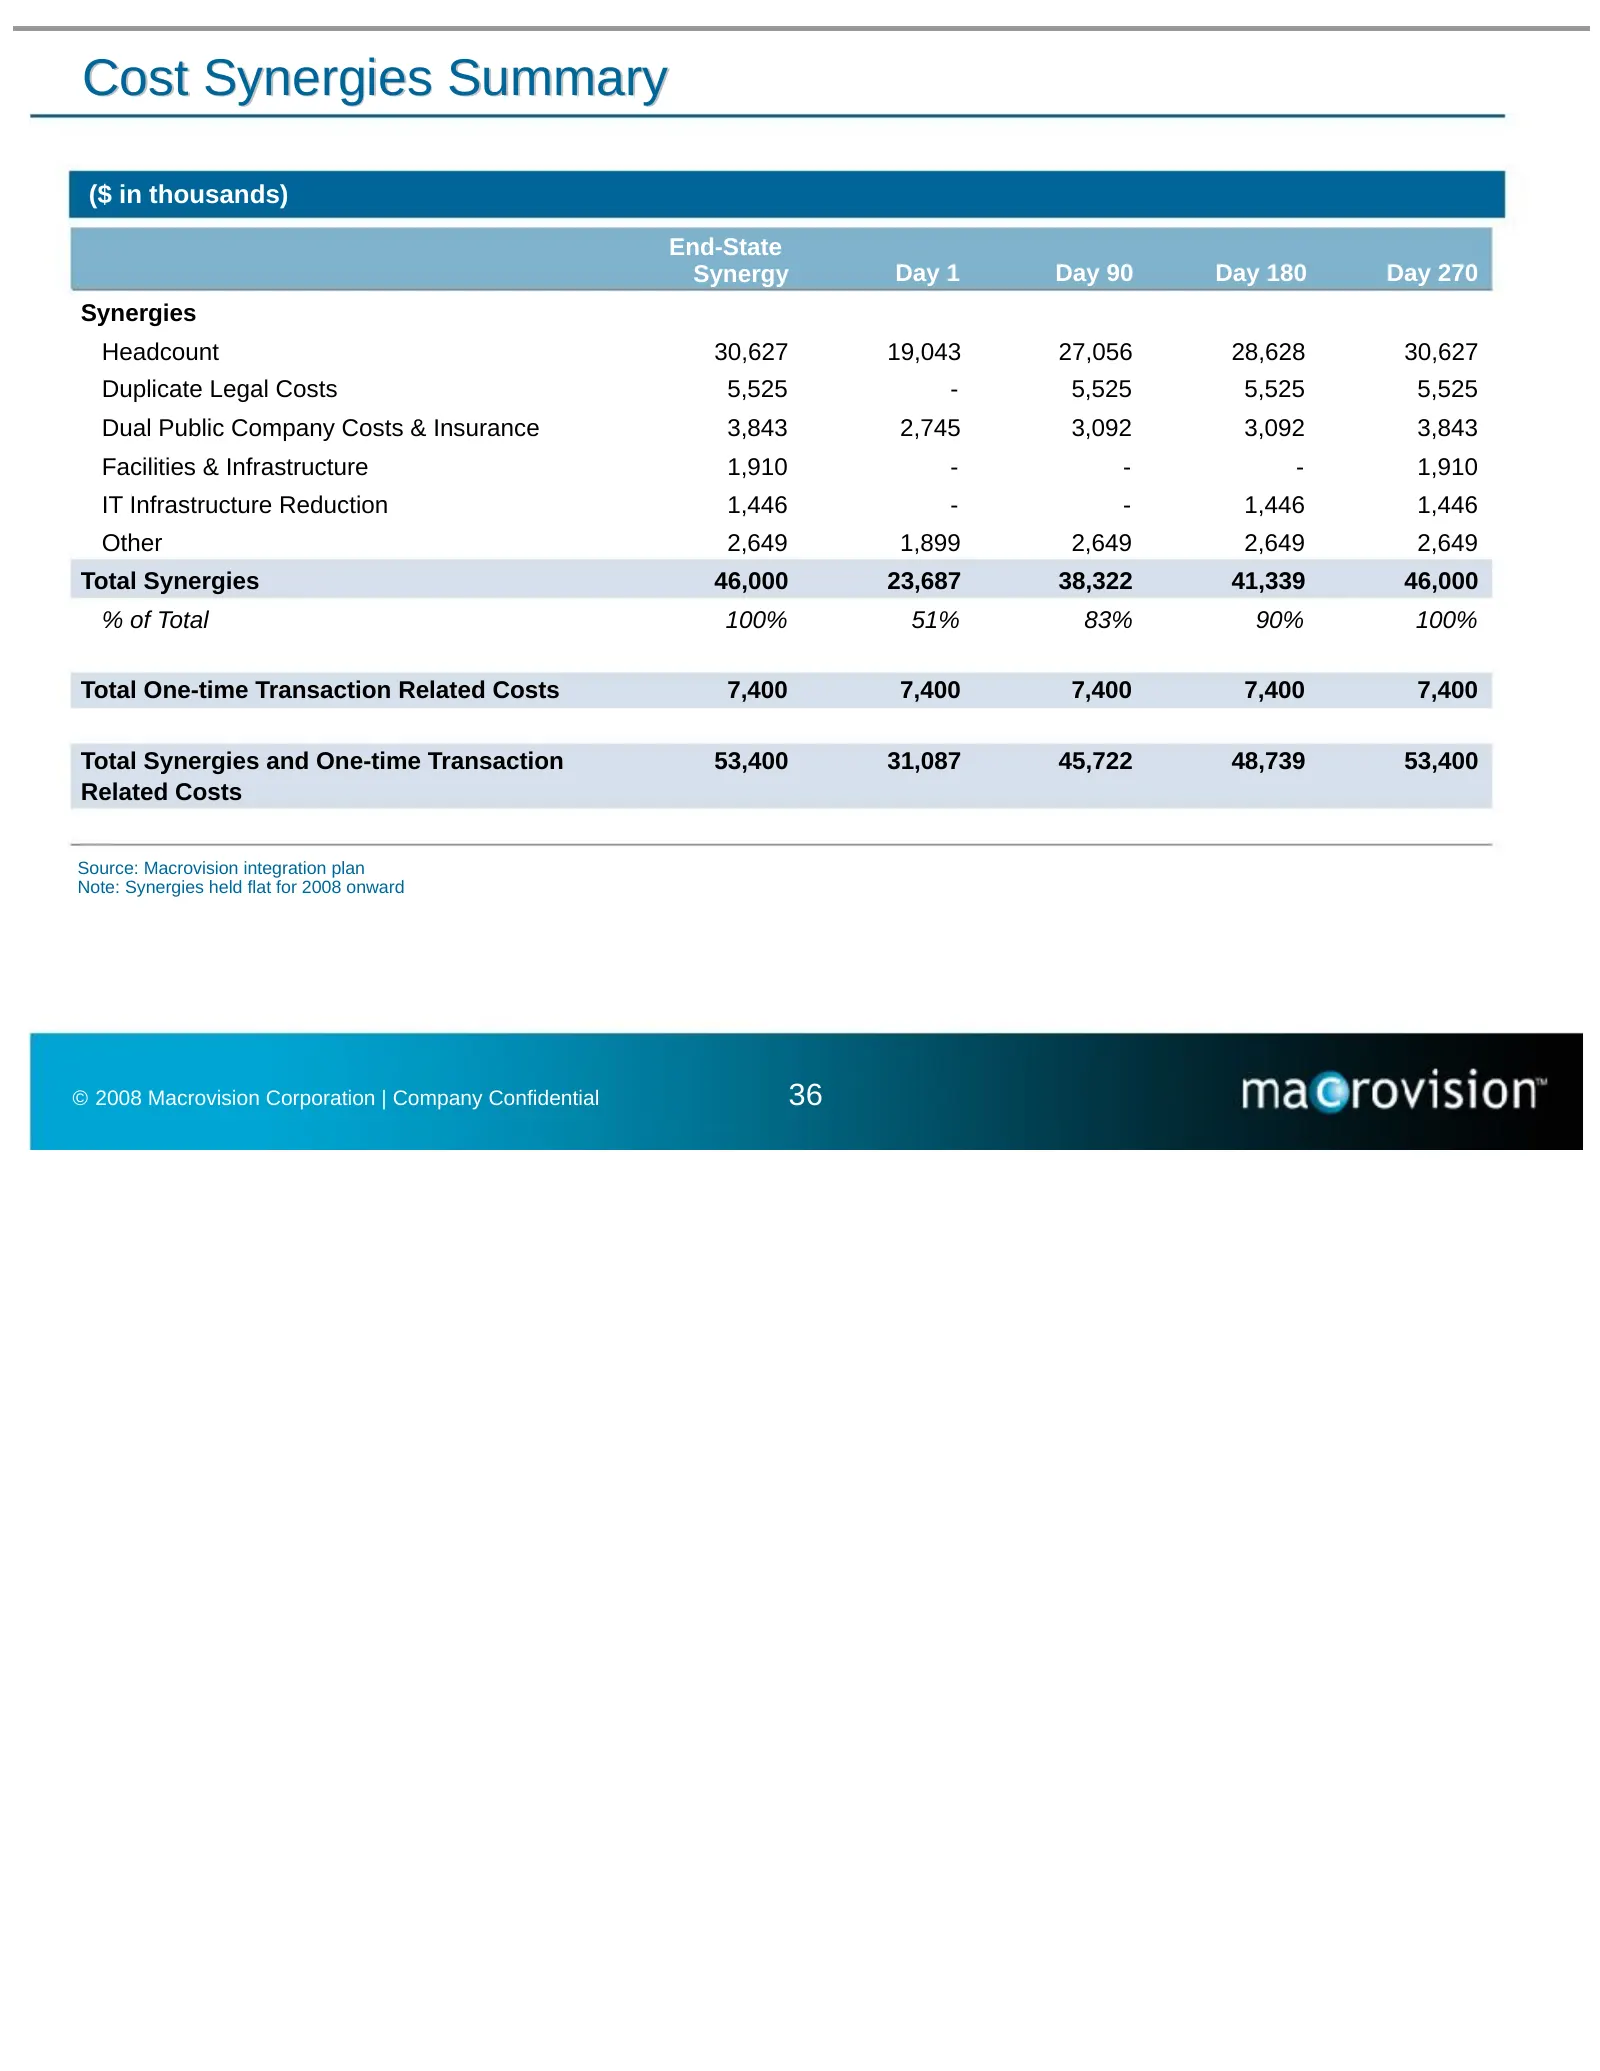
Cost Synergies Summary ($ in thousands) End-State Synergy Day 1 Day 90 Day 180 Day 270 Synergies Headcount 30,627 19,043 27,056 28,628 30,627 Duplicate Legal Costs 5,525 - 5,525 5,525 5,525 Dual Public Company Costs & Insurance 3,843 2,745 3,092 3,092 3,843 Facilities & Infrastructure 1,910 - - - 1,
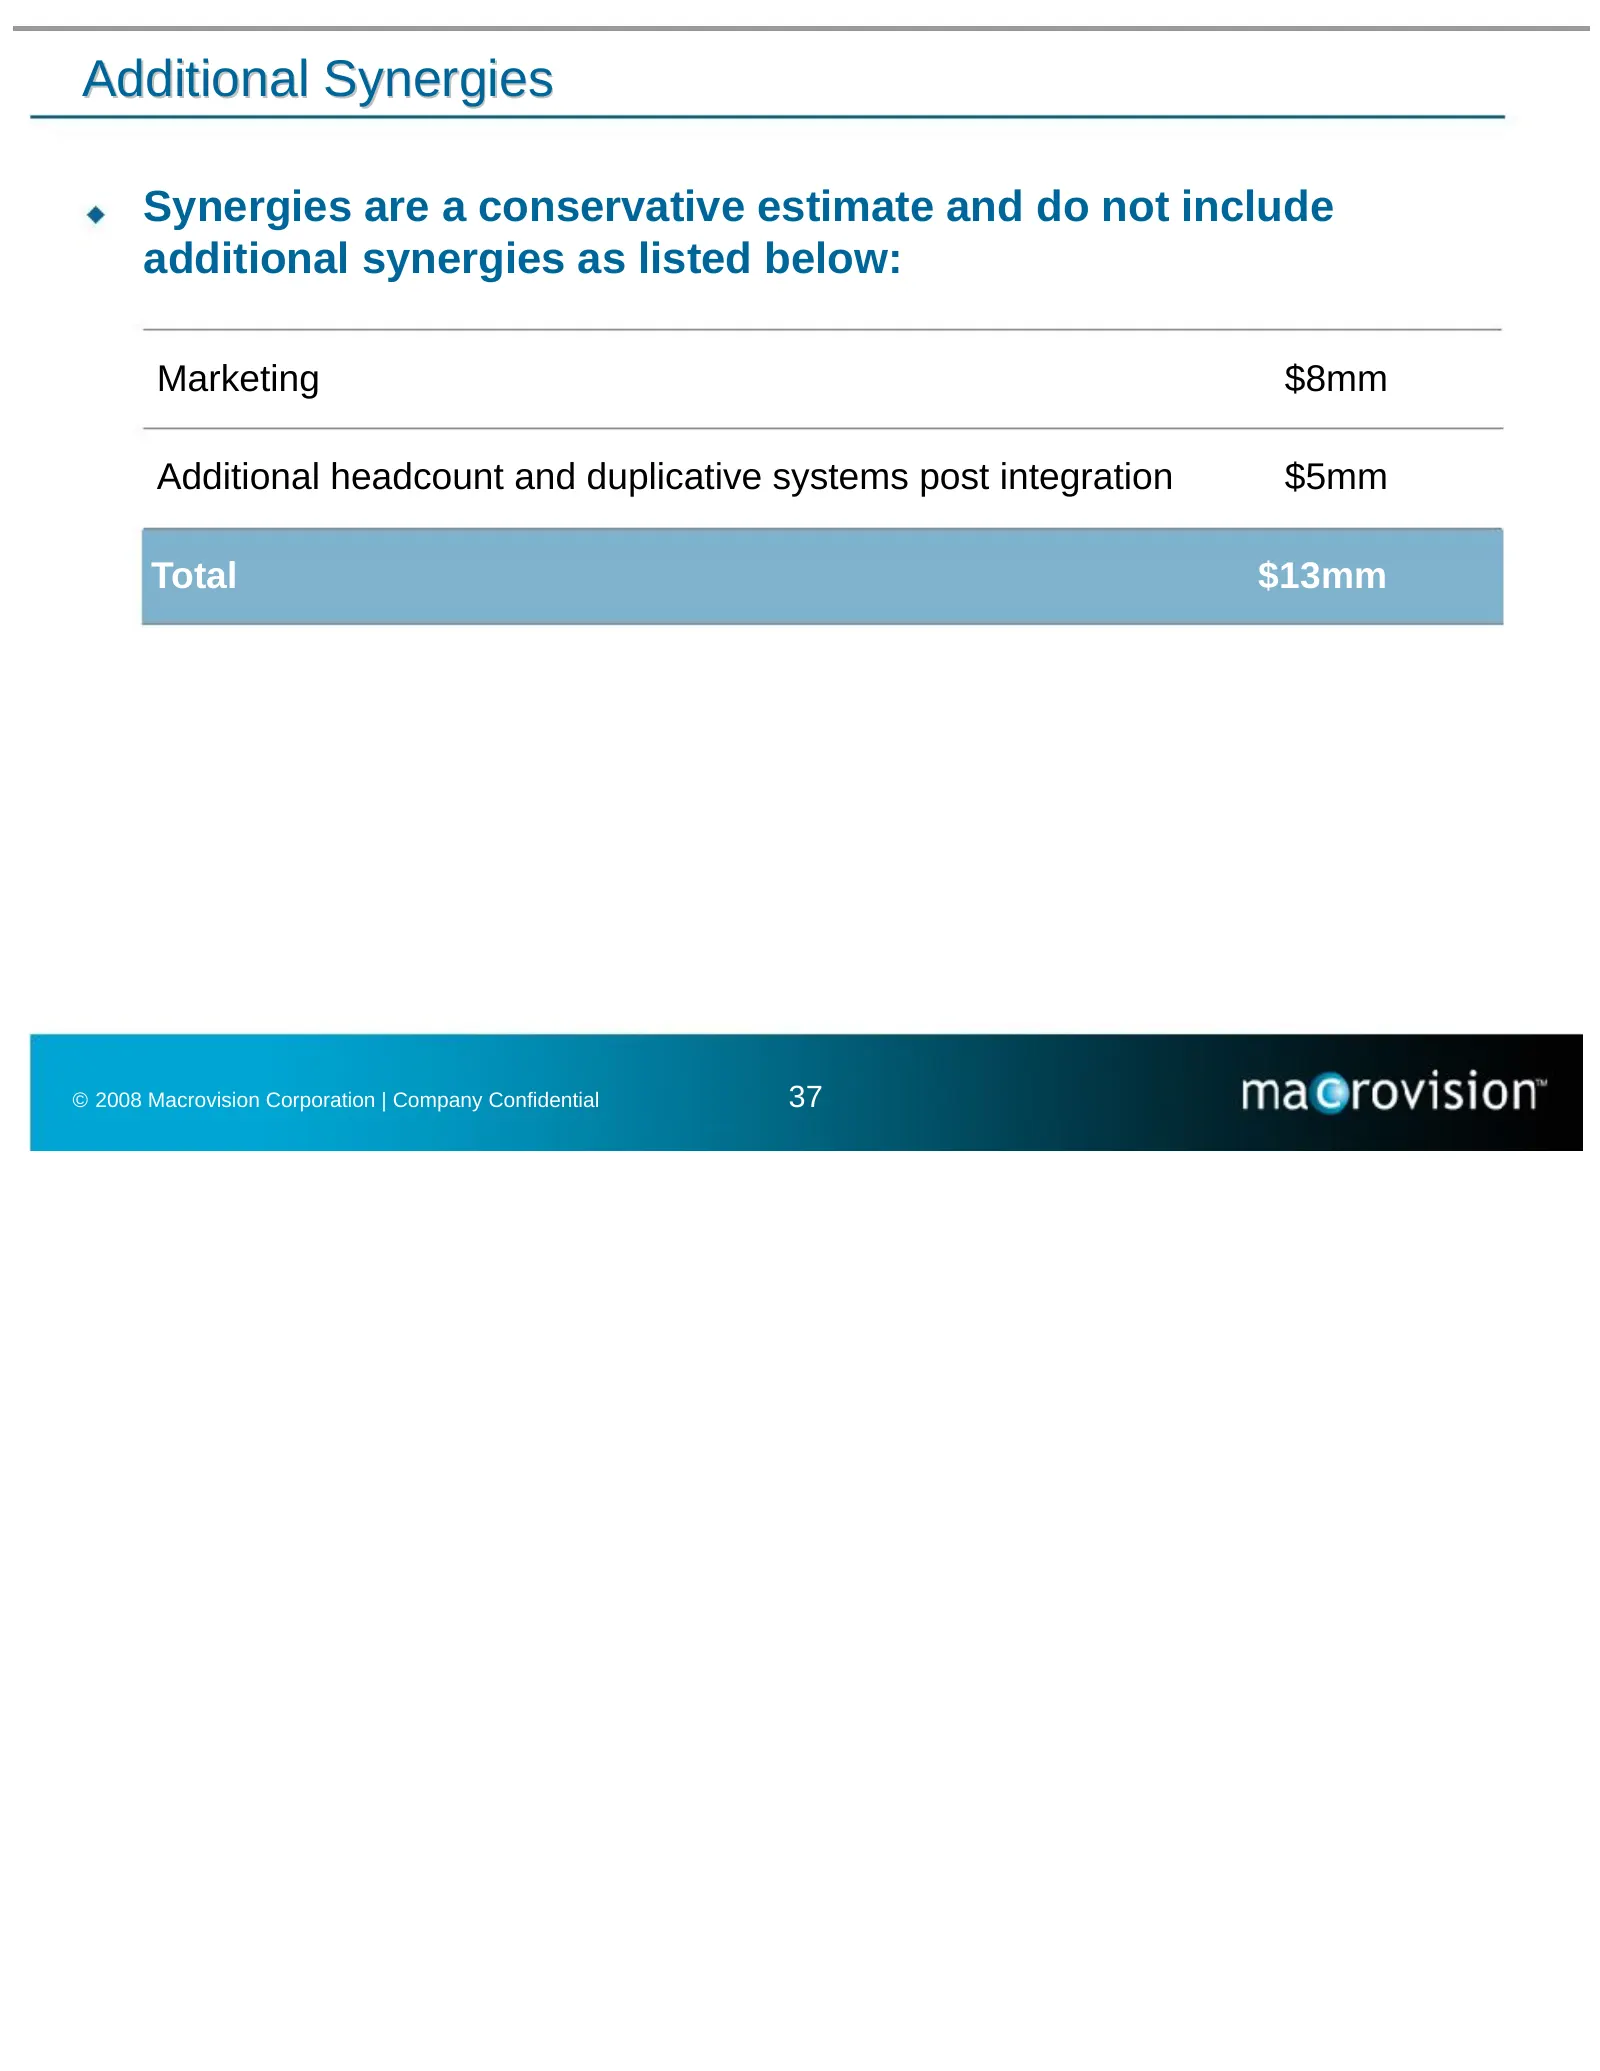
Slide 38: Additional Synergies
Additional Synergies Synergies are a conservative estimate and do not include additional synergies as listed below: Marketing $8mm Additional headcount and duplicative systems post integration $5mm Total $13mm © 2008 Macrovision Corporation | Company Confidential 37
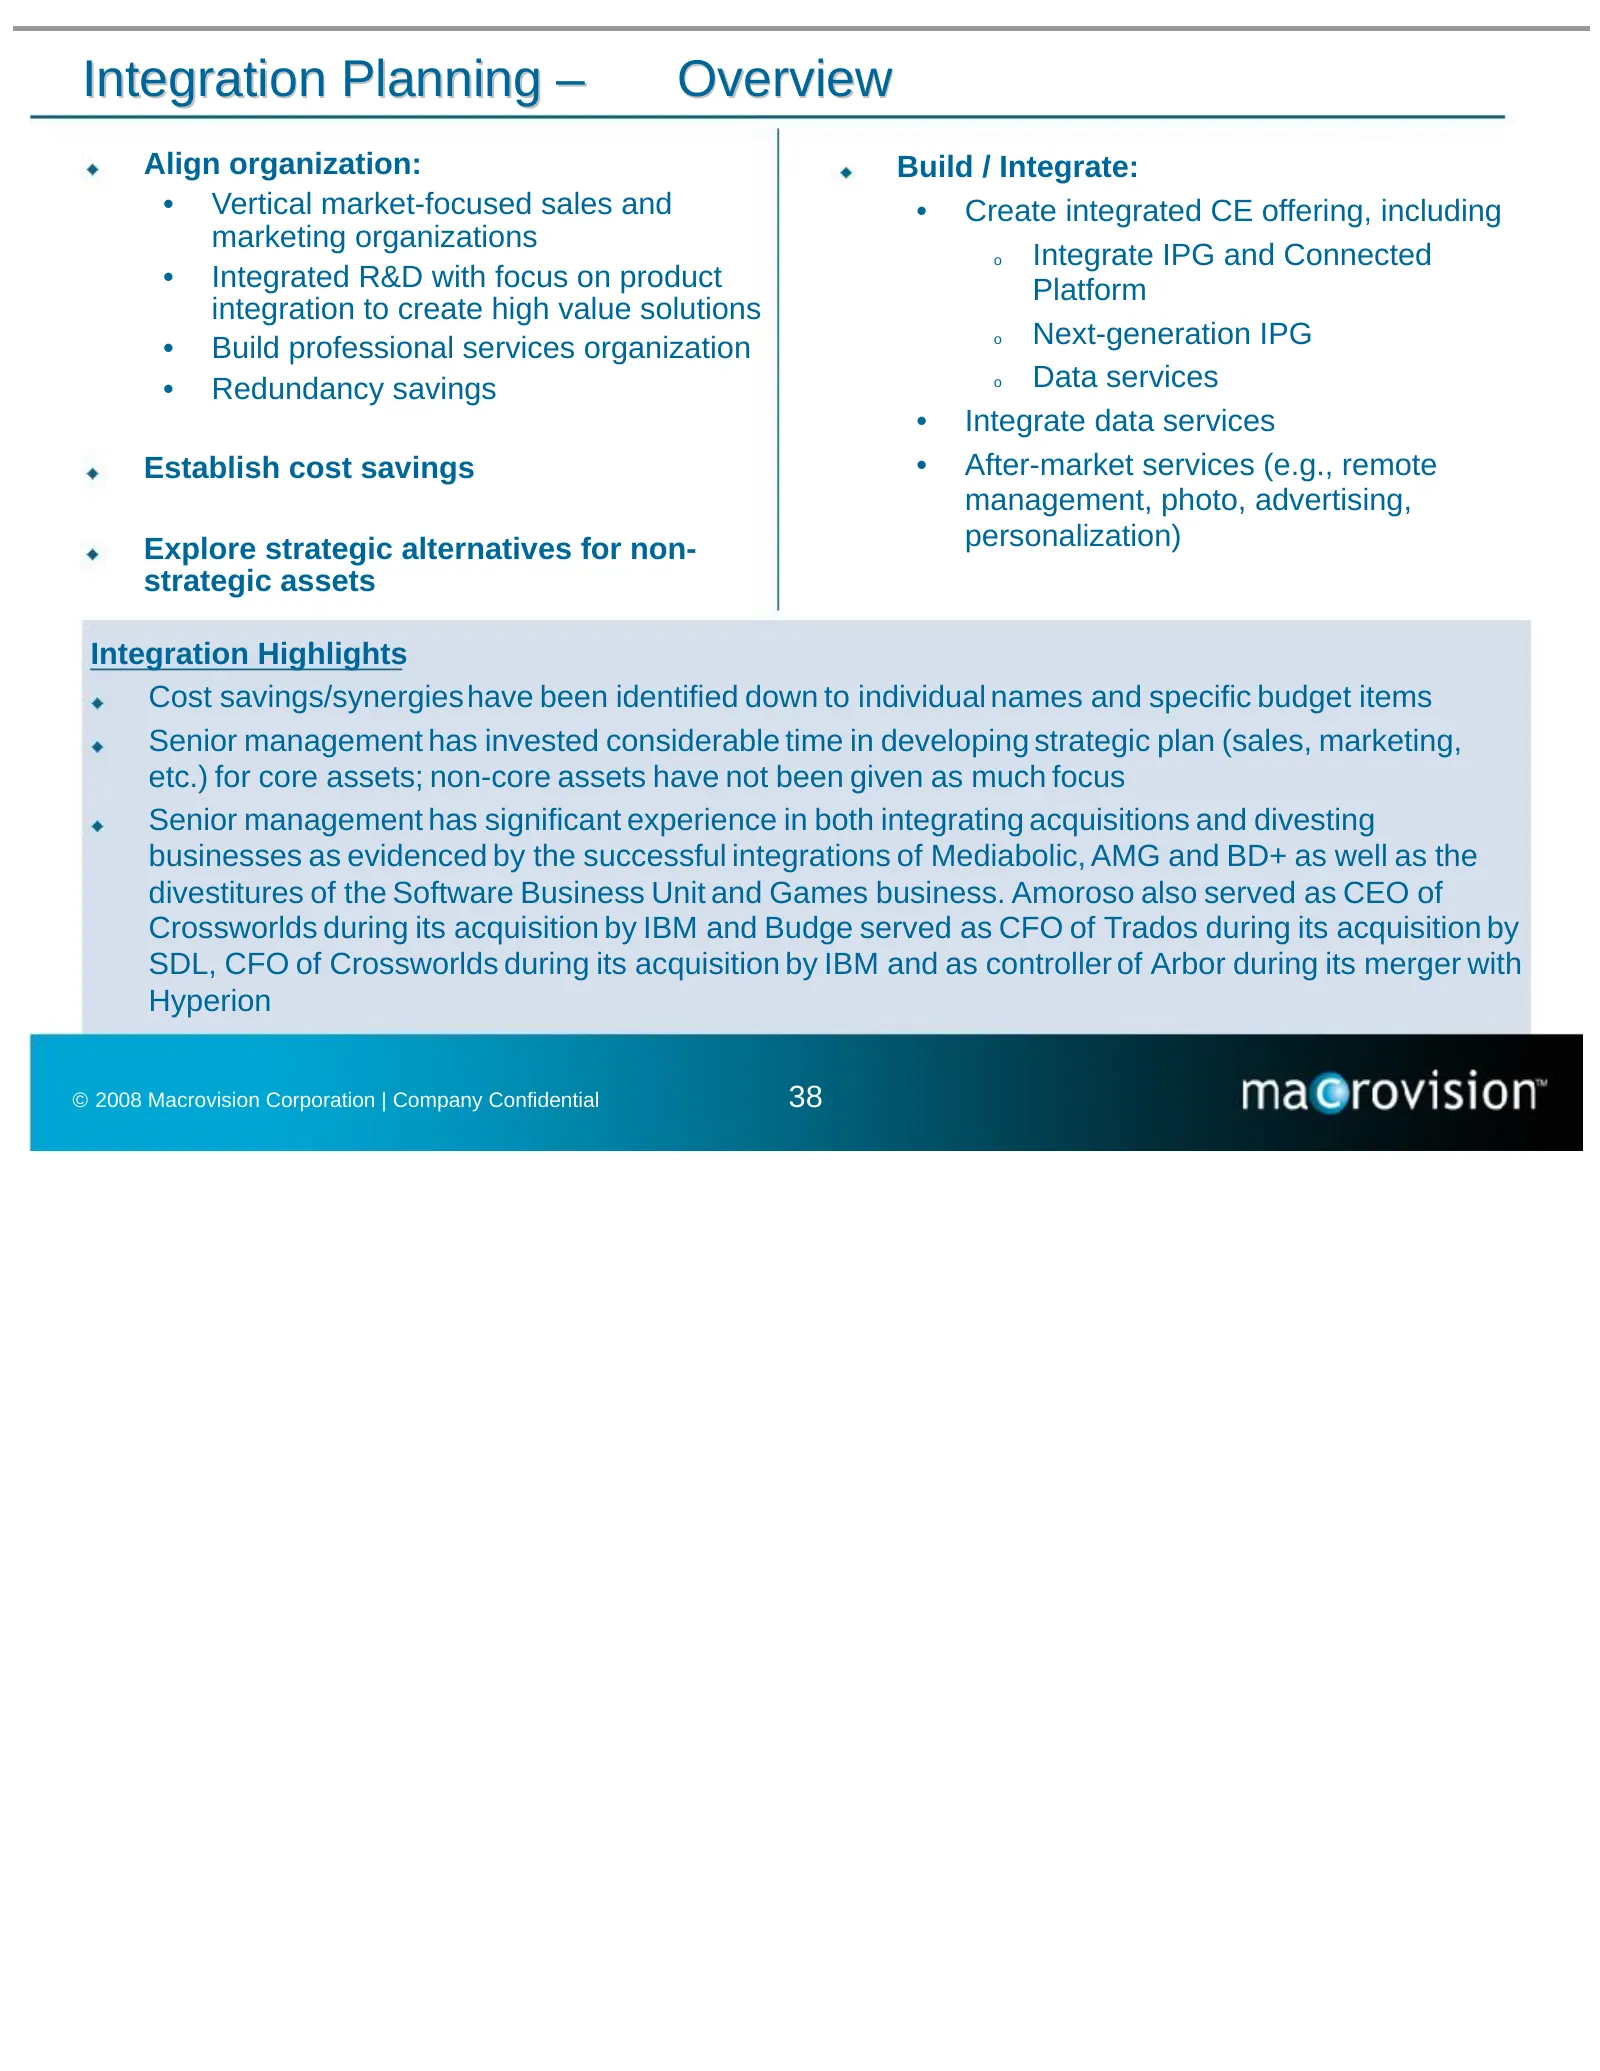
Slide 39: Integration Planning – Overview
Integration Planning – Overview Align organization: Build / Integrate: • Vertical market-focused sales and • Create integrated CE offering, including marketing organizations o Integrate IPG and Connected • Integrated R&D with focus on product Platform integration to create high value solutions • Bui
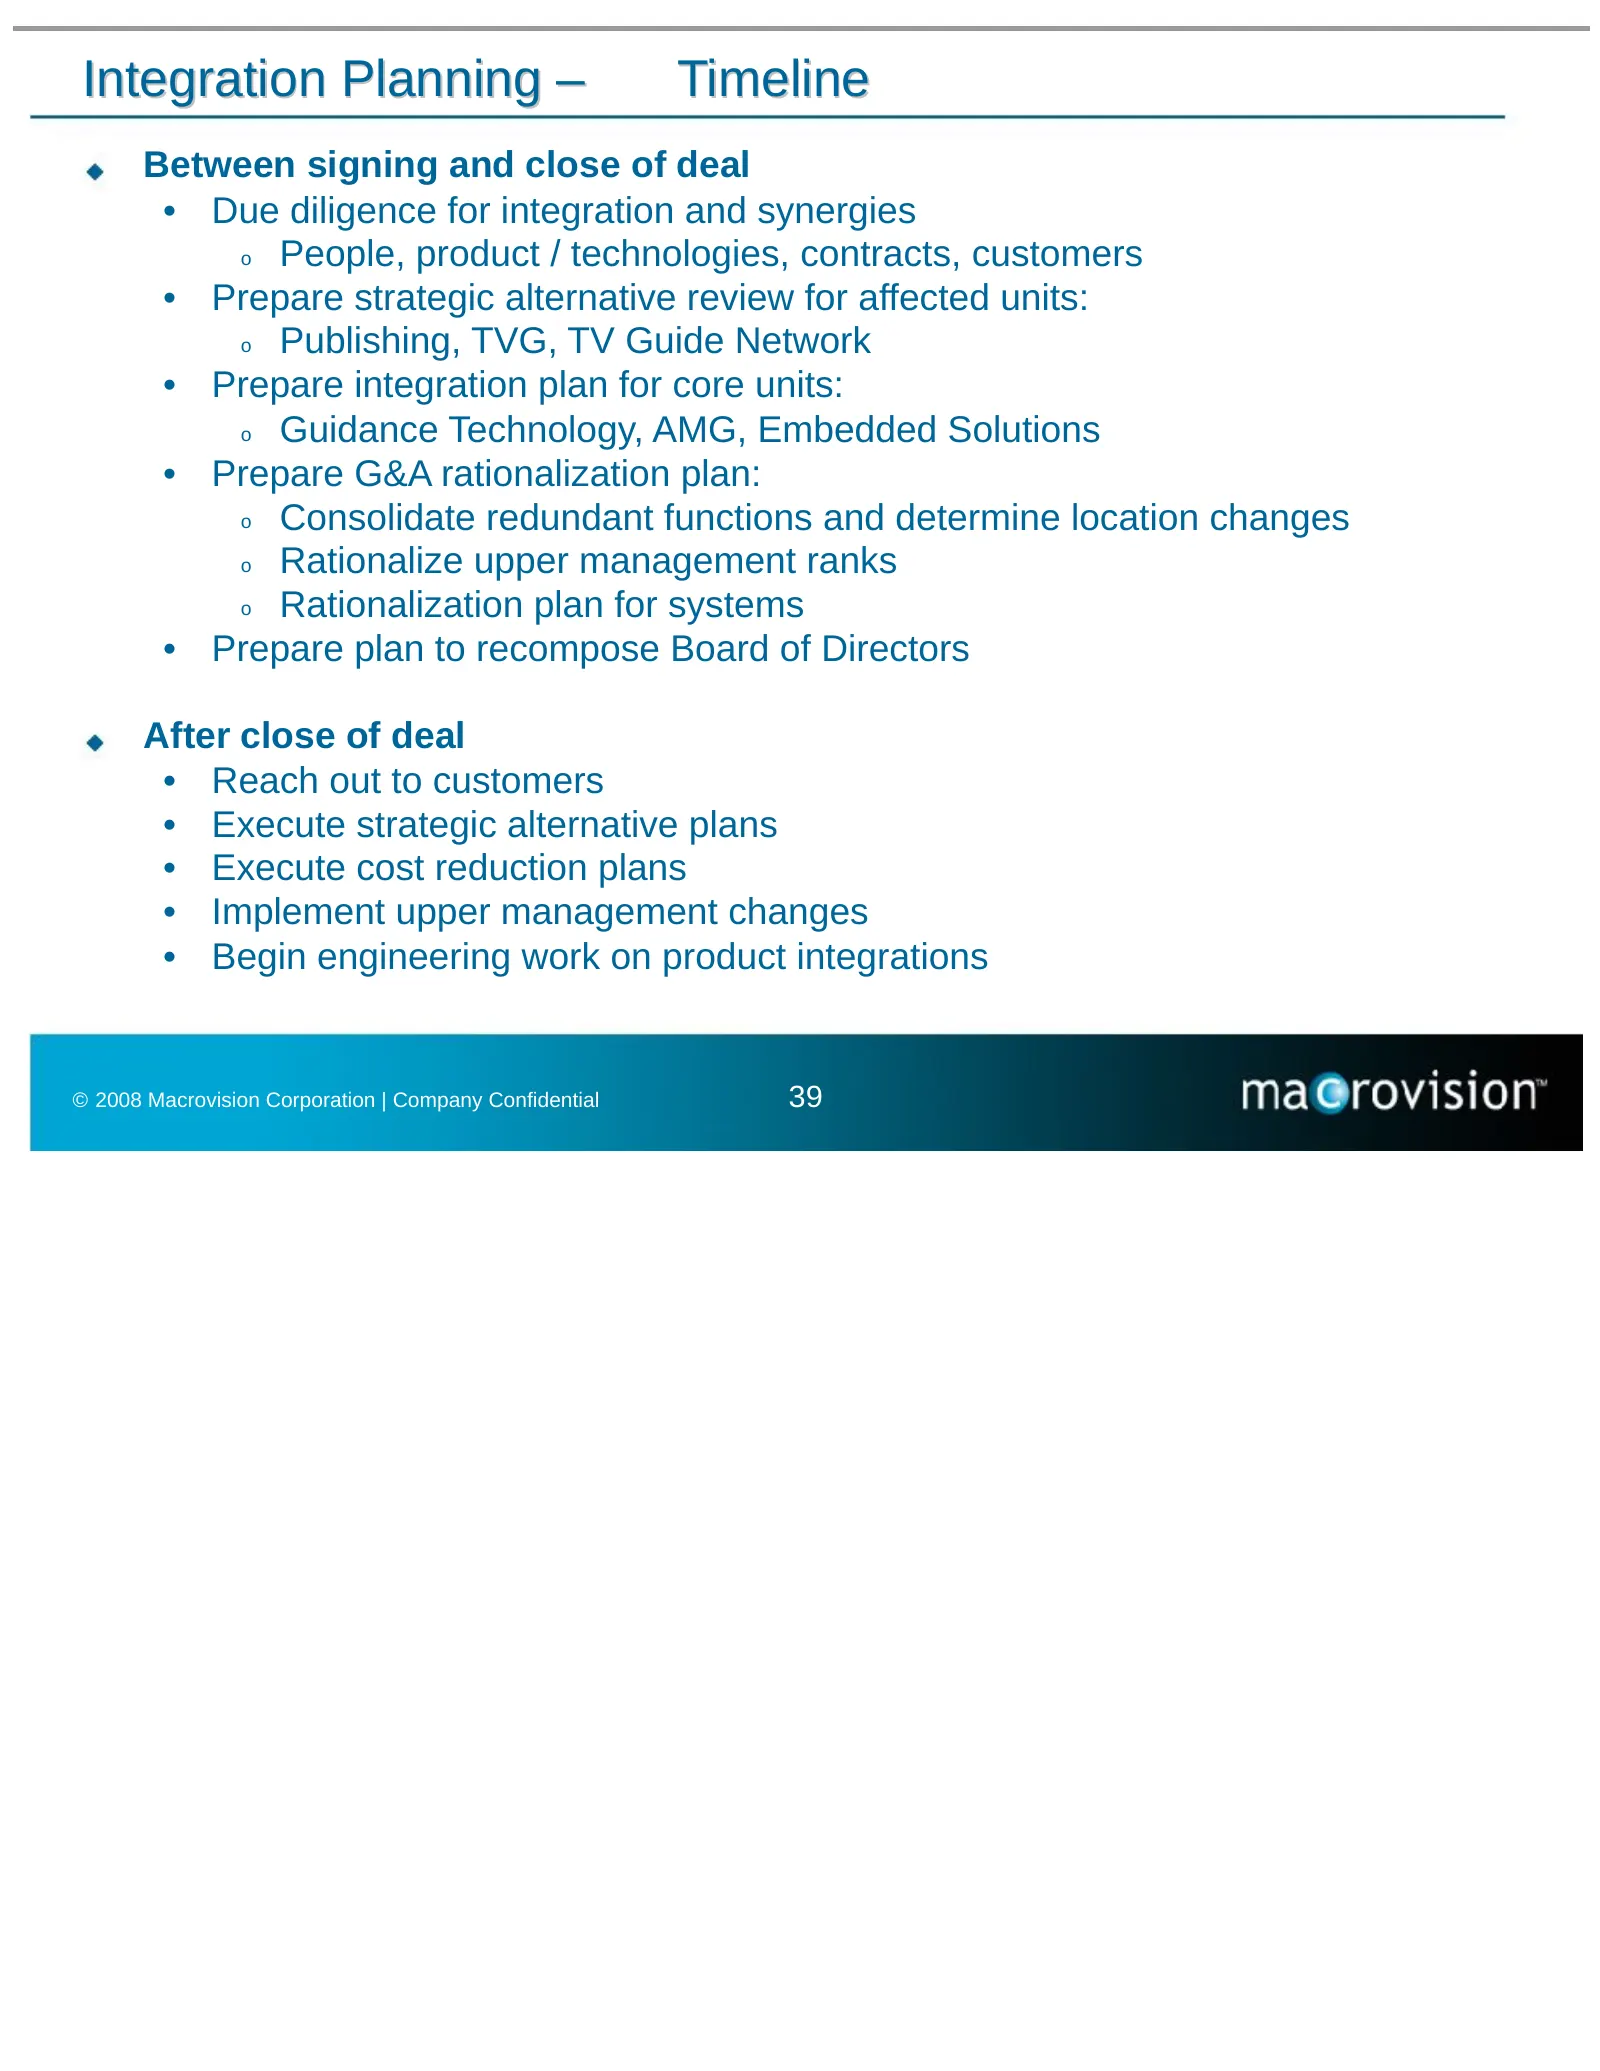
Slide 40: Integration Planning – Timeline
Integration Planning – Timeline Between signing and close of deal • Due diligence for integration and synergies o People, product / technologies, contracts, customers • Prepare strategic alternative review for affected units: o Publishing, TVG, TV Guide Network • Prepare integration plan for core un
Slide 41: Financial Overview
Financial Overview James Budge, CFO, Macrovision © 2008 Macrovision Corporation | Company Confidential 40
Slide 42: Macrovision Standalone Historical Financials
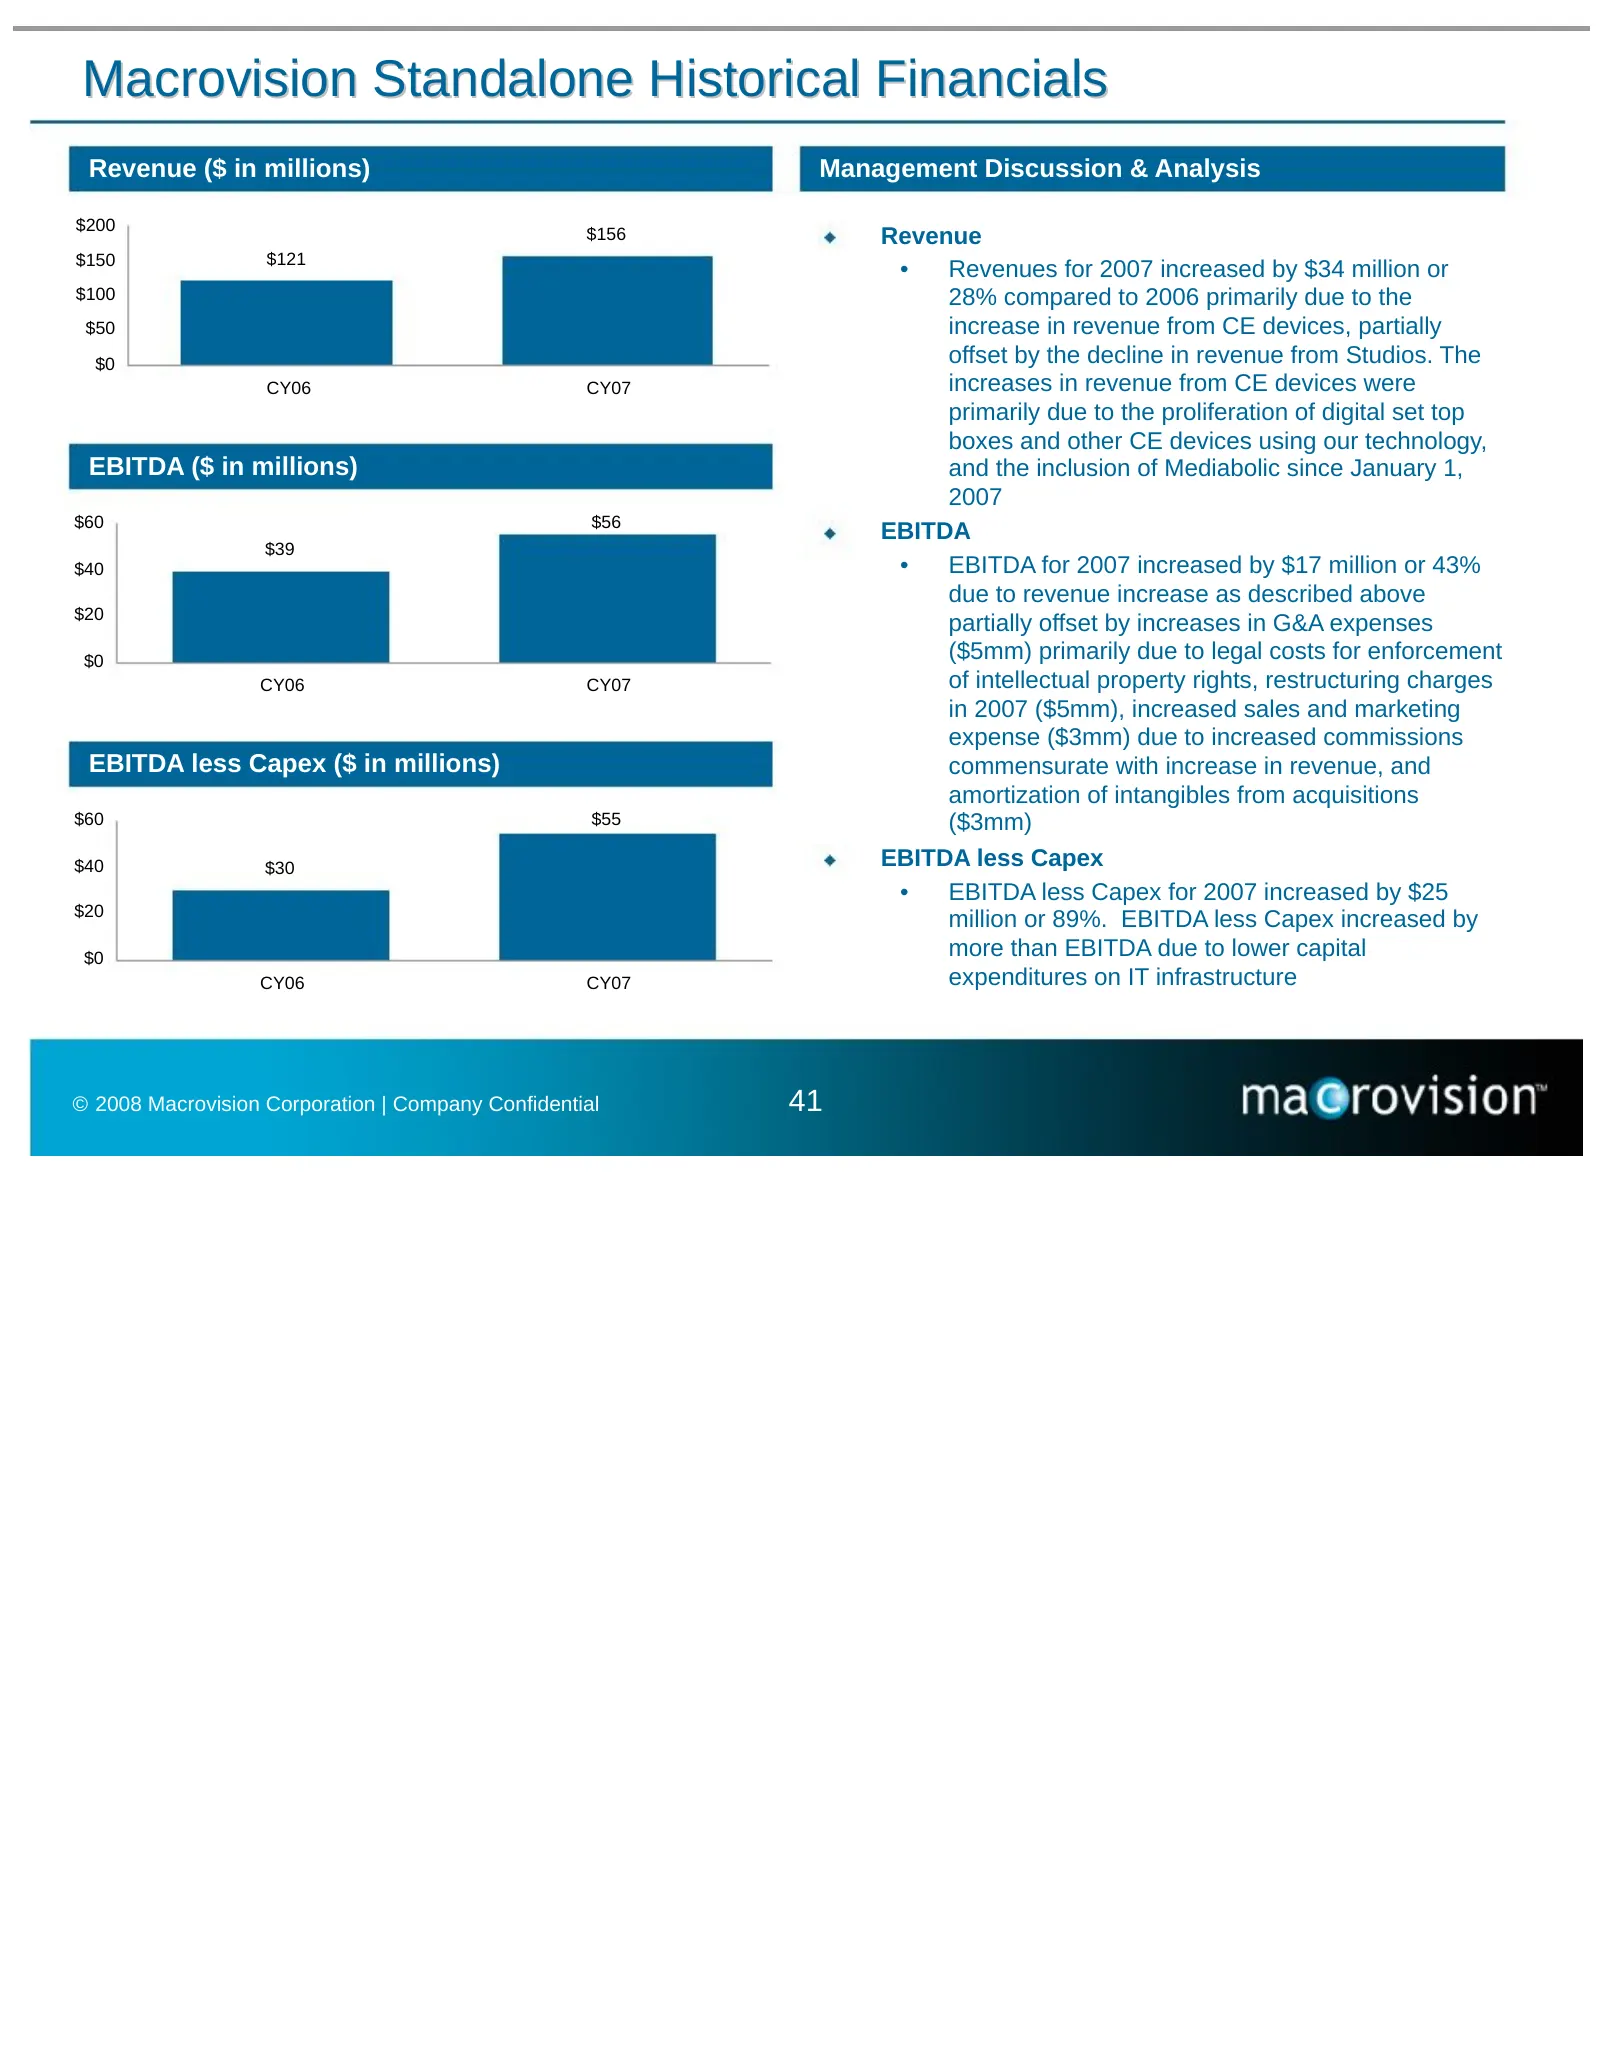
Macrovision Standalone Historical Financials Revenue ($ in millions) Management Discussion & Analysis $200 $156 Revenue $150 $121 • Revenues for 2007 increased by $34 million or $100 28% compared to 2006 primarily due to the $50 increase in revenue from CE devices, partially $0 offset by the decline
Slide 43: Gemstar Standalone Historical Financials
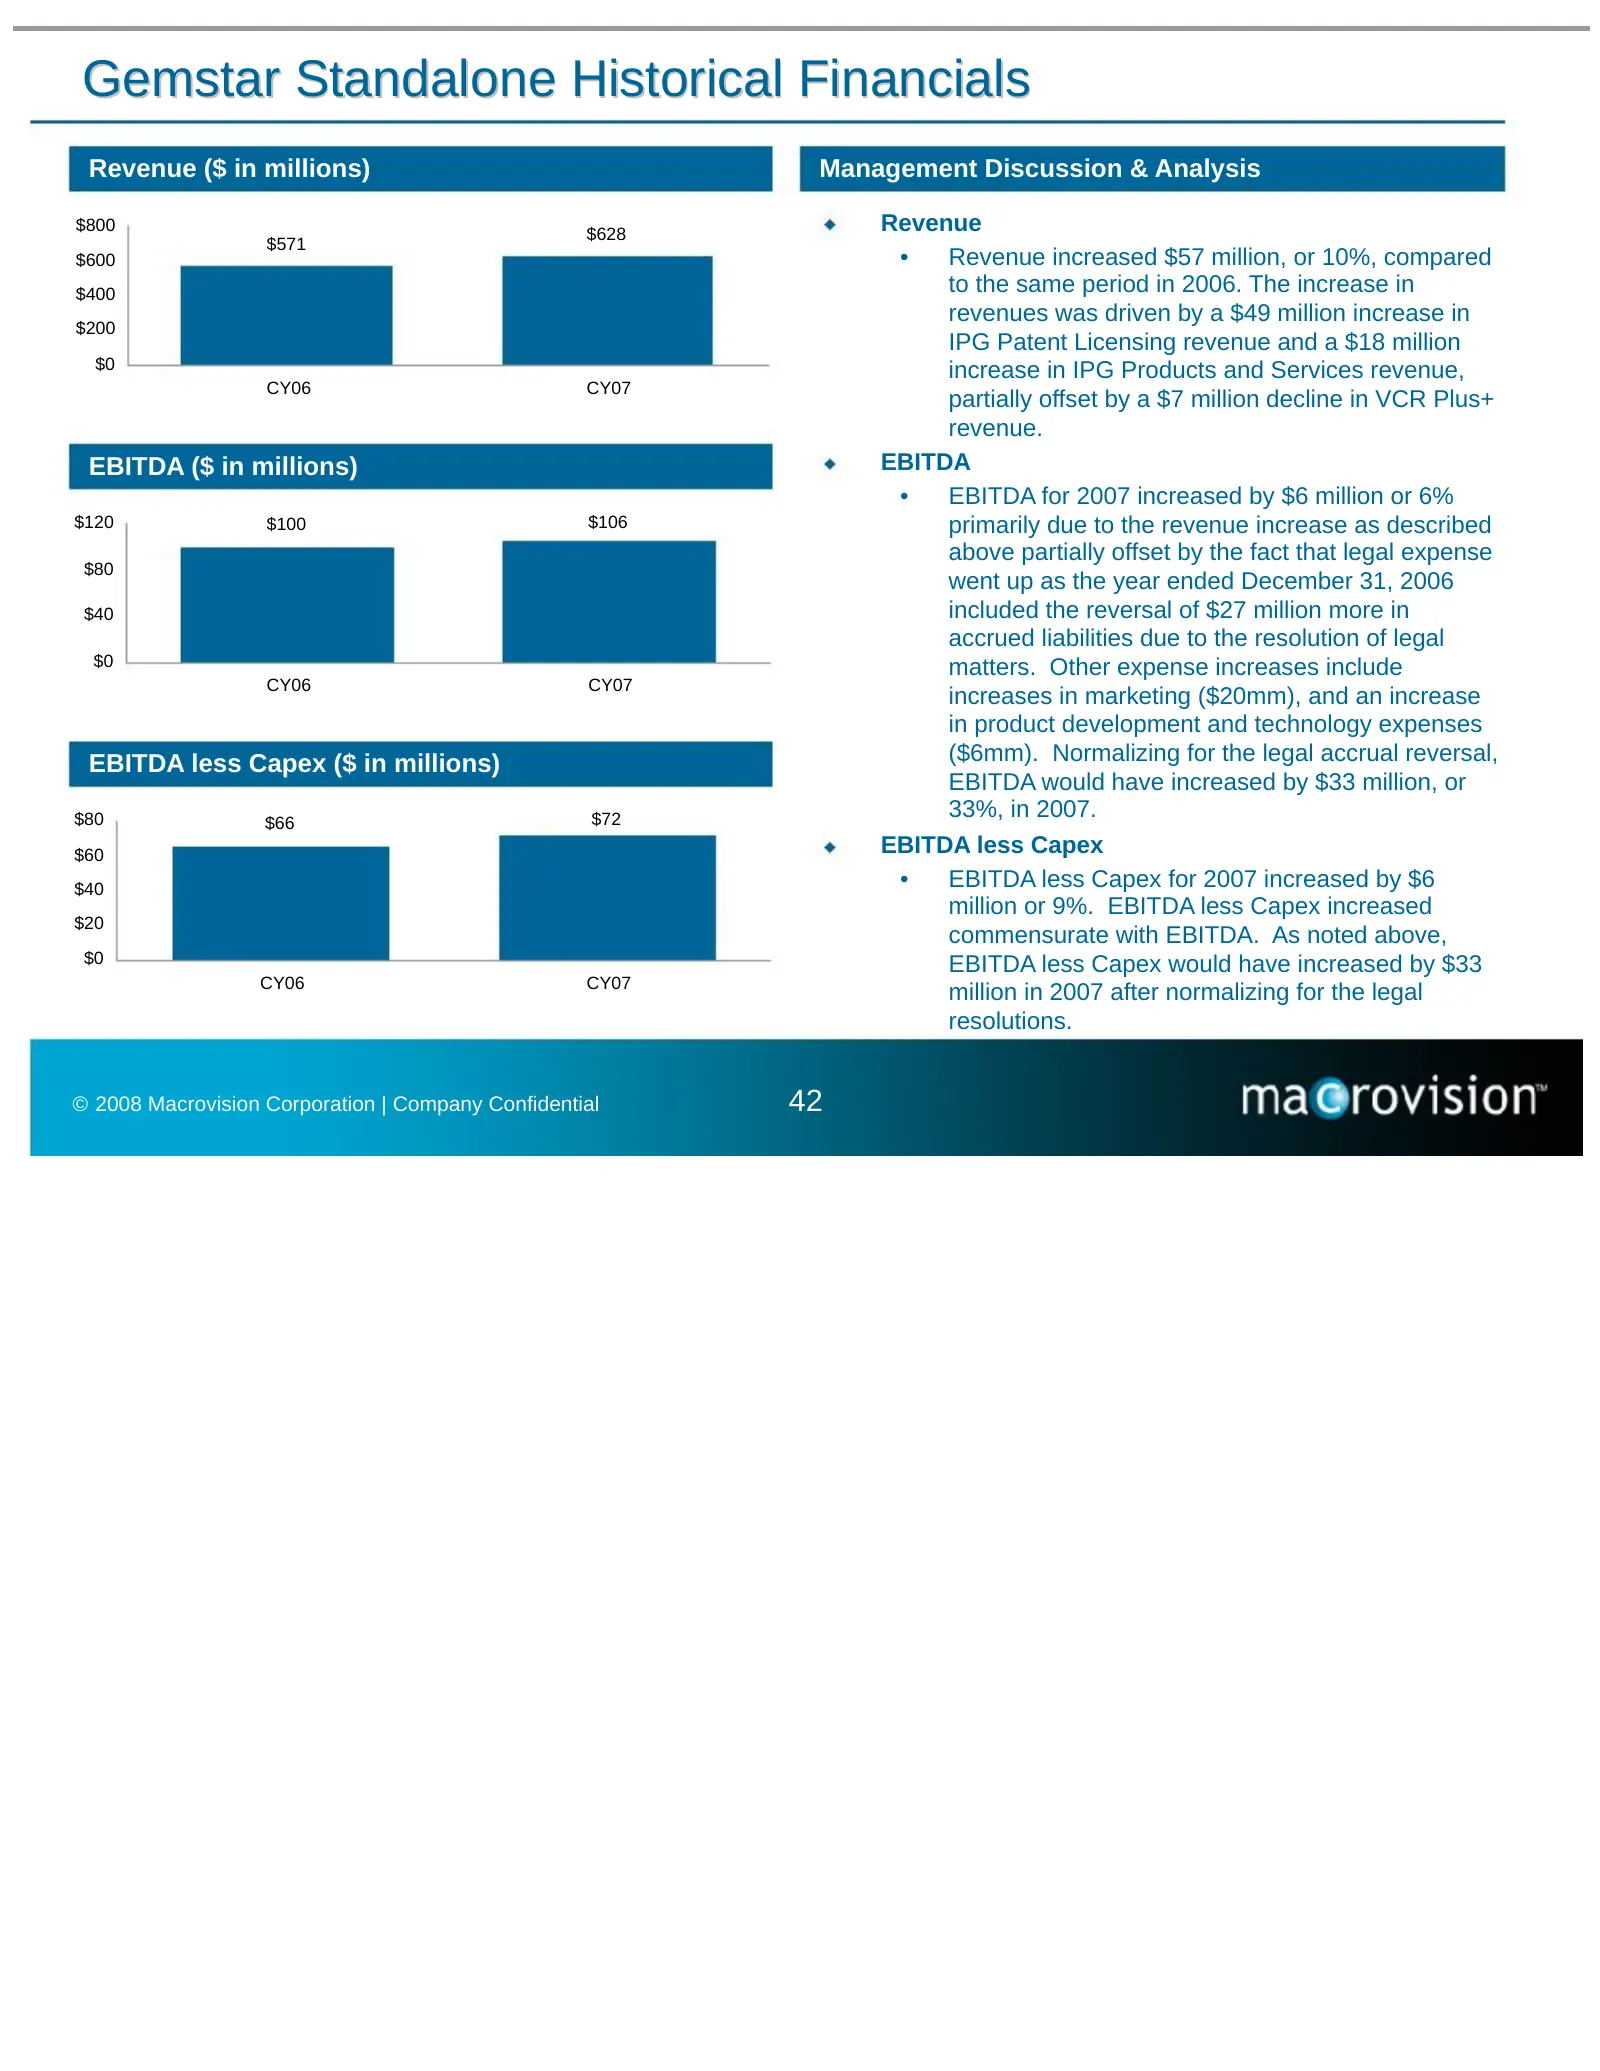
Gemstar Standalone Historical Financials Revenue ($ in millions) Management Discussion & Analysis $800 $628 Revenue $571 $600 • Revenue increased $57 million, or 10%, compared $400 to the same period in 2006. The increase in revenues was driven by a $49 million increase in $200 IPG Patent Licensing
Slide 44: Reconciliation of GAAP Income from Continuing Operations to EBITDA
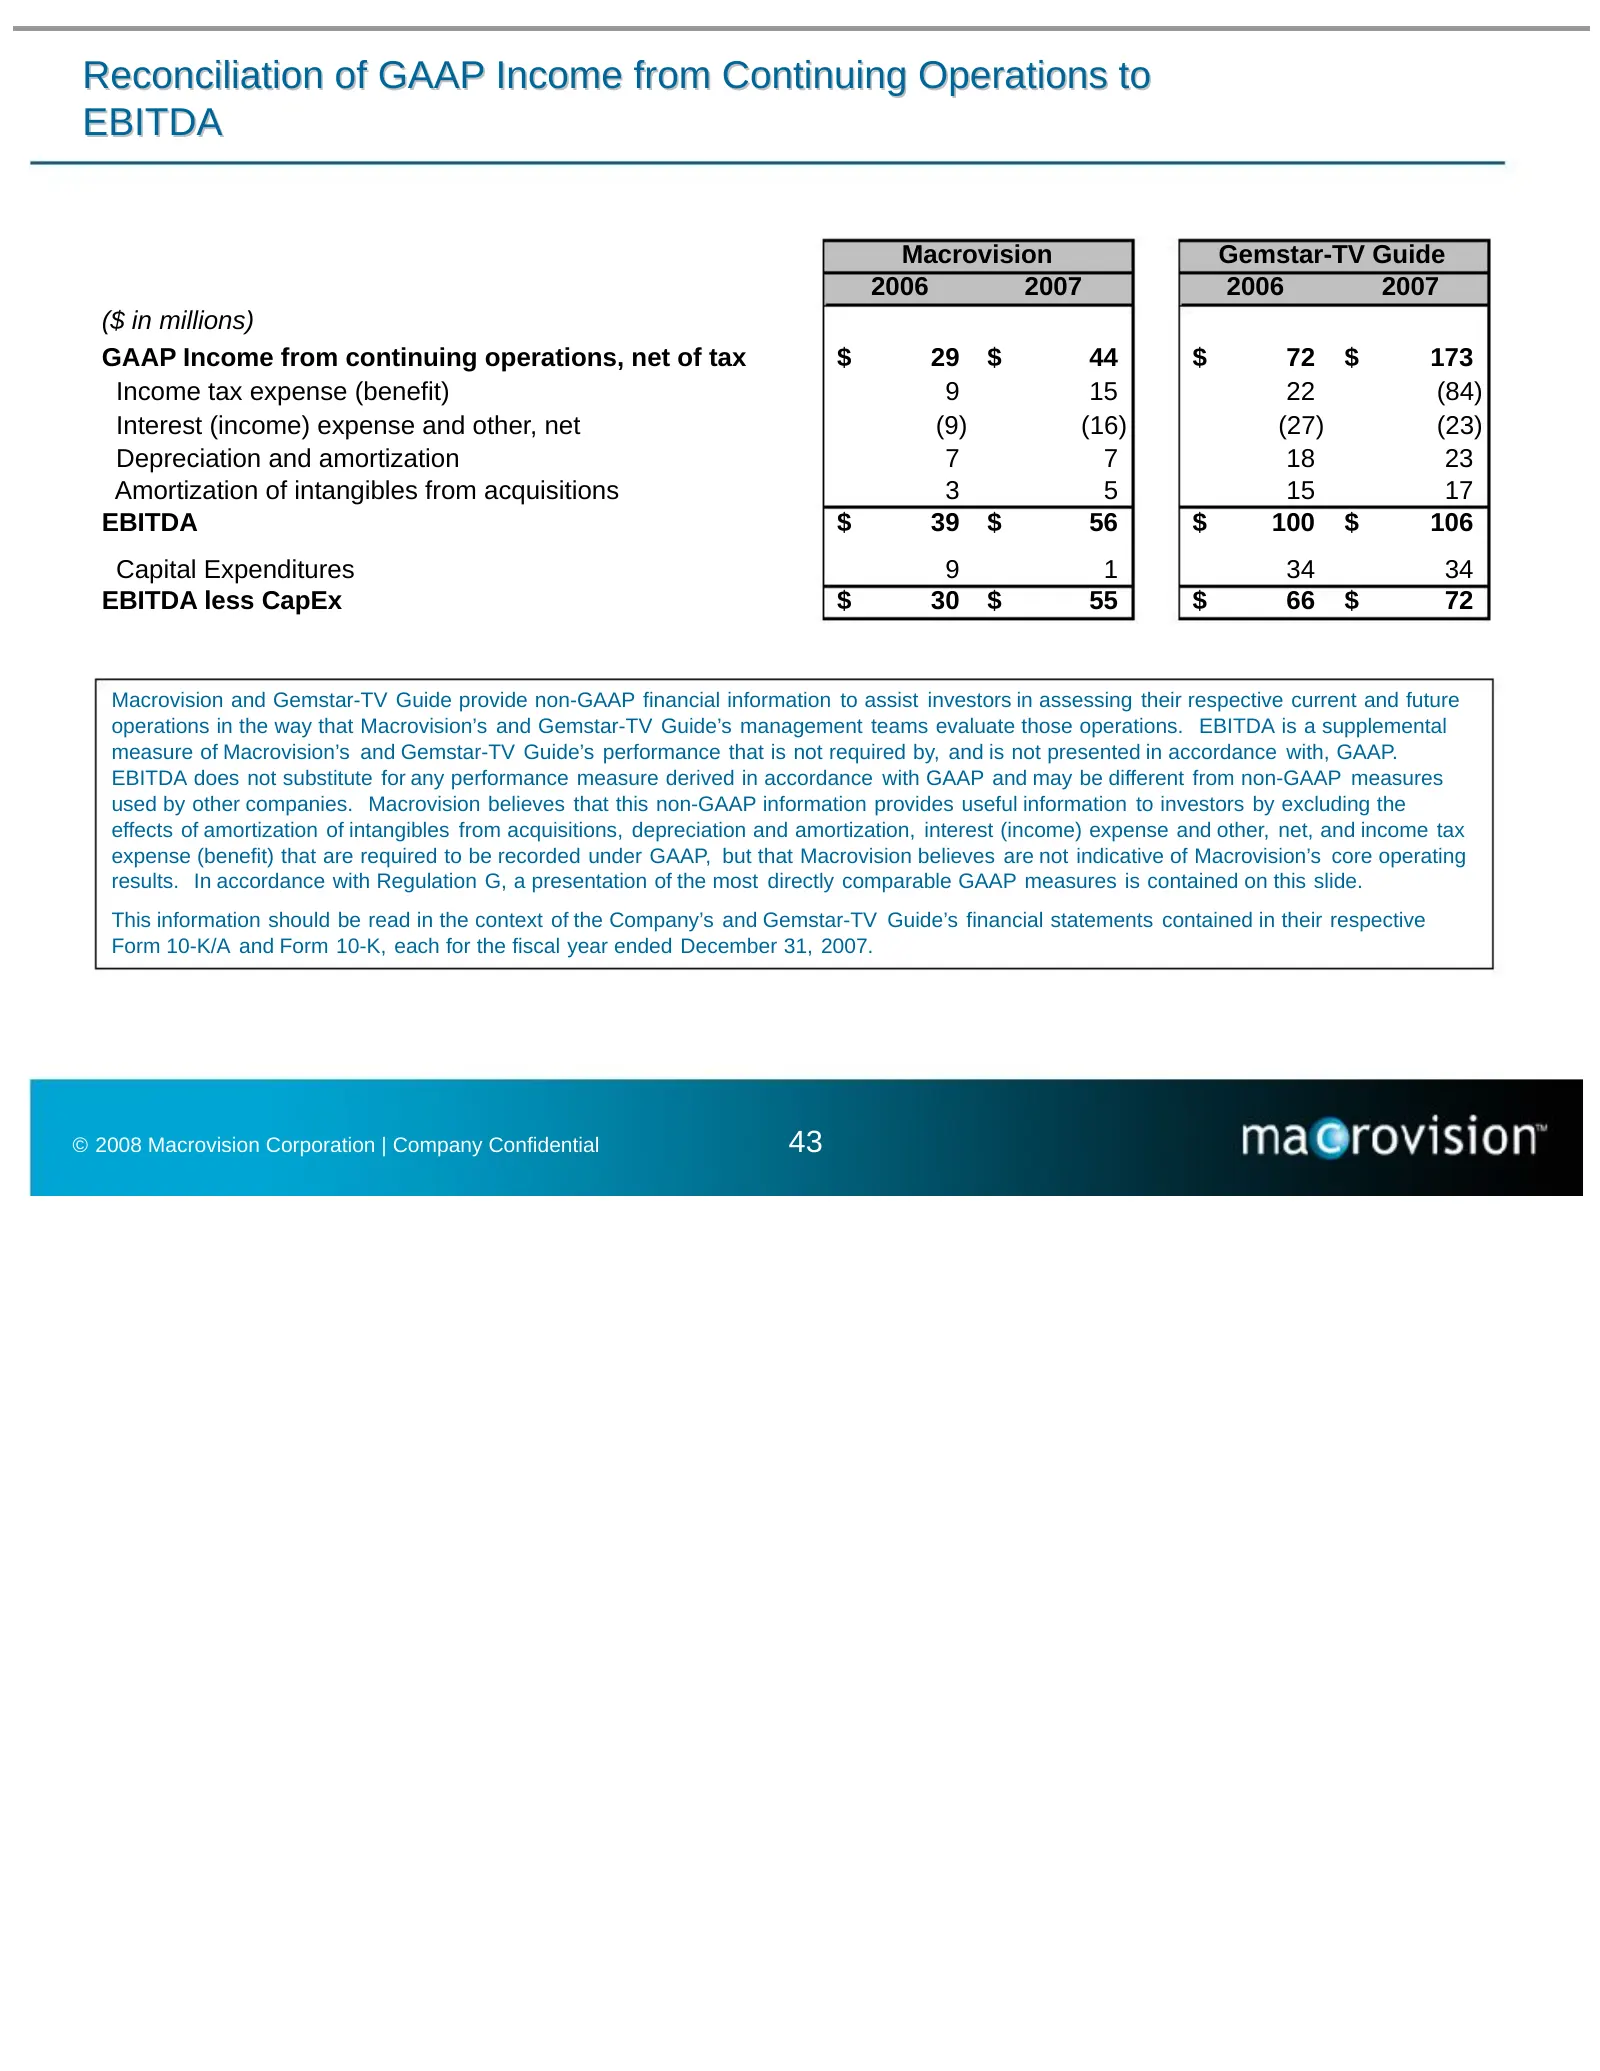
Reconciliation of GAAP Income from Continuing Operations to EBITDA Macrovision Gemstar-TV Guide 2006 2007 2006 2007 ($ in millions) GAAP Income from continuing operations, net of tax $ 29 $ 44 $ 72 $ 173 Income tax expense (benefit) 9 15 22 (84) Interest (income) expense and other, net (9) (16) (27)
Slide 45: Pro Forma Historical Financials
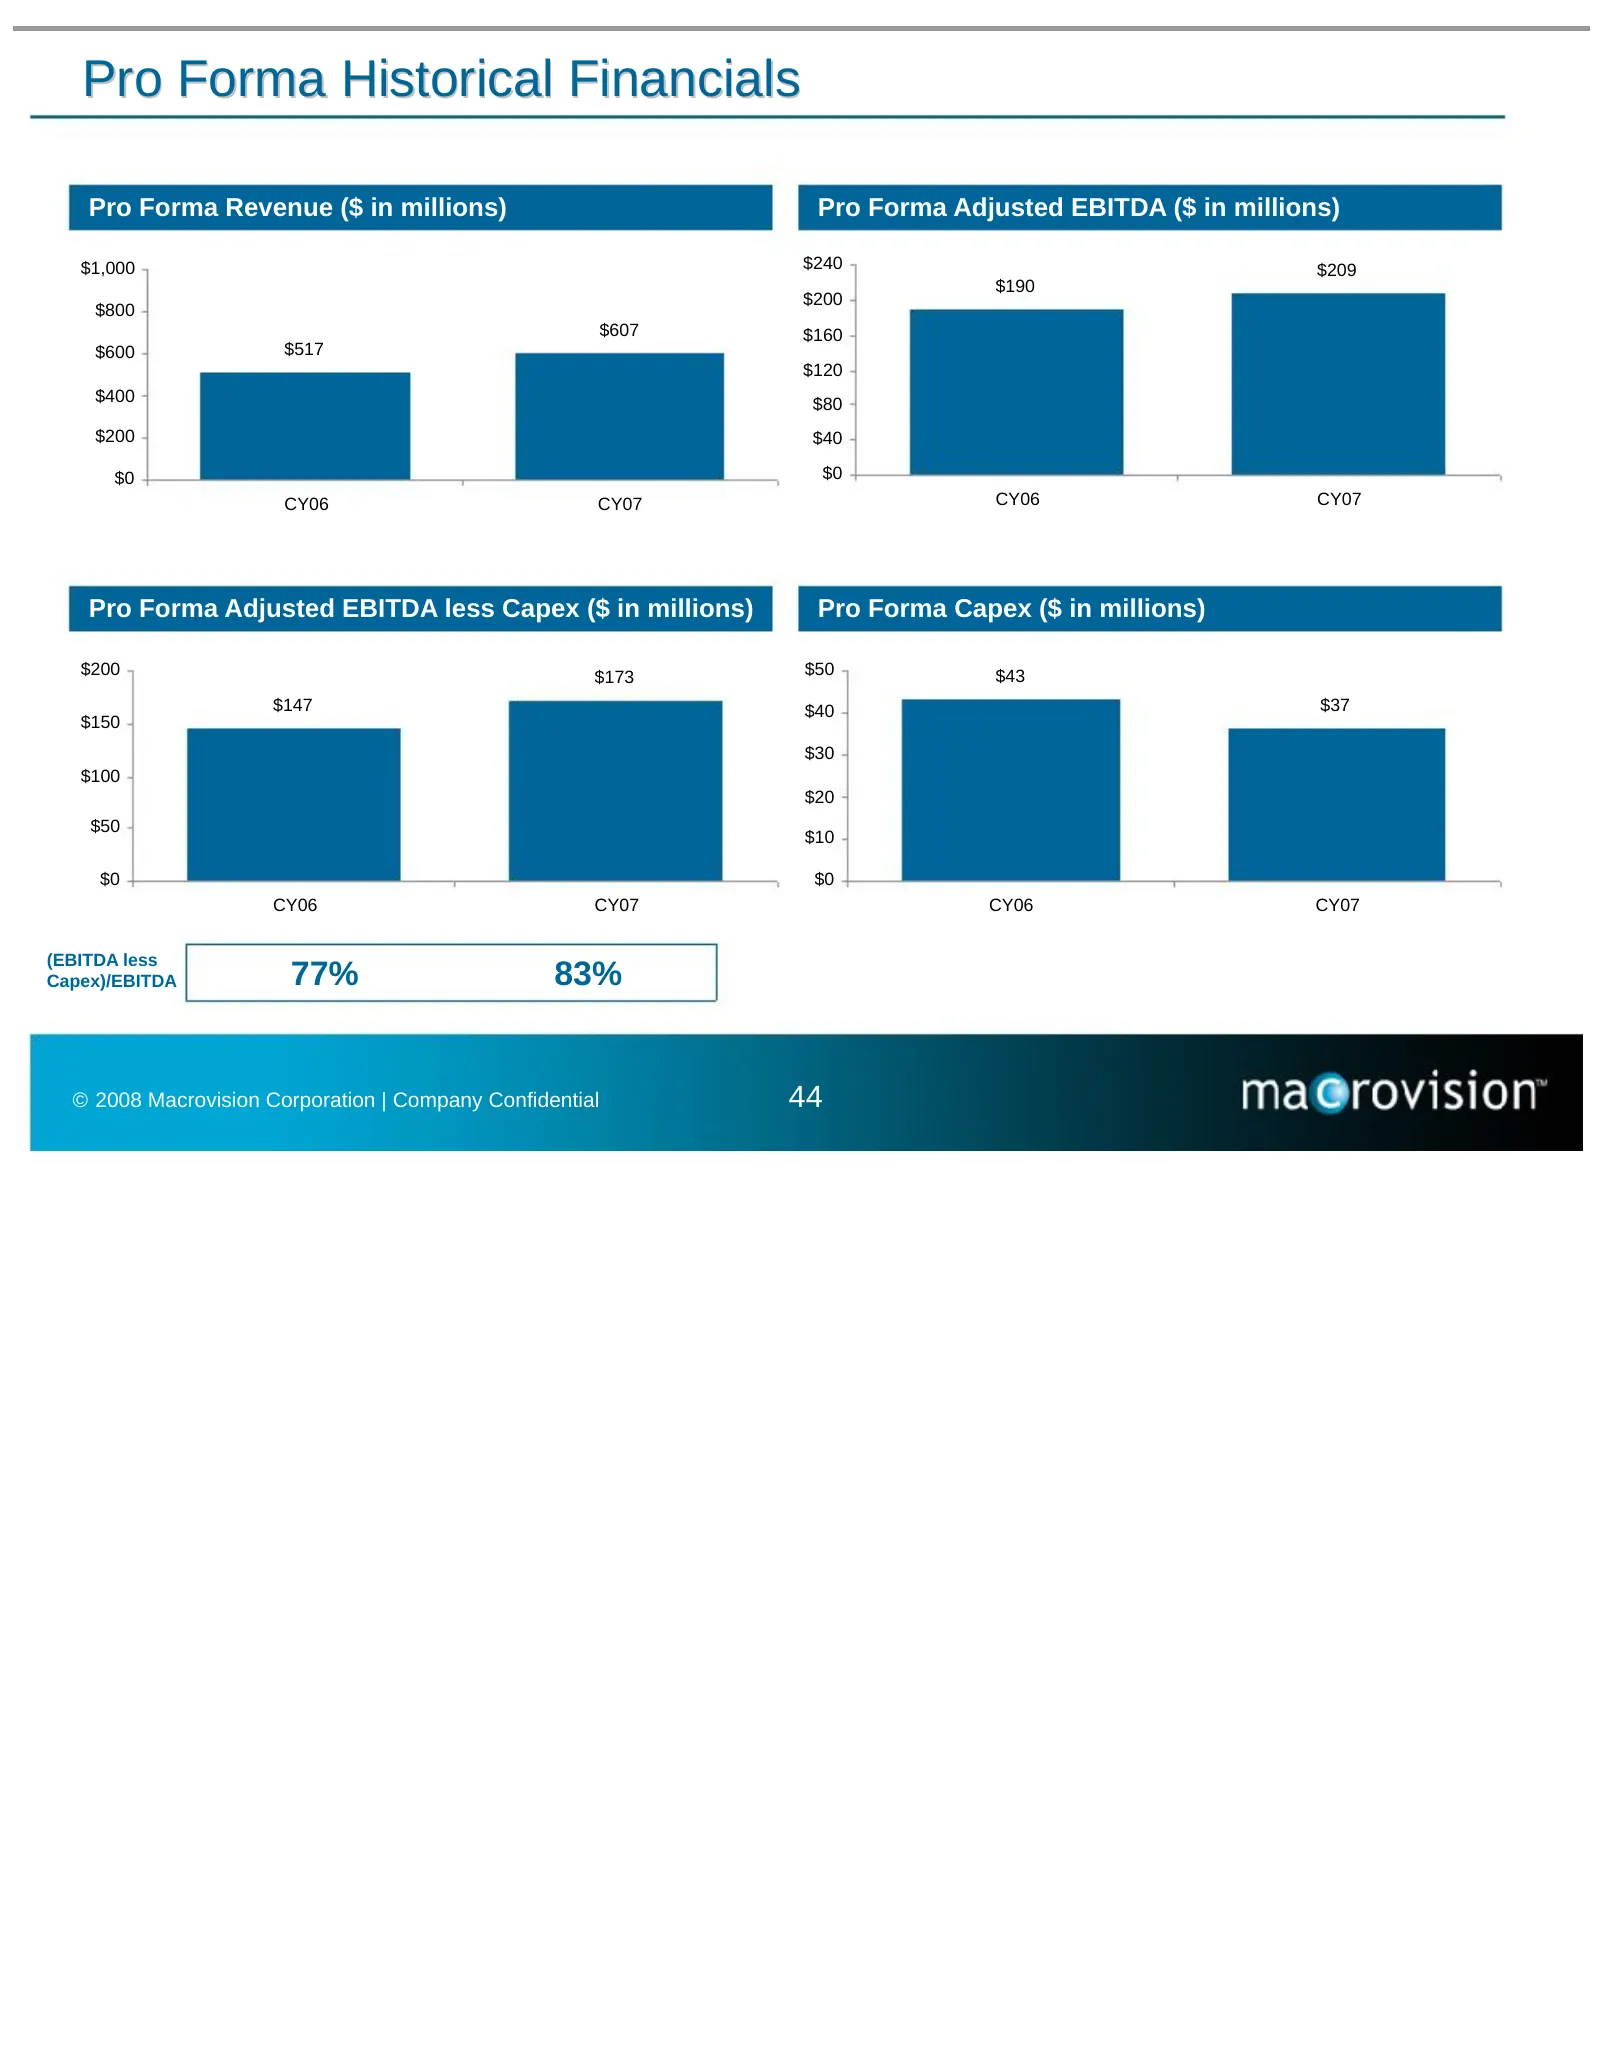
Pro Forma Historical Financials Pro Forma Revenue ($ in millions) Pro Forma Adjusted EBITDA ($ in millions) $1,000 $240 $209 $190 $200 $800 $607 $160 $600 $517 $120 $400 $80 $200 $40 $0 $0 CY06 CY07 CY06 CY07 Pro Forma Adjusted EBITDA less Capex ($ in millions) Pro Forma Capex ($ in millions) $200 $
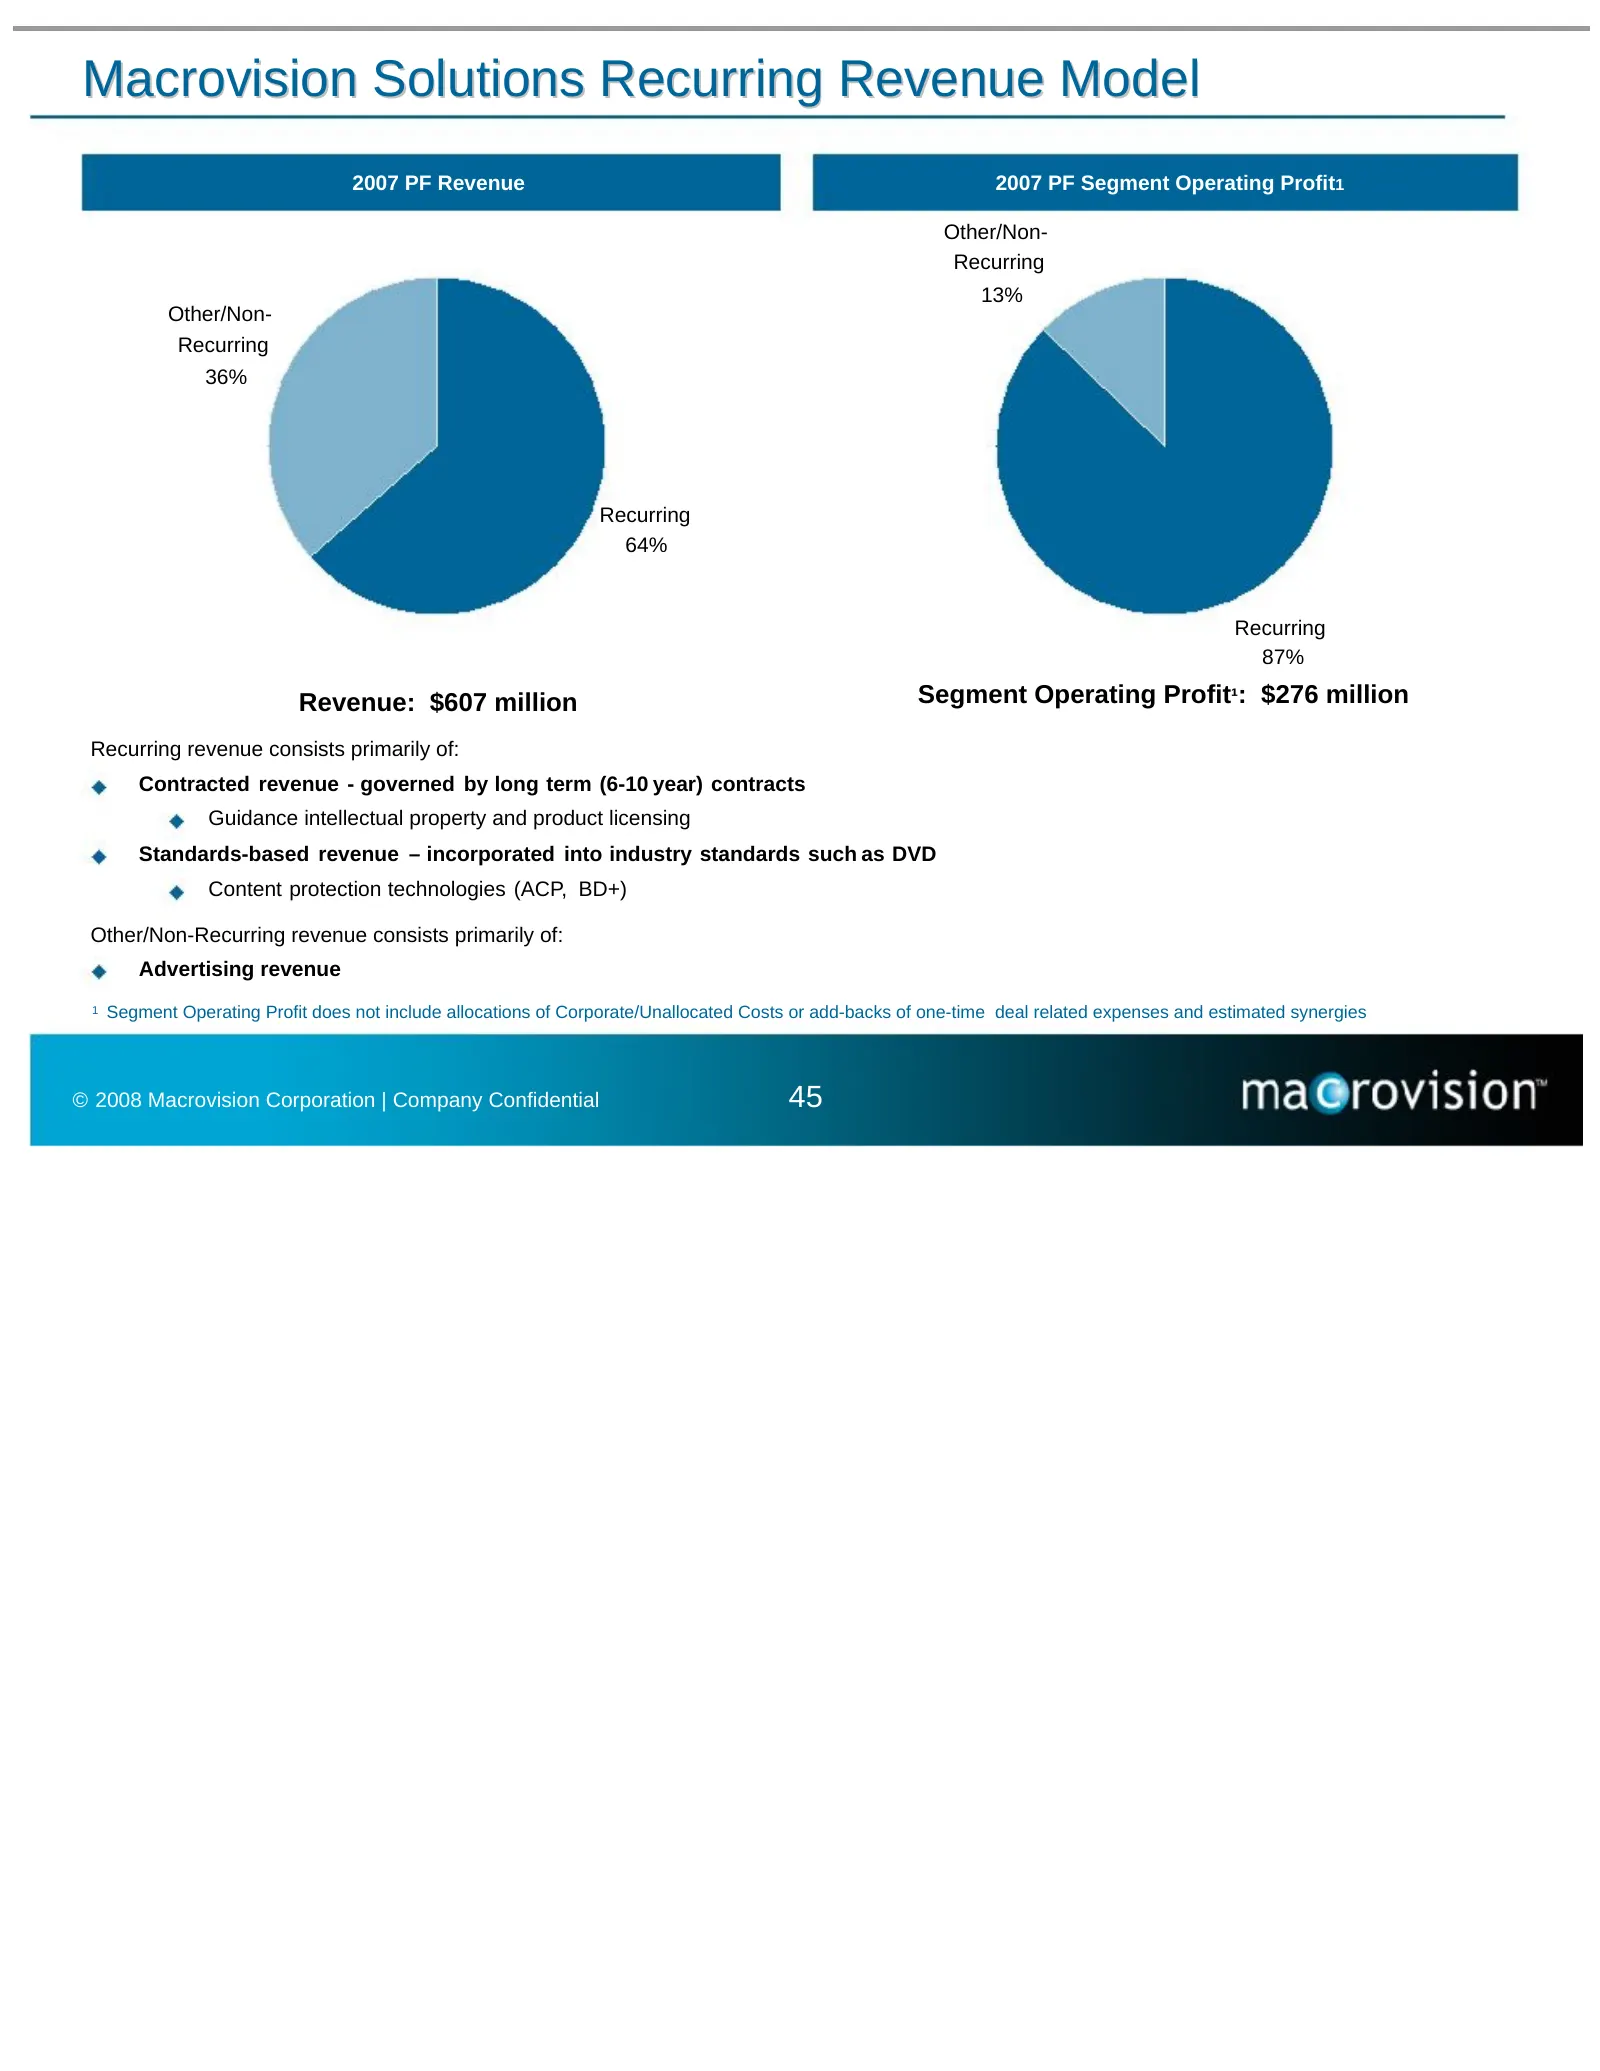
Slide 46: Macrovision Solutions Recurring Revenue Model
Macrovision Solutions Recurring Revenue Model 2007 PF Revenue 2007 PF Segment Operating Profit1 Other/Non- Recurring 13% Other/Non- Recurring 36% Recurring 64% Recurring 87% Revenue: $607 million Segment Operating Profit¹: $276 million Recurring revenue consists primarily of: Contracted revenue - go
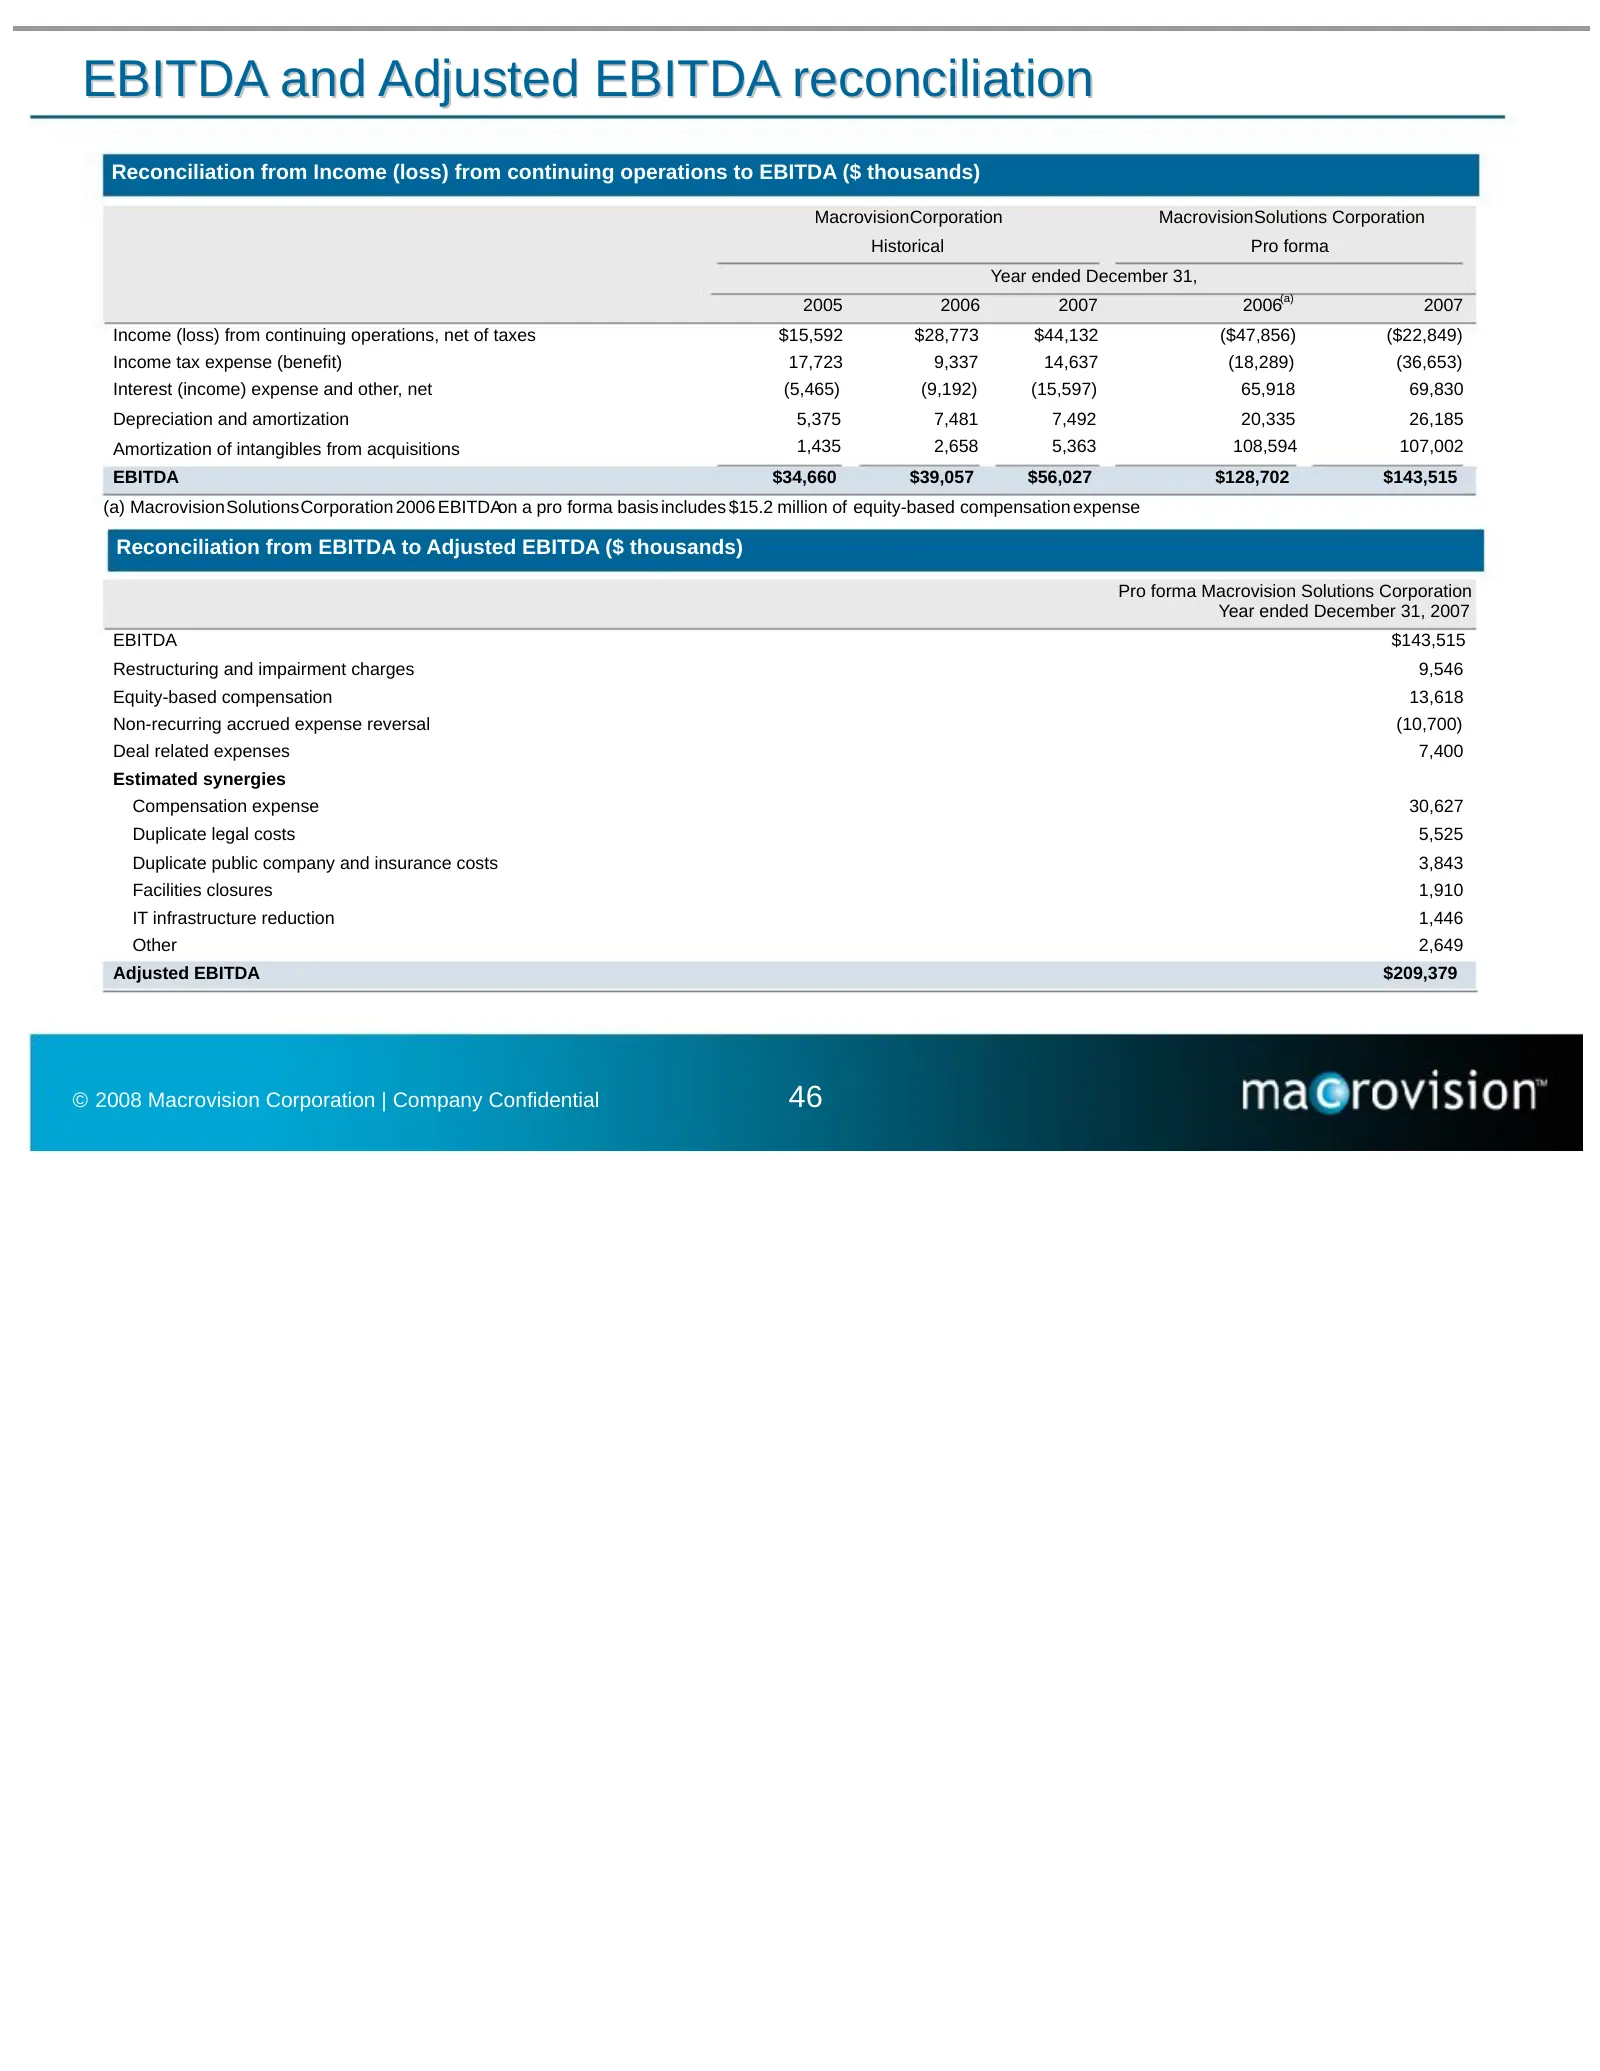
Slide 47: EBITDA and Adjusted EBITDA reconciliation
EBITDA and Adjusted EBITDA reconciliation Reconciliation from Income (loss) from continuing operations to EBITDA ($ thousands) MacrovisionCorporation MacrovisionSolutions Corporation Historical Pro forma Year ended December 31, (a) 2005 2006 2007 2006 2007 Income (loss) from continuing operations, n
Slide 48: Facilities Overview
Facilities Overview JPMorgan © 2008 Macrovision Corporation | Company Confidential 47
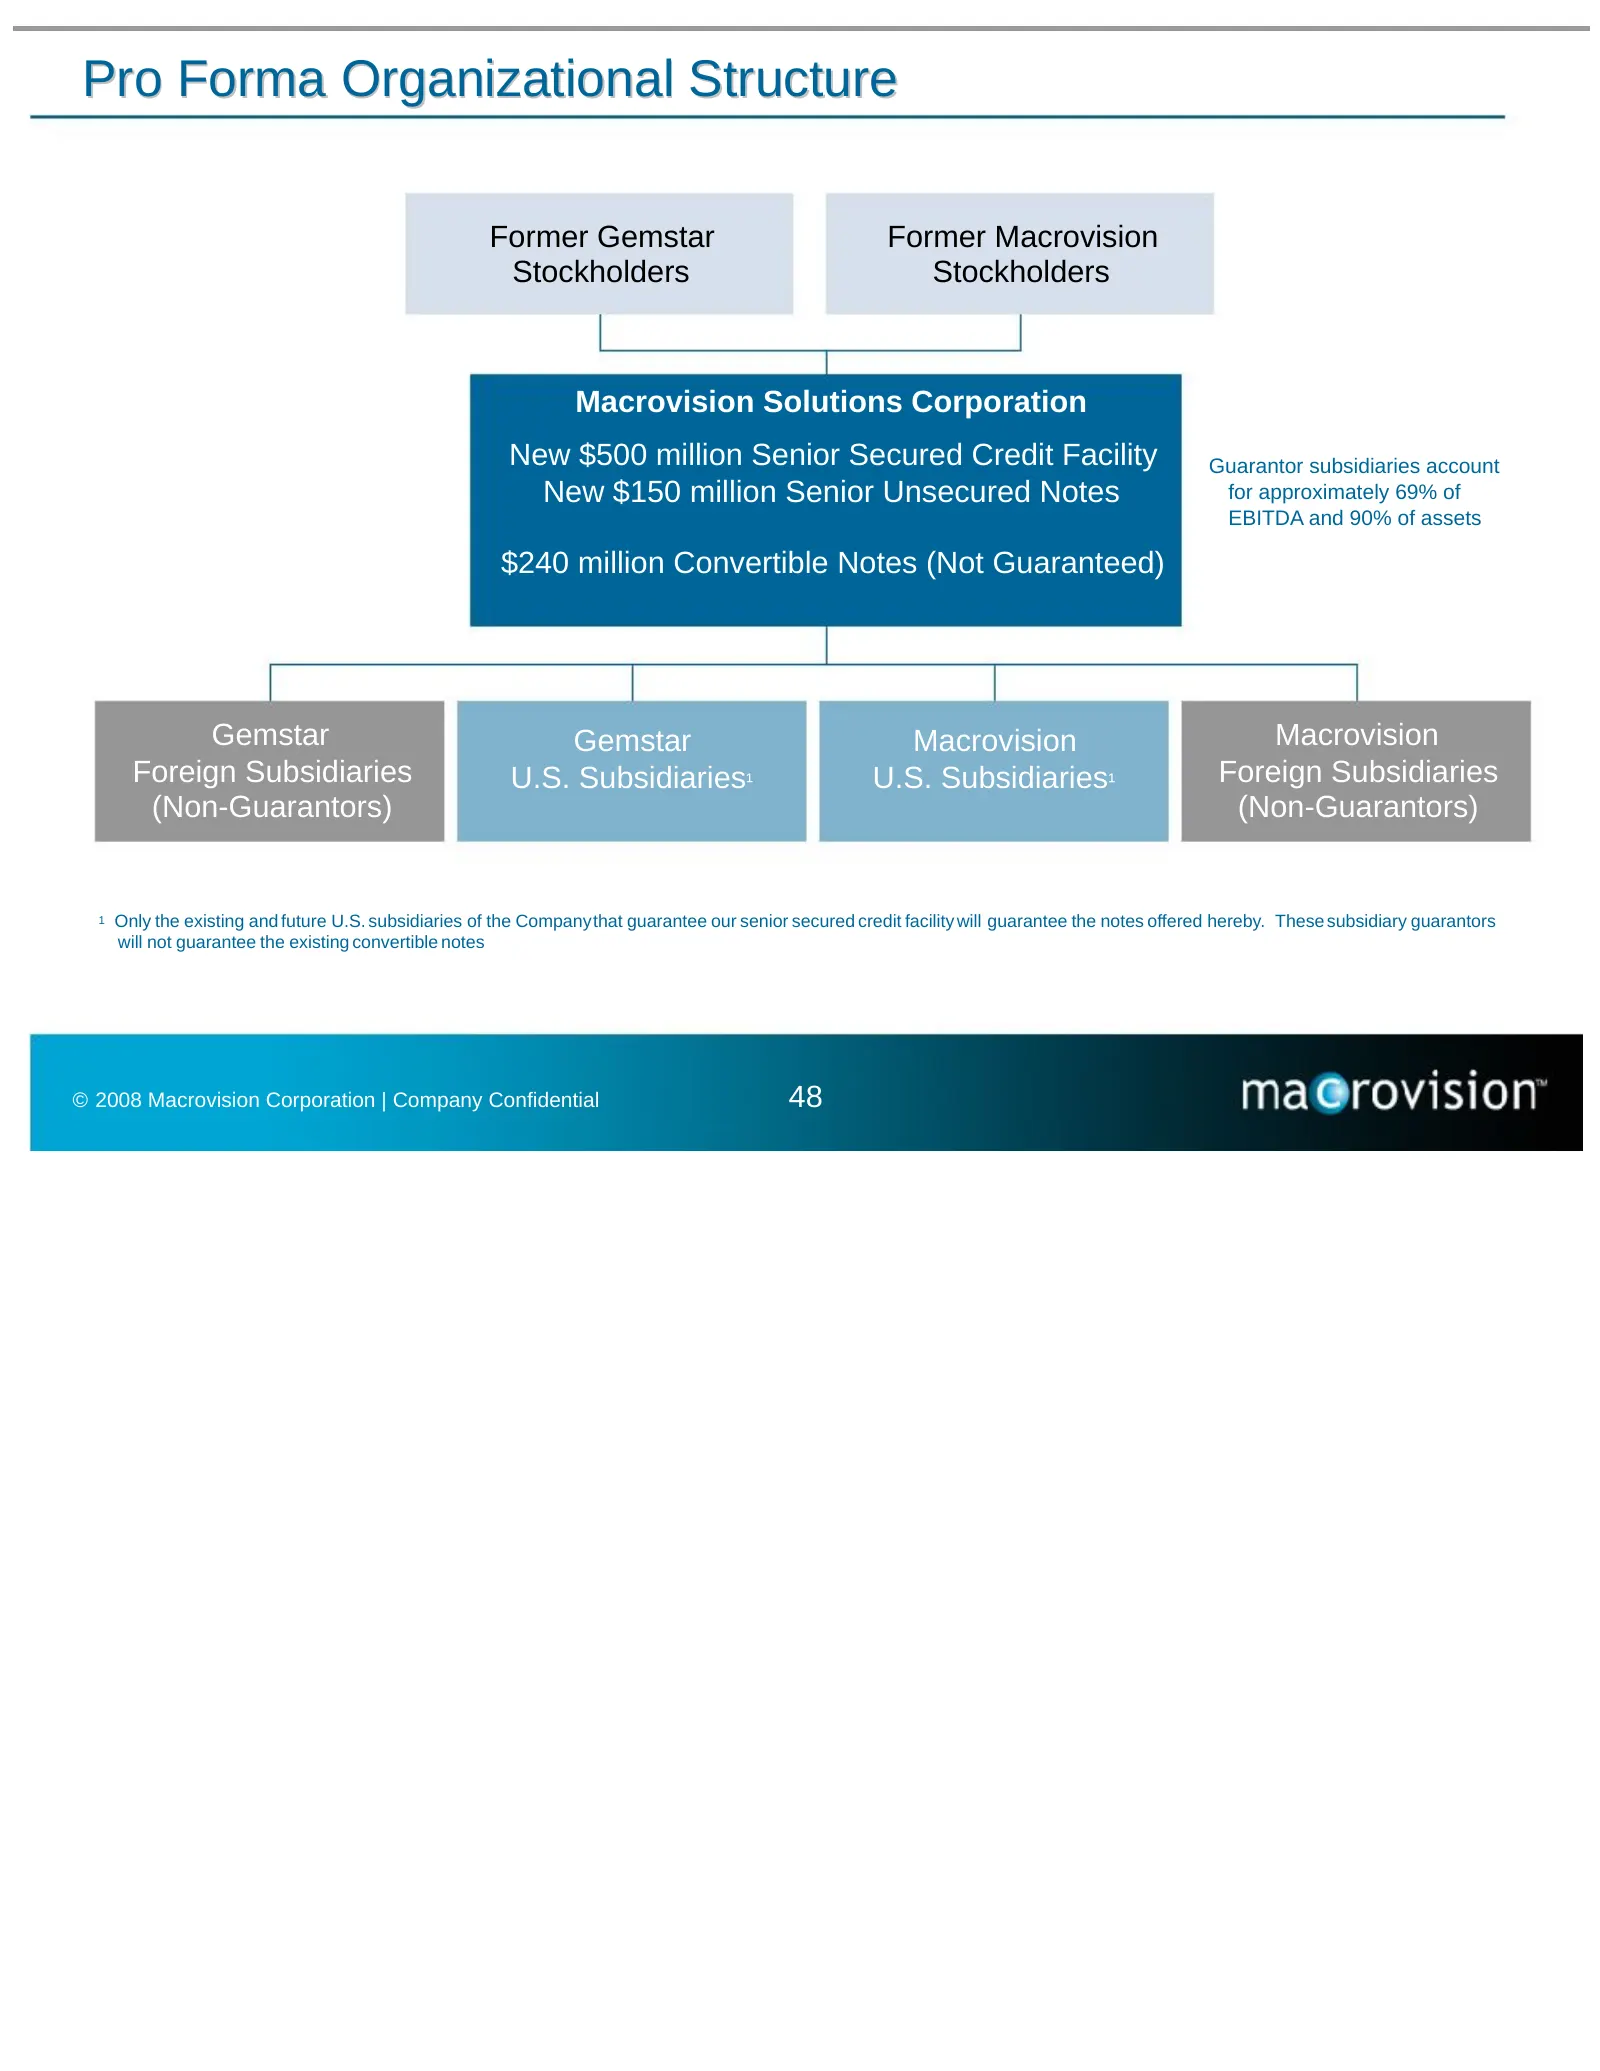
Slide 49: Pro Forma Organizational Structure
Pro Forma Organizational Structure Former Gemstar Former Macrovision Stockholders Stockholders Macrovision Solutions Corporation New $500 million Senior Secured Credit Facility Guarantor subsidiaries account New $150 million Senior Unsecured Notes for approximately 69% of EBITDA and 90% of assets $2
Slide 50: Term Loan Facility
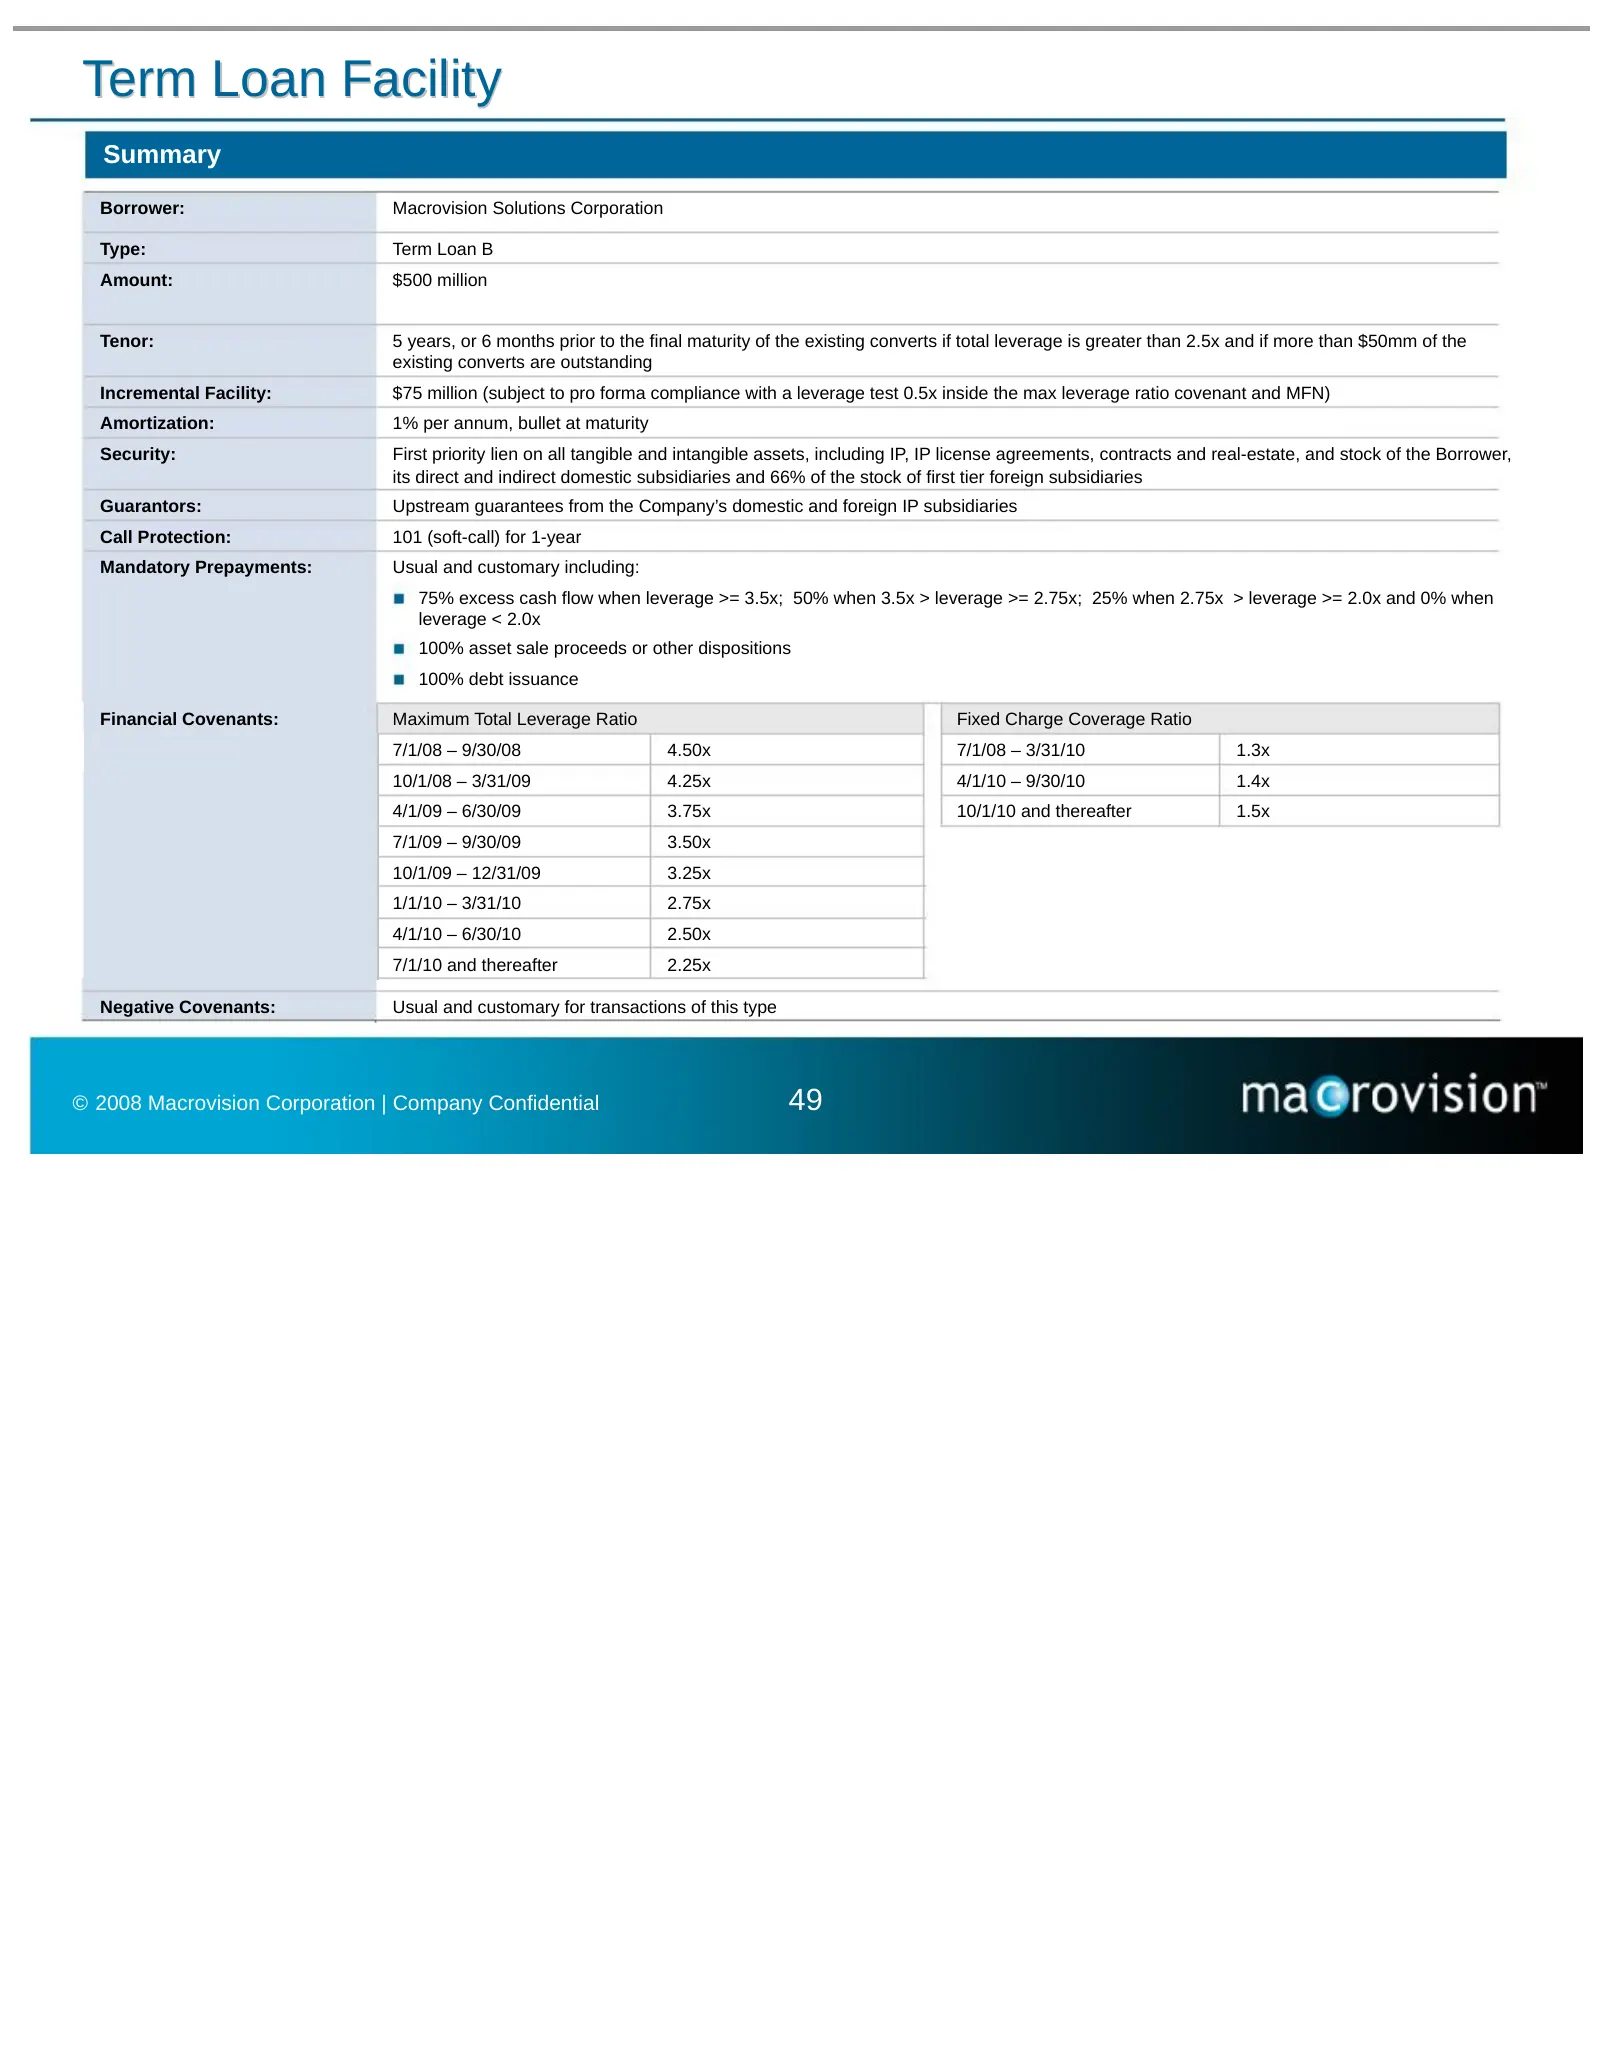
Term Loan Facility Summary Borrower: Macrovision Solutions Corporation Type: Term Loan B Amount: $500 million Tenor: 5 years, or 6 months prior to the final maturity of the existing converts if total leverage is greater than 2.5x and if more than $50mm of the existing converts are outstanding Increm
Slide 51: Summary Transaction Timetable
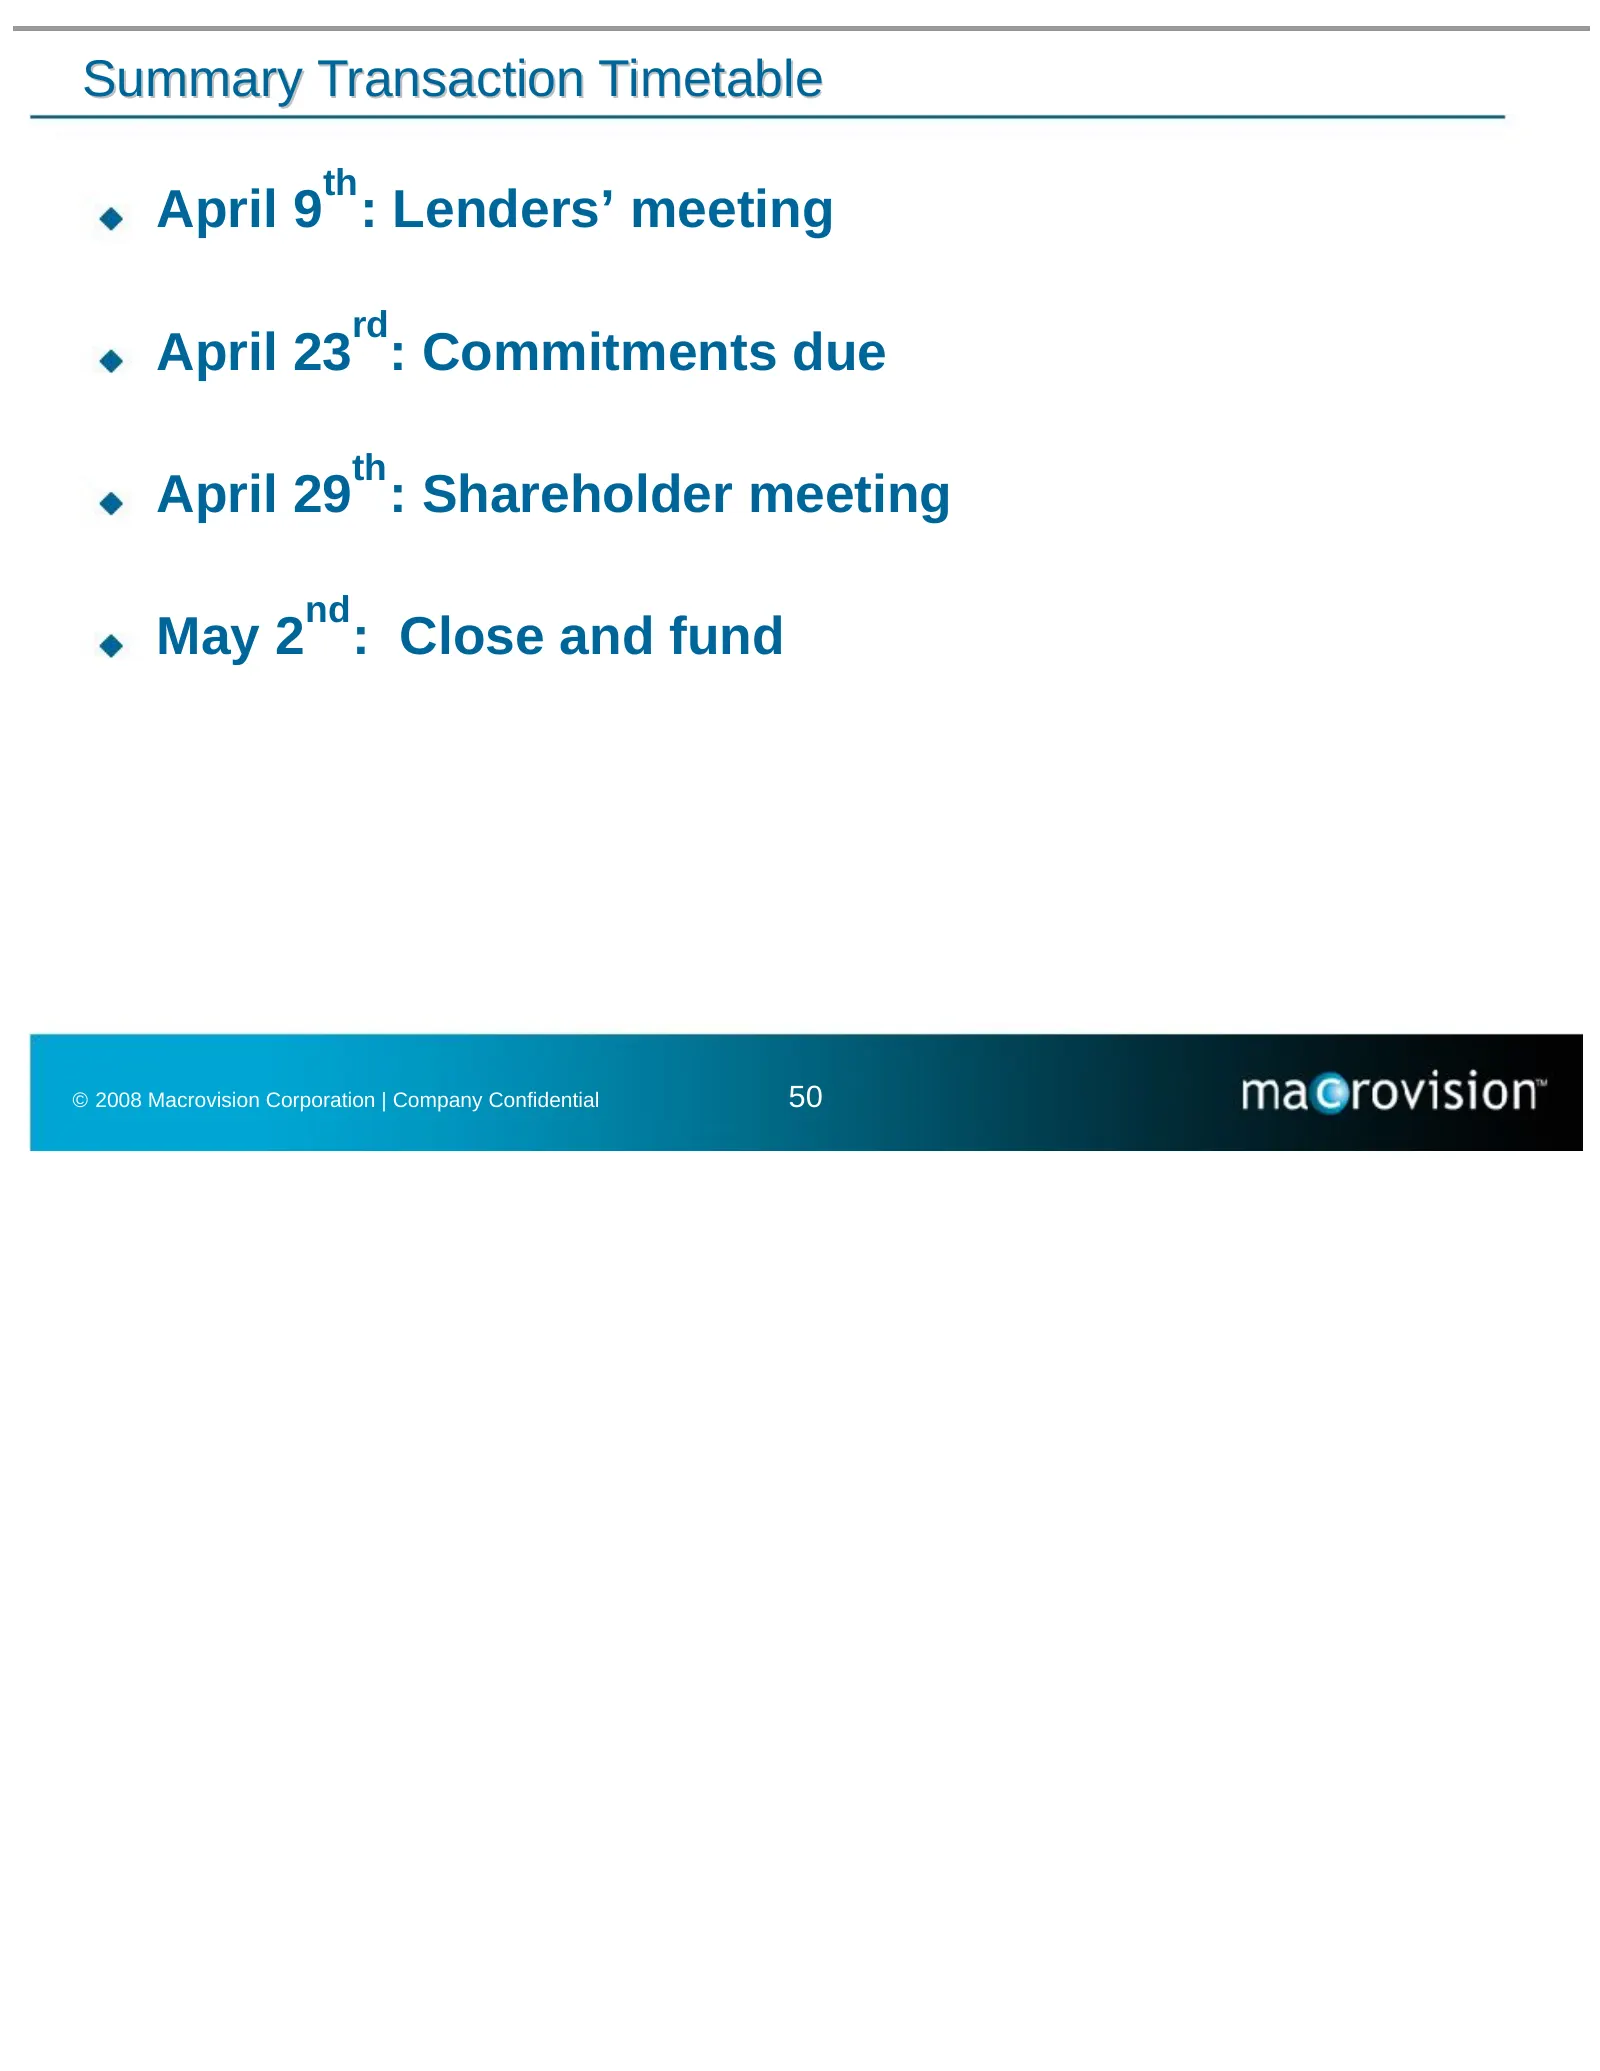
Summary Transaction Timetable th April 9 : Lenders’ meeting rd April 23 : Commitments due th April 29 : Shareholder meeting nd May 2 : Close and fund © 2008 Macrovision Corporation | Company Confidential 50

Slide 52: Q&A
Q&A © 2008 Macrovision Corporation | Company Confidential 51
Source: SEC EDGAR · 425 filed Apr 8, 2008
More decks from Macrovision Corp
 Macrovision — Merger or Acquisition (April 2008)48 slides · Apr 8, 2008
 Macrovision Solutions — Merger or Acquisition (February 2008)25 slides · Feb 12, 2008
 Merger or Acquisition (February 2008)25 slides · Feb 12, 2008
 Merger or Acquisition (December 2007)54 slides · Dec 7, 2007
 Gemstar TV Guide International — Merger or Acquisition (December 2007)54 slides · Dec 7, 2007