Meadowbrook Insurance Group Inc
Meadowbrook Insurance — Sidoti & Company Emerging Growth Institutional Investor Forum (March 2010)
36 slides from Meadowbrook Insurance's conference presentation, Mar 23, 2010
Slide 1: Sidoti & Company Emerging Growth Institutional Investor Forum
Sidoti & Company Emerging Growth Institutional Investor Forum March 23, 2010 Robert S. Cubbin, CEO
Slide 2: Forward-Looking Statements
2 Forward-Looking Statements Certain statements made by Meadowbrook Insurance Group, Inc. in this presentation may constitute forward-looking statements including, but not limited to, those statements that include the words "believes," "expects," "anticipates," "estimates," or similar expressions. P
Slide 3: The Meadowbrook Approach
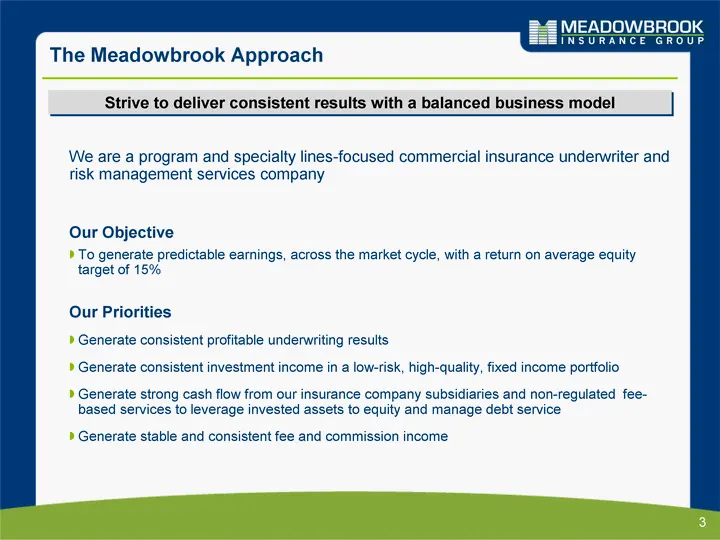
3 The Meadowbrook Approach Our Objective To generate predictable earnings, across the market cycle, with a return on average equity target of 15% Our Priorities Generate consistent profitable underwriting results Generate consistent investment income in a low-risk, high-quality, fixed income portfol
Slide 4: Meadowbrook Vitals
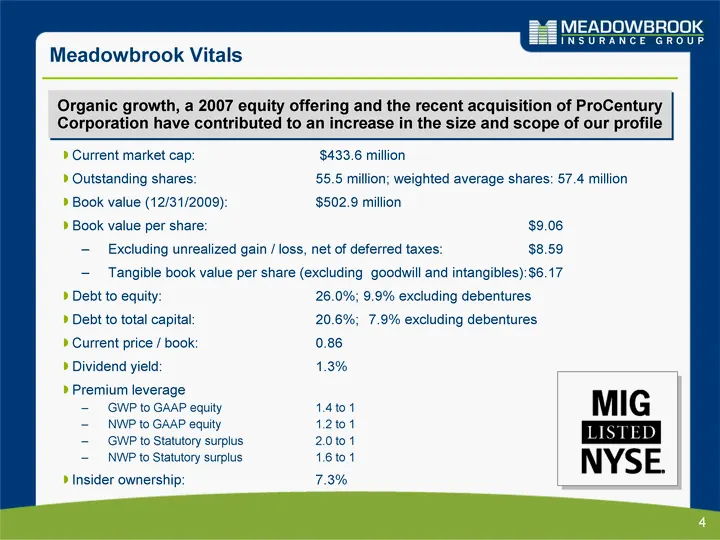
4 Meadowbrook Vitals Current market cap: $433.6 million Outstanding shares: 55.5 million; weighted average shares: 57.4 million Book value (12/31/2009): $502.9 million Book value per share: $9.06 Excluding unrealized gain / loss, net of deferred taxes: $8.59 Tangible book value per share (excluding
Slide 5: What Makes Us Different: Flexible and Able to Adapt
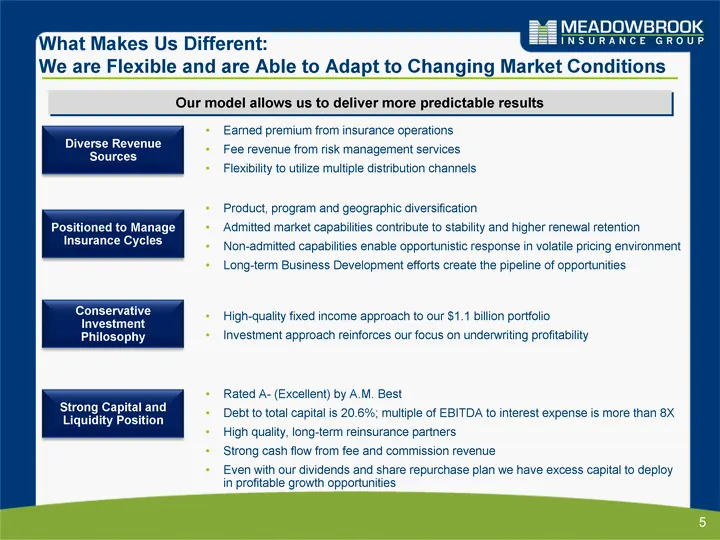
5 What Makes Us Different: We are Flexible and are Able to Adapt to Changing Market Conditions Diverse Revenue Sources Earned premium from insurance operations Fee revenue from risk management services Flexibility to utilize multiple distribution channels Positioned to Manage Insurance Cycles Conser
Slide 6: Our Approach Has Delivered Results Over Time
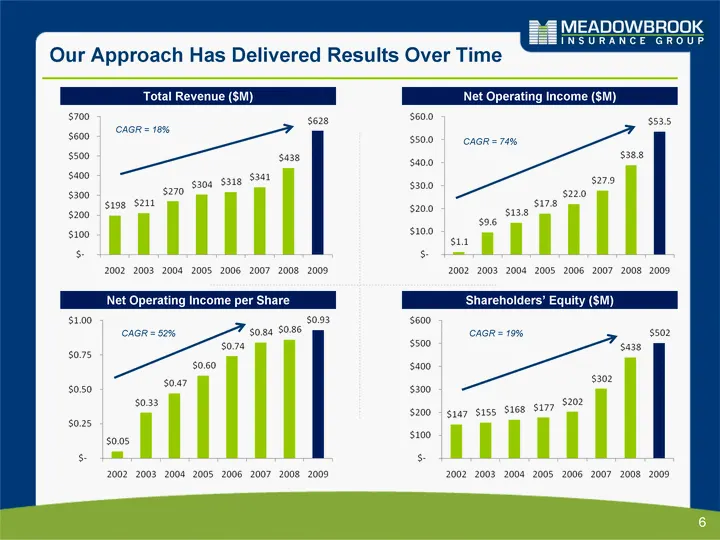
6 Our Approach Has Delivered Results Over Time Total Revenue ($M) Net Operating Income ($M) Shareholders' Equity ($M) Net Operating Income per Share CAGR = 18% CAGR = 74% CAGR = 19% CAGR = 52%
Slide 7: Capability Building Through Successful Acquisitions
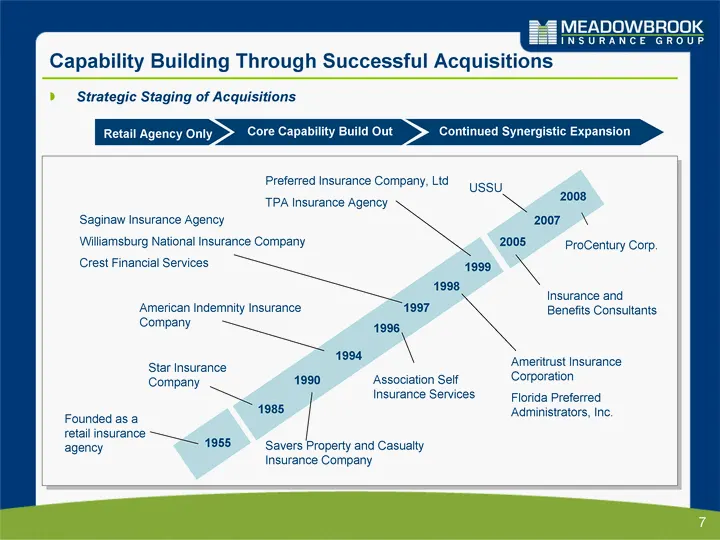
7 Capability Building Through Successful Acquisitions 1955 Founded as a retail insurance agency 2007 USSU 1985 1990 1996 1997 1998 1994 1999 2005 Star Insurance Company Savers Property and Casualty Insurance Company American Indemnity Insurance Company Association Self Insurance Services Saginaw Ins
Slide 8: Diverse Revenue Sources
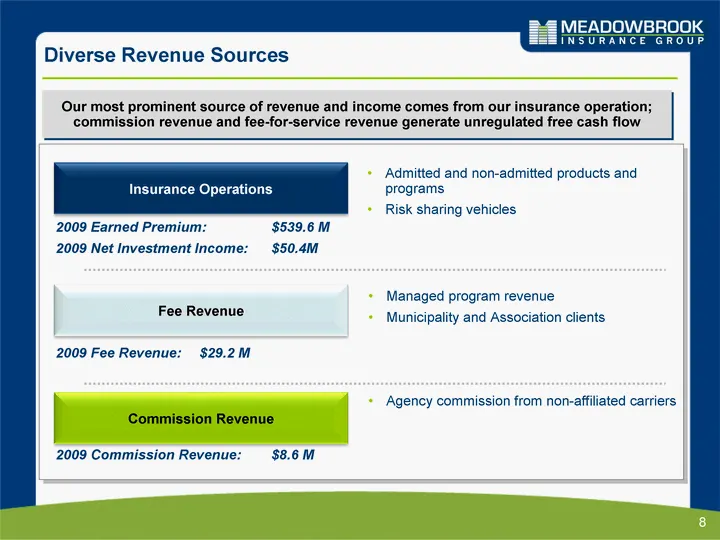
8 Diverse Revenue Sources Insurance Operations Commission Revenue Fee Revenue Our most prominent source of revenue and income comes from our insurance operation; commission revenue and fee-for-service revenue generate unregulated free cash flow Admitted and non-admitted products and programs Risk sh
Slide 9: Insurance Operations: Diversified Commercial Positions
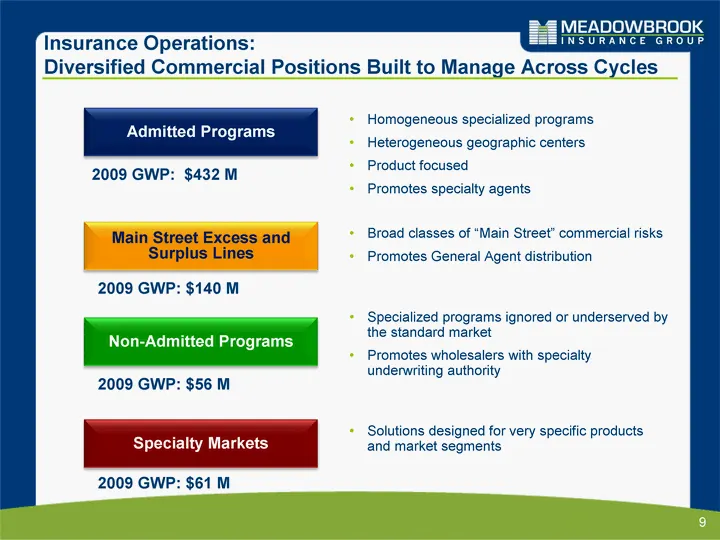
9 Insurance Operations: Diversified Commercial Positions Built to Manage Across Cycles Main Street Excess and Surplus Lines Admitted Programs Non-Admitted Programs Specialty Markets Homogeneous specialized programs Heterogeneous geographic centers Product focused Promotes specialty agents Broad clas
Slide 10: Diversified Commercial Positions: Admitted Programs
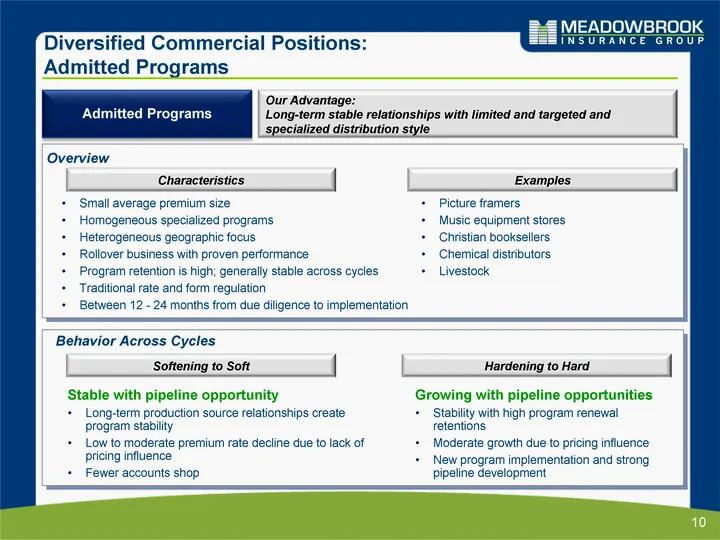
10 Diversified Commercial Positions: Admitted Programs Admitted Programs Picture framers Music equipment stores Christian booksellers Chemical distributors Livestock Small average premium size Homogeneous specialized programs Heterogeneous geographic focus Rollover business with proven performance P
Slide 11: Diversified Commercial Positions: Main Street Excess and Surplus Lines
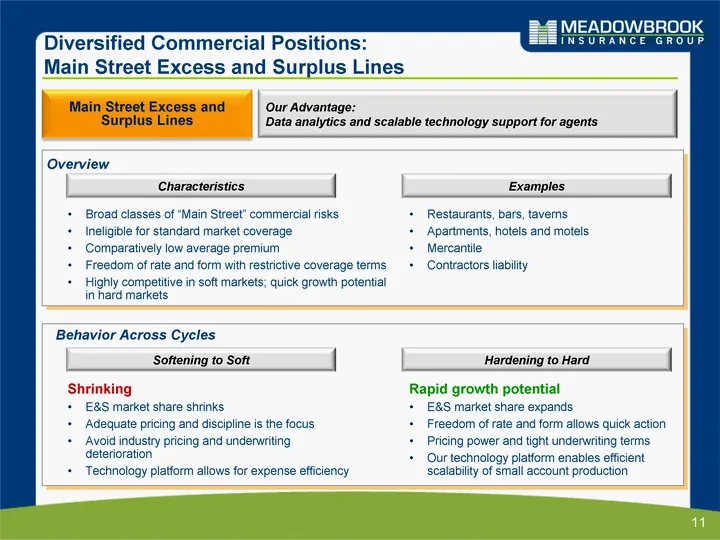
11 Diversified Commercial Positions: Main Street Excess and Surplus Lines Main Street Excess and Surplus Lines Characteristics Behavior Across Cycles Our Advantage: Data analytics and scalable technology support for agents Examples Overview Softening to Soft Hardening to Hard Restaurants, bars, tave
Slide 12: An Offering to Manage the Cycle: Non-Admitted Programs
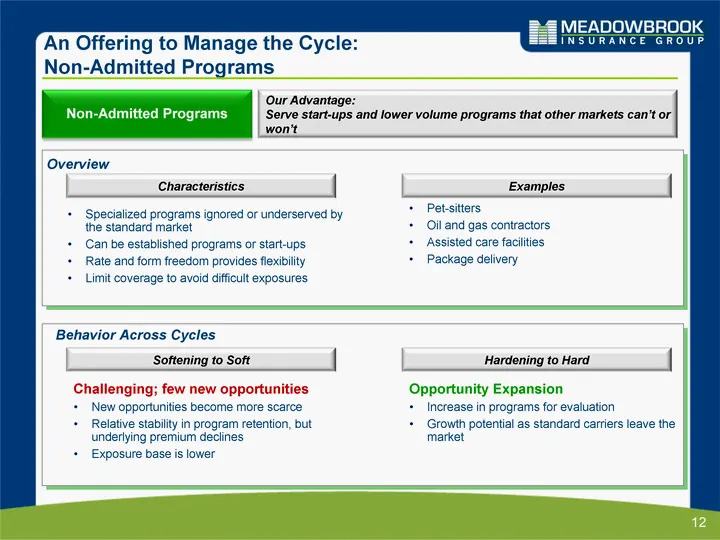
12 An Offering to Manage the Cycle: Non-Admitted Programs Non-Admitted Programs Characteristics Behavior Across Cycles Our Advantage: Serve start-ups and lower volume programs that other markets can't or won't Examples Overview Softening to Soft Hardening to Hard Pet-sitters Oil and gas contractors
Slide 13: An Offering to Manage the Cycle: Specialty Markets
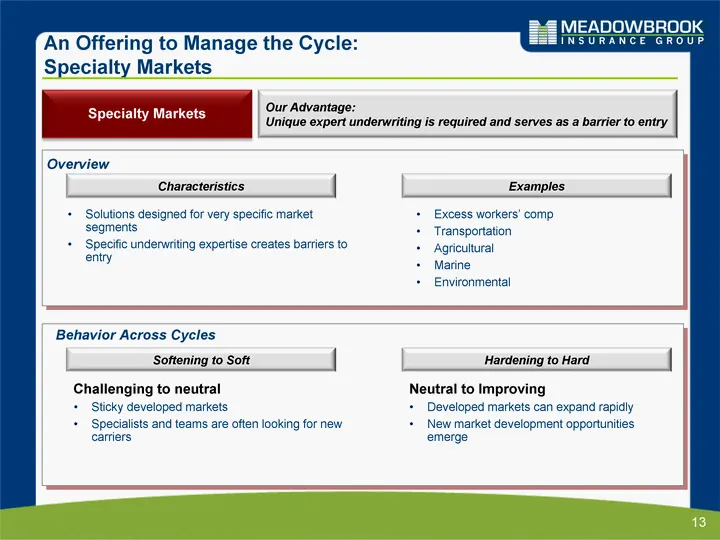
13 An Offering to Manage the Cycle: Specialty Markets Specialty Markets Characteristics Behavior Across Cycles Our Advantage: Unique expert underwriting is required and serves as a barrier to entry Examples Overview Softening to Soft Hardening to Hard Excess workers' comp Transportation Agricultural
Slide 14: Insurance Operations: A Powerful and Diverse Distribution Network
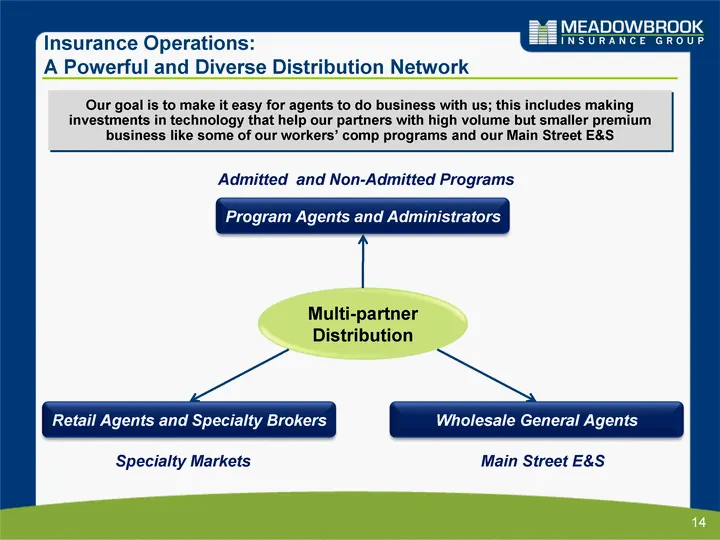
14 Insurance Operations: A Powerful and Diverse Distribution Network Our goal is to make it easy for agents to do business with us; this includes making investments in technology that help our partners with high volume but smaller premium business like some of our workers' comp programs and our Main
Slide 15: National Scope with Regional Perspective
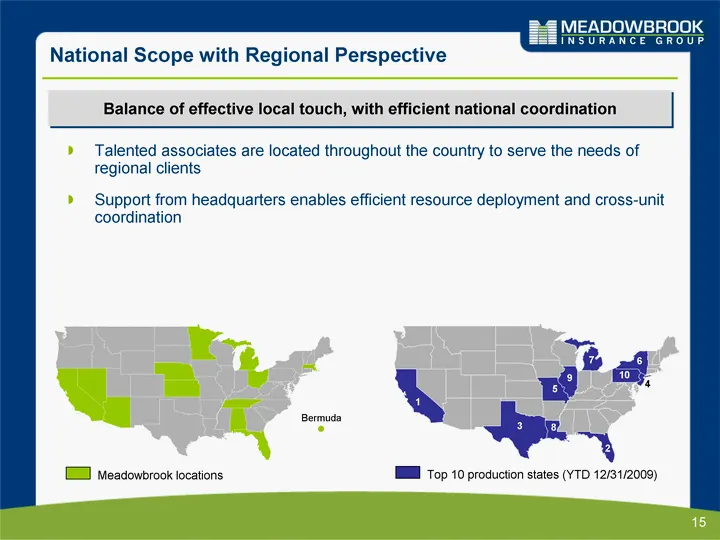
15 National Scope with Regional Perspective Bermuda Talented associates are located throughout the country to serve the needs of regional clients Support from headquarters enables efficient resource deployment and cross-unit coordination Balance of effective local touch, with efficient national coor
Slide 16: Historical Production and Business Mix
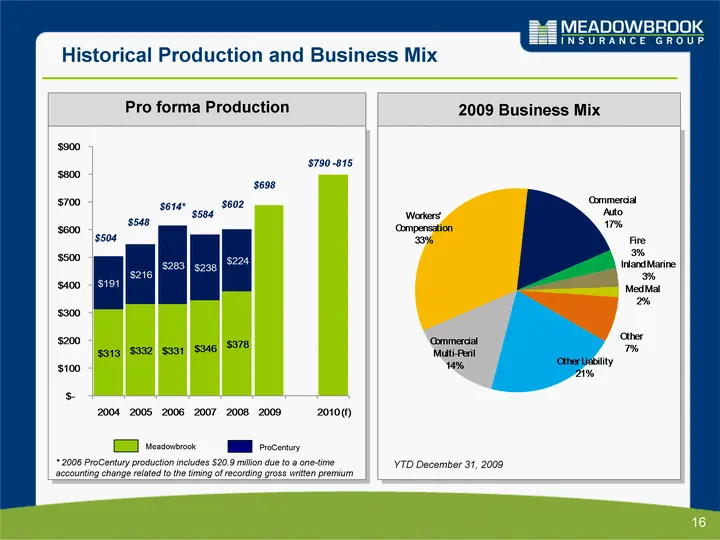
16 Historical Production and Business Mix 2009 Business Mix Pro forma Production $504 $548 $614* $584 $602 ProCentury Meadowbrook * 2006 ProCentury production includes $20.9 million due to a one-time accounting change related to the timing of recording gross written premium YTD December 31, 2009 $69
Slide 17: 2010 Production Sources
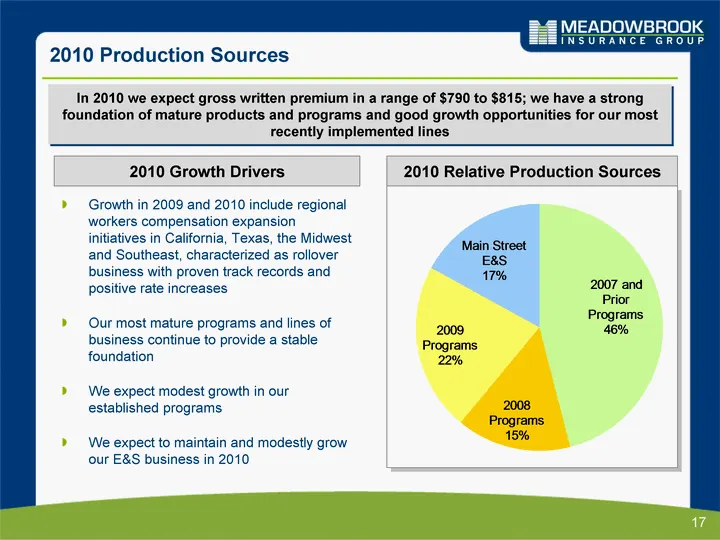
17 2010 Production Sources 2010 Relative Production Sources In 2010 we expect gross written premium in a range of $790 to $815; we have a strong foundation of mature products and programs and good growth opportunities for our most recently implemented lines 2010 Growth Drivers Growth in 2009 and 201
Slide 18: Loss and Expense Ratios
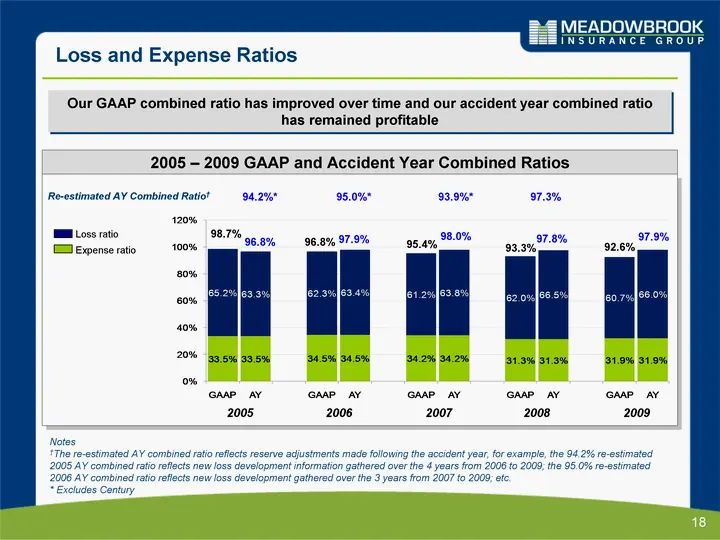
Loss and Expense Ratios 18 Loss ratio Expense ratio 2005 - 2009 GAAP and Accident Year Combined Ratios 98.7% Our GAAP combined ratio has improved over time and our accident year combined ratio has remained profitable 2005 2006 2007 2008 2009 96.8% 96.8% 97.9% 95.4% 98.0% 93.3% 97.8% 92.6% 97.9% Re-e
Slide 19: Leveraging Expenses Over a Larger Revenue Base
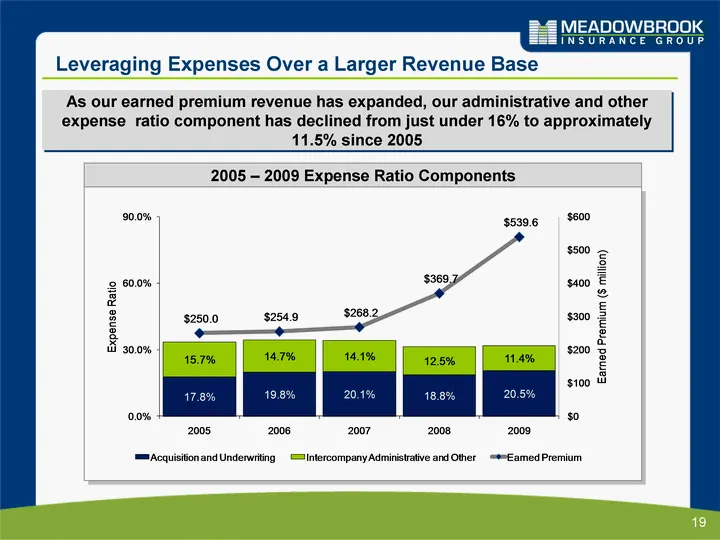
Leveraging Expenses Over a Larger Revenue Base 19 2005 - 2009 Expense Ratio Components As our earned premium revenue has expanded, our administrative and other expense ratio component has declined from just under 16% to approximately 11.5% since 2005
Slide 20: Focus on Generating Consistent Investment Income
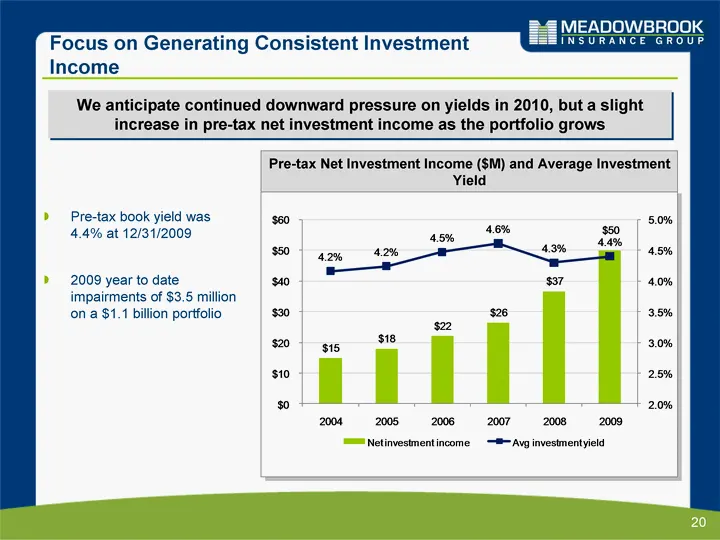
20 Focus on Generating Consistent Investment Income Pre-tax Net Investment Income ($M) and Average Investment Yield We anticipate continued downward pressure on yields in 2010, but a slight increase in pre-tax net investment income as the portfolio grows Pre-tax book yield was 4.4% at 12/31/2009 200
Slide 21: We Maintain a High Quality, Low Risk Investment Portfolio
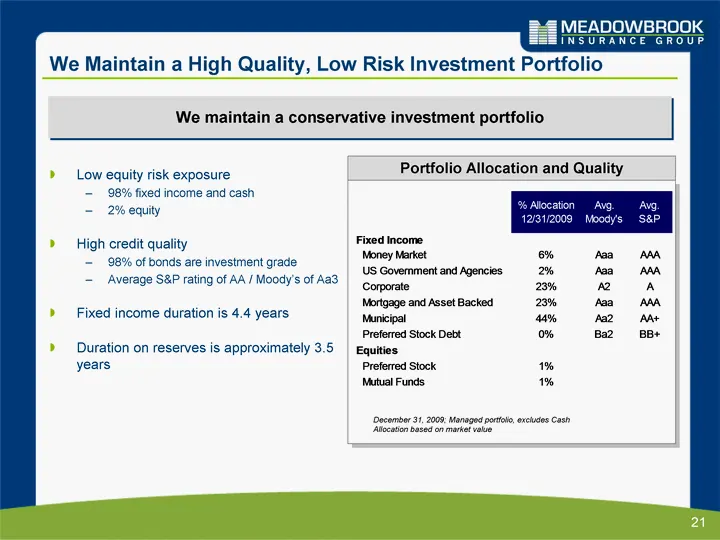
21 We Maintain a High Quality, Low Risk Investment Portfolio We maintain a conservative investment portfolio Portfolio Allocation and Quality December 31, 2009; Managed portfolio, excludes Cash Allocation based on market value Low equity risk exposure 98% fixed income and cash 2% equity High credit
Slide 22: Fee-Based and Agency Operations Give Us Flexibility
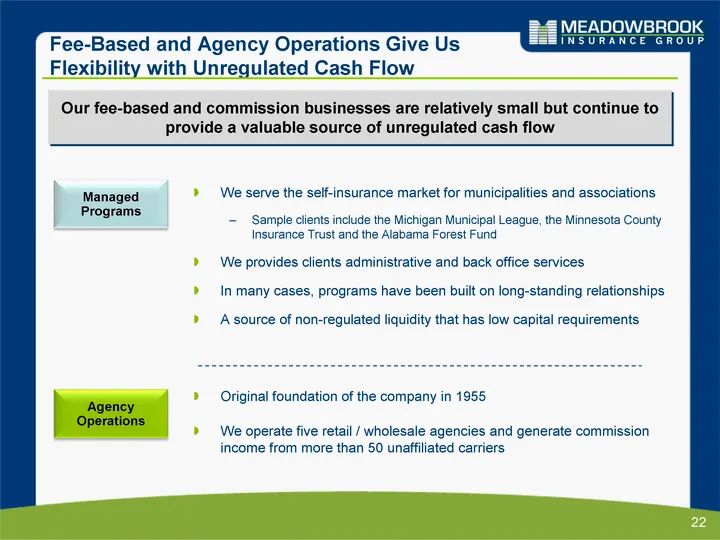
22 Fee-Based and Agency Operations Give Us Flexibility with Unregulated Cash Flow We serve the self-insurance market for municipalities and associations Sample clients include the Michigan Municipal League, the Minnesota County Insurance Trust and the Alabama Forest Fund We provides clients administ
Slide 23: Agency and Fee-Based Operations Profile
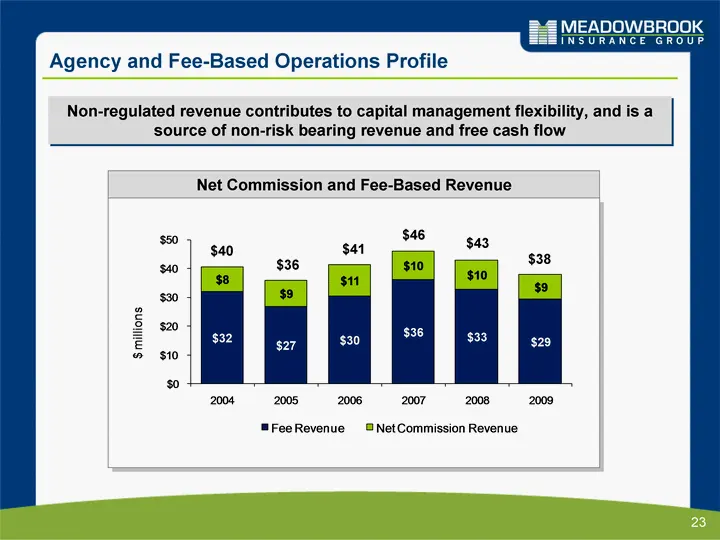
23 Agency and Fee-Based Operations Profile Non-regulated revenue contributes to capital management flexibility, and is a source of non-risk bearing revenue and free cash flow Net Commission and Fee-Based Revenue $40 $36 $41 $46 $43 $38
Slide 24: Financial Highlights
24 Financial Highlights
Slide 25: Recent Financial Highlights: 2009 Fourth Quarter and YTD
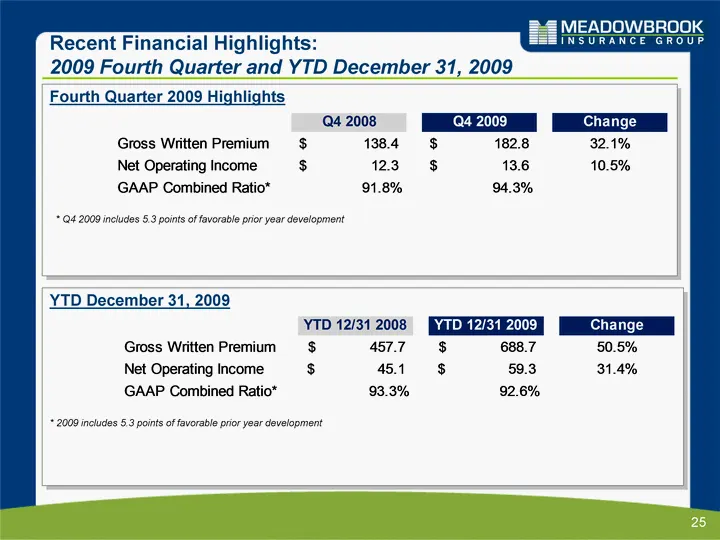
25 Recent Financial Highlights: 2009 Fourth Quarter and YTD December 31, 2009 Fourth Quarter 2009 Highlights * Q4 2009 includes 5.3 points of favorable prior year development YTD December 31, 2009 * 2009 includes 5.3 points of favorable prior year development
Slide 26: Creating Sustainable Double Digit ROAE with Substantial Equity Growth
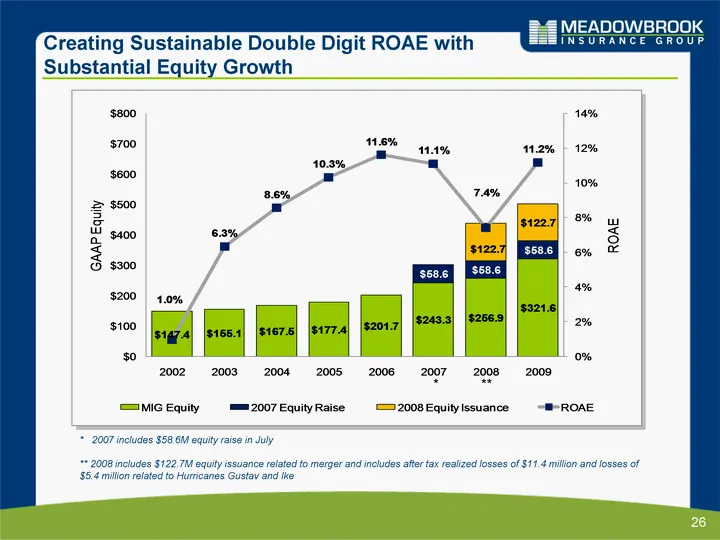
26 Creating Sustainable Double Digit ROAE with Substantial Equity Growth * 2007 includes $58.6M equity raise in July ** 2008 includes $122.7M equity issuance related to merger and includes after tax realized losses of $11.4 million and losses of $5.4 million related to Hurricanes Gustav and Ike * **
Slide 27: ROAE Components
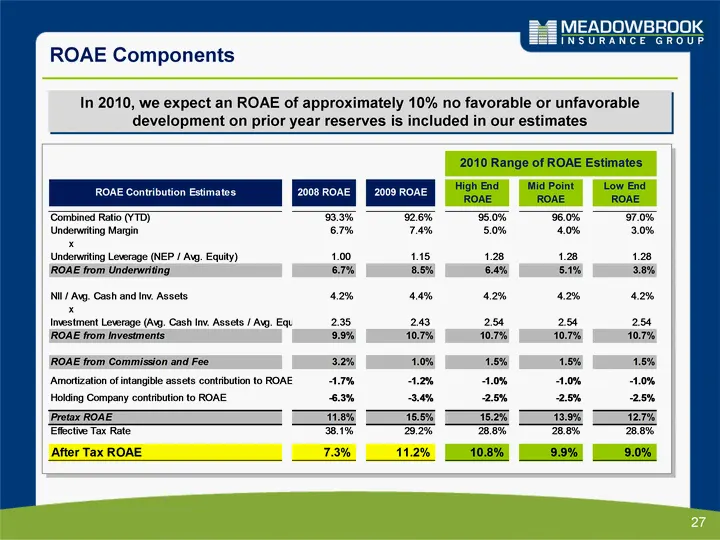
27 ROAE Components In 2010, we expect an ROAE of approximately 10% no favorable or unfavorable development on prior year reserves is included in our estimates
Slide 28: Expectations for 2010 and Long Term Value Creation
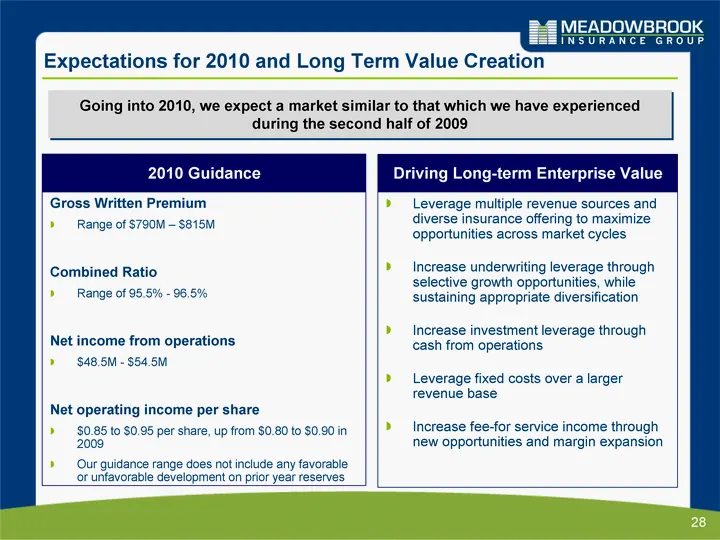
28 Expectations for 2010 and Long Term Value Creation Going into 2010, we expect a market similar to that which we have experienced during the second half of 2009 Gross Written Premium Range of $790M - $815M Combined Ratio Range of 95.5% - 96.5% Net income from operations $48.5M - $54.5M Net operati

Slide 29
Slide 30: Investment Portfolio Appendix
30 Investment Portfolio Appendix
Slide 31: We Maintain a High Quality, Low Risk Investment Portfolio
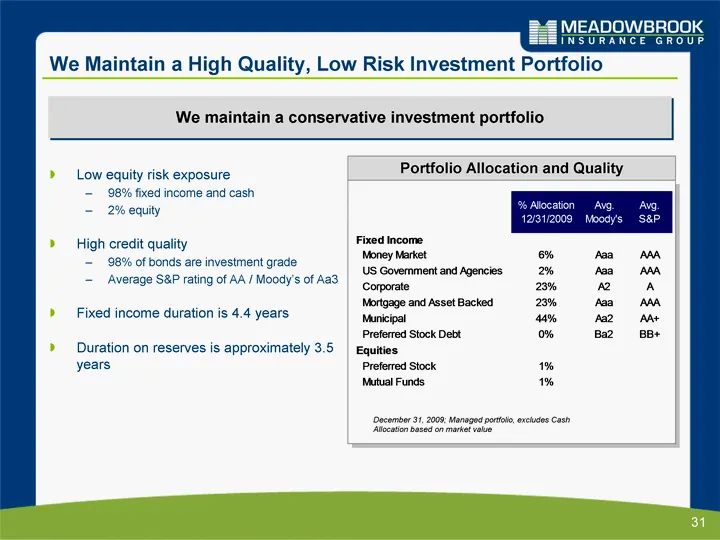
31 We Maintain a High Quality, Low Risk Investment Portfolio We maintain a conservative investment portfolio Portfolio Allocation and Quality December 31, 2009; Managed portfolio, excludes Cash Allocation based on market value Low equity risk exposure 98% fixed income and cash 2% equity High credit
Slide 32: Municipal Bonds
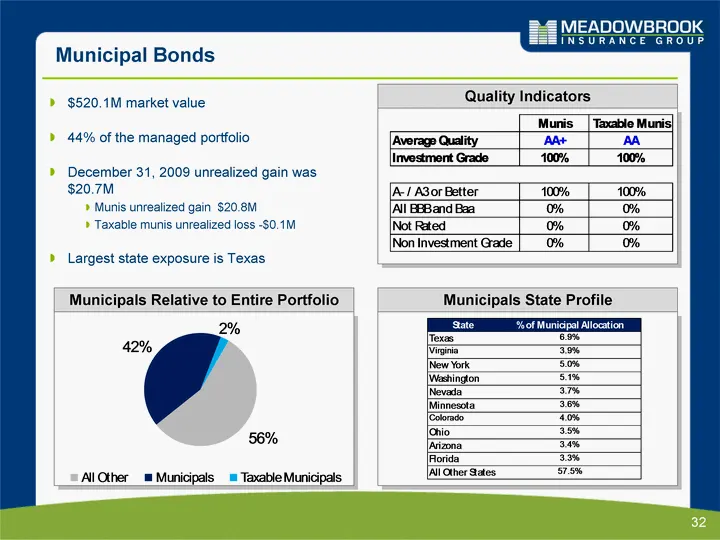
32 Municipal Bonds Municipals State Profile Municipals Relative to Entire Portfolio Quality Indicators $520.1M market value 44% of the managed portfolio December 31, 2009 unrealized gain was $20.7M Munis unrealized gain $20.8M Taxable munis unrealized loss -$0.1M Largest state exposure is Texas
Slide 33: Structured Securities
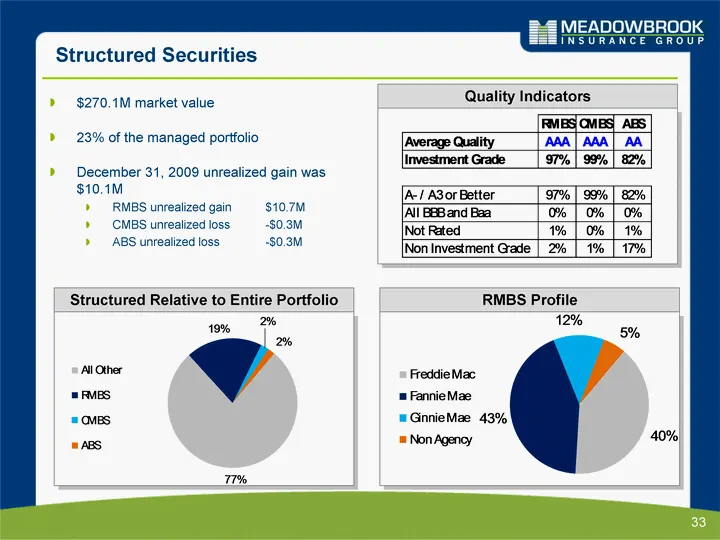
33 Structured Securities Structured Relative to Entire Portfolio Quality Indicators RMBS Profile $270.1M market value 23% of the managed portfolio December 31, 2009 unrealized gain was $10.1M RMBS unrealized gain $10.7M CMBS unrealized loss -$0.3M ABS unrealized loss -$0.3M
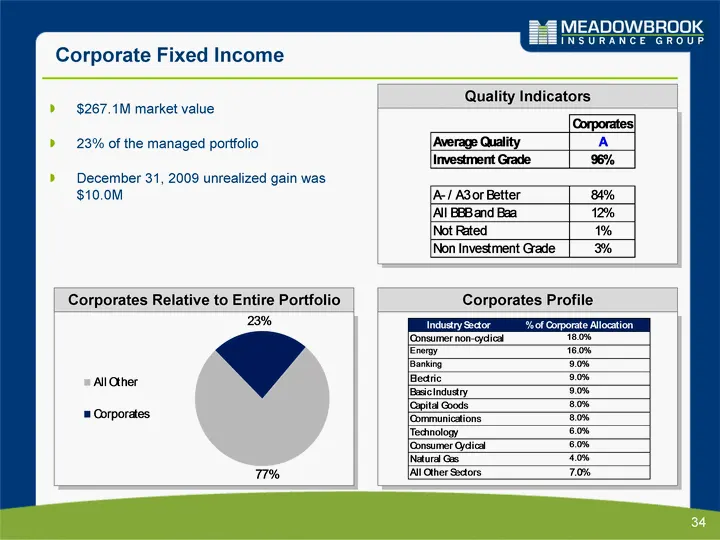
Slide 34: Corporate Fixed Income
34 Corporate Fixed Income Corporates Profile Corporates Relative to Entire Portfolio Quality Indicators $267.1M market value 23% of the managed portfolio December 31, 2009 unrealized gain was $10.0M
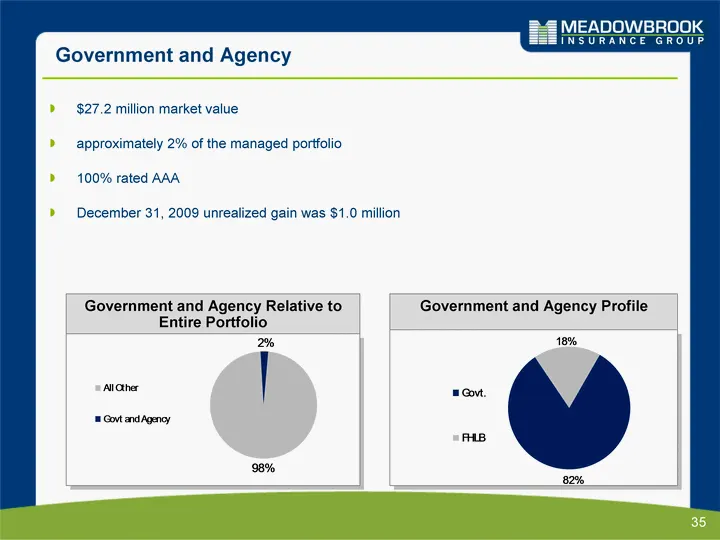
Slide 35: Government and Agency
35 Government and Agency Government and Agency Profile Government and Agency Relative to Entire Portfolio $27.2 million market value approximately 2% of the managed portfolio 100% rated AAA December 31, 2009 unrealized gain was $1.0 million
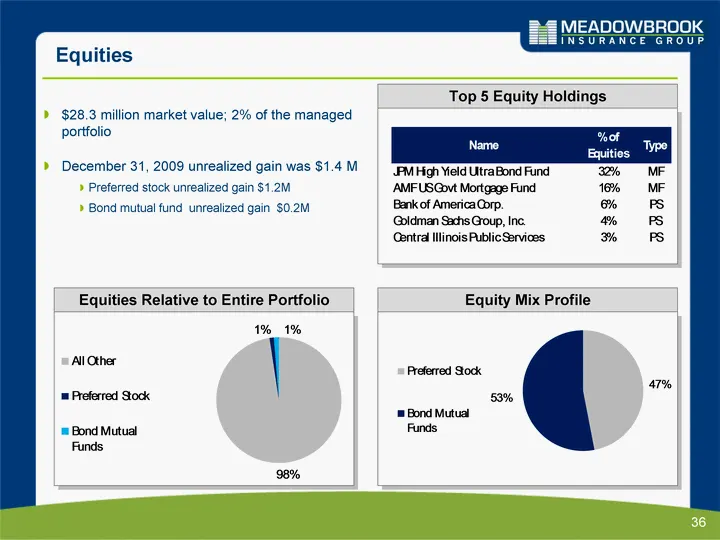
Slide 36: Equities
36 Equities Equity Mix Profile Equities Relative to Entire Portfolio Top 5 Equity Holdings $28.3 million market value; 2% of the managed portfolio December 31, 2009 unrealized gain was $1.4 M Preferred stock unrealized gain $1.2M Bond mutual fund unrealized gain $0.2M
Source: SEC EDGAR · 8-K filed Mar 23, 2010
More decks from Meadowbrook Insurance Group Inc
 Q3 2014 Earnings Presentation26 slides · Nov 18, 2014
 Q3 2014 Earnings Presentation19 slides · Nov 18, 2014
 Q2 2014 Earnings Presentation21 slides · Aug 28, 2014
 Q2 2014 Earnings Presentation27 slides · Aug 28, 2014
 Investor Presentation (June 2014)31 slides · Jun 3, 2014
 Q1 2014 Earnings Presentation21 slides · Jun 3, 2014