Stillwater Mining — Investor Presentation (March 2013)
25 slides from Stillwater Mining's investor presentation, Mar 21, 2013
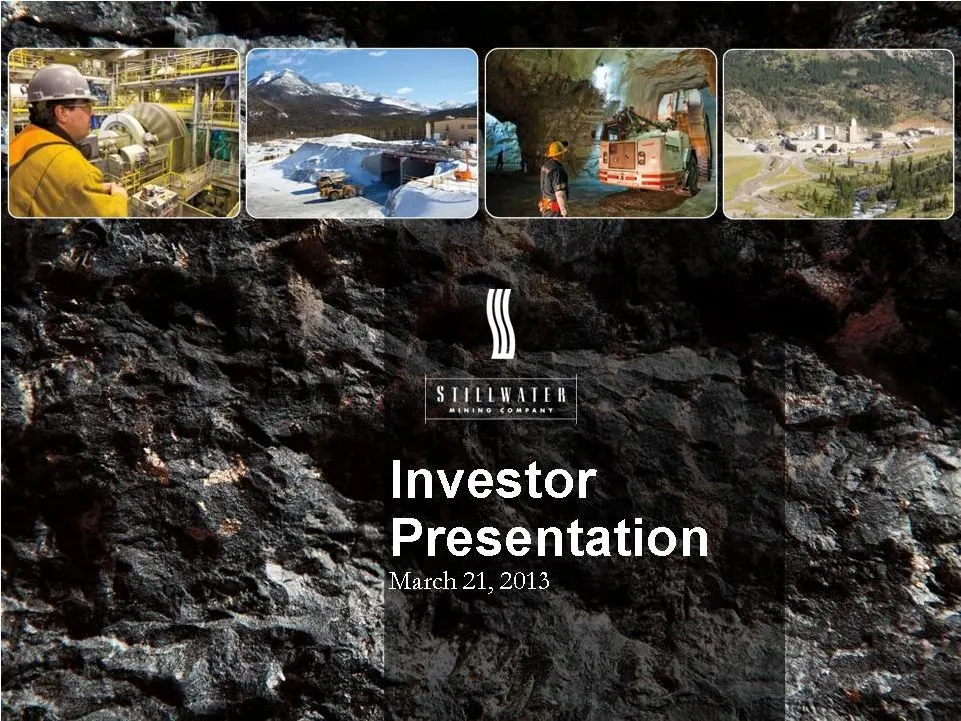
Slide 1: Investor Presentation, March 21, 2013
Q 2 %, March 21 “ftv beta ‘Presentat 2013 ral Sb sl a Mes os MF
Slide 2: Stillwater Investor
f & = SUITUNALER Investor
Slide 3: Stillwater Investor
f & = SUITUNALER Investor
Slide 4: Stillwater Investor
f & = SUITUNALER Investor
Slide 5
Slide 6: Stillwater Mining Company
{ STILLWATER
Slide 7: Mining Company
MINING COMPANY
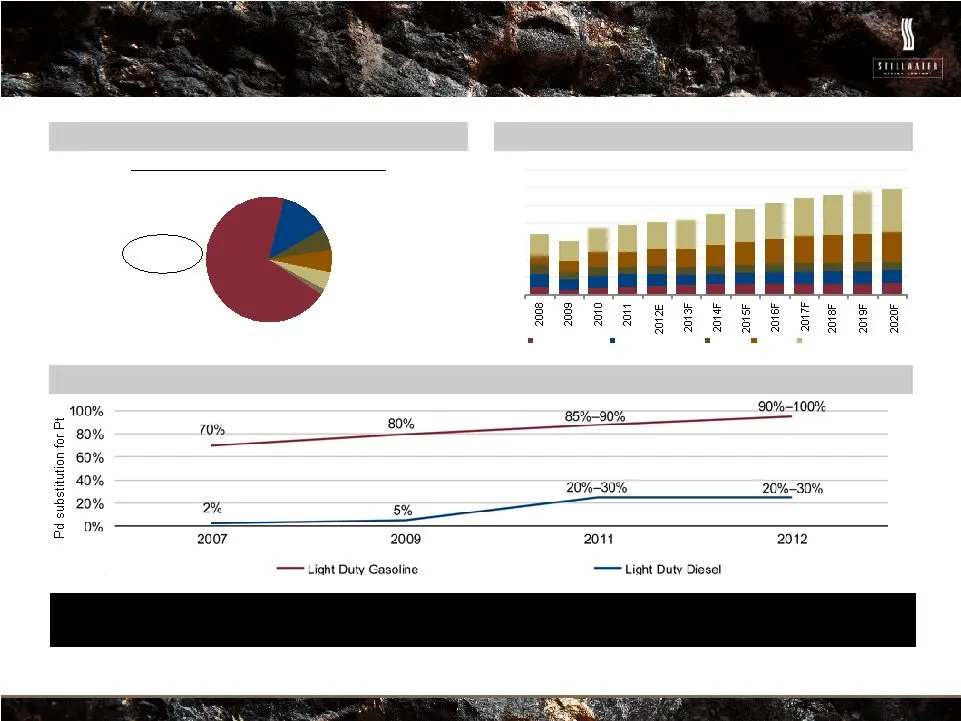
Slide 8: Light duty gasoline and diesel vehicle trends
{ sient) — Pr TT 9 90%—104 10% oN 85%-90% eee ‘5 80% (V% 5 60% 2 40% 20%-30% 20%-30% = 20% 2% 5% = 1% 4 2007 2009 2011 2012 — Light Duy Gasoline — Light Duty diesel
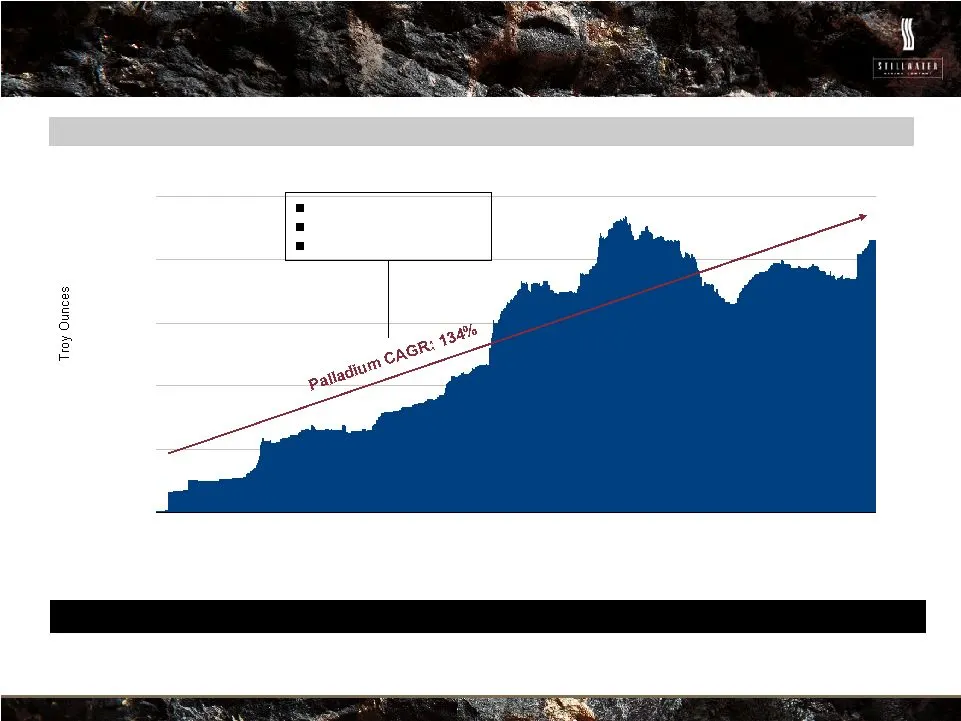
Slide 9: Troy Ounces
“ff HHA Troy Ounces
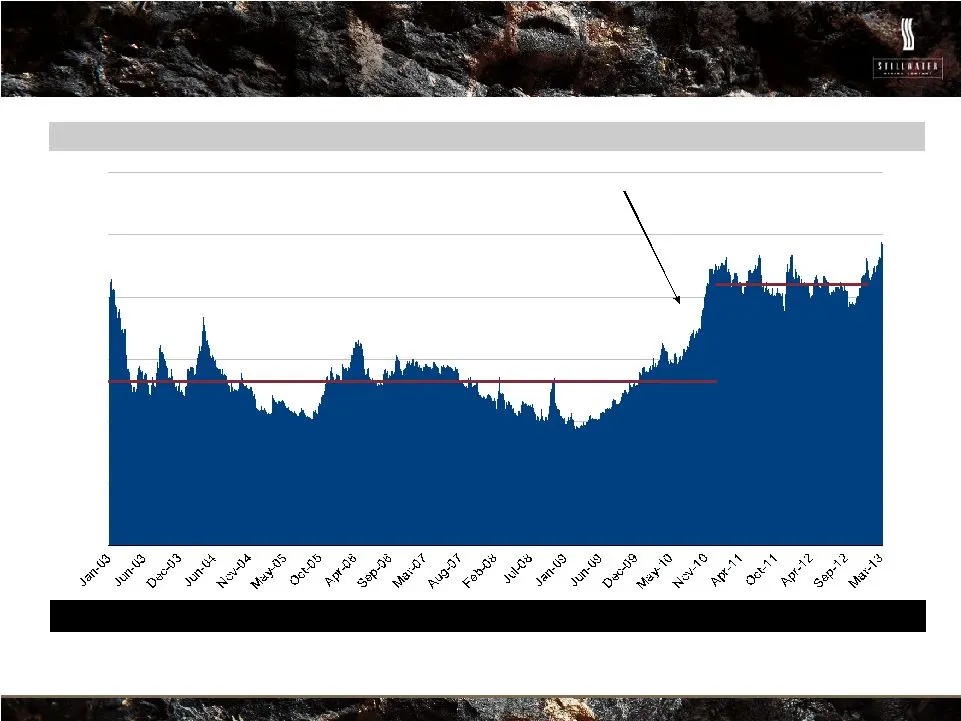
Slide 10: HHA
{ HHA
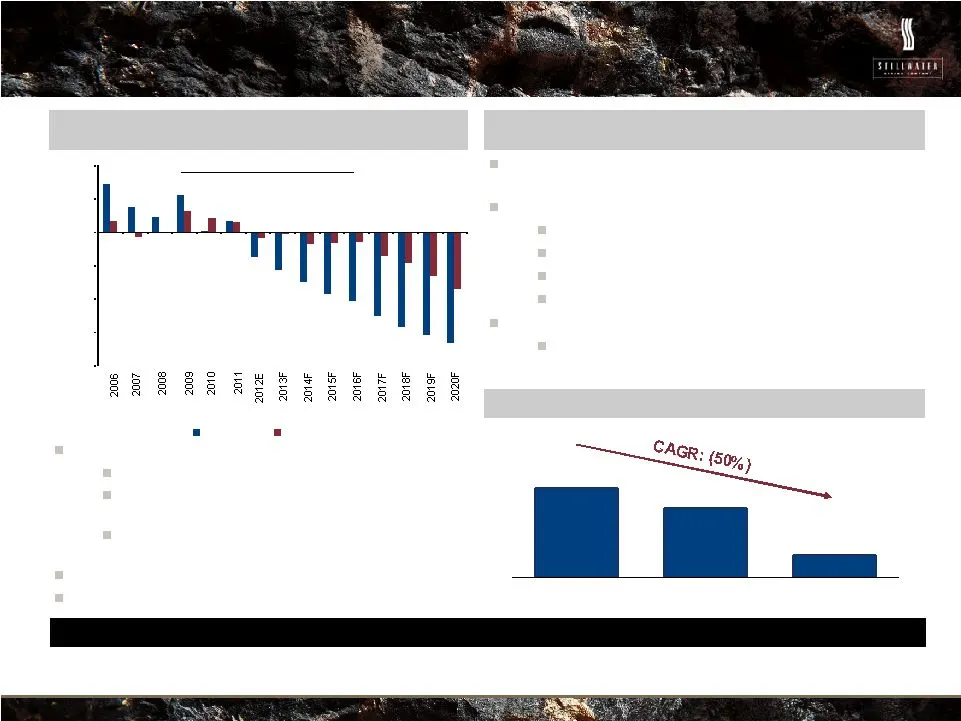
Slide 11: 2018F 2019F 2020F
2018F 2019F 2020F
Slide 12: Mining Company
MINING COMPANY
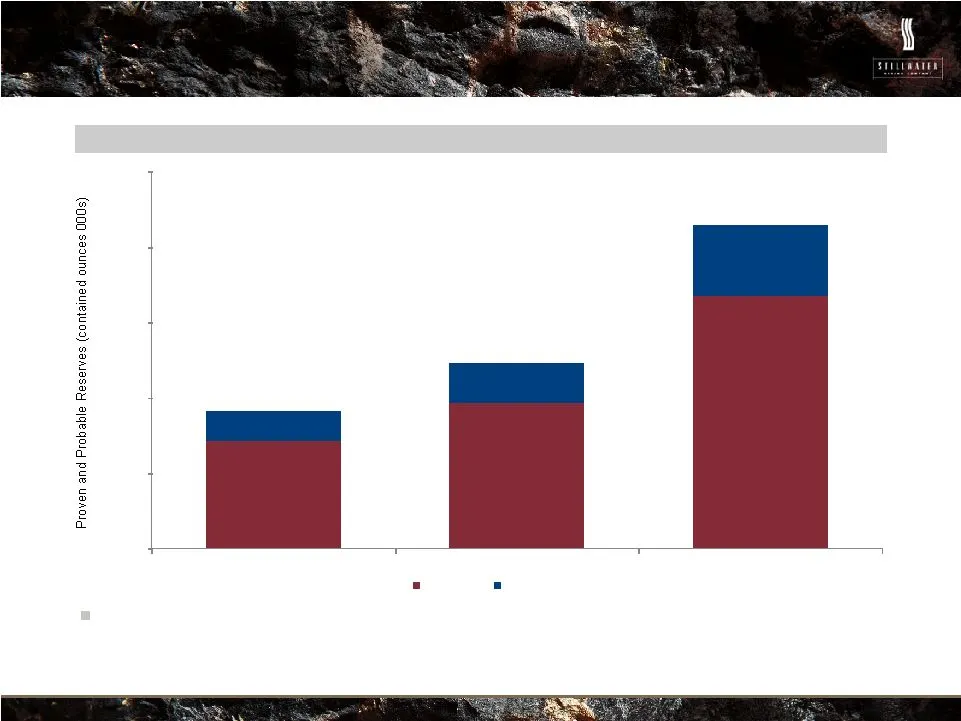
Slide 13: Proven and probable reserves (000 contained ounces)
=: (e000 seauno paurejuoa) saaiasay aigeqoig pue andi,
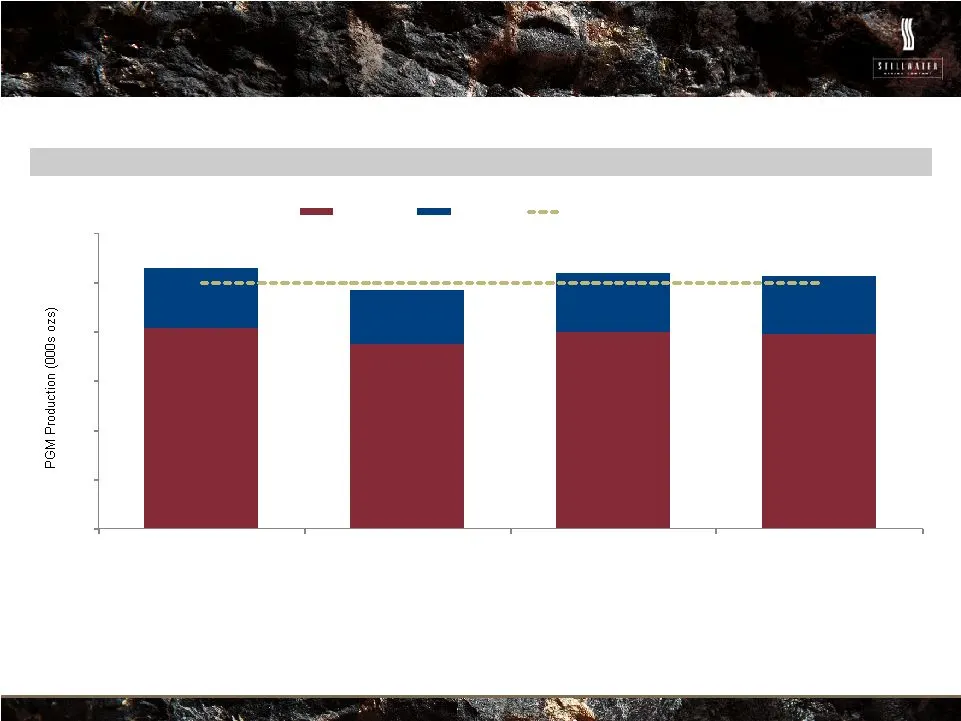
Slide 14: PGM Production
(620 9909) uonanpoug Od
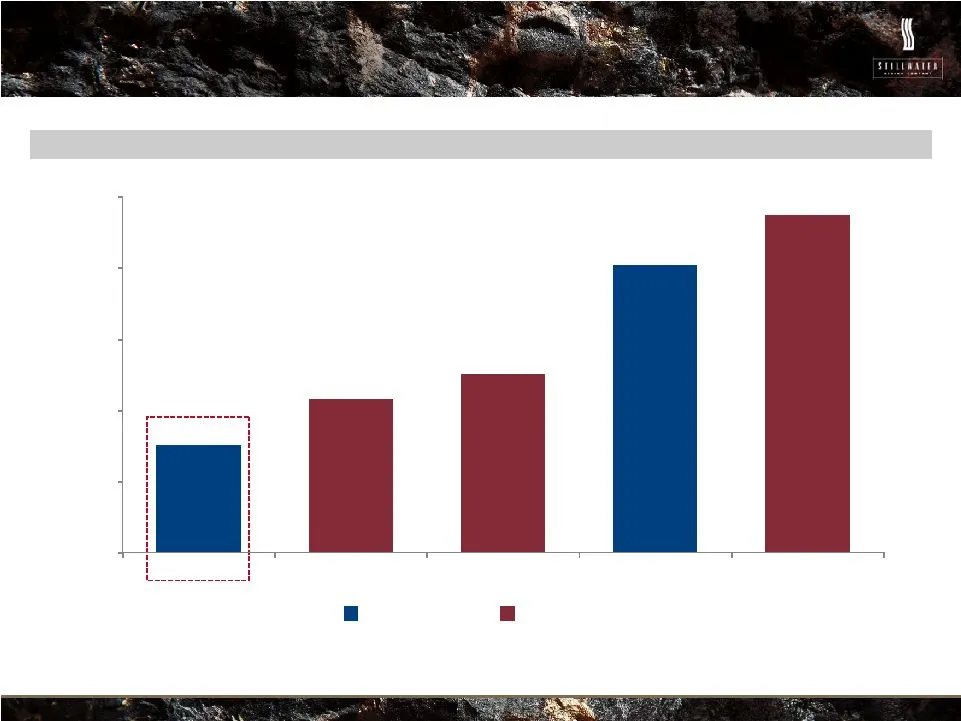
Slide 15
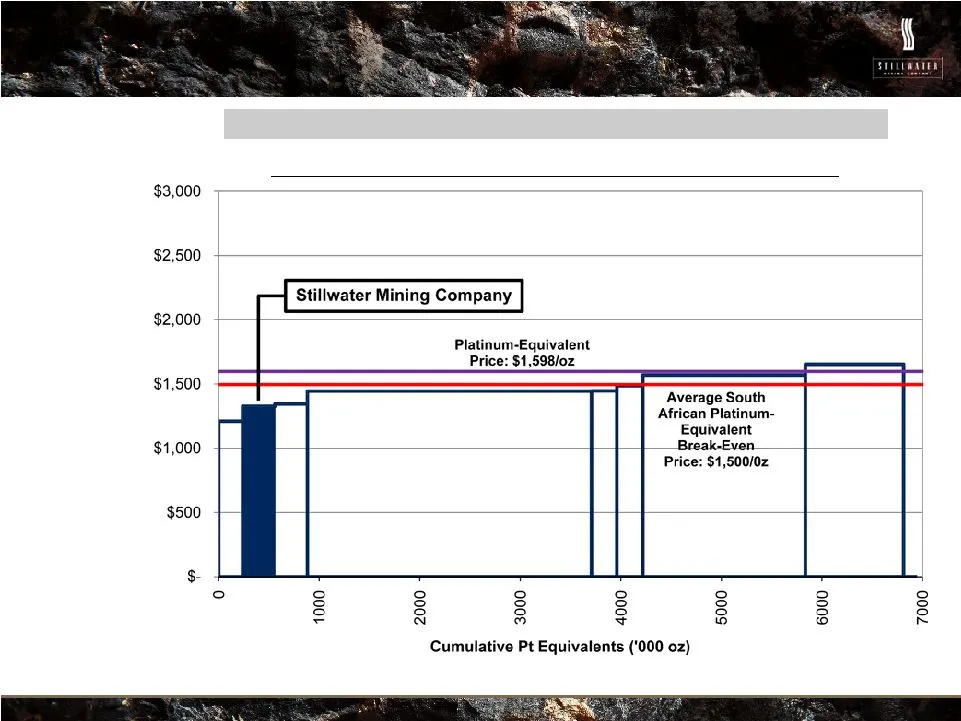
Slide 16: Average South African platinum-equivalent break-even price
$3,000 $2,500 $2,000 $1,500 $1,000 { Average South African Platinum- Equivalent Break-Even. Price: $1,500/0z 3000 4000 5000 6000 7000 Cumulative Pt Equivalents ('000 oz)
Slide 17: Montana Operations
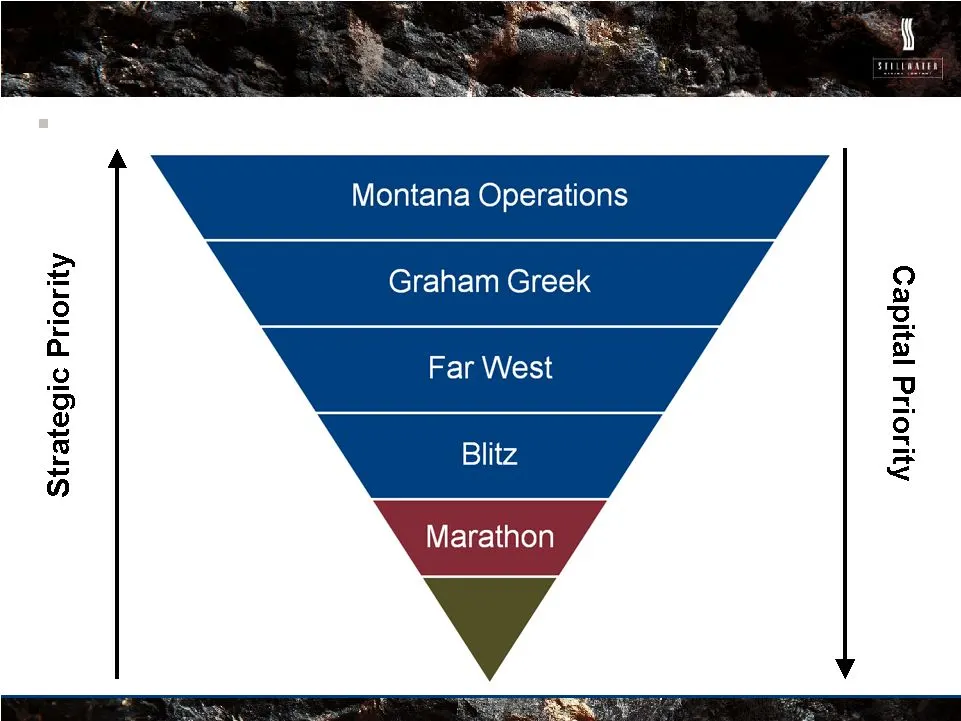
Montana Operations Graham Greek Strategic Priority Ayoud jeyideo
Slide 18: PGM Production (000 ozs)
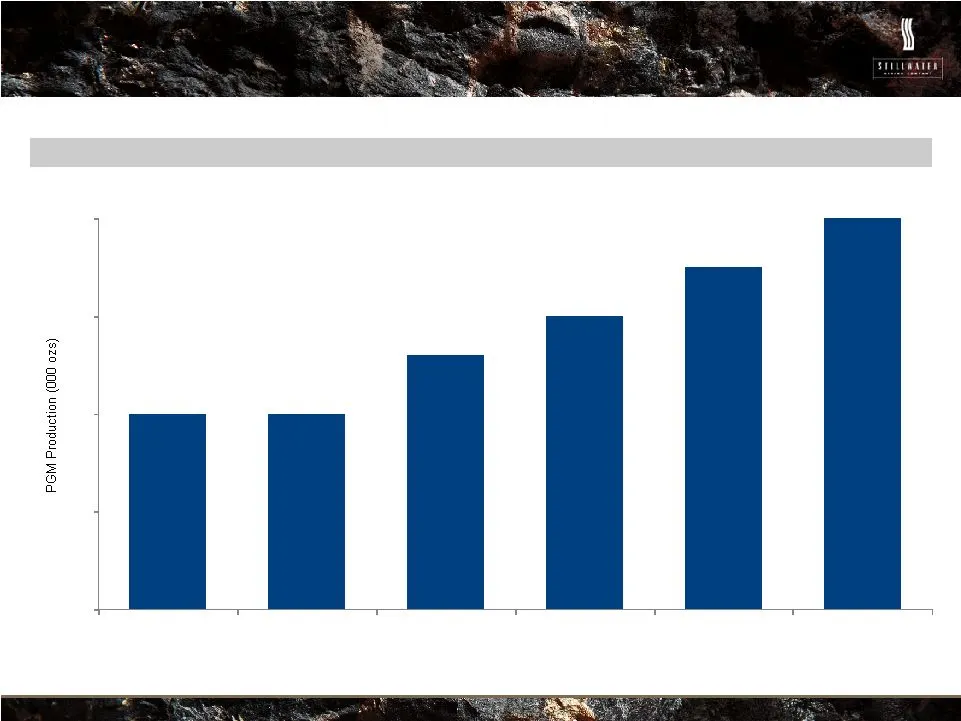
PGM Production (000 ozs)
Slide 19
Slide 20
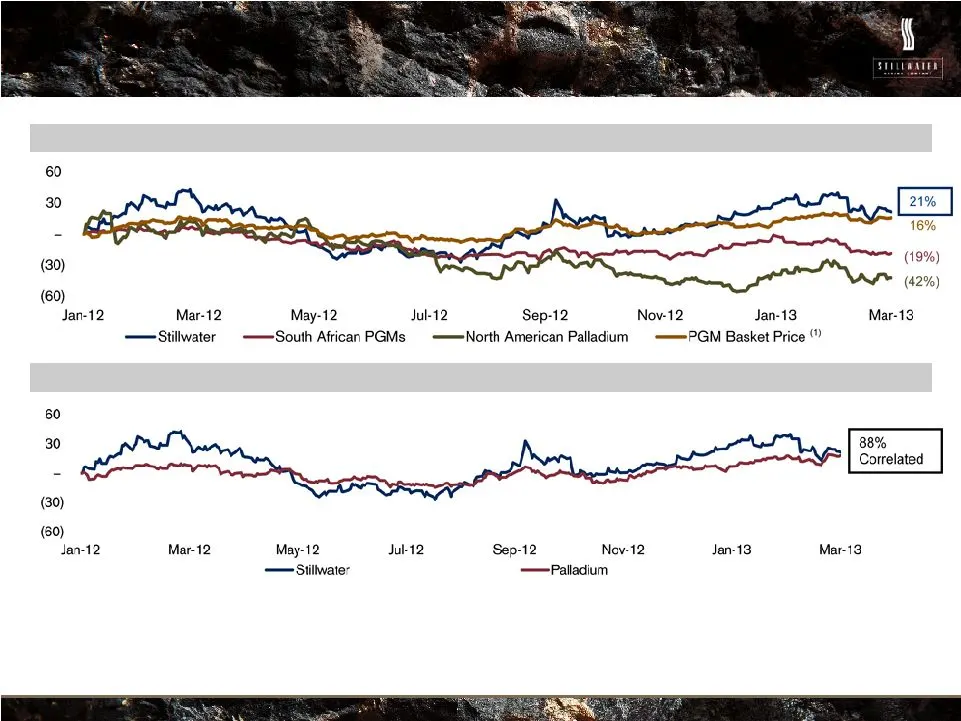
Slide 21: Share price performance versus peers
{ 60 30 21% . 16% (30) (19%) (42%) (60) Jan-12 Mar-12 May-12 Juk12 Sep-12 Nov-12 Jan-13 Mar-13 Stillwater ~——South African PGMs = ——=North American Palladium = ——=PGM Basket Price 60 30 (30) (80) Jant2 Mar-12 May-12 Juk12 Sep-12 Nov-12 Jen-13 Mar-19 —Siilwate —Palladium
Slide 22: {
{
Slide 23
Slide 24
Slide 25
Source: SEC EDGAR · DEFA14A filed Mar 21, 2013
More decks from Stillwater Mining Company
 FY2016 Earnings Presentation34 slides · Feb 23, 2017
 Merger or Acquisition (February 2017)51 slides · Feb 15, 2017
 Merger or Acquisition (February 2017)46 slides · Feb 3, 2017
 Merger or Acquisition (December 2016)35 slides · Dec 13, 2016
 Merger or Acquisition (December 2016)44 slides · Dec 12, 2016
 RBC Global Mining & Materials Conference 201642 slides · Jun 15, 2016