Premier Financial — First Defiance Financial — Raymond James U.S. Bank Conference September 2017
45 slides from Premier Financial's conference presentation, Sep 6, 2017

Slide 1: Raymond James U.S. Bank Conference September 2017
Raymond James U.S. Bank Conference September 2017 Donald P. Hileman President & CEO Kevin T. Thompson Executive Vice President & CFO
Slide 2: Forward Looking Statements
Forward Looking Statements The issuer has filed a registration statement including a prospectus, and will file a related supplement with the Securities and Exchange Commission (“SEC”), for the offering to which this communication relates. Before you invest, you should read the prospectus, the prospe
Slide 3: Non-GAAP Financial Measures
Non - GAAP Financial Measures The slides in this presentation contain non - GAAP financial measures. For purposes of Regulation G, a non - GAAP financial measure is a numerical measure of the registrant's historical or future financial performance, financial position or cash flows that excludes amou
Slide 4: Company Overview
Company Overview 4
Slide 5: Company Profile
Company Profile Our unwavering focus for over 90 years: Community Financial Services • Consolidated Assets of $2.9 billion (6/30/17) • First Federal Bank of the Midwest • 42 banking centers in 3 states; numerous ATM locations • Planned opening new branch in Sylvania, OH, December 2017 • Trust & Weal
Slide 6: Investment Highlights
Investment Highlights • Community leaders with deep roots in the communities we have served since the 1920s • Experienced and disciplined management team • Strong tangible capital levels • Stable core deposit base, changing mix • Historically stable and strong net interest margin • Strong and divers
Slide 7: Executive Leadership
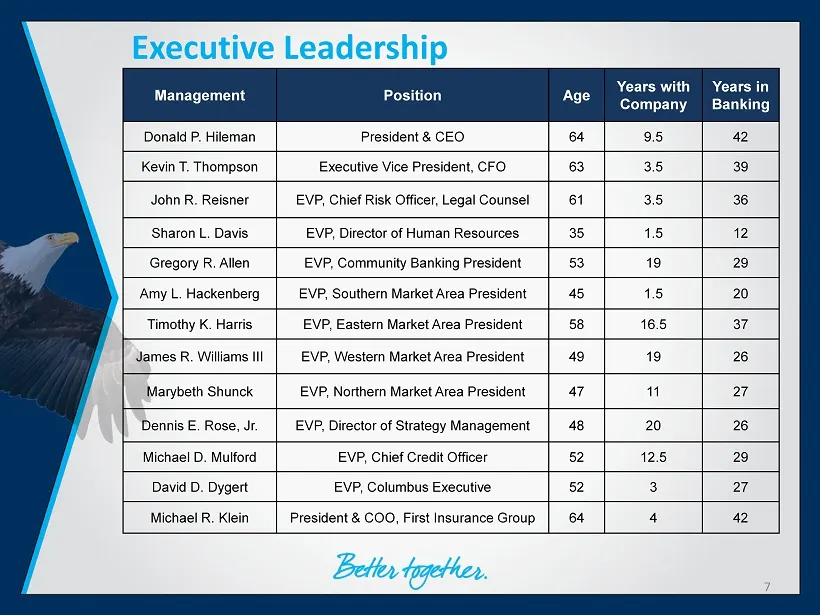
Executive Leadership 7 Management Position Age Years with Company Years in Banking Donald P. Hileman President & CEO 64 9.5 42 Kevin T. Thompson Executive Vice President, CFO 63 3.5 39 John R. Reisner EVP, Chief Risk Officer, Legal Counsel 61 3.5 36 Sharon L. Davis EVP, Director of Human Resources 3
Slide 8: The First Defiance Market
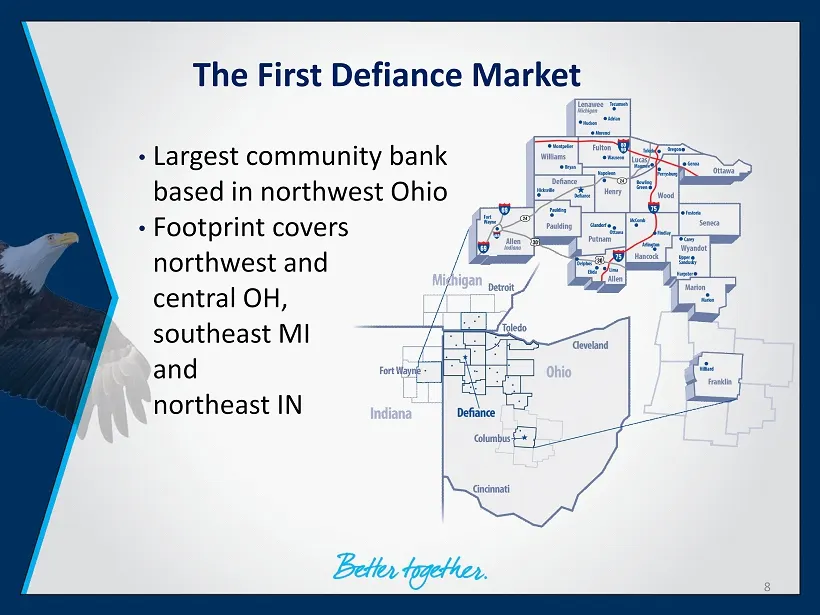
• Largest community bank based in northwest Ohio • Footprint covers northwest and c entral OH, southeast MI and northeast IN The First Defiance Market 8
Slide 9: Our Footprint – Local Economy
Our Footprint – Local Economy • Fort to Port Growth Corridor • Fort Wayne, IN to Toledo, OH • Economic activity – expansion of transportation • Logistics projects linked to our transportation • Railroad • Regional distribution centers • Food processing and production • Market area unemployment consi
Slide 10: Strategic Focus
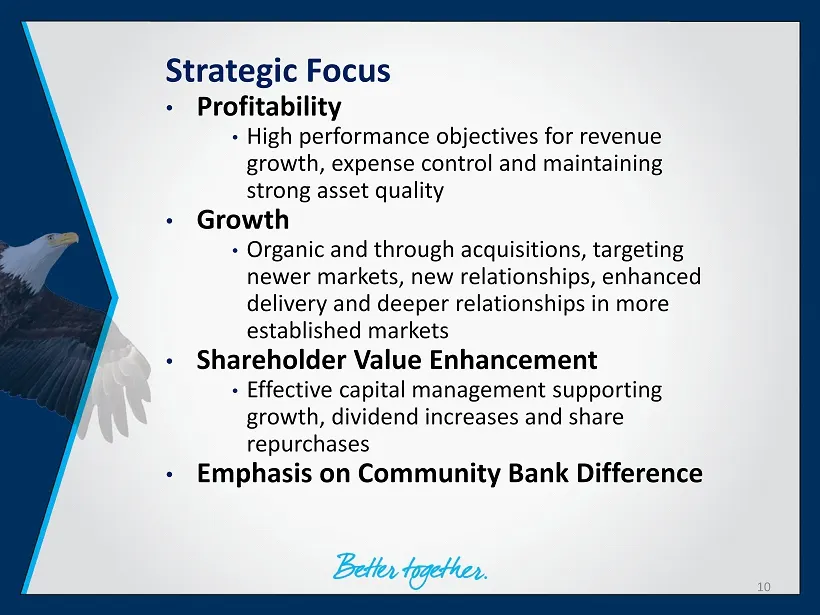
Strategic Focus • Profitability • High performance objectives for revenue growth, expense control and maintaining strong asset quality • Growth • Organic and through acquisitions, targeting newer markets, new relationships, enhanced delivery and deeper relationships in more established markets • Sha
Slide 11: Consistent Profitability
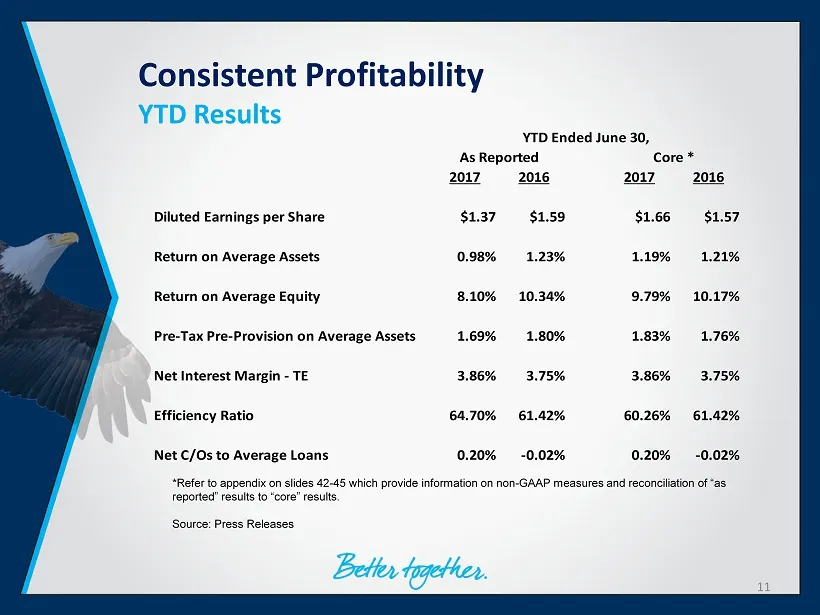
Consistent Profitability YTD Results *Refer to appendix on slides 42 - 45 which provide information on non - GAAP measures and reconciliation of “as reported” results to “core” results. Source : Press Releases 11 2017 2016 2017 2016 Diluted Earnings per Share $1.37 $1.59 $1.66 $1.57 Return on Averag
Slide 12: Strong Sales & Service Delivery
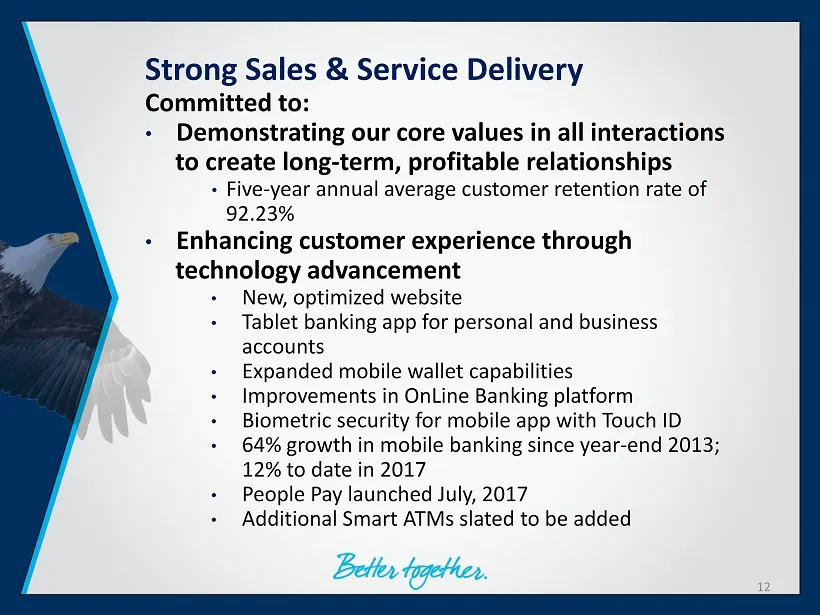
Strong Sales & Service Delivery Committed to: • Demonstrating our core values in all interactions to create long - term, profitable relationships • Five - year annual average customer retention rate of 92.23% • Enhancing customer experience through technology advancement • New, optimized website • T
Slide 13: Strong Sales & Service Delivery
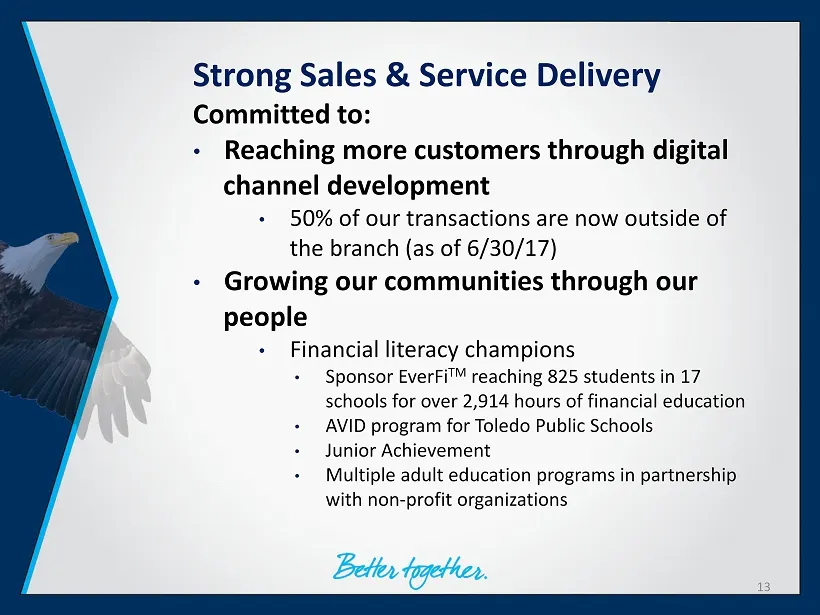
Strong Sales & Service Delivery Committed to: • Reaching more customers through digital channel development • 50% of our transactions are now outside of the branch (as of 6/30/17) • Growing our communities through our people • Financial literacy champions • Sponsor EverFi TM reaching 825 students in
Slide 14: Earned Market Share
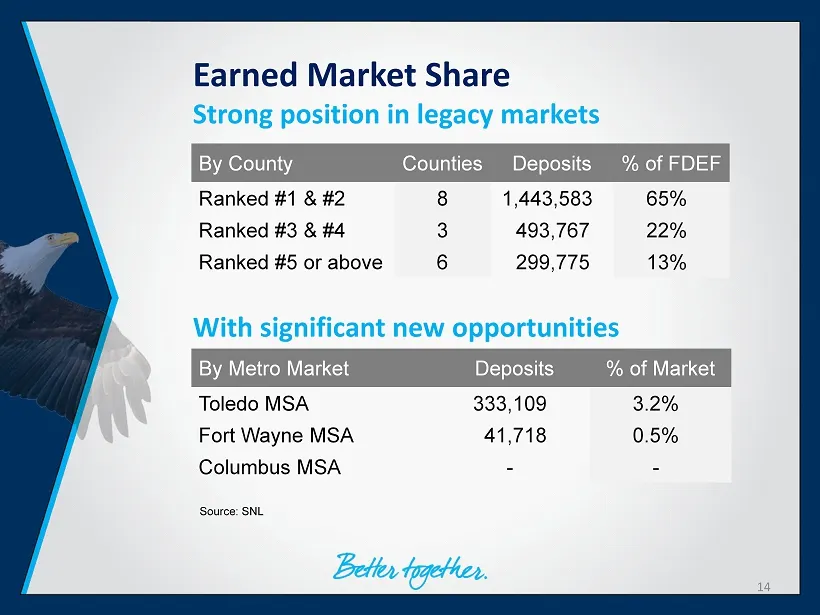
Earned Market Share Strong position in legacy markets With significant new opportunities Source: SNL By County Counties Deposits % of FDEF Ranked #1 & #2 8 1,443,583 65% Ranked #3 & #4 3 493,767 22% Ranked #5 or above 6 299,775 13% By Metro Market Deposits % of Market Toledo MSA 333,109 3.2% Fort Wa
Slide 15: Emerging Growth Profile
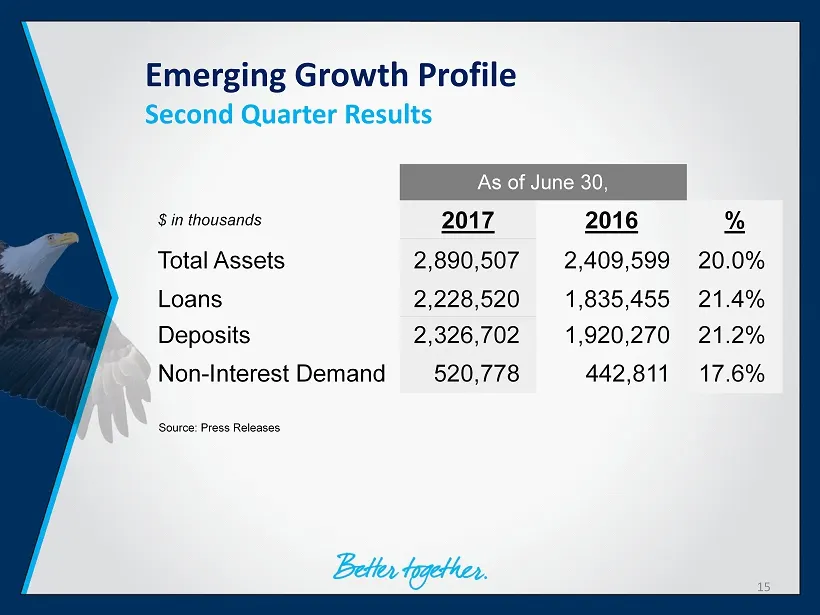
Emerging Growth Profile Second Quarter Results Source: Press Releases As of June 30, $ in thousands 2017 2016 % Total Assets 2,890,507 2,409,599 20.0% Loans 2,228,520 1,835,455 21.4% Deposits 2,326,702 1,920,270 21.2% Non - Interest Demand 520,778 442,811 17.6% 15
Slide 16: Strong Shareholder Returns
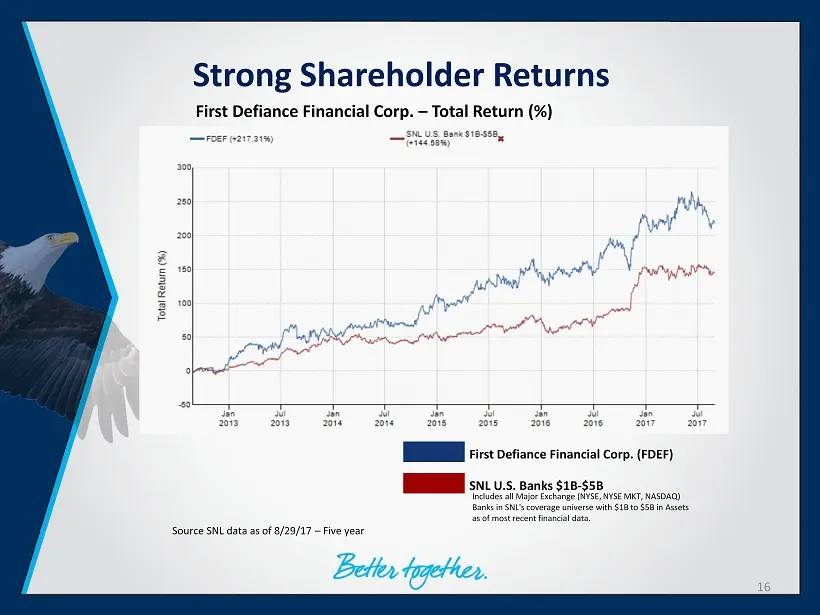
Strong Shareholder Returns Source SNL data as of 8/29/17 – Five year First Defiance Financial Corp. – Total Return (%) First Defiance Financial Corp. (FDEF) SNL U.S. Banks $1B - $5B Includes all Major Exchange (NYSE, NYSE MKT, NASDAQ) Banks in SNL's coverage universe with $1B to $5B in Assets as of
Slide 17: Talent Development, M&A, Organic Growth, Client Experience
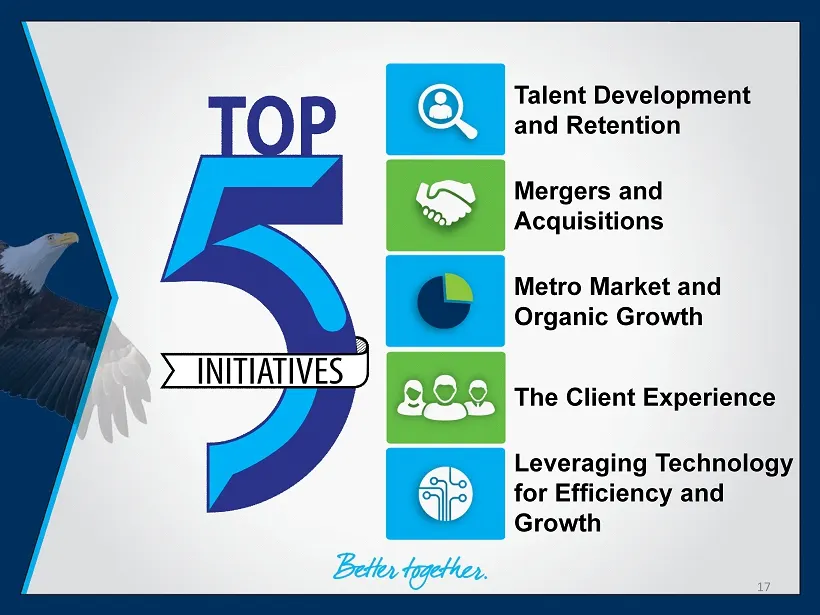
Talent Development and Retention Mergers and Acquisitions Metro Market and Organic Growth The Client Experience Leveraging Technology for Efficiency and Growth 17
Slide 18: Financial Highlights
Financial Highlights 18
Slide 19: Net Income & Earnings Per Share
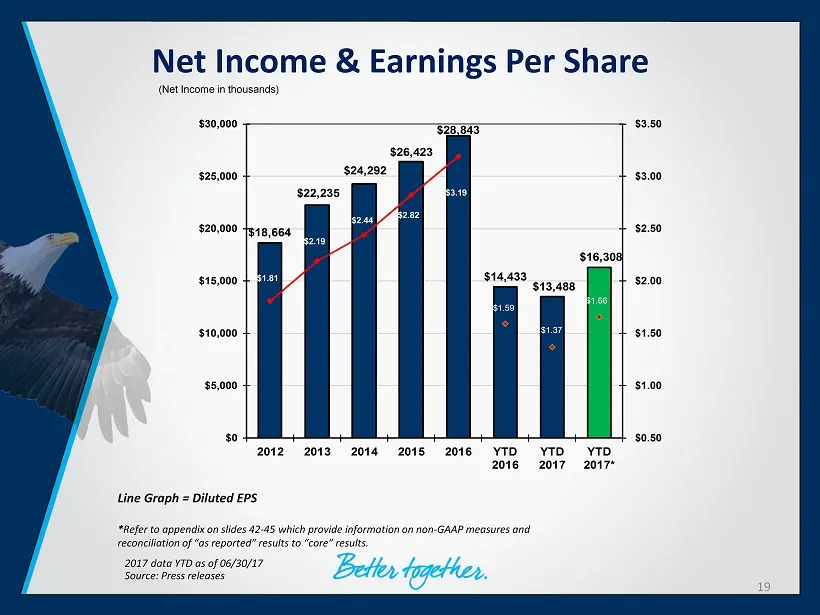
Net Income & Earnings Per Share Source : Press releases 2017 data YTD as of 06/30/17 $18,664 $22,235 $24,292 $26,423 $28,843 $14,433 $13,488 $16,308 $1.81 $2.19 $2.44 $2.82 $3.19 $1.59 $1.37 $1.66 $0.50 $1.00 $1.50 $2.00 $2.50 $3.00 $3.50 $0 $5,000 $10,000 $15,000 $20,000 $25,000 $30,000 2012 2013 2
Slide 20: Total Assets & Return on Assets
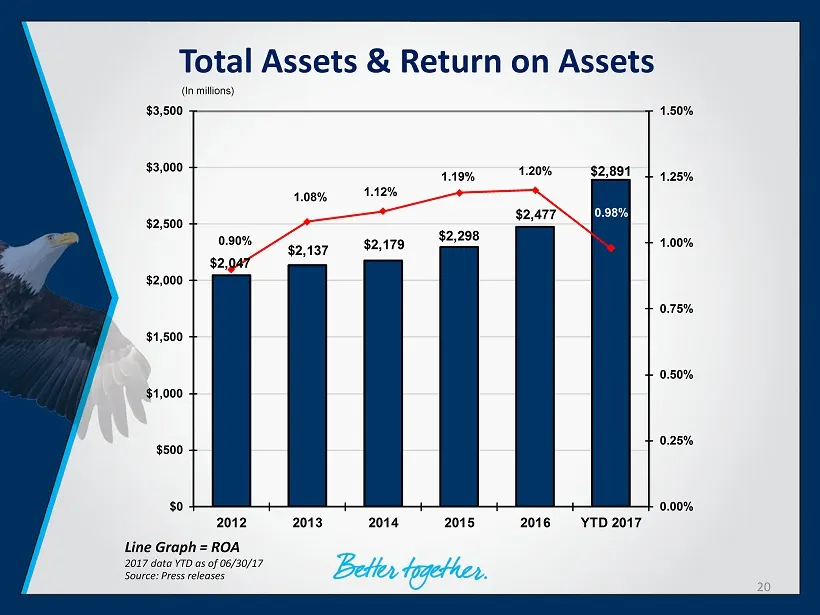
Total Assets & Return on Assets Source : Press releases 2017 data YTD as of 06/30/17 Line Graph = ROA $2,047 $2,137 $2,179 $2,298 $2,477 $2,891 0.90% 1.08% 1.12% 1.19% 1.20% 0.98% 0.00% 0.25% 0.50% 0.75% 1.00% 1.25% 1.50% $0 $500 $1,000 $1,500 $2,000 $2,500 $3,000 $3,500 2012 2013 2014 2015 2016 YTD
Slide 21: Loan Portfolio Composition
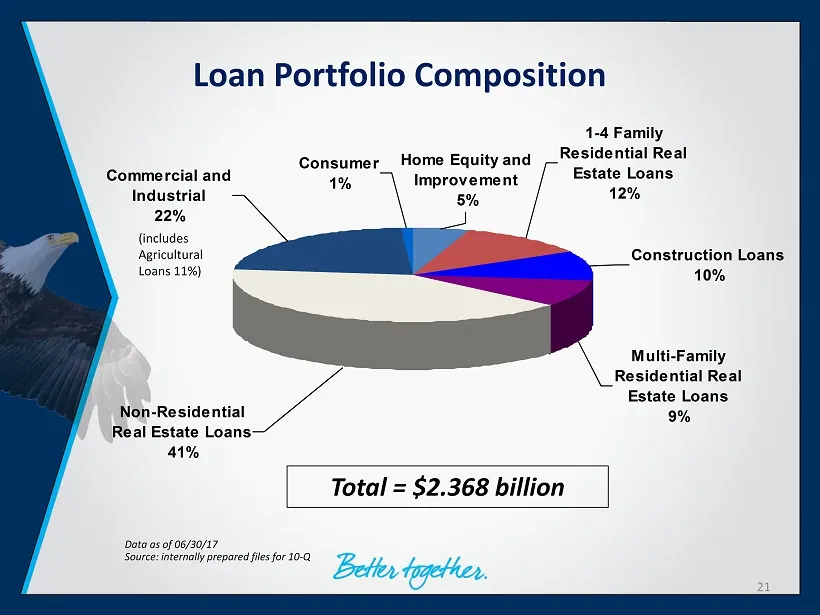
Commercial and Industrial 22% Non-Residential Real Estate Loans 41% Multi-Family Residential Real Estate Loans 9% Consumer 1% Construction Loans 10% 1-4 Family Residential Real Estate Loans 12% Home Equity and Improvement 5% Loan Portfolio Composition Source : internally prepared files for 10 - Q Da
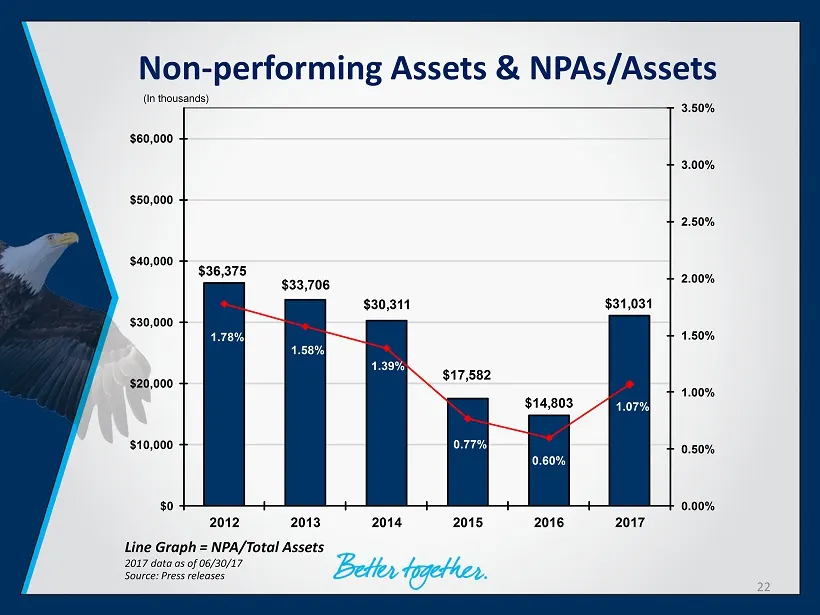
Slide 22: Non-performing Assets & NPAs/Assets
Non - performing Assets & NPAs/Assets Source : Press releases 2017 data as of 06/30/17 Line Graph = NPA/Total Assets $36,375 $33,706 $30,311 $17,582 $14,803 $31,031 1.78% 1.58% 1.39% 0.77% 0.60% 1.07% 0.00% 0.50% 1.00% 1.50% 2.00% 2.50% 3.00% 3.50% $0 $10,000 $20,000 $30,000 $40,000 $50,000 $60,000
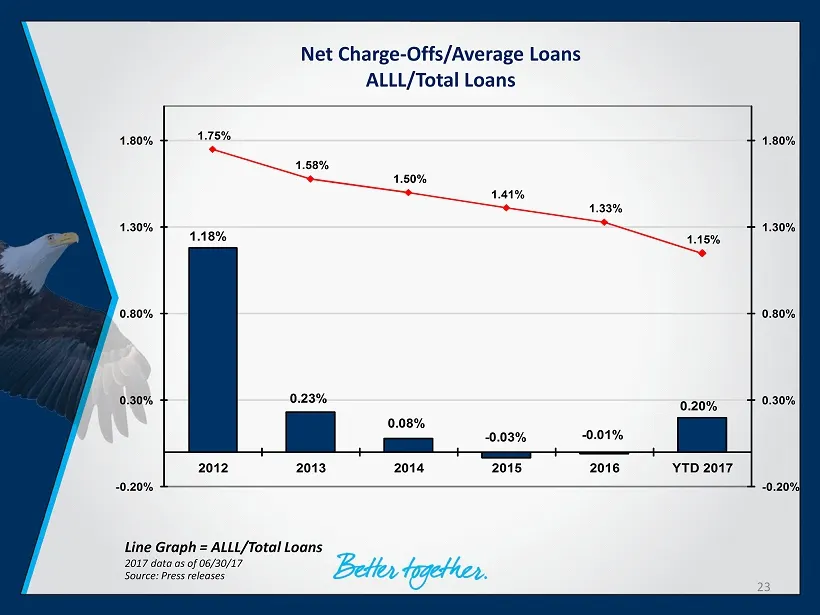
Slide 23: Net Charge-Offs/Average Loans, ALLL/Total Loans
Net Charge - Offs/Average Loans ALLL/Total Loans Source : Press releases 2017 data as of 06/30/17 Line Graph = ALLL/Total Loans 1.18% 0.23% 0.08% - 0.03% - 0.01% 0.20% 1.75% 1.58% 1.50% 1.41% 1.33% 1.15% -0.20% 0.30% 0.80% 1.30% 1.80% -0.20% 0.30% 0.80% 1.30% 1.80% 2012 2013 2014 2015 2016 YTD 2017
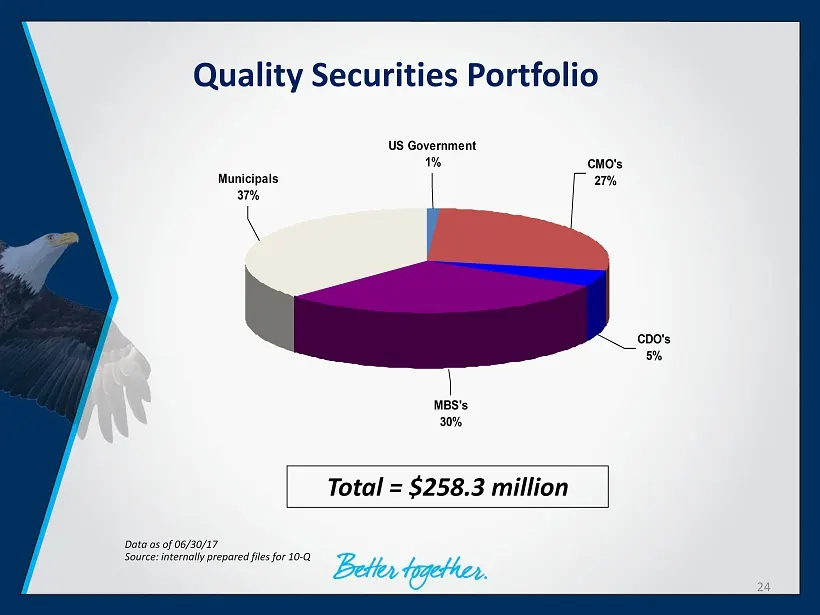
Slide 24: Quality Securities Portfolio
Quality Securities Portfolio Source : internally prepared files for 10 - Q Data as of 06/30/17 Total = $258.3 million US Government 1% CMO's 27% CDO's 5% MBS's 30% Municipals 37% 24
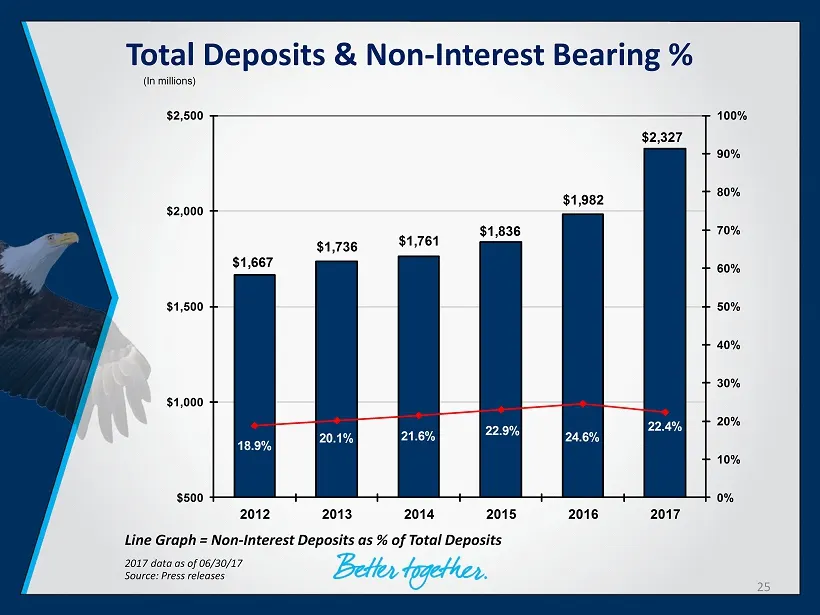
Slide 25: Total Deposits & Non-Interest Bearing %
Total Deposits & Non - Interest Bearing % Source : Press releases 2017 data as of 06/30/17 Line Graph = Non - Interest Deposits as % of Total Deposits $1,667 $1,736 $1,761 $1,836 $1,982 $2,327 20.1% 22.4% 18.9% 21.6% 22.9% 24.6% 0% 10% 20% 30% 40% 50% 60% 70% 80% 90% 100% $500 $1,000 $1,500 $2,000 $
Slide 26: Deposit Base Composition
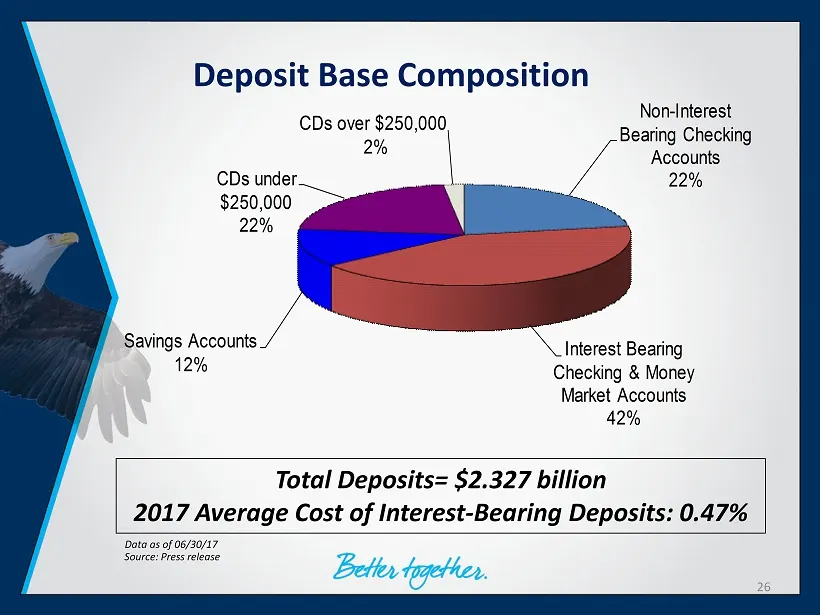
Non - Interest Bearing Checking Accounts 22% Interest Bearing Checking & Money Market Accounts 42% Savings Accounts 12% CDs under $250,000 22% CDs over $250,000 2% Deposit Base Composition Source : Press release Data as of 06/30/17 Total Deposits= $2.327 billion 2017 Average Cost of Interest - Beari
Slide 27: Capital Levels
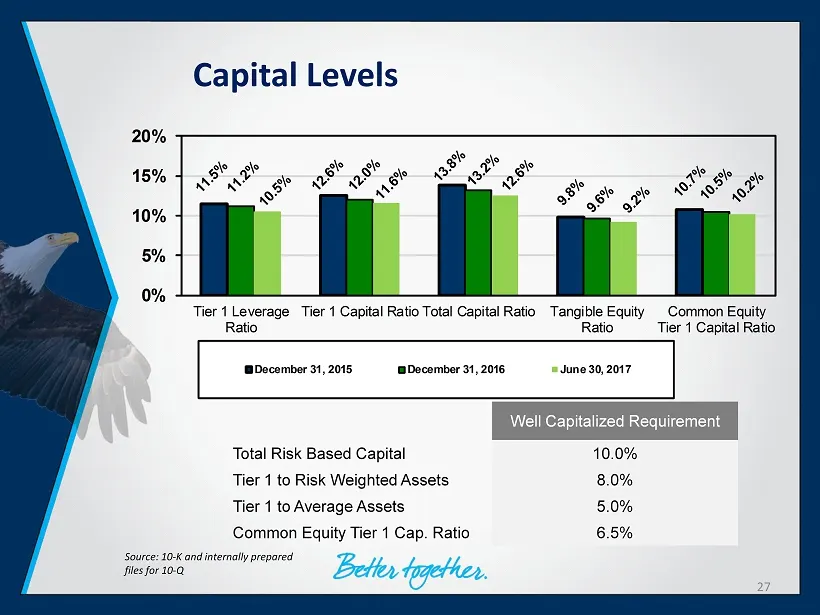
Capital Levels Source : 10 - K and internally prepared files for 10 - Q 0% 5% 10% 15% 20% Tier 1 Leverage Ratio Tier 1 Capital Ratio Total Capital Ratio Tangible Equity Ratio Common Equity Tier 1 Capital Ratio December 31, 2015 December 31, 2016 June 30, 2017 Well Capitalized Requirement Total Risk
Slide 28: Net Interest Income & Margin
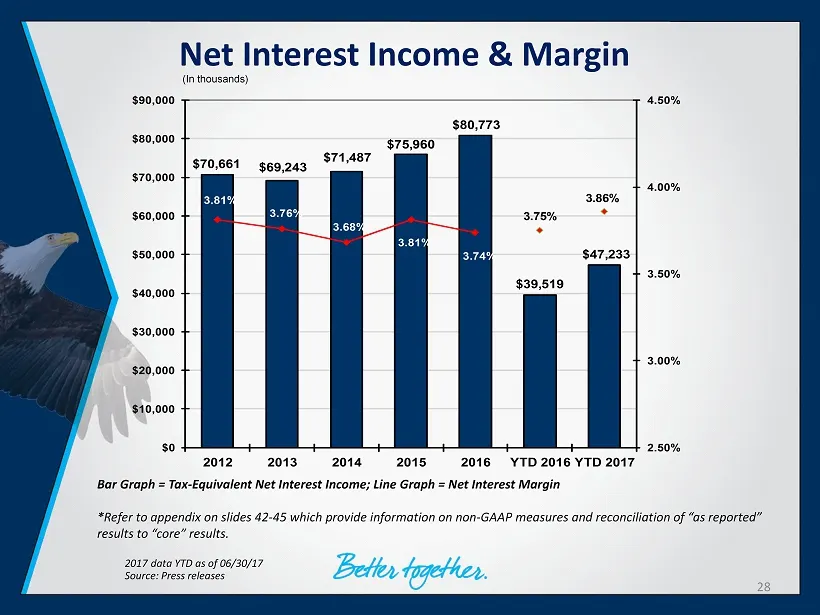
Net Interest Income & Margin Source : Press releases 2017 data YTD as of 06/30/17 Bar Graph = Tax - Equivalent Net Interest Income; Line Graph = Net Interest Margin * Refer to appendix on slides 42 - 45 which provide information on non - GAAP measures and reconciliation of “as reported” results to “
Slide 29: Non-Interest Income & Percent of Total Revenue
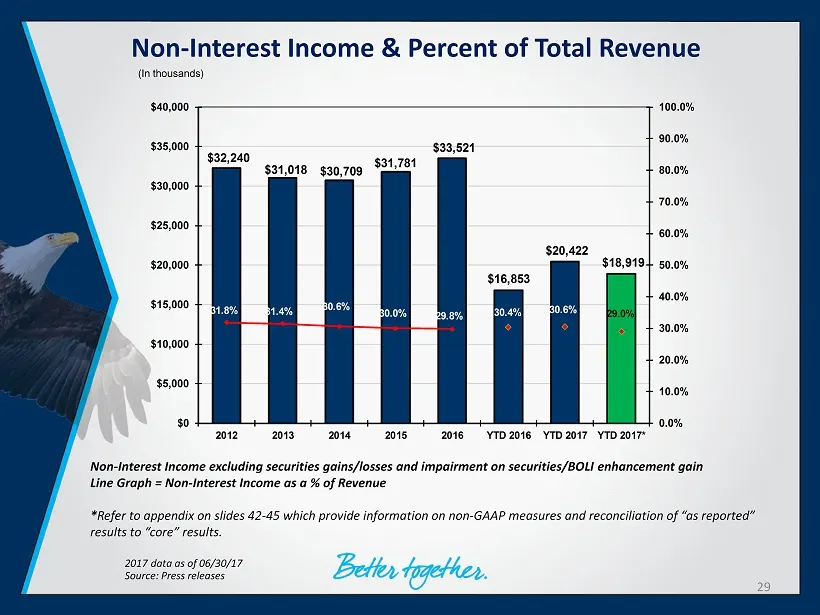
Non - Interest Income & Percent of Total Revenue Source : Press releases 2017 data as of 06/30/17 Non - Interest Income excluding securities gains/losses and impairment on securities/BOLI enhancement gain Line Graph = Non - Interest Income as a % of Revenue * Refer to appendix on slides 42 - 45 whic
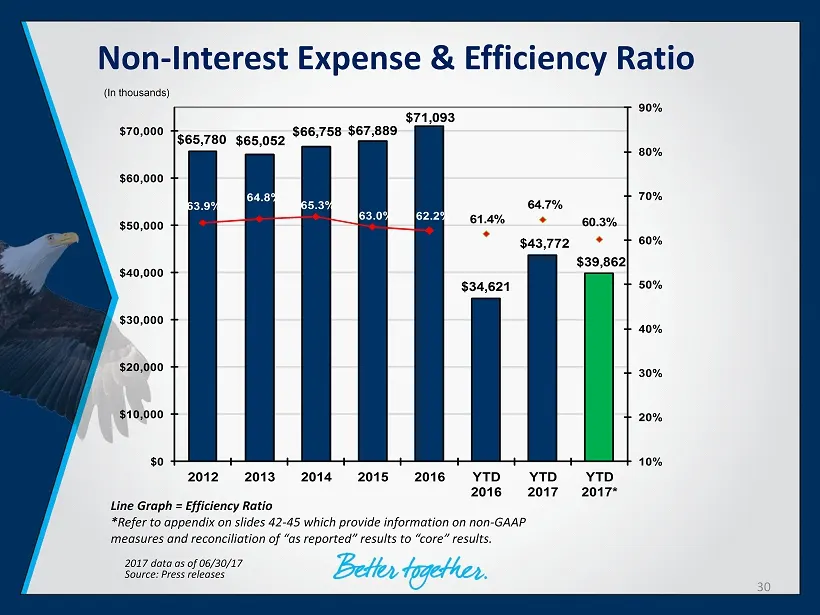
Slide 30: Non-Interest Expense & Efficiency Ratio
Non - Interest Expense & Efficiency Ratio Source : Press releases 2017 data as of 06/30/17 Line Graph = Efficiency Ratio * Refer to appendix on slides 42 - 45 which provide information on non - GAAP measures and reconciliation of “as reported” results to “core” results. $65,780 $65,052 $66,758 $67,8
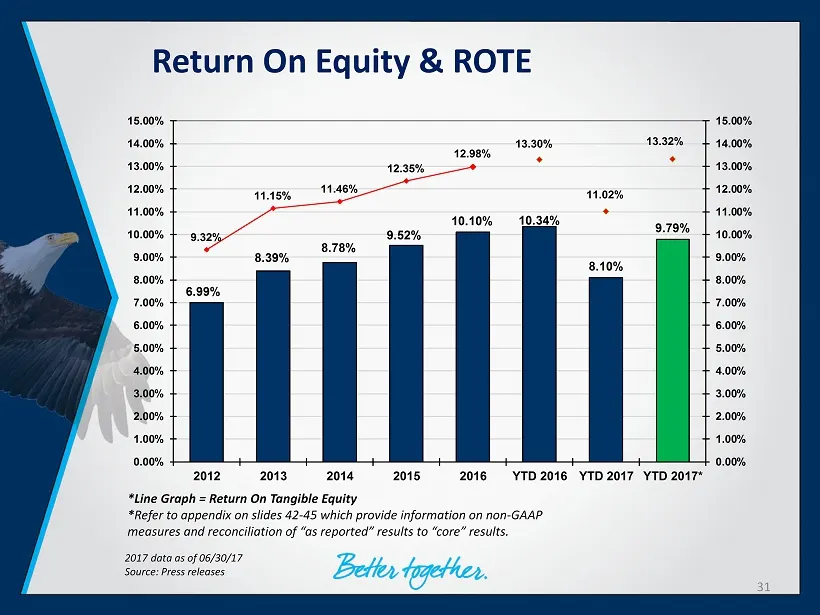
Slide 31: Return On Equity & ROTE
Return On Equity & ROTE Source : Press releases 2017 data as of 06/30/17 * Line Graph = Return On Tangible Equity * Refer to appendix on slides 42 - 45 which provide information on non - GAAP measures and reconciliation of “as reported” results to “core” results. 6.99% 8.39% 8.78% 9.52% 10.10% 10.34
Slide 32: Recent Mergers
Recent Mergers 32
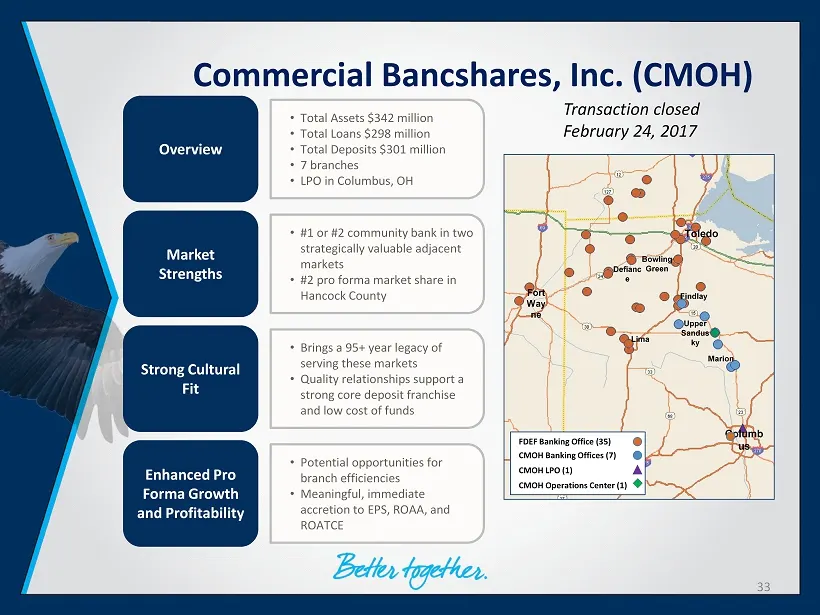
Slide 33: Commercial Bancshares, Inc. (CMOH) Overview
Commercial Bancshares, Inc. (CMOH) Overview Market Strengths Enhanced Pro Forma Growth and Profitability • Total Assets $342 million • Total Loans $298 million • Total Deposits $301 million • 7 branches • LPO in Columbus, OH • Potential opportunities for branch efficiencies • Meaningful, immediate a
Slide 34: Corporate One Benefits
• Founded 1996 and headquartered in Fostoria, OH with two satellite locations • Annual Commission Income of approximately $2.8 million • Specializes in Employee Benefit products to large accounts (> 100 lives) • Tailored product offerings to client needs including online enrollment and consulting pr
Slide 35: Shareholder Value
Shareholder Value 35
Slide 36: Maximizing Shareholder Value: EPS, Dividends and Stock Price
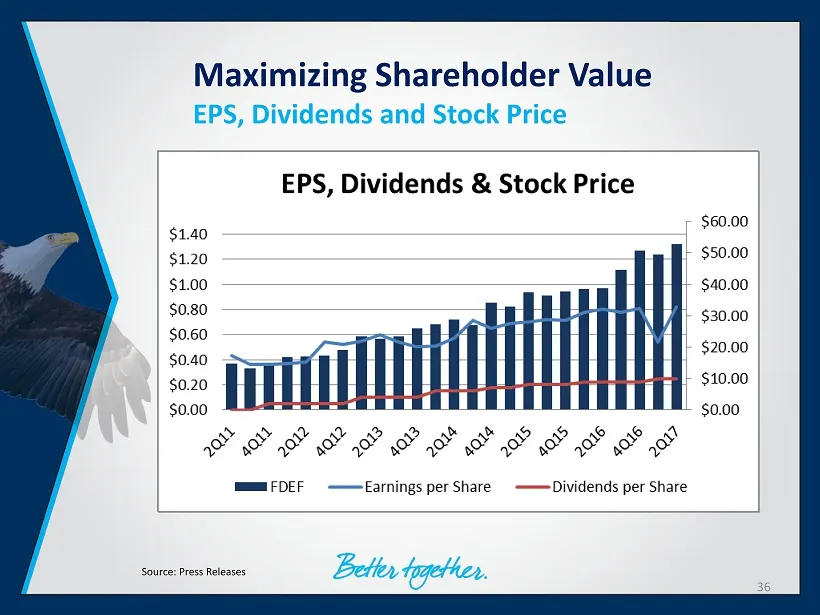
Maximizing Shareholder Value EPS, Dividends and Stock Price Source: Press Releases 36
Slide 37: Maximizing Shareholder Value
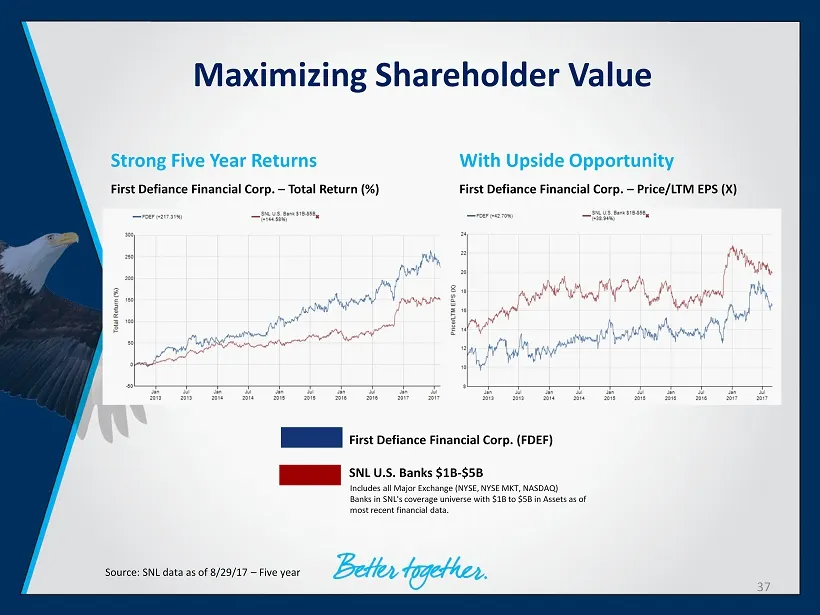
Maximizing Shareholder Value Source: SNL data as of 8/29/17 – Five year Strong Five Year Returns First Defiance Financial Corp. – Total Return (%) With Upside Opportunity First Defiance Financial Corp. – Price/LTM EPS (X) First Defiance Financial Corp. (FDEF) SNL U.S. Banks $1B - $5B Includes all Ma
Slide 38: Maximizing Shareholder Value: Investment Opportunity
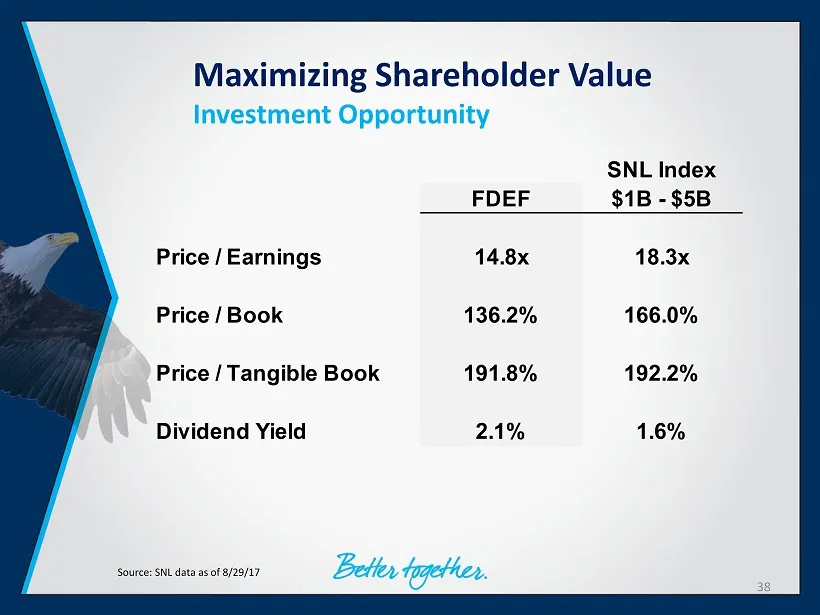
Maximizing Shareholder Value Investment Opportunity Source: SNL data as of 8/29/17 38 SNL Index FDEF $1B - $5B Price / Earnings 14.8x 18.3x Price / Book 136.2% 166.0% Price / Tangible Book 191.8% 192.2% Dividend Yield 2.1% 1.6%
Slide 39: Summary
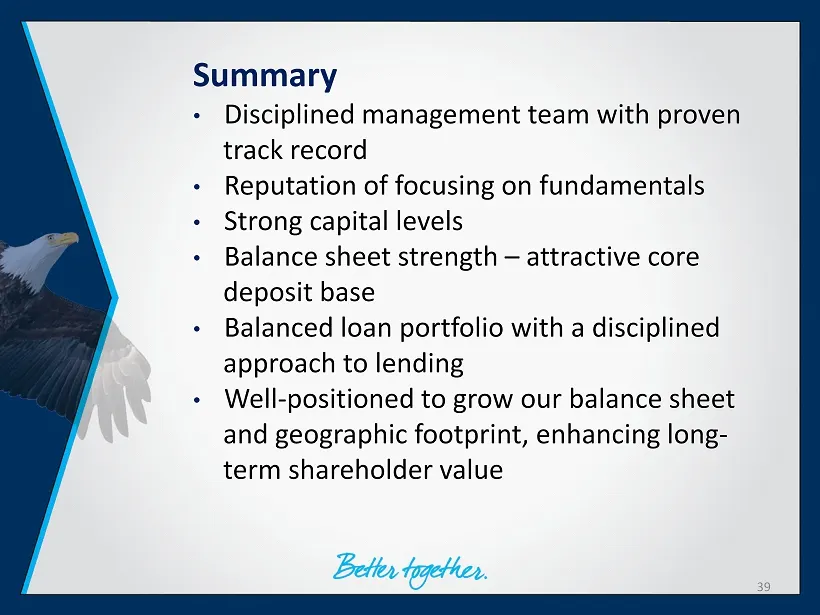
Summary • Disciplined management team with proven track record • Reputation of focusing on fundamentals • Strong capital levels • Balance sheet strength – attractive core deposit base • Balanced loan portfolio with a disciplined approach to lending • Well - positioned to grow our balance sheet and g

Slide 40: Thank you.
Thank you. Donald P. Hileman | President & CEO 419 - 785 - 2210 | dhileman@first - fed.com Kevin T. Thompson | Executive Vice President & CFO 419 - 783 - 1098 | kthompson@first - fed.com 40
Slide 41: Appendix
Appendix 41
Slide 42: Appendix – Non-GAAP Reconciliations
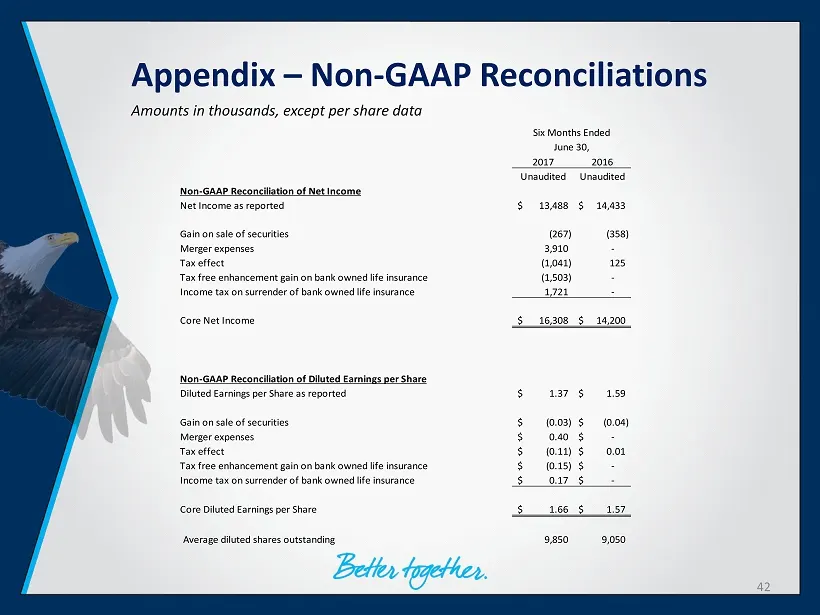
Appendix – Non - GAAP Reconciliations Amounts in thousands, except per share data 42 2017 2016 Unaudited Unaudited Non-GAAP Reconciliation of Net Income Net Income as reported 13,488$ 14,433$ Gain on sale of securities (267) (358) Merger expenses 3,910 - Tax effect (1,041) 125 Tax free enhancement g
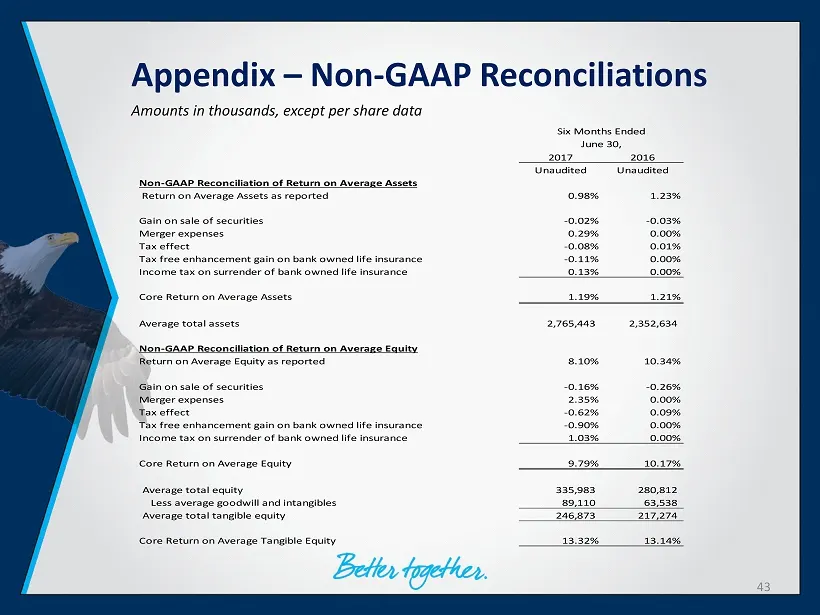
Slide 43: Appendix – Non-GAAP Reconciliations
Appendix – Non - GAAP Reconciliations Amounts in thousands, except per share data 43 2017 2016 Unaudited Unaudited Non-GAAP Reconciliation of Return on Average Assets Return on Average Assets as reported 0.98% 1.23% Gain on sale of securities -0.02% -0.03% Merger expenses 0.29% 0.00% Tax effect -0.0
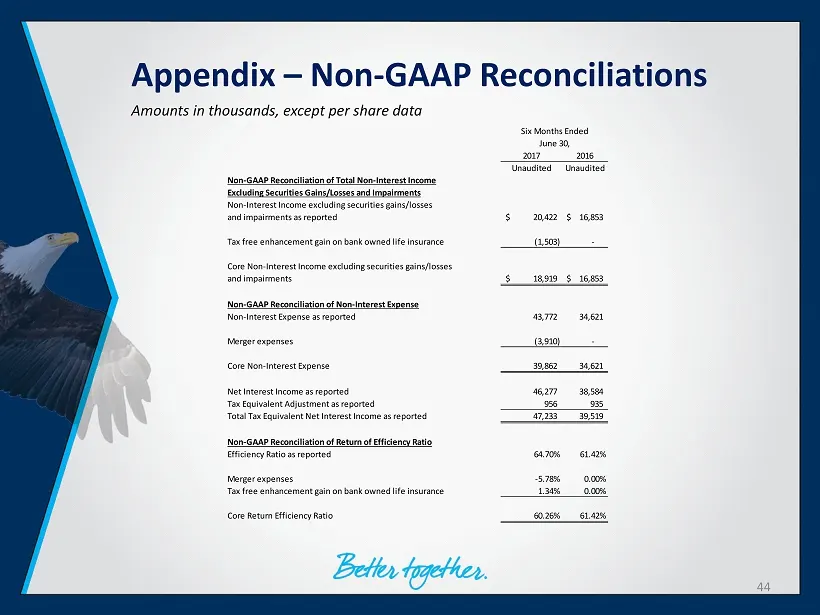
Slide 44: Appendix – Non-GAAP Reconciliations
Appendix – Non - GAAP Reconciliations Amounts in thousands, except per share data 44 2017 2016 Unaudited Unaudited Non-GAAP Reconciliation of Total Non-Interest Income Excluding Securities Gains/Losses and Impairments Non-Interest Income excluding securities gains/losses and impairments as reported
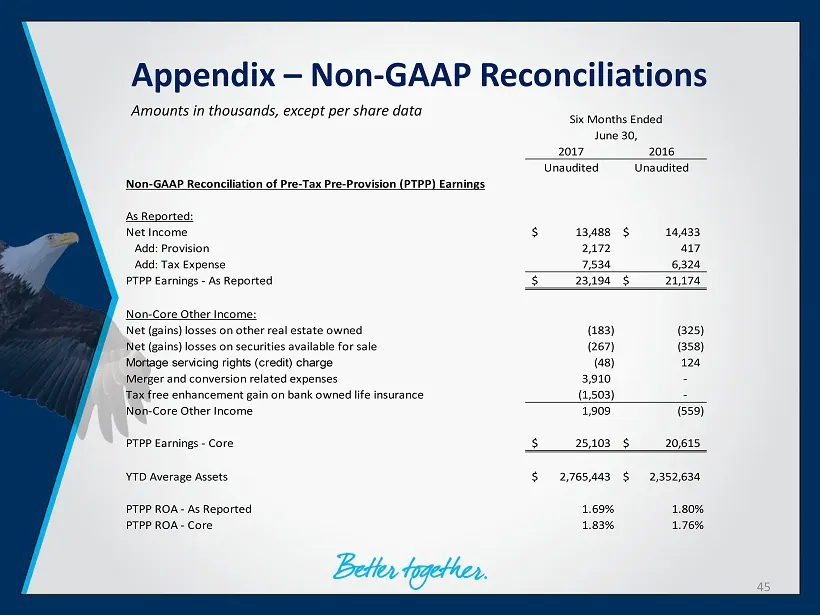
Slide 45: Appendix – Non-GAAP Reconciliations
Appendix – Non - GAAP Reconciliations Amounts in thousands, except per share data 45 2017 2016 Unaudited Unaudited Non-GAAP Reconciliation of Pre-Tax Pre-Provision (PTPP) Earnings As Reported: Net Income 13,488$ 14,433$ Add: Provision 2,172 417 Add: Tax Expense 7,534 6,324 PTPP Earnings - As Reporte
Source: SEC EDGAR · 8-K filed Sep 6, 2017
More decks from Premier Financial Corp
 Investor Presentation (February 2025)51 slides · Feb 10, 2025
 Q4 2024 Earnings Presentation23 slides · Jan 22, 2025
 Q3 2024 Earnings Presentation50 slides · Nov 6, 2024
 Q3 2024 Earnings Presentation22 slides · Oct 23, 2024
 Investor Presentation (August 2024)54 slides · Aug 30, 2024
 Merger or Acquisition (July 2024)39 slides · Jul 26, 2024