IMS Health — William Blair Growth Stock Conference 2015
28 slides from IMS Health's conference presentation, Jun 9, 2015
Slide 1: IMS Health
IMS Health Ron Bruehlman SVP & CFO June 9, 2015 IMS Health Confidential. (c) 2015 IMS Health Incorporated. 0 All Rights Reserved.
Slide 2: Legal
Legal Forward-Looking Statements This presentation includes “forward-looking statements.” The words “believes,” “expects,” “may,” “will” and similar expressions are intended to identify forward-looking statements, although not all forward-looking statements contain these identifying words. Forward-
Slide 3: Who We Are
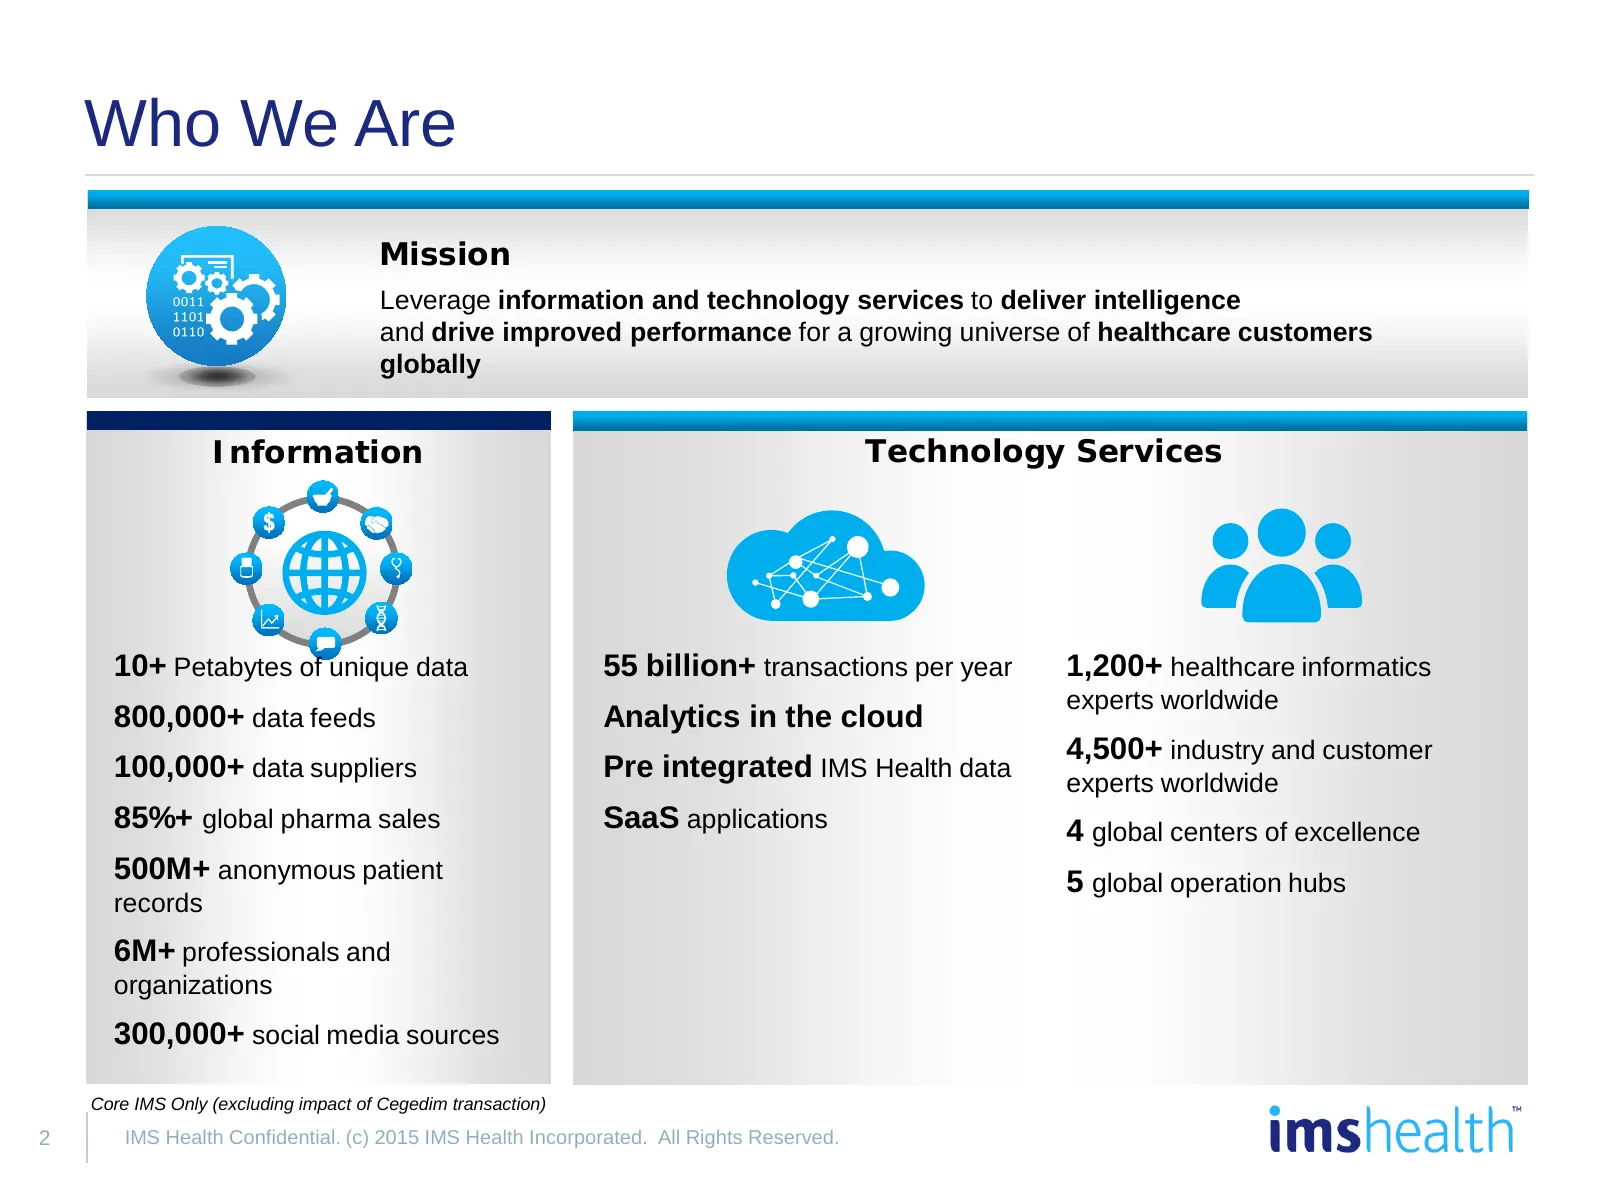
Who We Are Mission Leverage information and technology services to deliver intelligence and drive improved performance for a growing universe of healthcare customers globally Information Technology Services 10+ Petabytes of unique data 55 billion+ transactions per year 1,200+ healthcare informatics
Slide 4: Customers
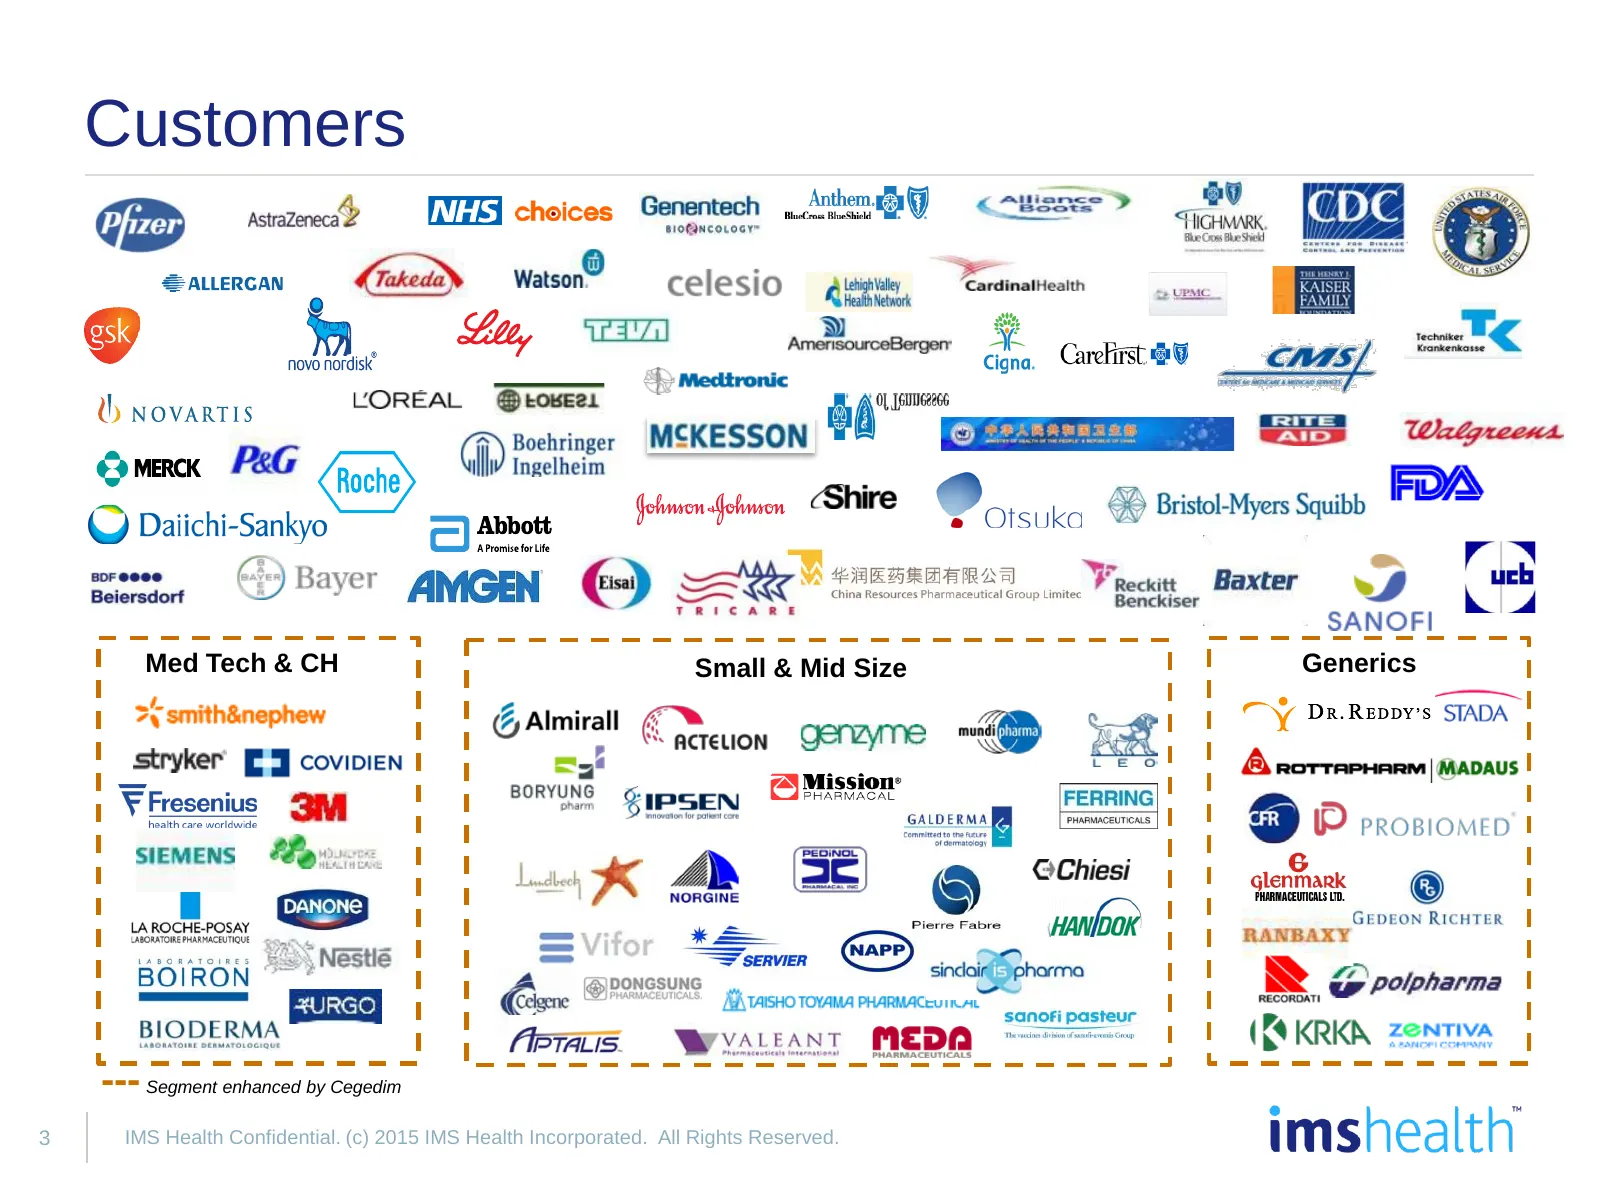
Customers Med Tech & CH Small & Mid Size Generics --- Segment enhanced by Cegedim 3 IMS Health Confidential. (c) 2015 IMS Health Incorporated. All Rights Reserved.
Slide 5: Addressing Customer Needs
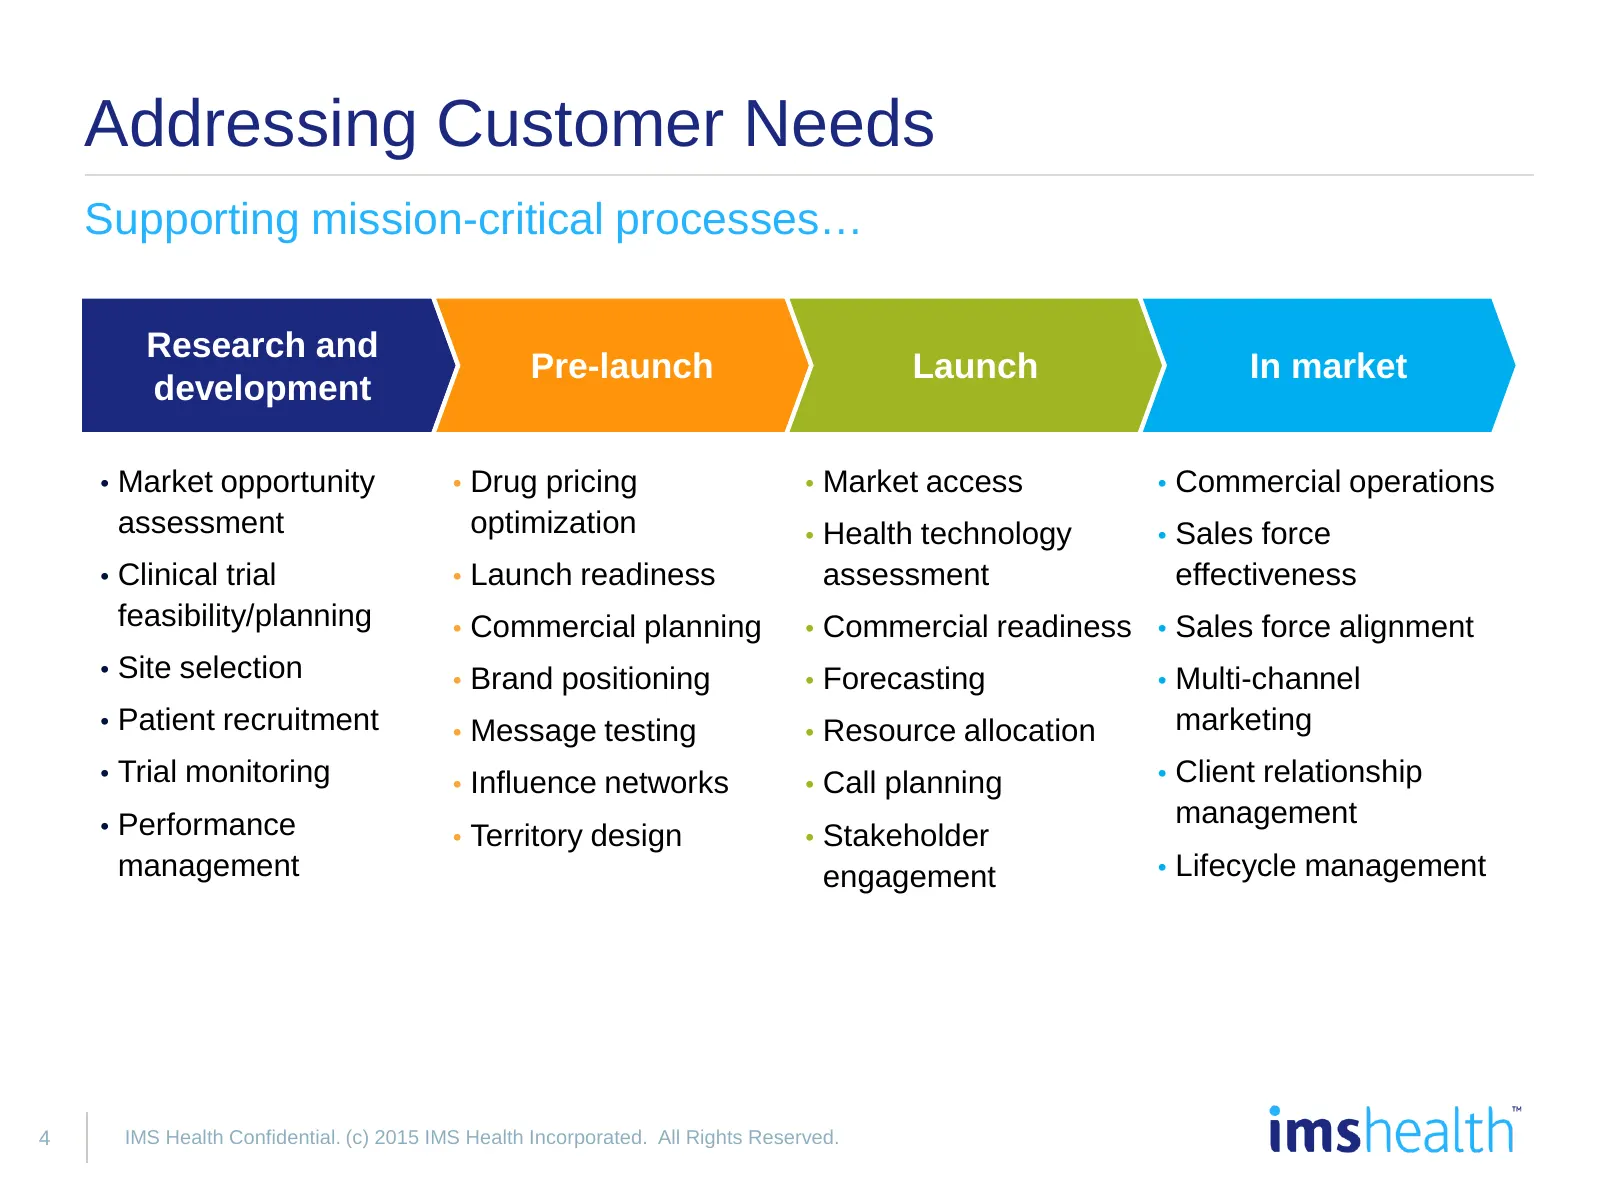
Addressing Customer Needs Supporting mission-critical processes… Research and Pre-launch Launch In market development • Market opportunity • Drug pricing • Market access • Commercial operations assessment optimization • Health technology • Sales force • Clinical trial • Launch readiness assessment e
Slide 6: Addressing Customer Needs
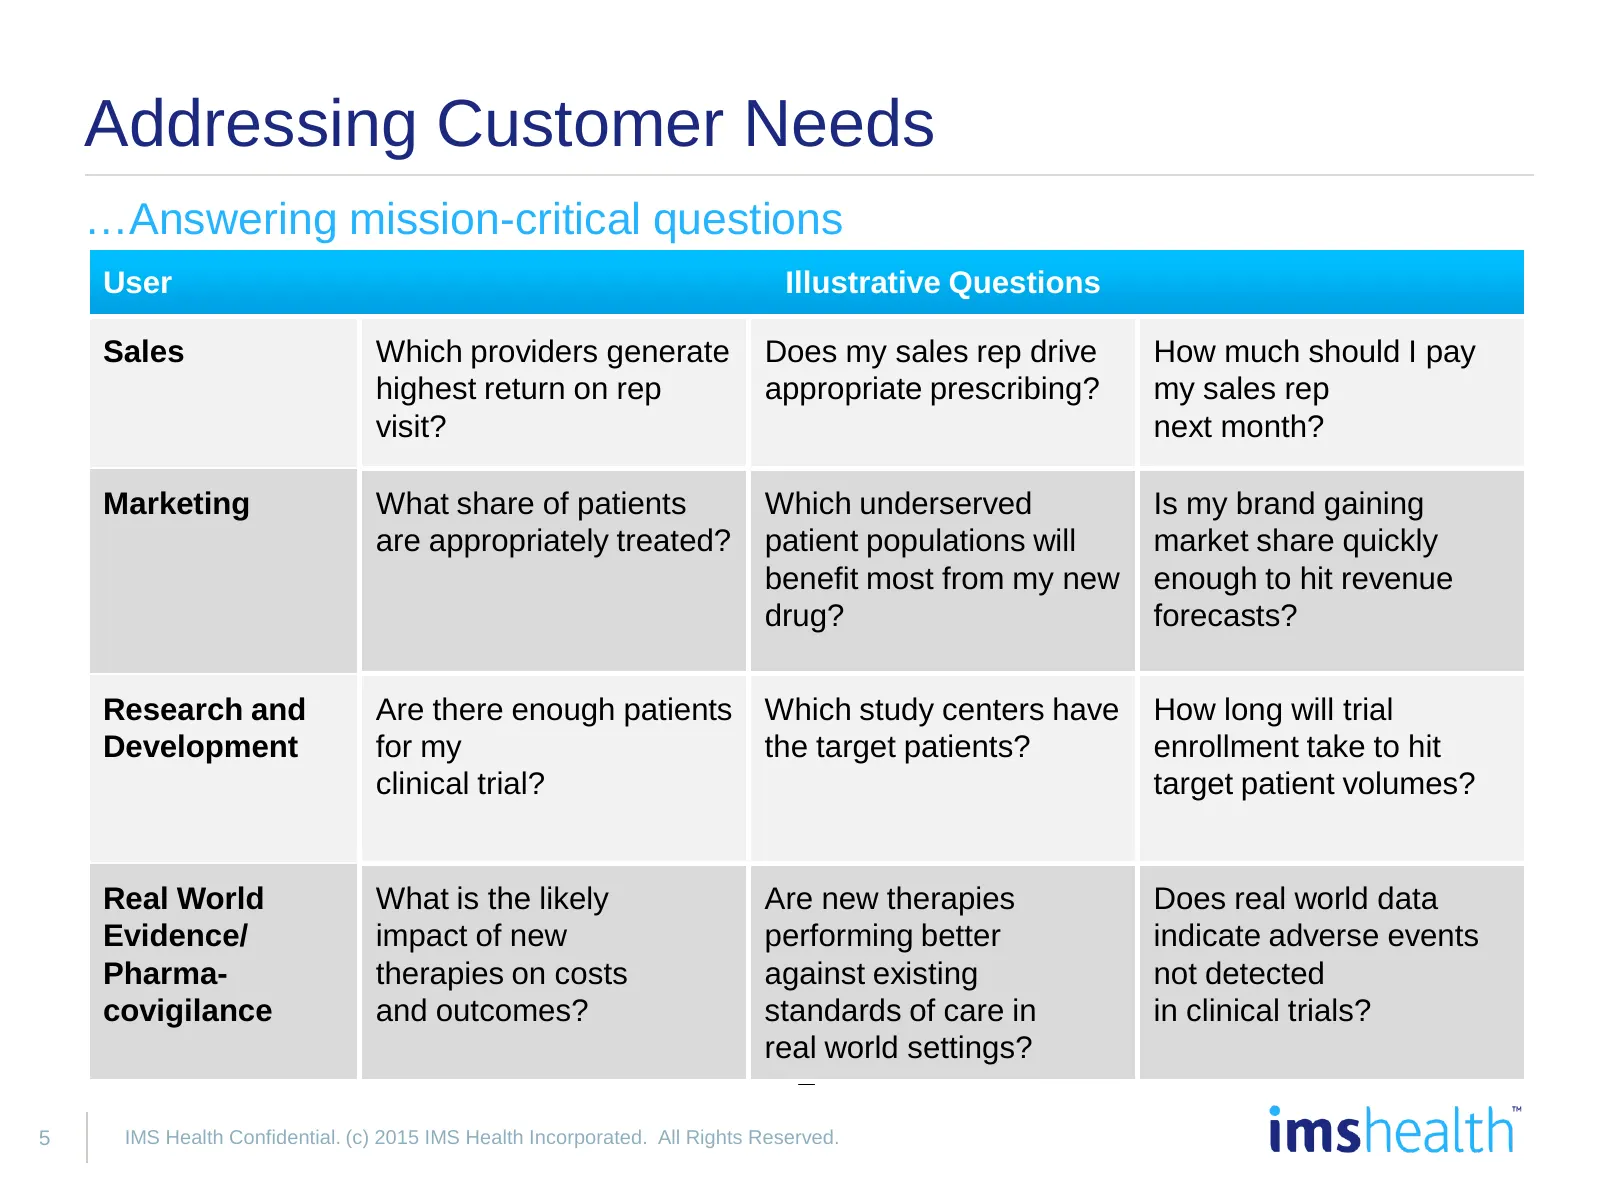
Addressing Customer Needs …Answering mission-critical questions User Illustrative Questions Sales Which providers generate Does my sales rep drive How much should I pay highest return on rep appropriate prescribing? my sales rep visit? next month? Marketing What share of patients Which underserved I
Slide 7: Addressable Market
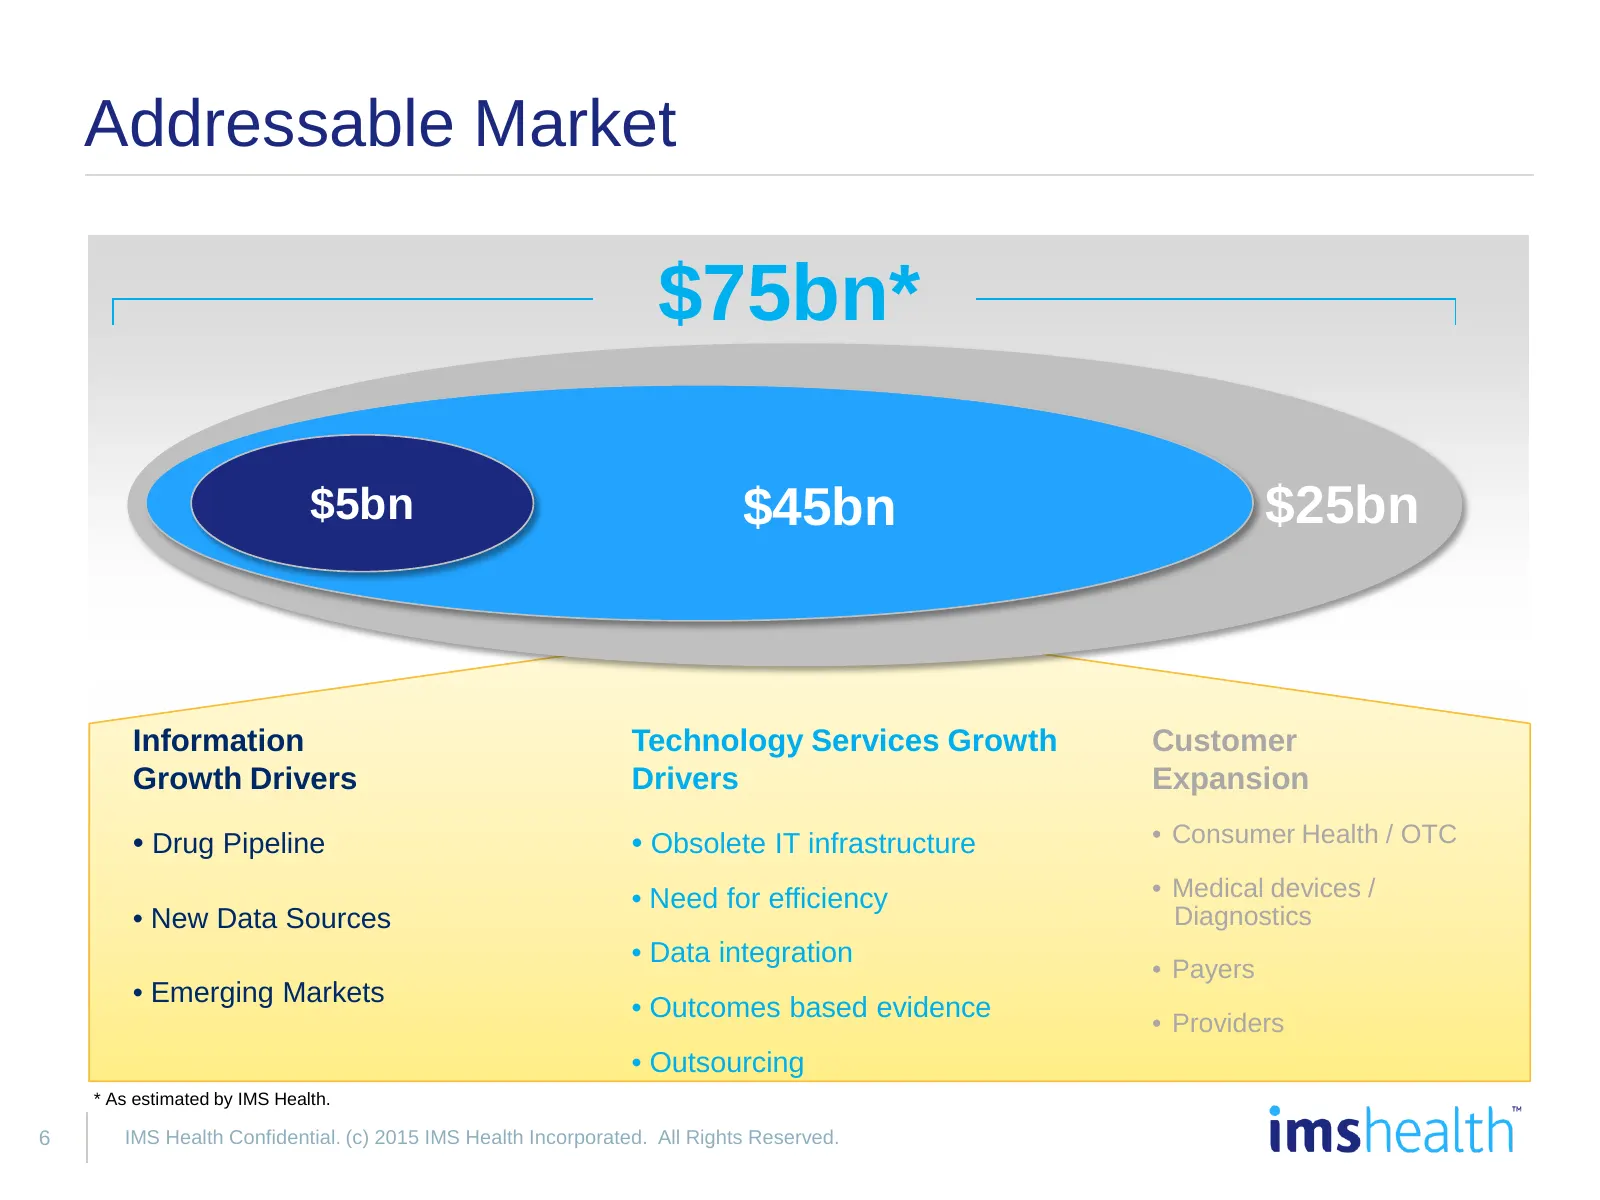
Addressable Market $75bn* $5bn $45bn $25bn Information Technology Services Growth Customer Growth Drivers Drivers Expansion • Drug Pipeline • Obsolete IT infrastructure • Consumer Health / OTC • Need for efficiency • Medical devices / • New Data Sources Diagnostics • Data integration • Payers • Emer
Slide 8: Offerings
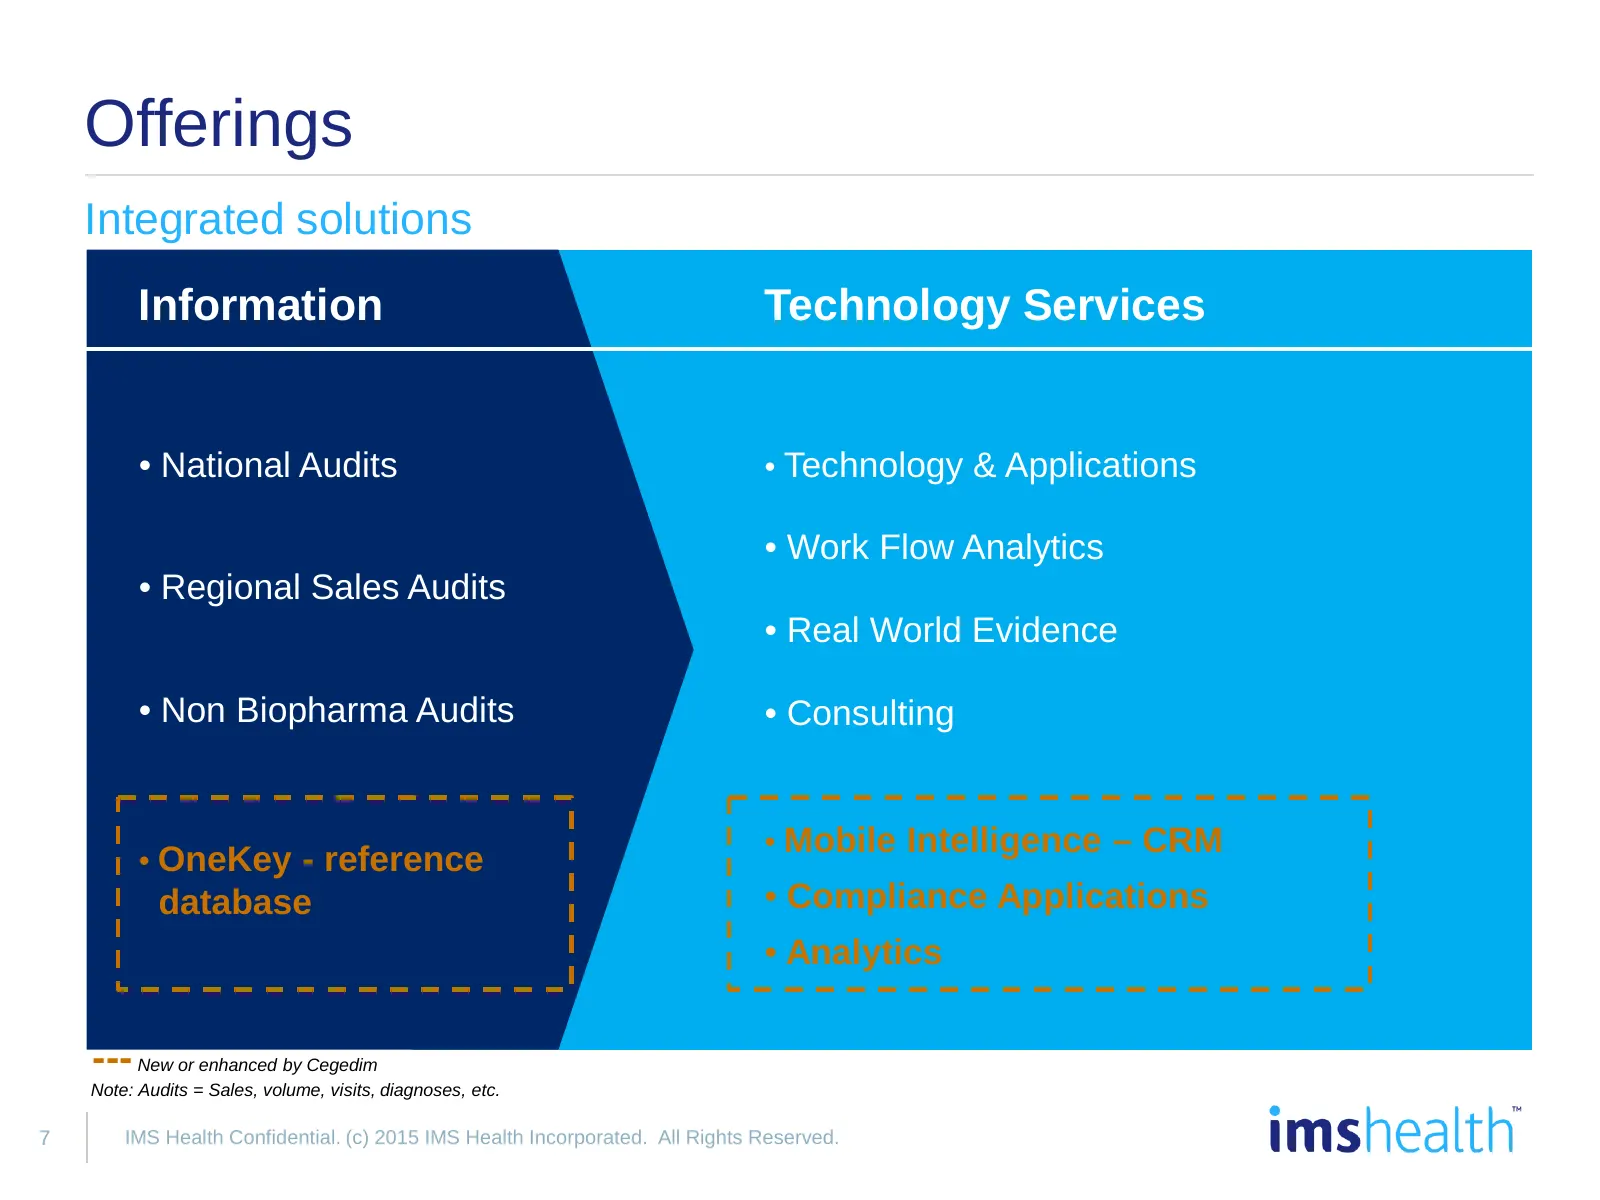
Offerings Integrated solutions Information Technology Services • National Audits • Technology & Applications • Work Flow Analytics • Regional Sales Audits • Real World Evidence • Non Biopharma Audits • Consulting • Mobile Intelligence – CRM • OneKey - reference database • Compliance Applications • A
Slide 9: Revenue - Offerings
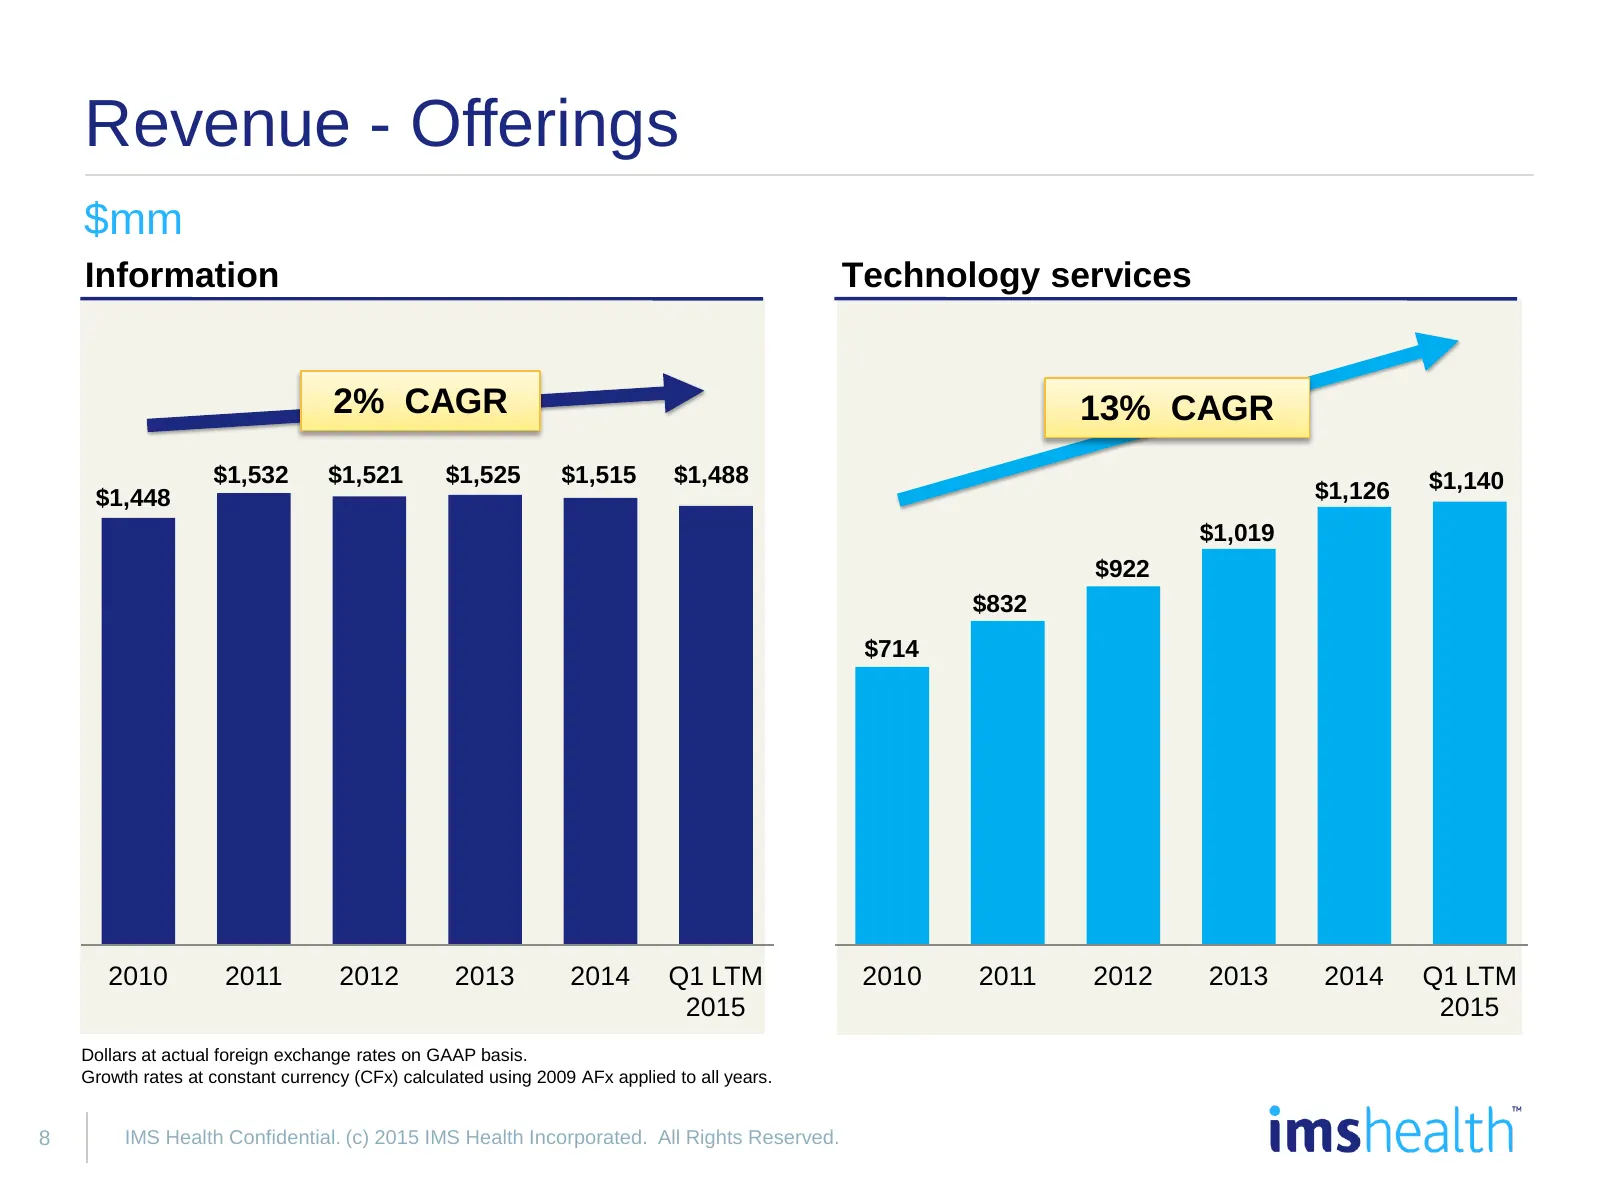
Revenue - Offerings $mm Information Technology services 2% CAGR 13% CAGR $1,532 $1,521 $1,525 $1,515 $1,488 $1,140 $1,448 $1,126 $1,019 $922 $832 $714 2010 2011 2012 2013 2014 Q1 LTM 2010 2011 2012 2013 2014 Q1 LTM 2015 2015 Dollars at actual foreign exchange rates on GAAP basis. Growth rates at con
Slide 10: Information Solutions
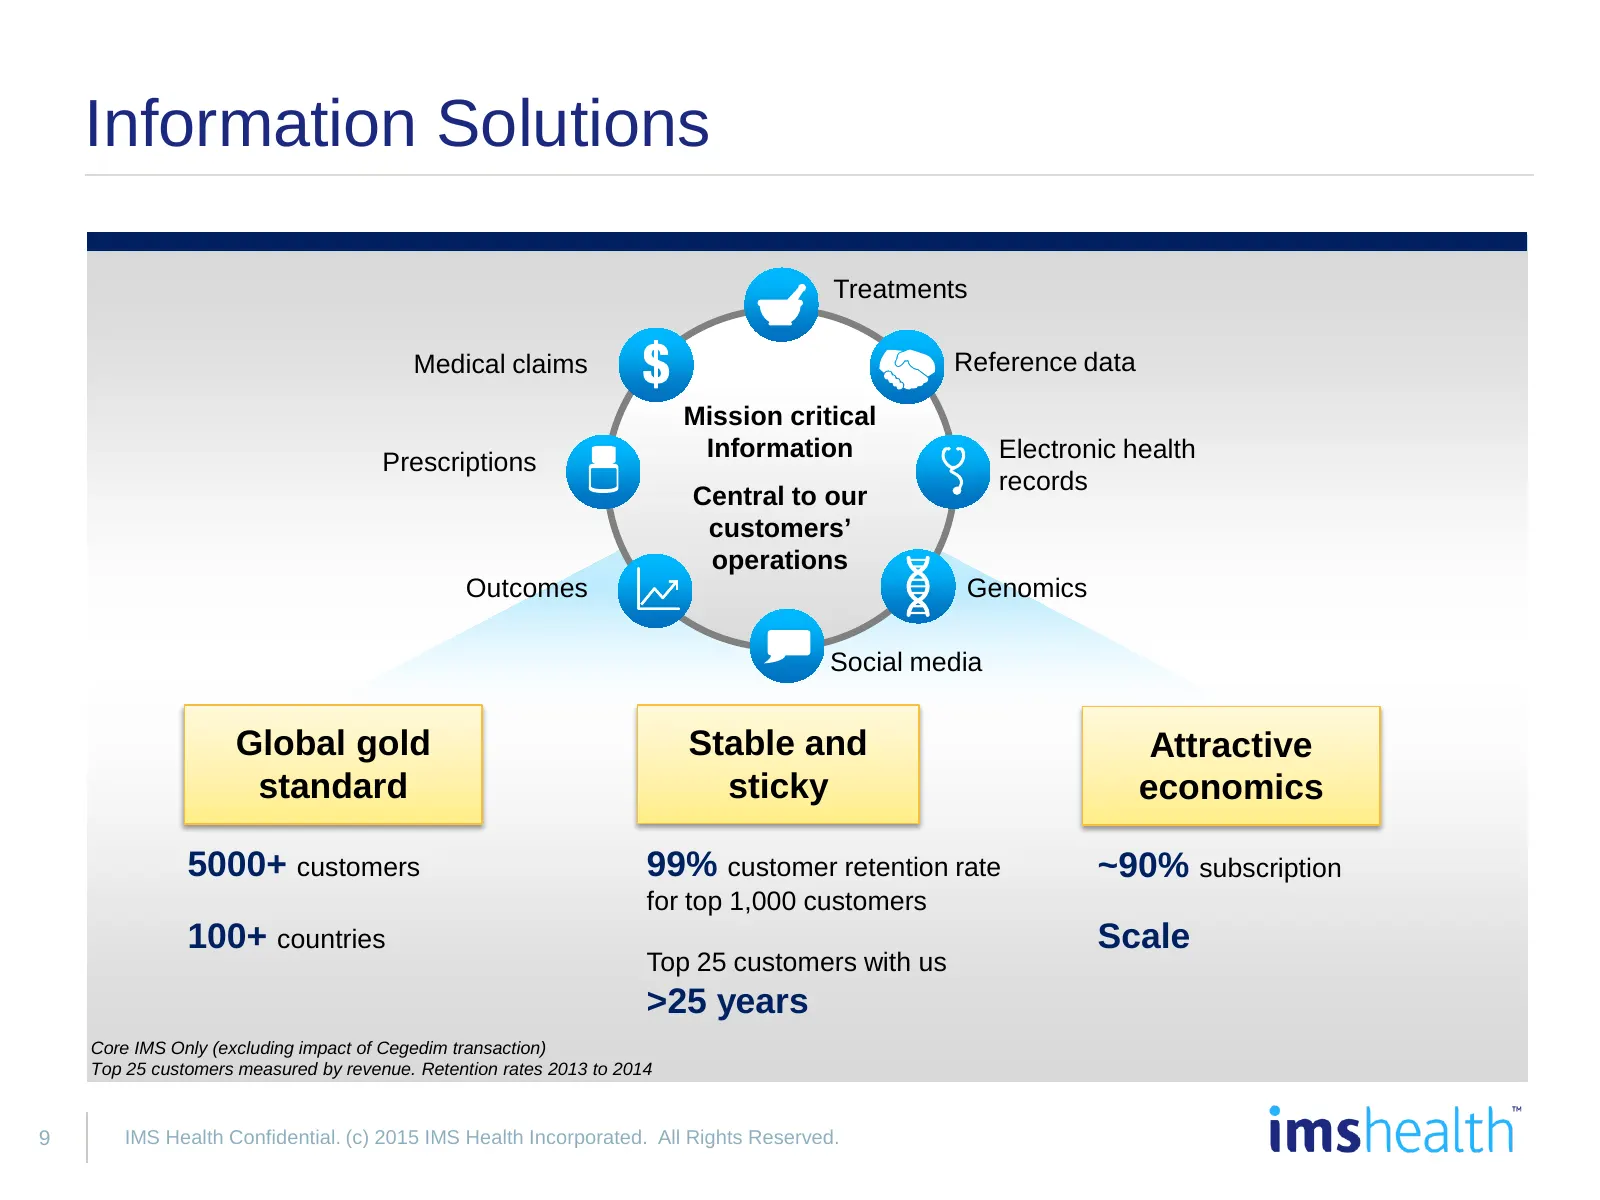
Information Solutions Treatments Medical claims Reference data Mission critical Information Electronic health Prescriptions records Central to our customers’ operations Outcomes Genomics Social media Global gold Stable and Attractive standard sticky economics 5000+ customers 99% customer retention r
Slide 11: Technology Services
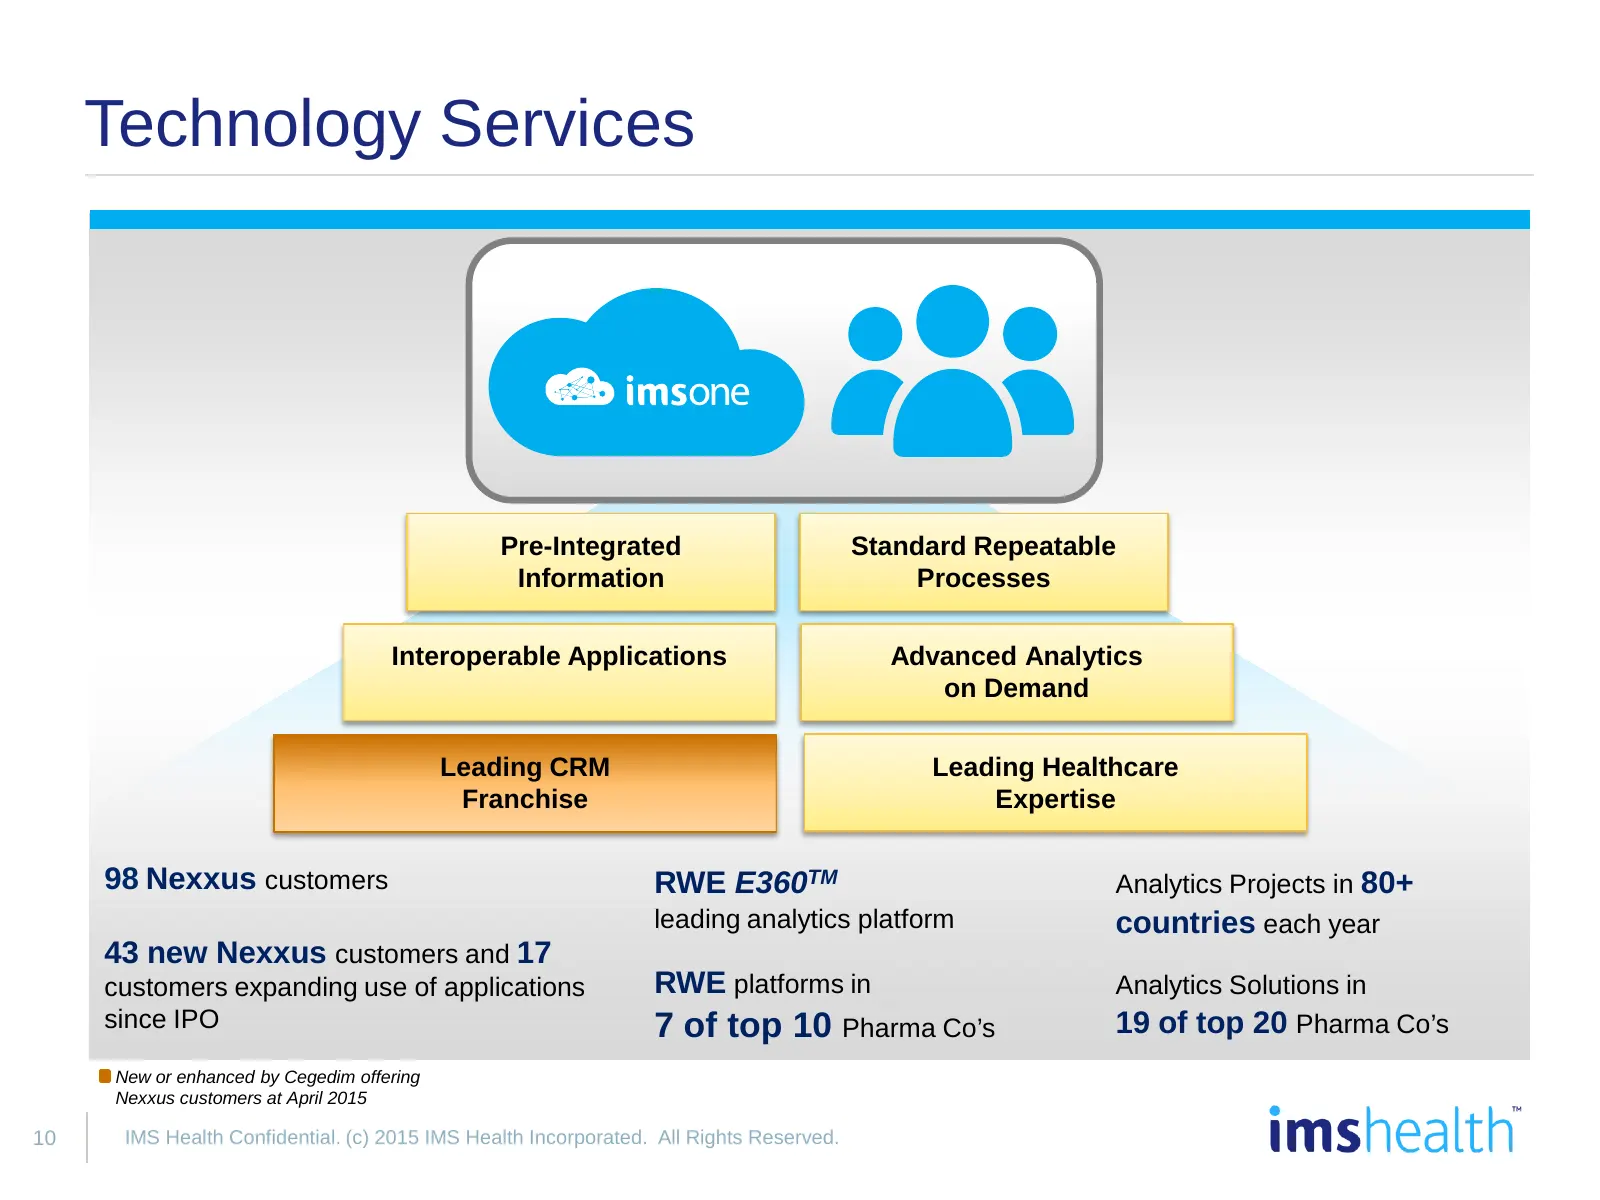
Technology Services Pre-Integrated Standard Repeatable Information Processes Interoperable Applications Advanced Analytics on Demand Leading CRM Leading Healthcare Franchise Expertise 98 Nexxus customers RWE E360TM Analytics Projects in 80+ leading analytics platform countries each year 43 new Nexxu
Slide 12: Nexxus Application Suite – Case
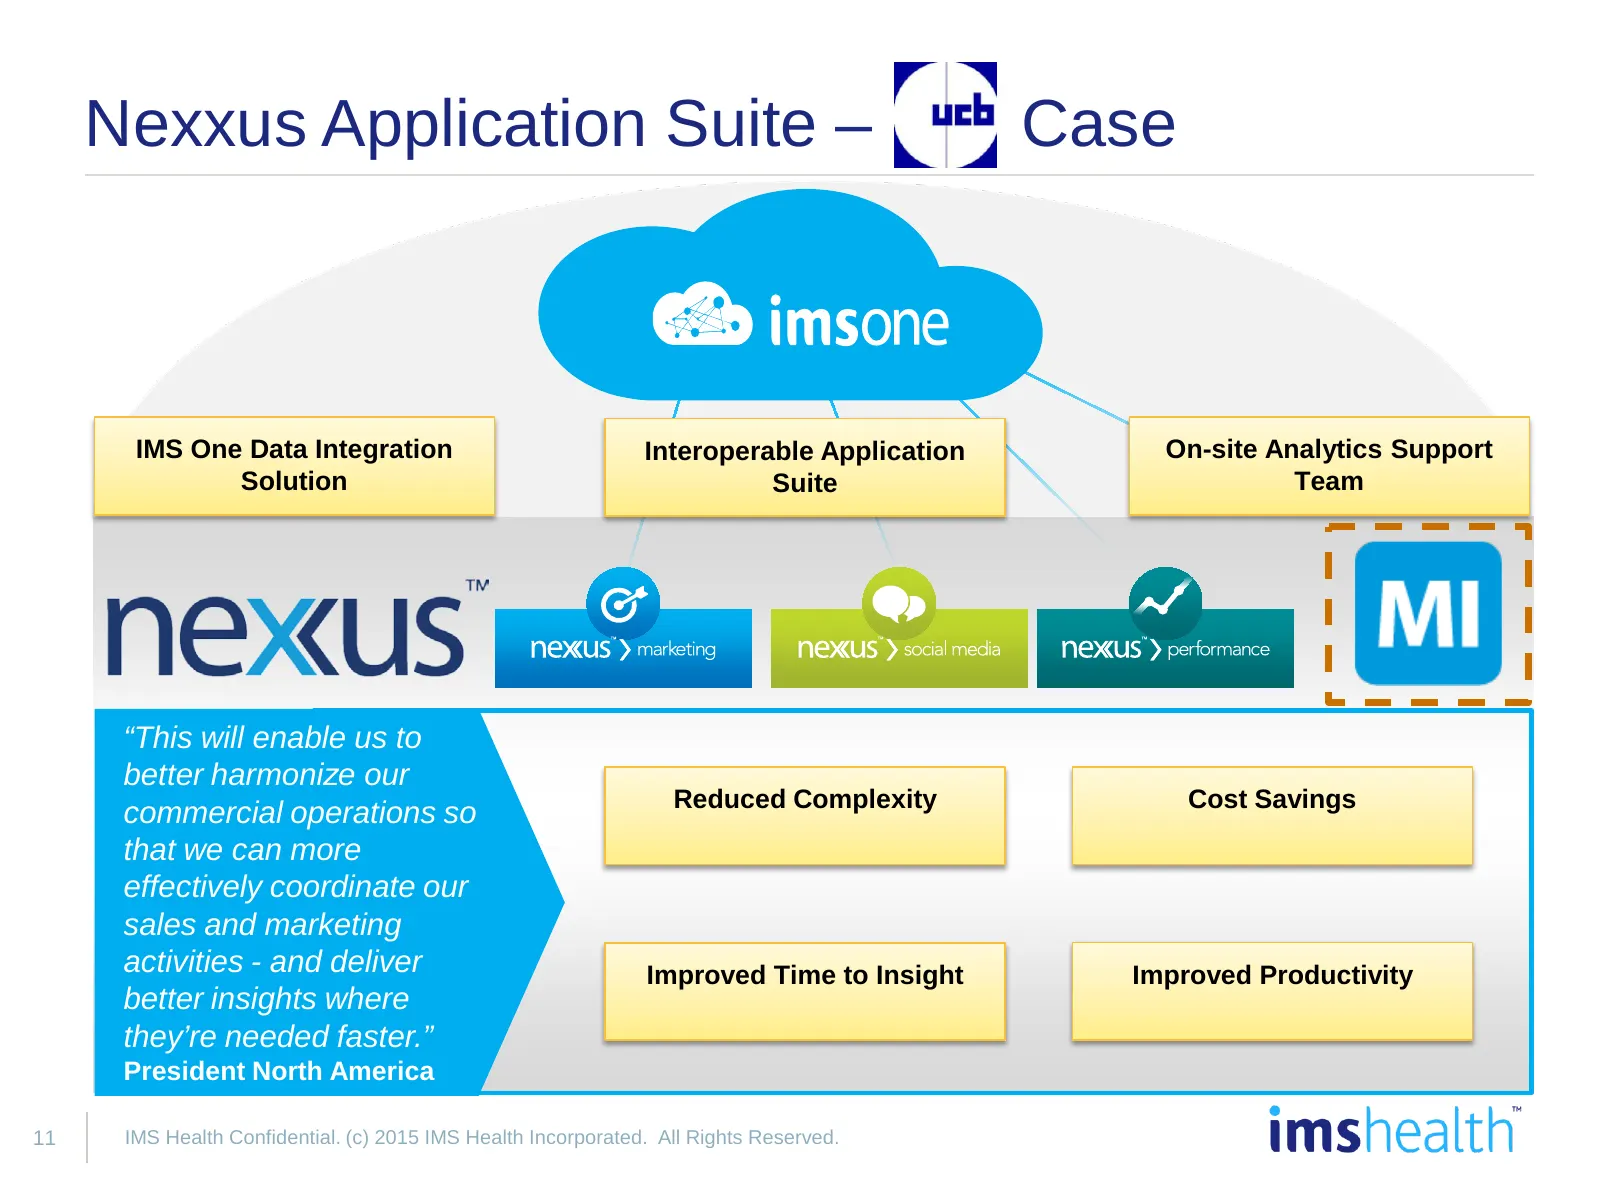
Nexxus Application Suite – Case IMS One Data Integration Interoperable Application On-site Analytics Support Solution Suite Team “This will enable us to better harmonize our Reduced Complexity Cost Savings commercial operations so that we can more effectively coordinate our sales and marketing activ
Slide 13: Revenue and Adjusted EBITDA Growth
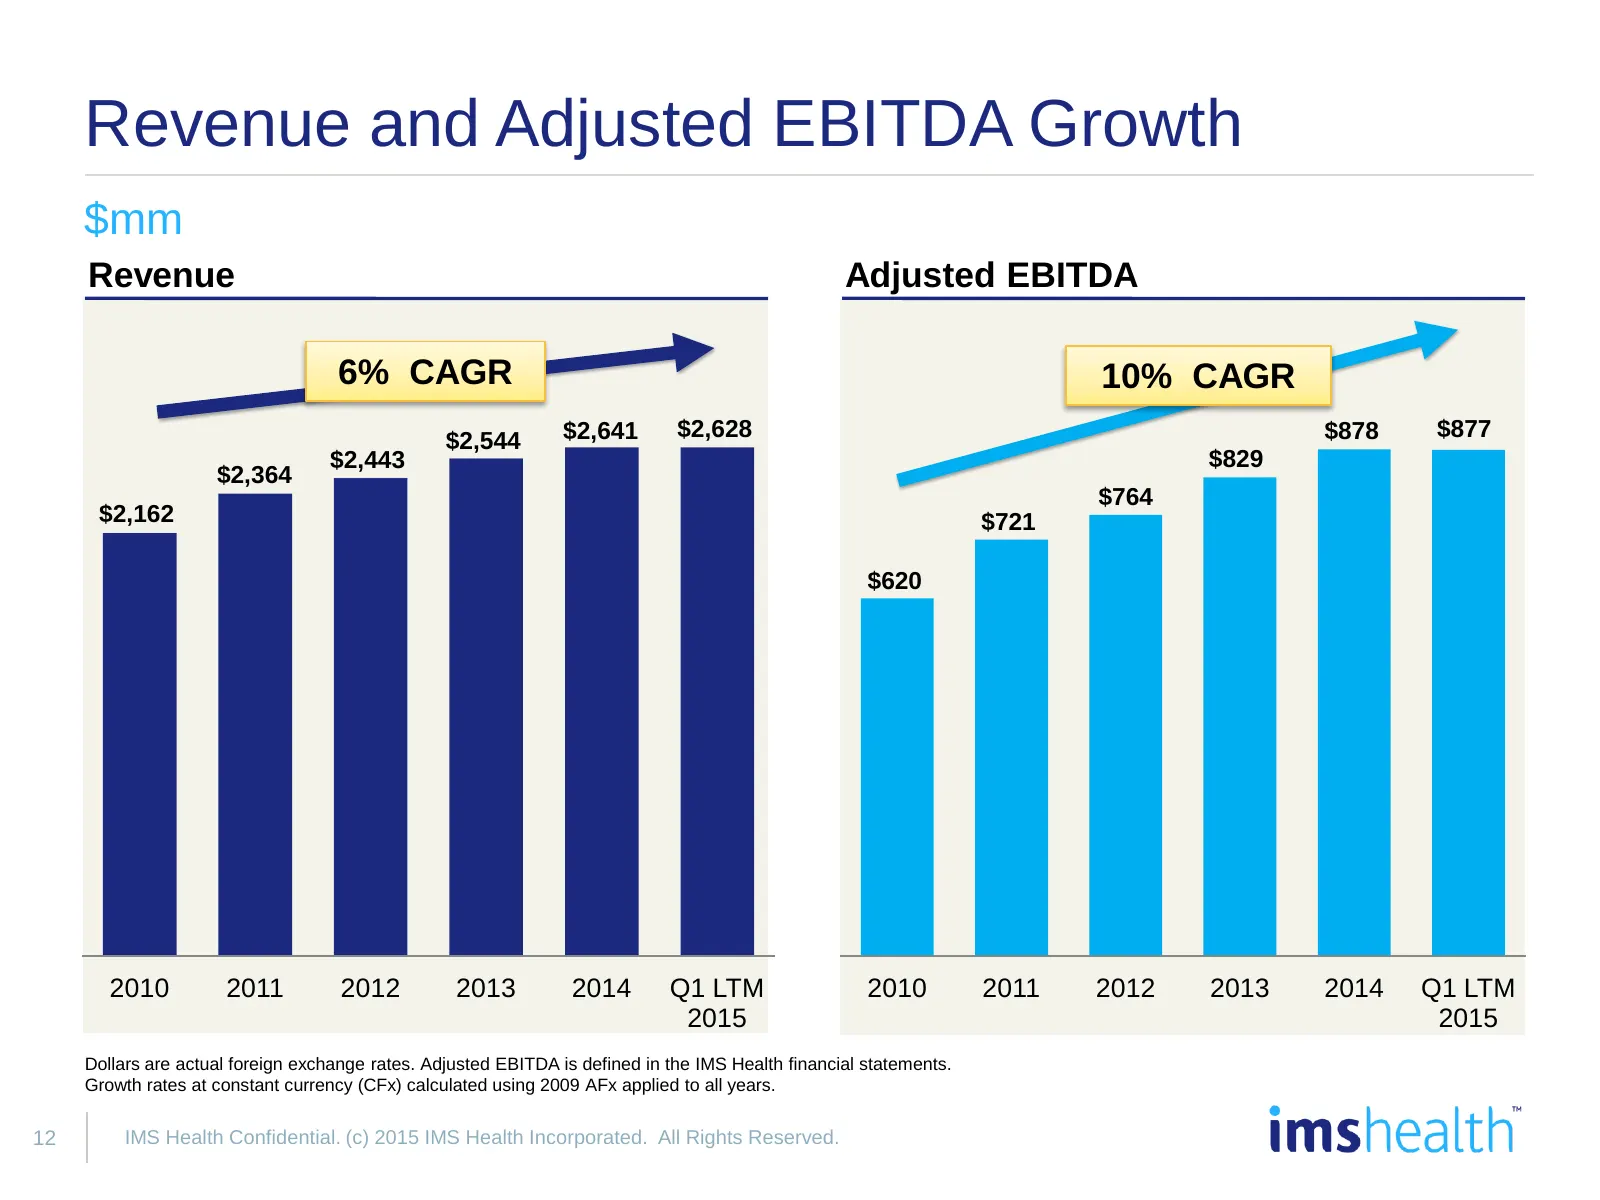
Revenue and Adjusted EBITDA Growth $mm Revenue Adjusted EBITDA 6% CAGR 10% CAGR $2,544 $2,641 $2,628 $878 $877 $2,443 $829 $2,364 $764 $2,162 $721 $620 2010 2011 2012 2013 2014 Q1 LTM 2010 2011 2012 2013 2014 Q1 LTM 2015 2015 Dollars are actual foreign exchange rates. Adjusted EBITDA is defined in t
Slide 14: Margin Performance
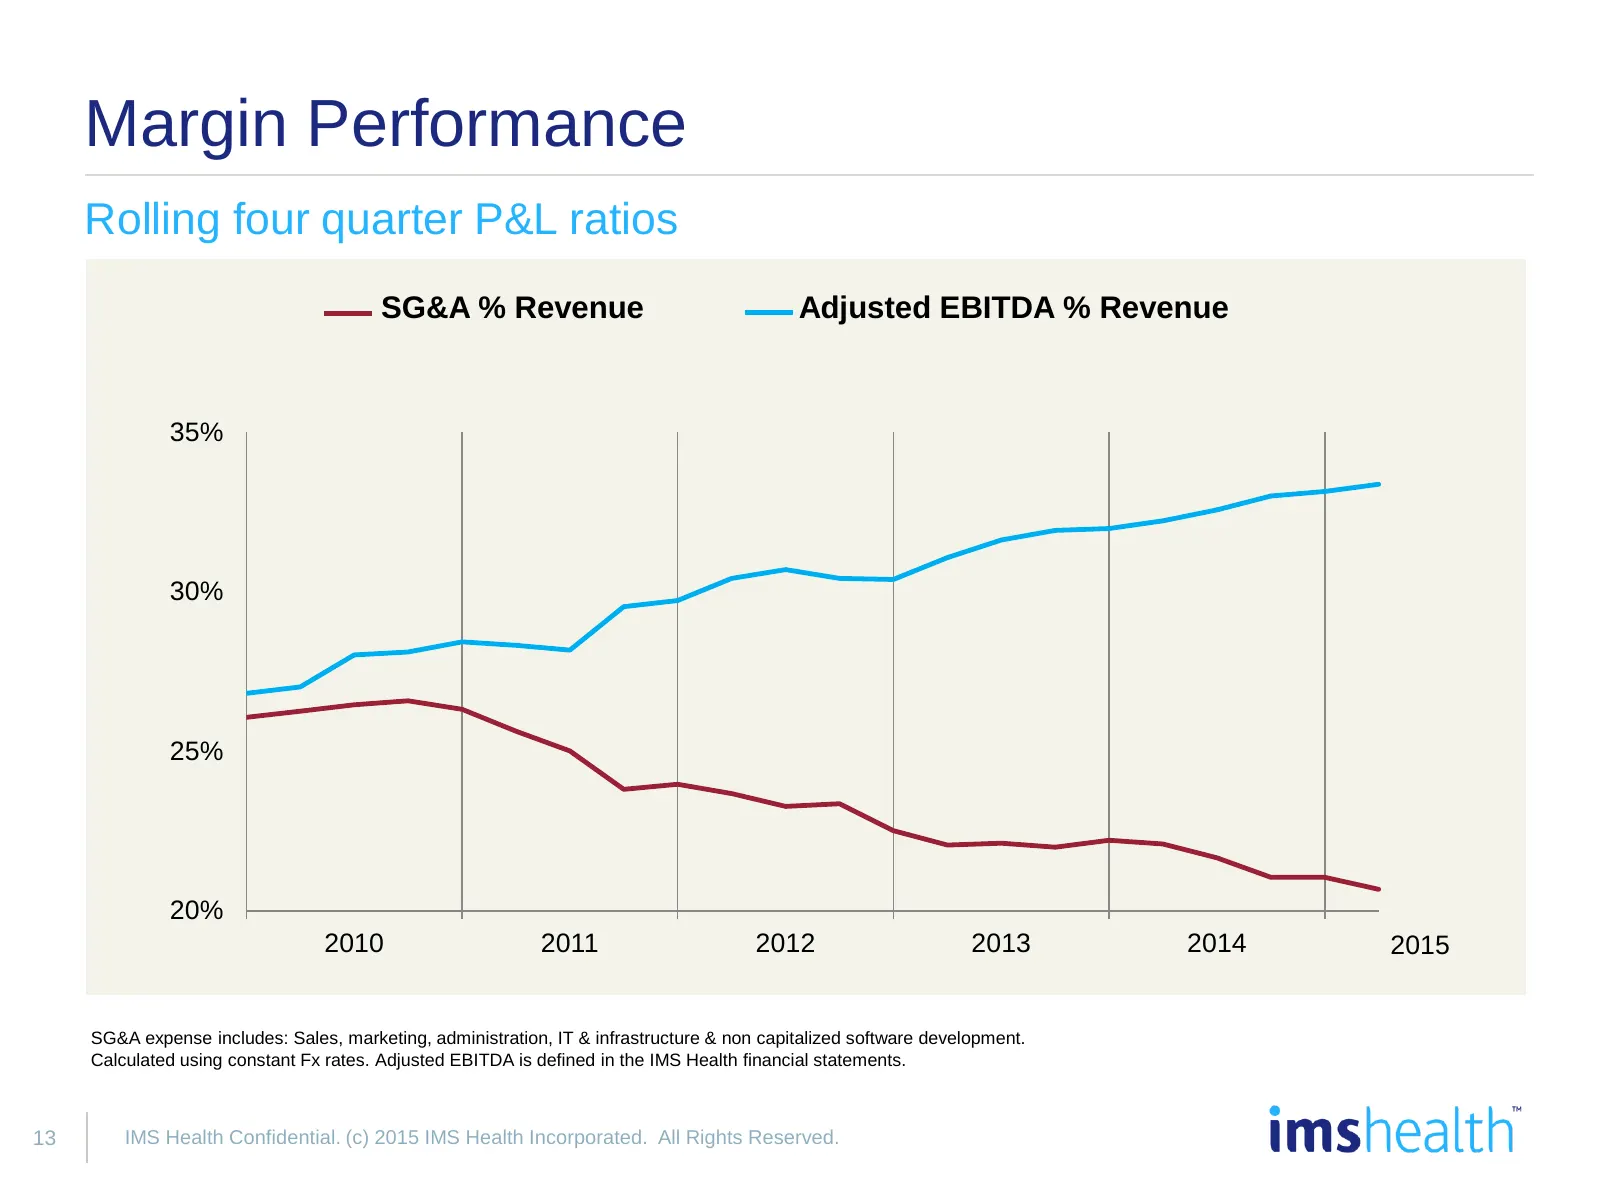
Margin Performance Rolling four quarter P&L ratios SG&A % Revenue Adjusted EBITDA % Revenue 35% 30% 25% 20% 2010 2011 2012 2013 2014 2015 SG&A expense includes: Sales, marketing, administration, IT & infrastructure & non capitalized software development. Calculated using constant Fx rates. Adjusted
Slide 15: Operational Excellence
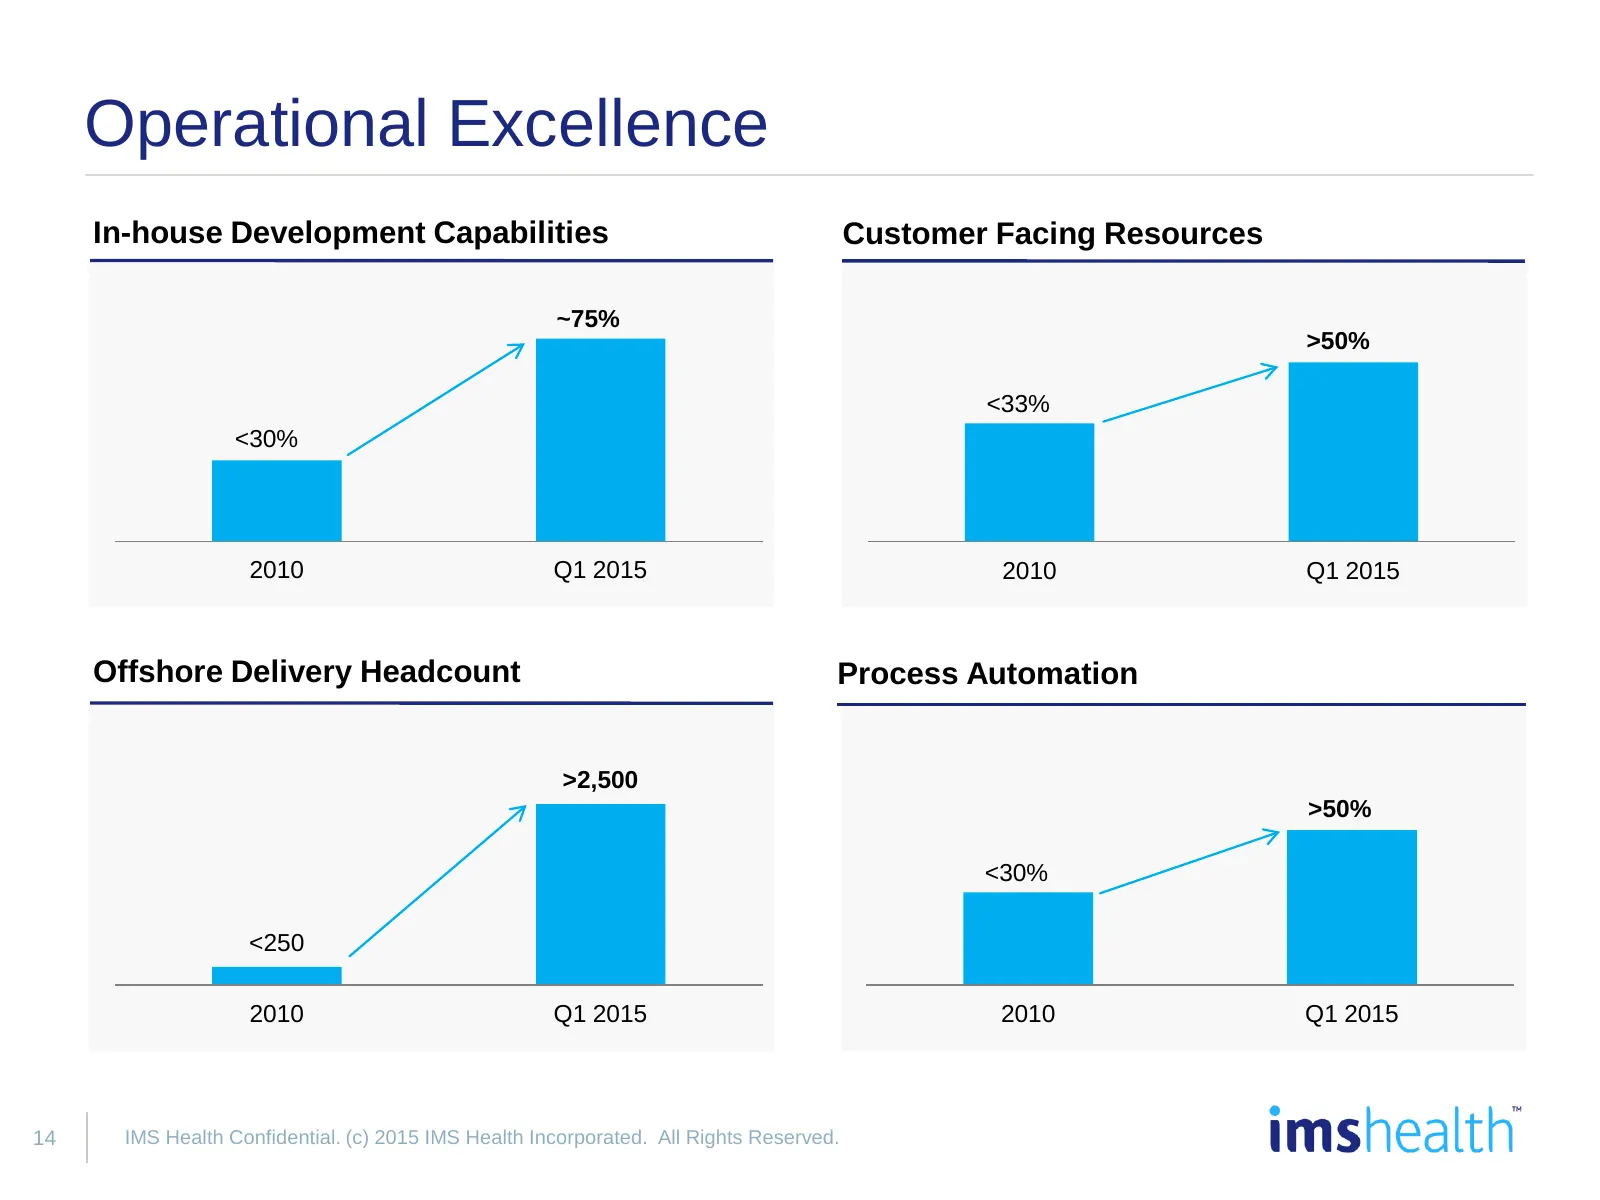
Operational Excellence In-house Development Capabilities Customer Facing Resources ~75% >50% <33% <30% 2010 Q1 2015 2010 Q1 2015 Offshore Delivery Headcount Process Automation >2,500 >50% <30% <250 2010 Q1 2015 2010 Q1 2015 14 IMS Health Confidential. (c) 2015 IMS Health Incorporated. All Rights Res
Slide 16: Cegedim Integration Opportunity
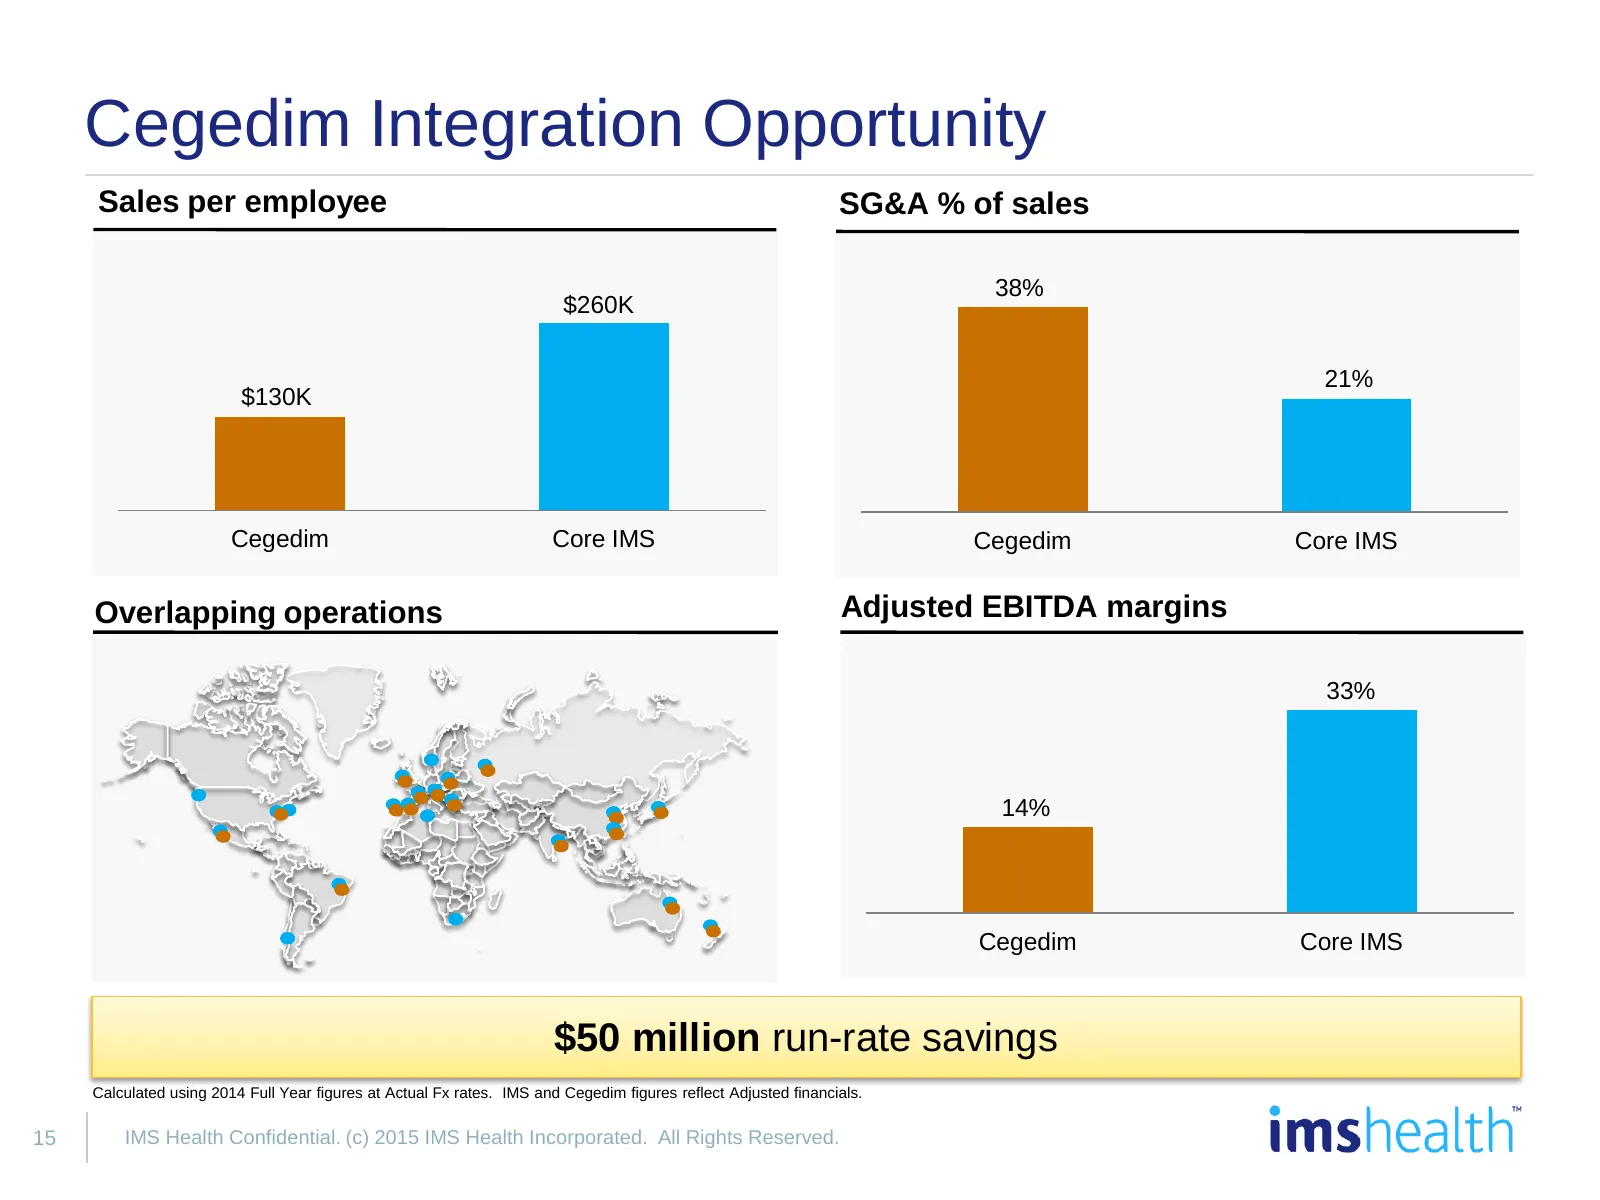
Cegedim Integration Opportunity Sales per employee SG&A % of sales 38% $260K 21% $130K Cegedim Core IMS Cegedim Core IMS Overlapping operations Adjusted EBITDA margins 33% 14% Cegedim Core IMS $50 million run-rate savings Calculated using 2014 Full Year figures at Actual Fx rates. IMS and Cegedim fi
Slide 17: Balance Sheet
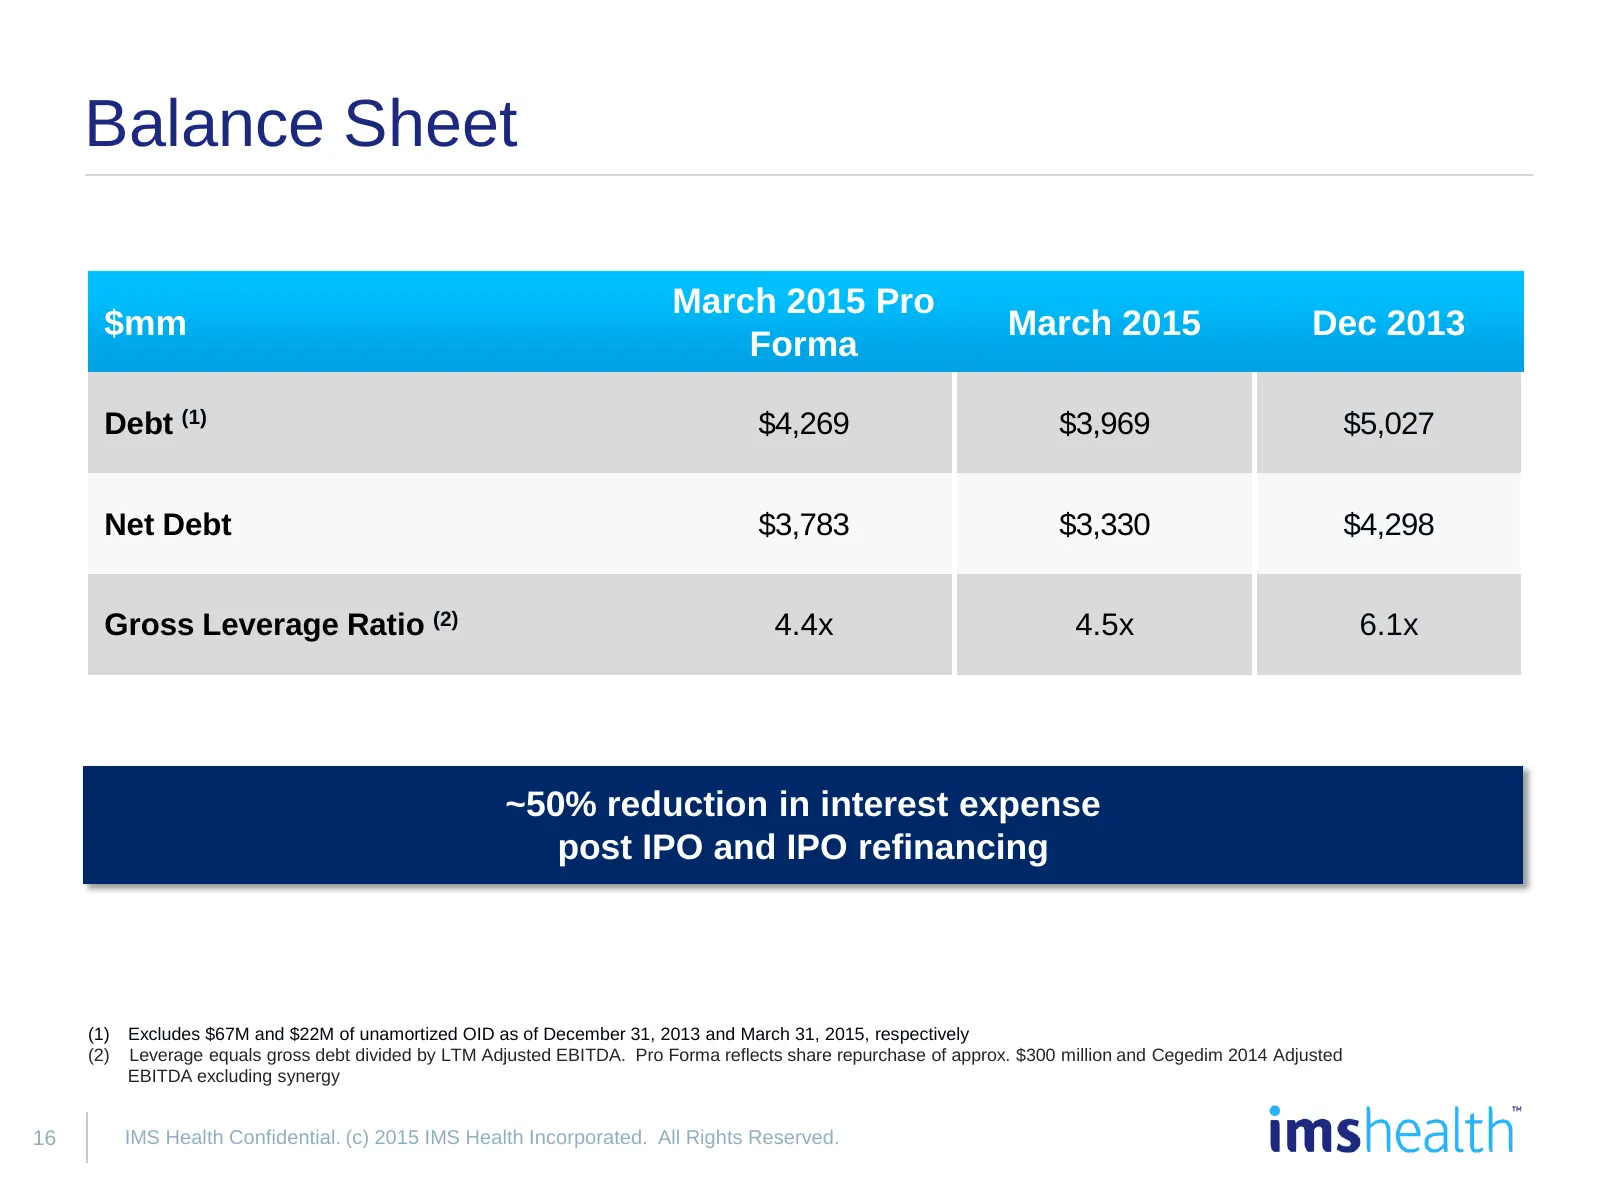
Balance Sheet March 2015 Pro $mm March 2015 Dec 2013 Forma Debt (1) $4,269 $3,969 $5,027 Net Debt $3,783 $3,330 $4,298 Gross Leverage Ratio (2) 4.4x 4.5x 6.1x ~50% reduction in interest expense post IPO and IPO refinancing (1) Excludes $67M and $22M of unamortized OID as of December 31, 2013 and Mar
Slide 18: Shareholder Value Creation Roadmap
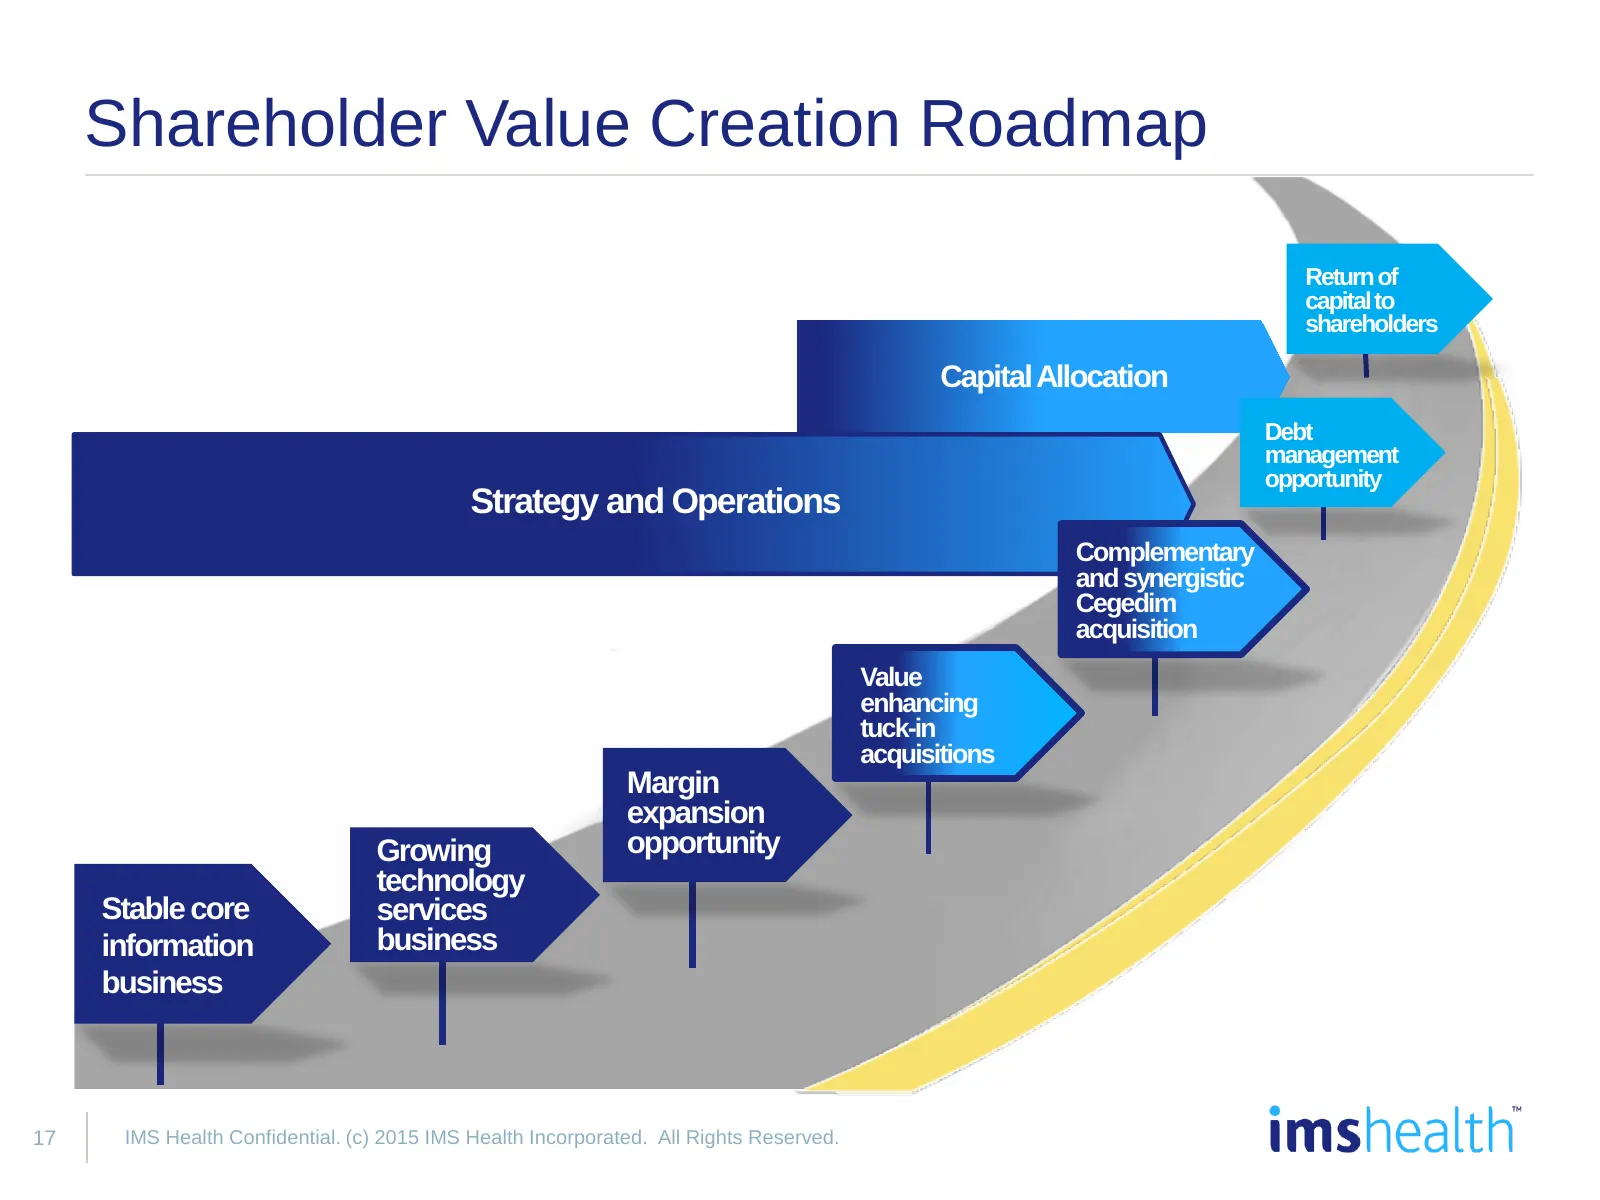
Shareholder Value Creation Roadmap Return of capital to shareholders Capital Allocation Debt management opportunity Strategy and Operations Complementary and synergistic Cegedim acquisition Value enhancing tuck-in acquisitions Margin expansion Growing opportunity technology Stable core services info
Slide 19: IMS Health
= © o) as Y) 2 imshealth
Slide 20: Appendix
Appendix 19
Slide 21: Net Income to Adjusted EBITDA
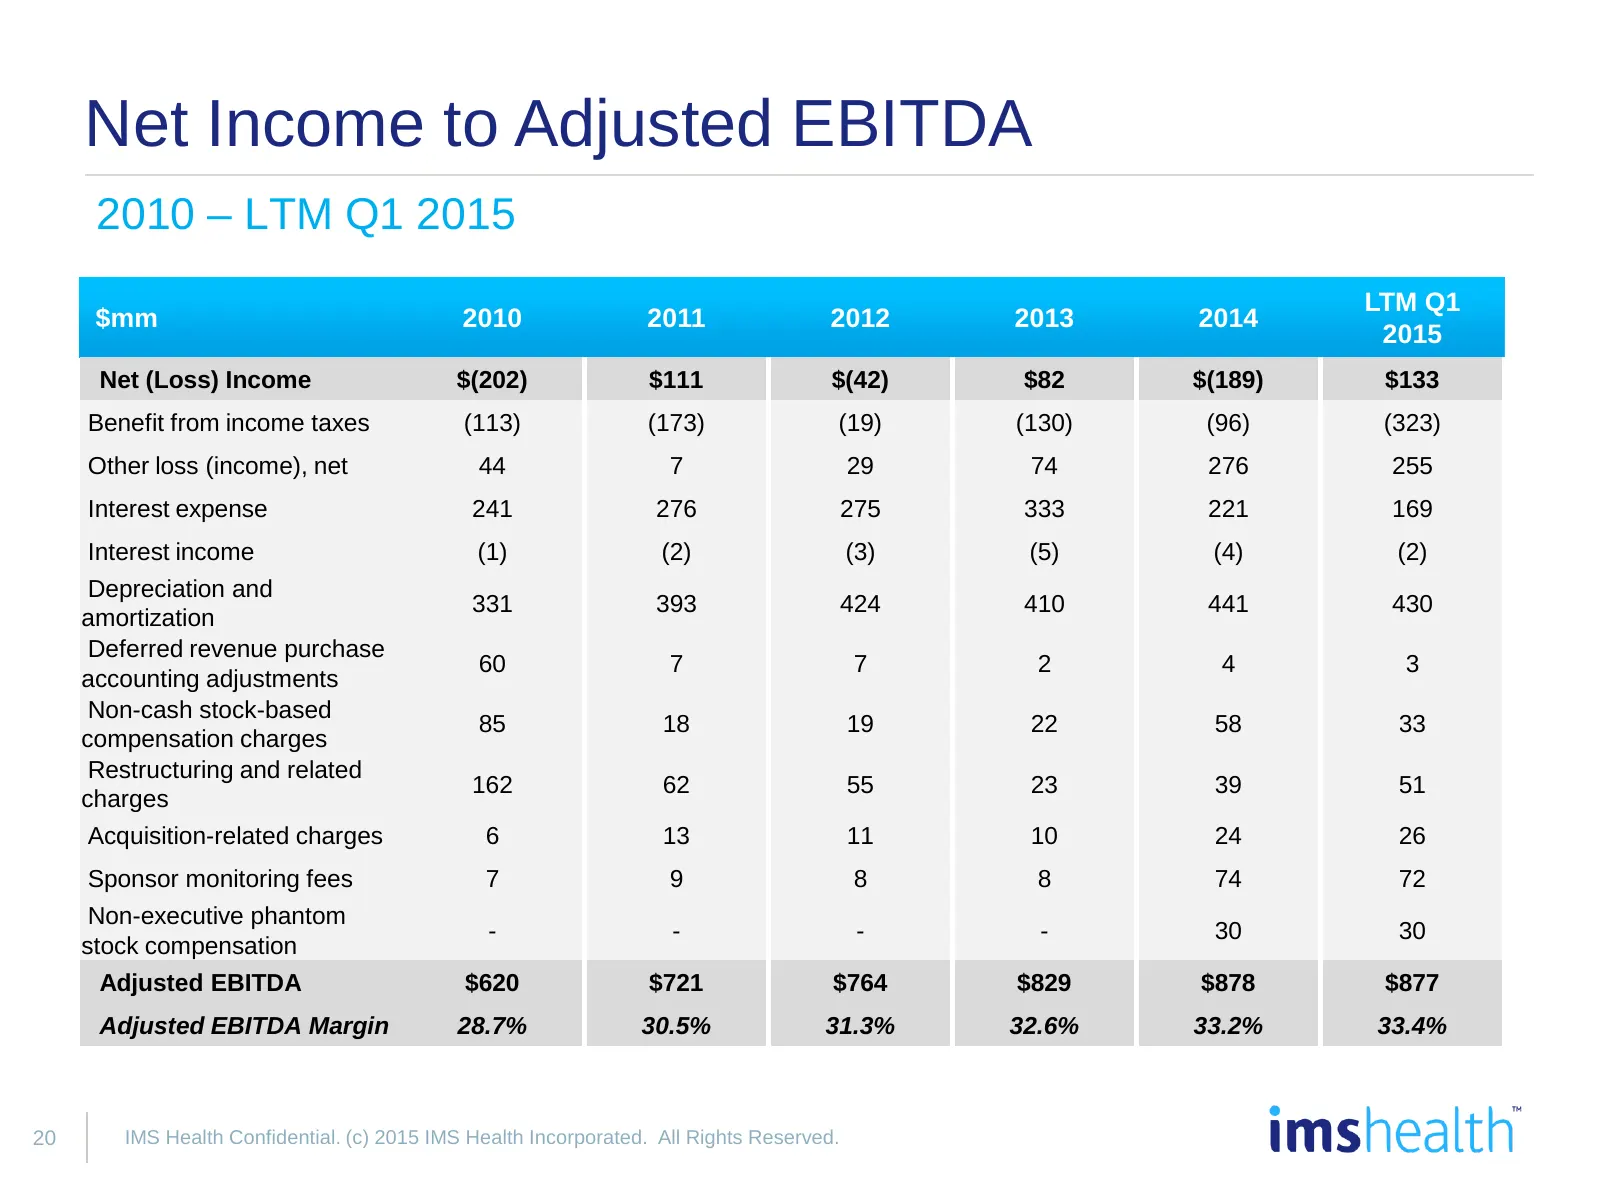
Net Income to Adjusted EBITDA 2010 – LTM Q1 2015 LTM Q1 $mm 2010 2011 2012 2013 2014 2015 Net (Loss) Income $(202) $111 $(42) $82 $(189) $133 Benefit from income taxes (113) (173) (19) (130) (96) (323) Other loss (income), net 44 7 29 74 276 255 Interest expense 241 276 275 333 221 169 Interest inco
Slide 22: Net Income to Adjusted EBITDA
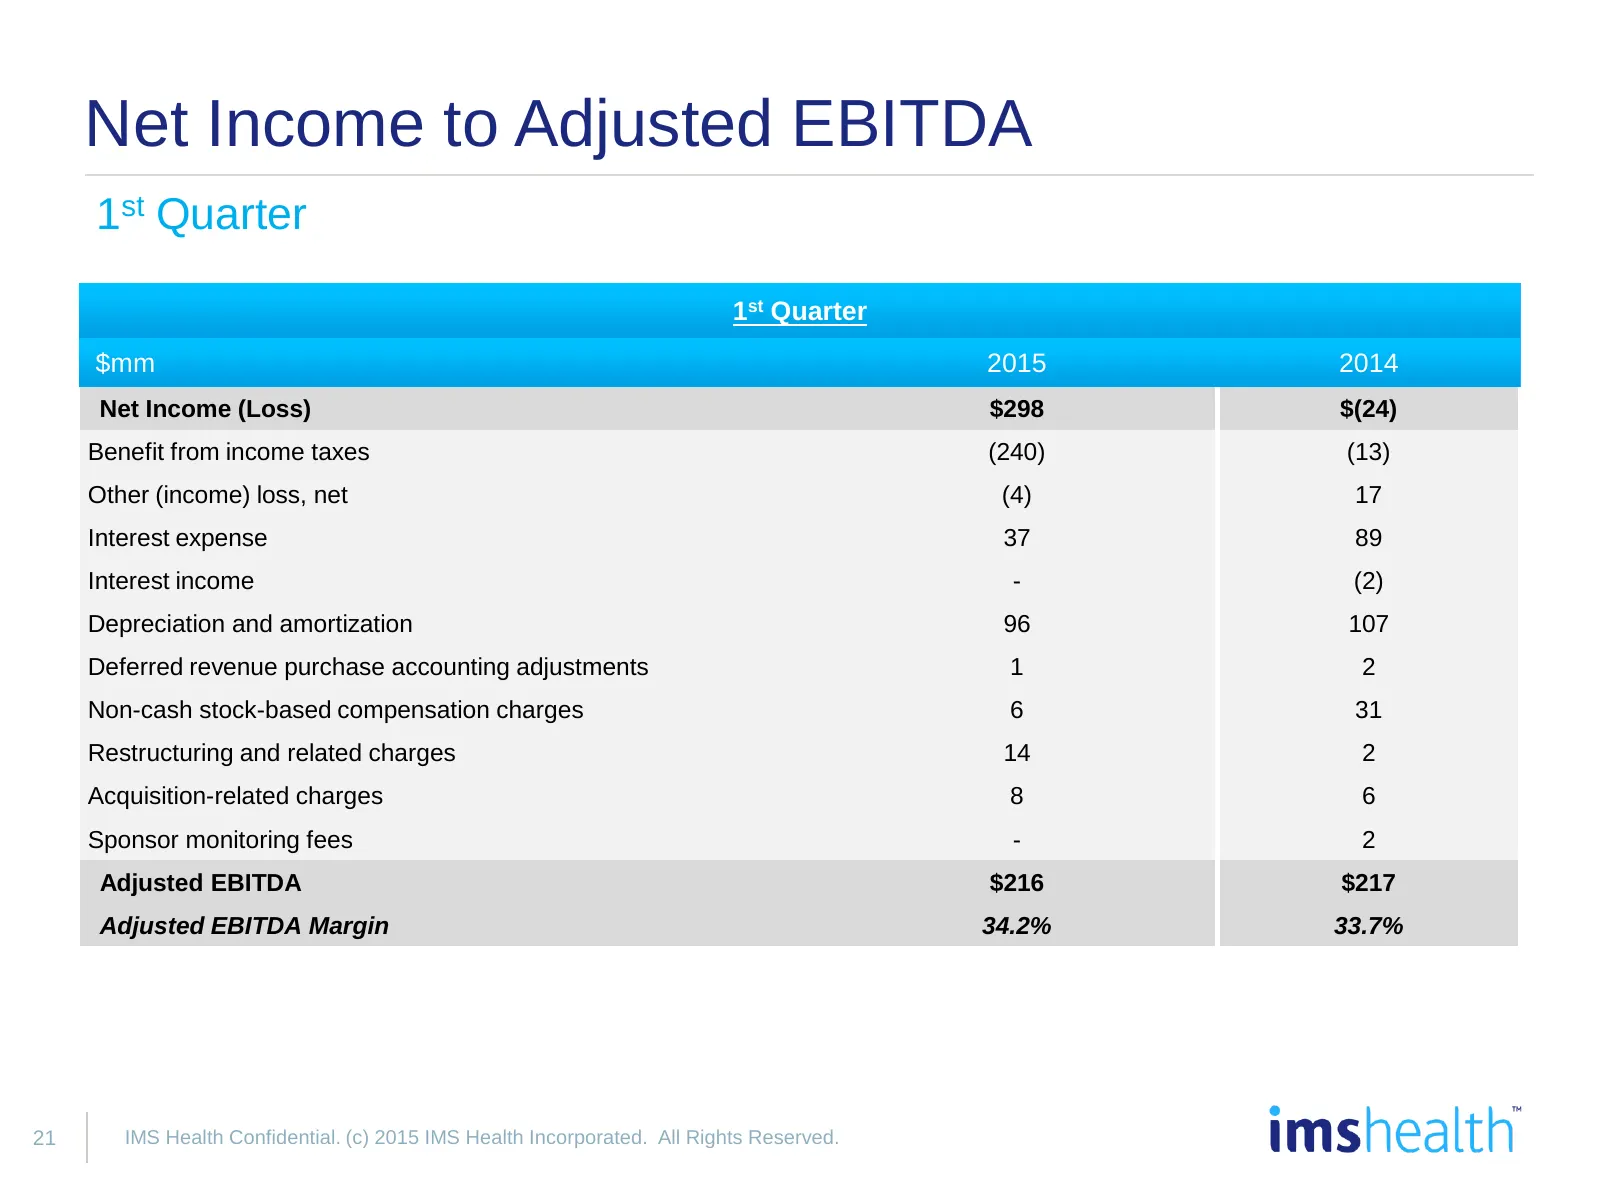
Net Income to Adjusted EBITDA 1st Quarter 1st Quarter $mm 2015 2014 Net Income (Loss) $298 $(24) Benefit from income taxes (240) (13) Other (income) loss, net (4) 17 Interest expense 37 89 Interest income - (2) Depreciation and amortization 96 107 Deferred revenue purchase accounting adjustments 1 2
Slide 23: Net Income to Adjusted EBITDA
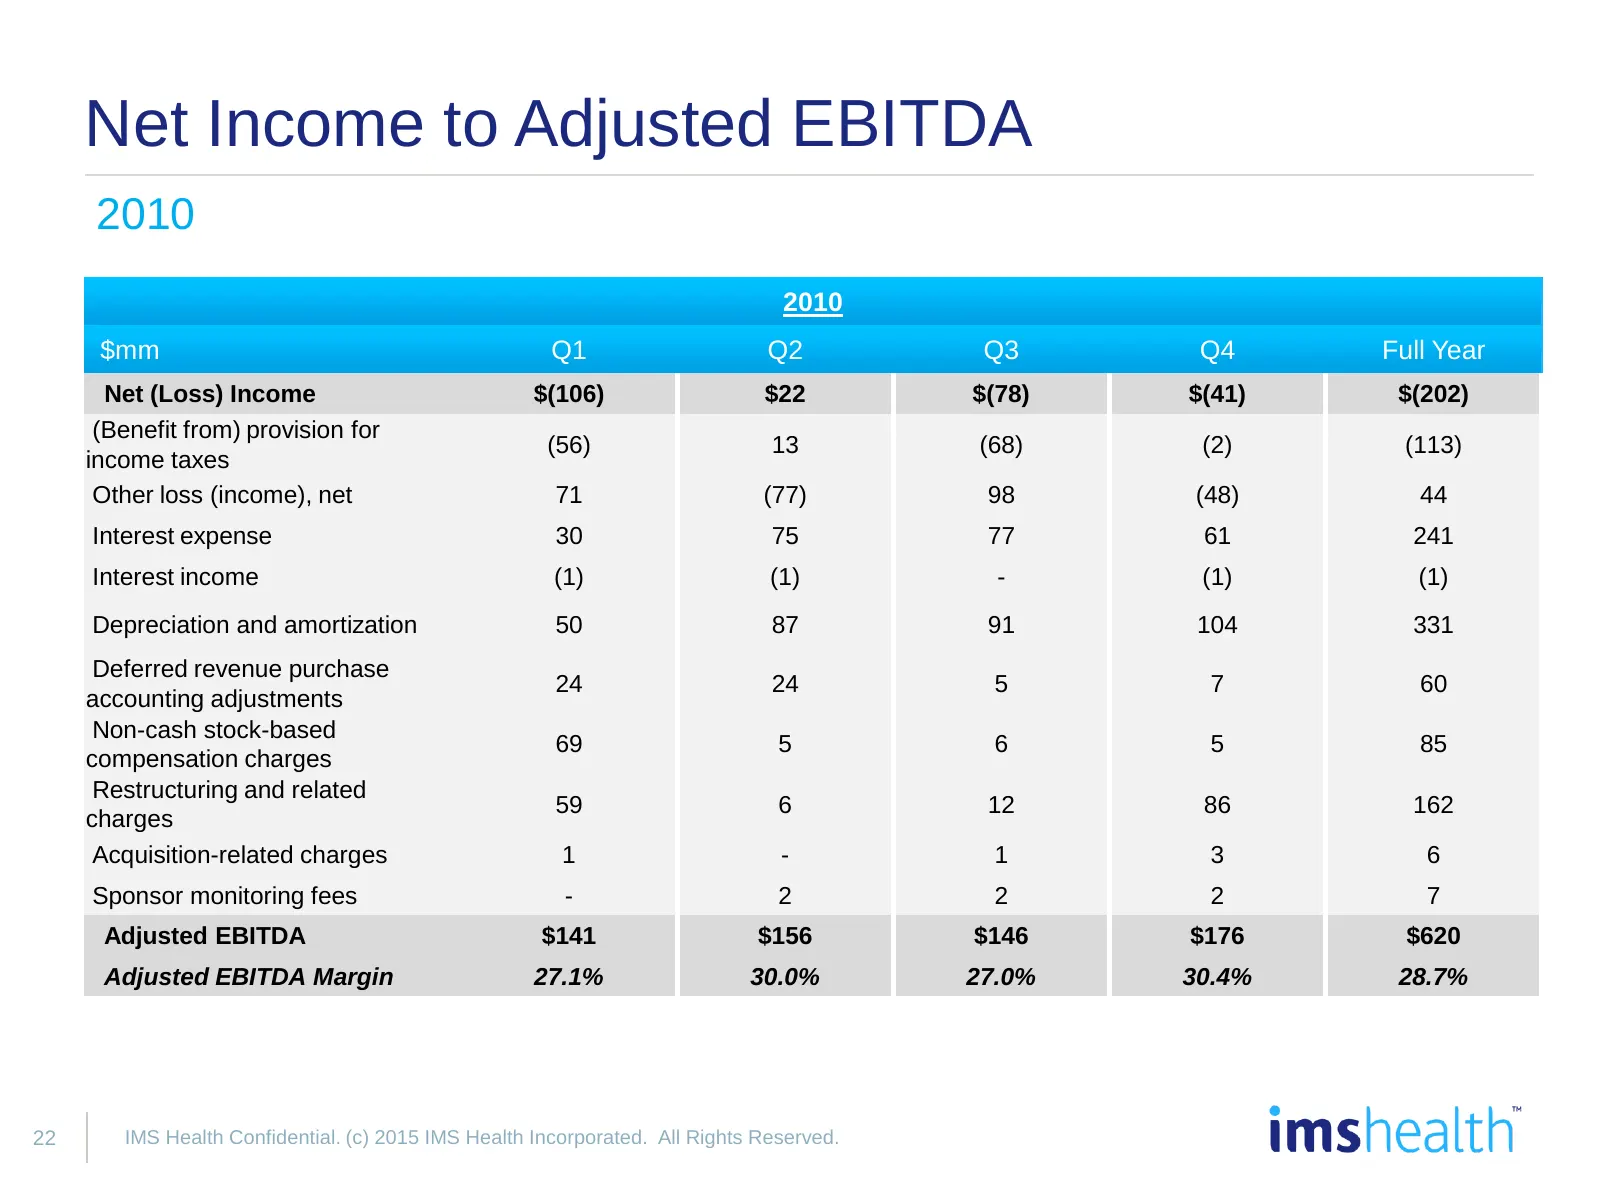
Net Income to Adjusted EBITDA 2010 2010 $mm Q1 Q2 Q3 Q4 Full Year Net (Loss) Income $(106) $22 $(78) $(41) $(202) (Benefit from) provision for (56) 13 (68) (2) (113) income taxes Other loss (income), net 71 (77) 98 (48) 44 Interest expense 30 75 77 61 241 Interest income (1) (1) - (1) (1) Depreciati
Slide 24: Net Income to Adjusted EBITDA
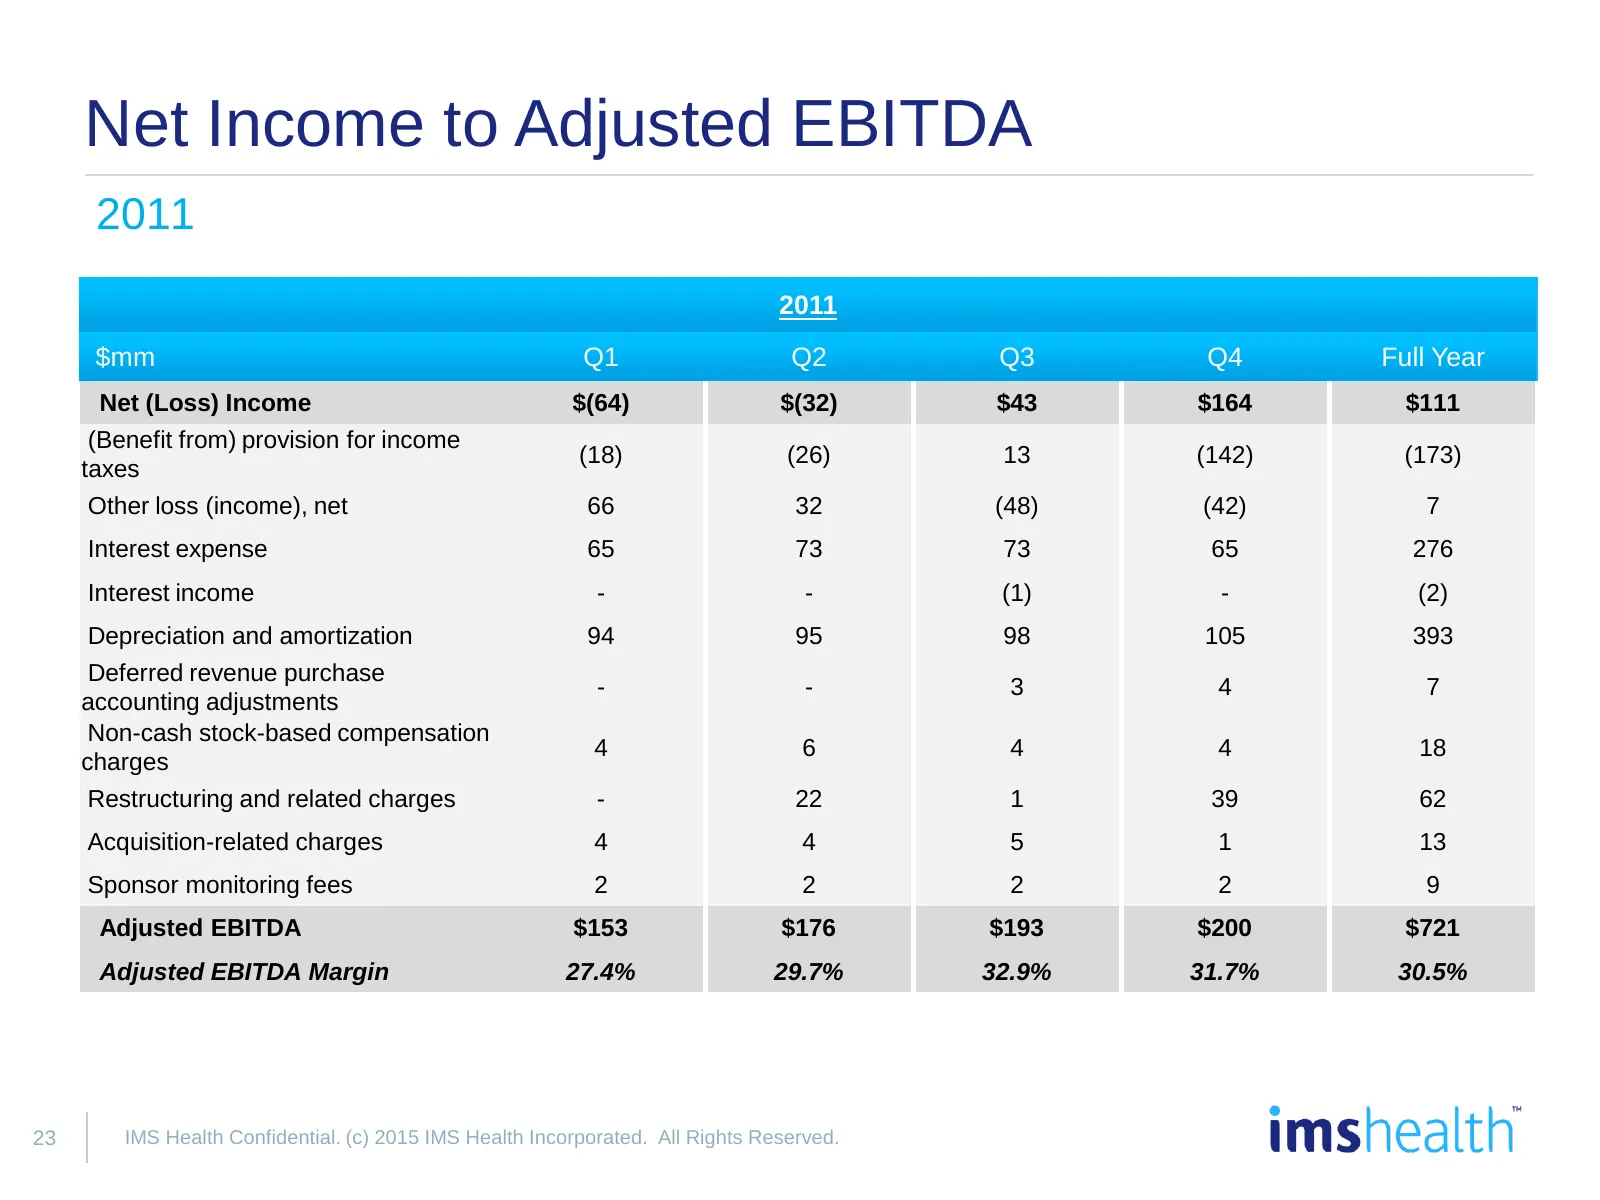
Net Income to Adjusted EBITDA 2011 2011 $mm Q1 Q2 Q3 Q4 Full Year Net (Loss) Income $(64) $(32) $43 $164 $111 (Benefit from) provision for income (18) (26) 13 (142) (173) taxes Other loss (income), net 66 32 (48) (42) 7 Interest expense 65 73 73 65 276 Interest income - - (1) - (2) Depreciation and
Slide 25: Net Income to Adjusted EBITDA
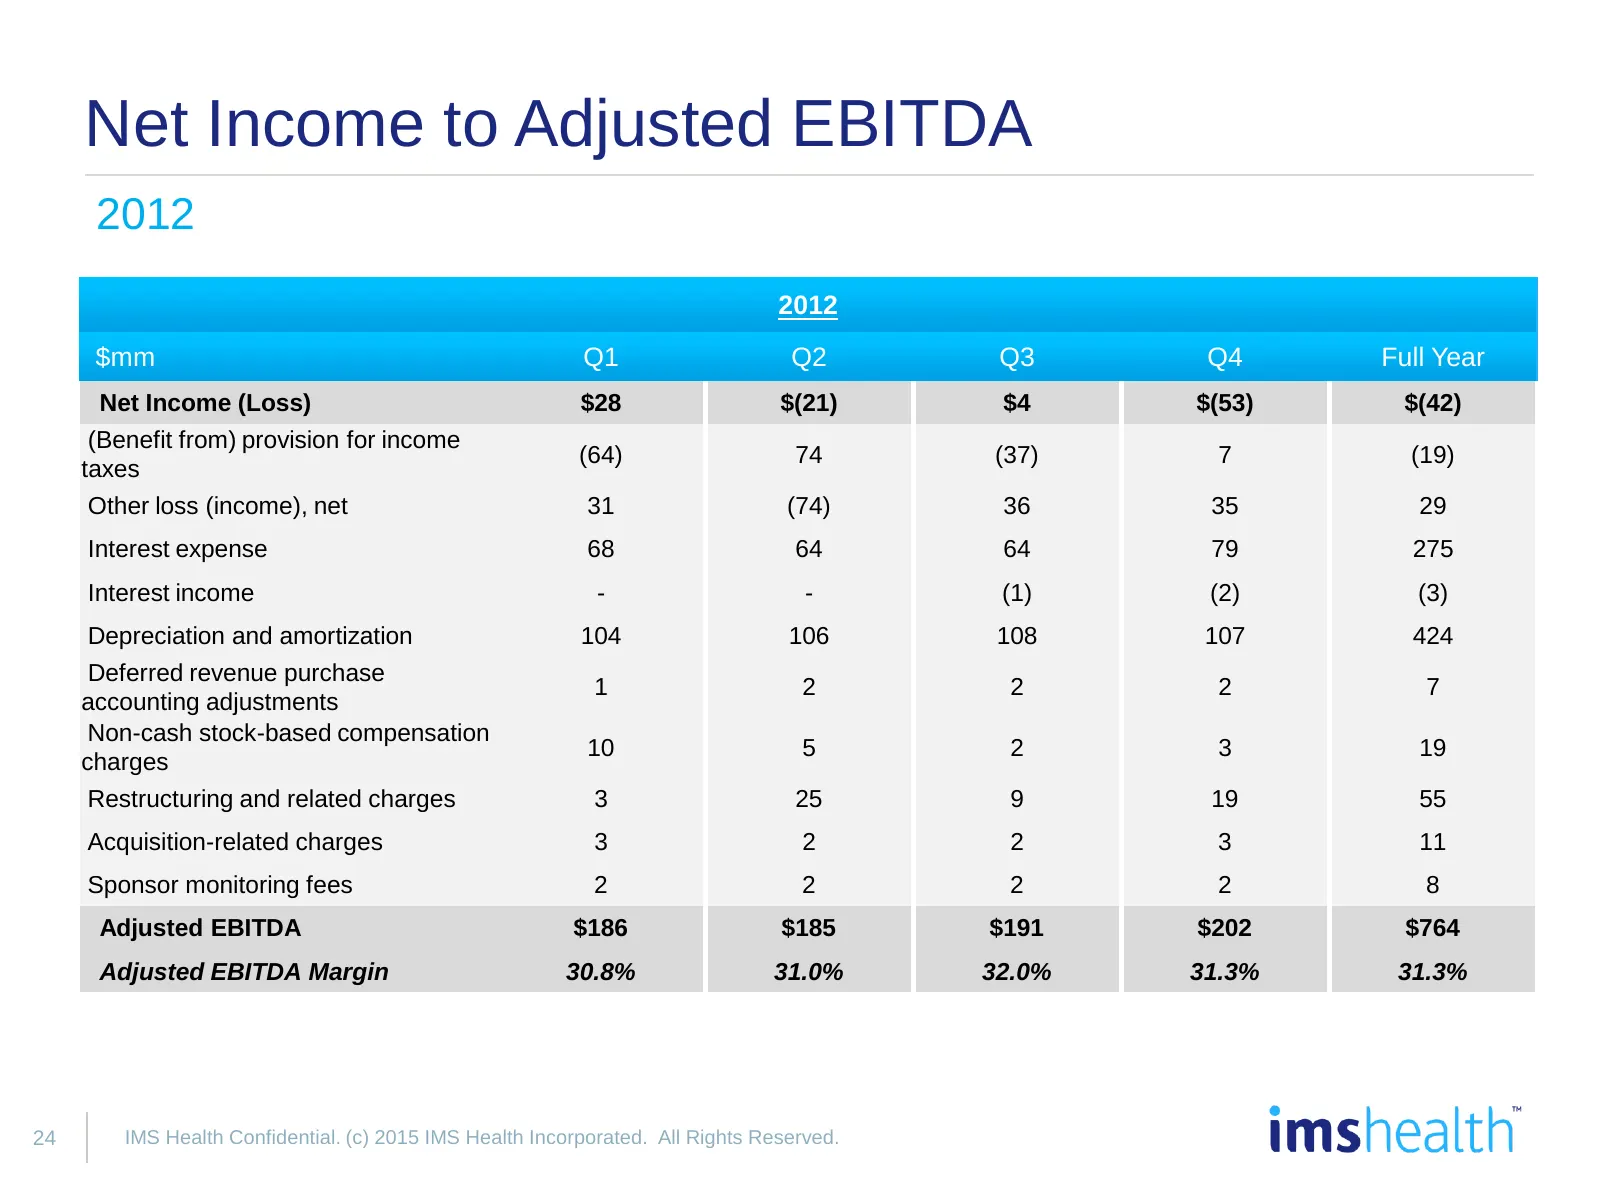
Net Income to Adjusted EBITDA 2012 2012 $mm Q1 Q2 Q3 Q4 Full Year Net Income (Loss) $28 $(21) $4 $(53) $(42) (Benefit from) provision for income (64) 74 (37) 7 (19) taxes Other loss (income), net 31 (74) 36 35 29 Interest expense 68 64 64 79 275 Interest income - - (1) (2) (3) Depreciation and amort
Slide 26: Net Income to Adjusted EBITDA
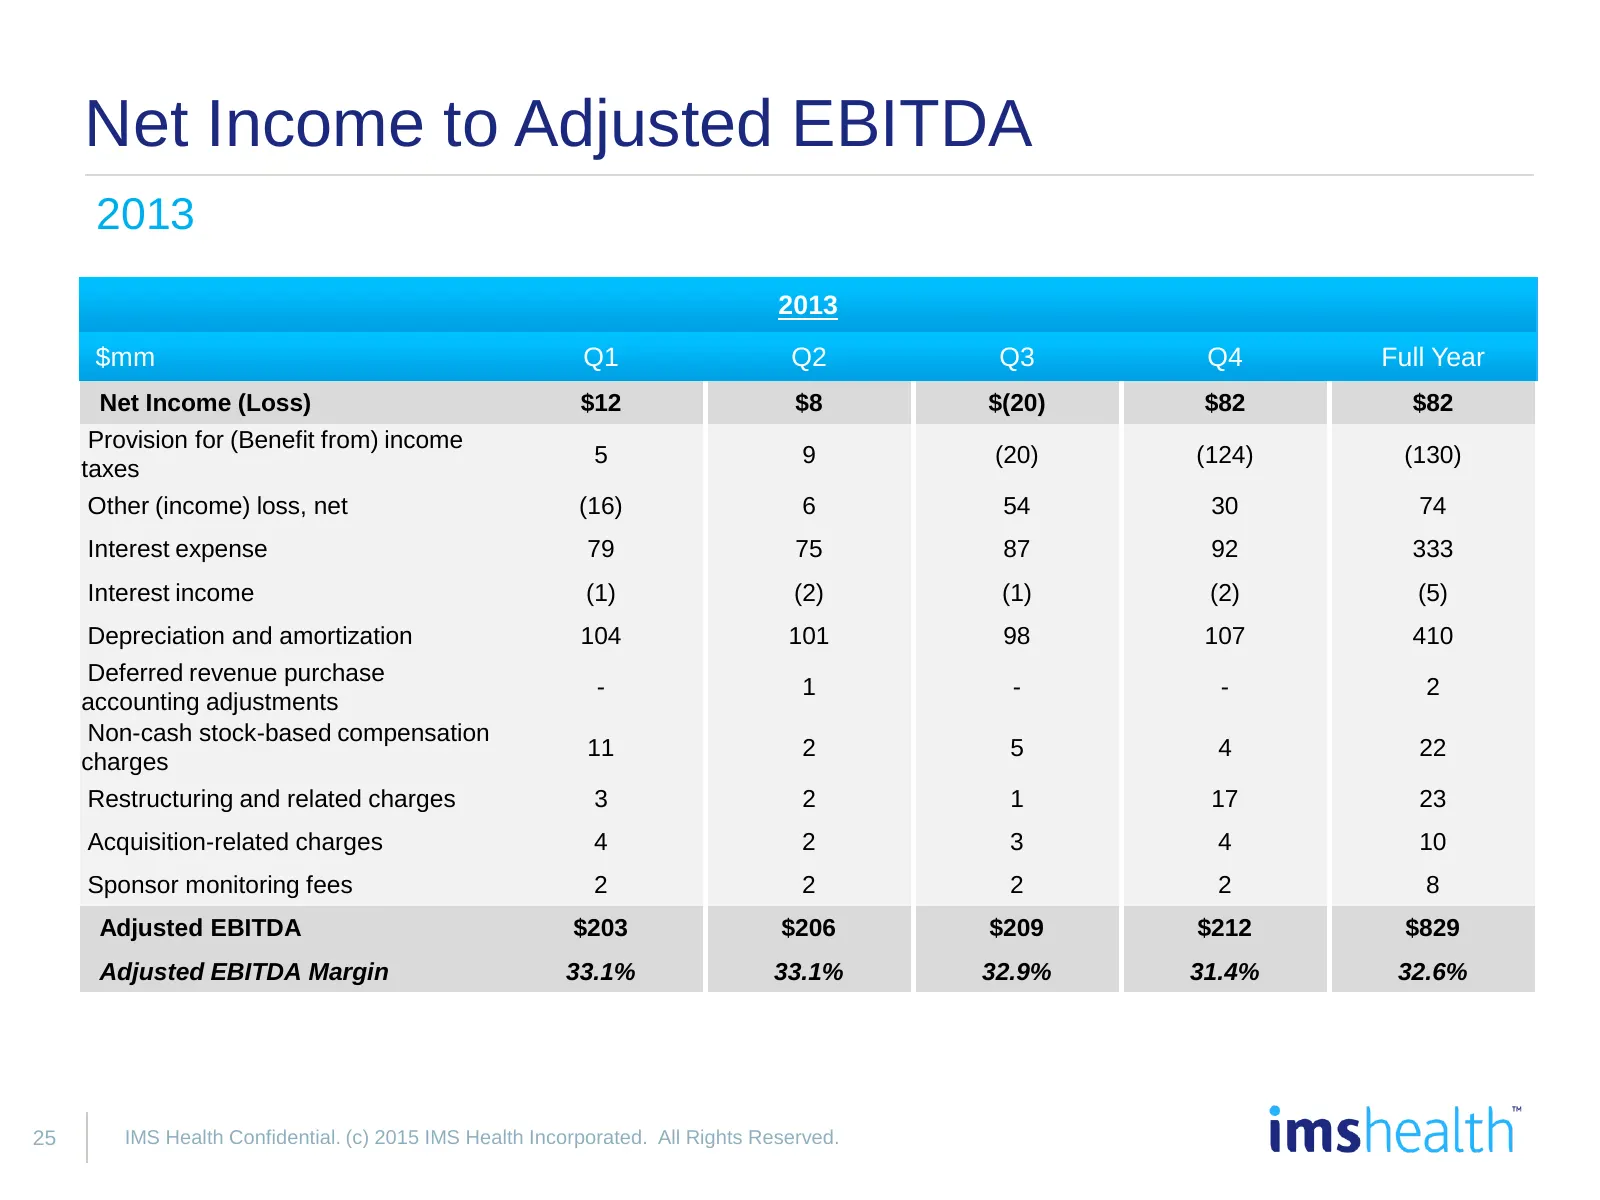
Net Income to Adjusted EBITDA 2013 2013 $mm Q1 Q2 Q3 Q4 Full Year Net Income (Loss) $12 $8 $(20) $82 $82 Provision for (Benefit from) income 5 9 (20) (124) (130) taxes Other (income) loss, net (16) 6 54 30 74 Interest expense 79 75 87 92 333 Interest income (1) (2) (1) (2) (5) Depreciation and amort
Slide 27: Net Income to Adjusted EBITDA
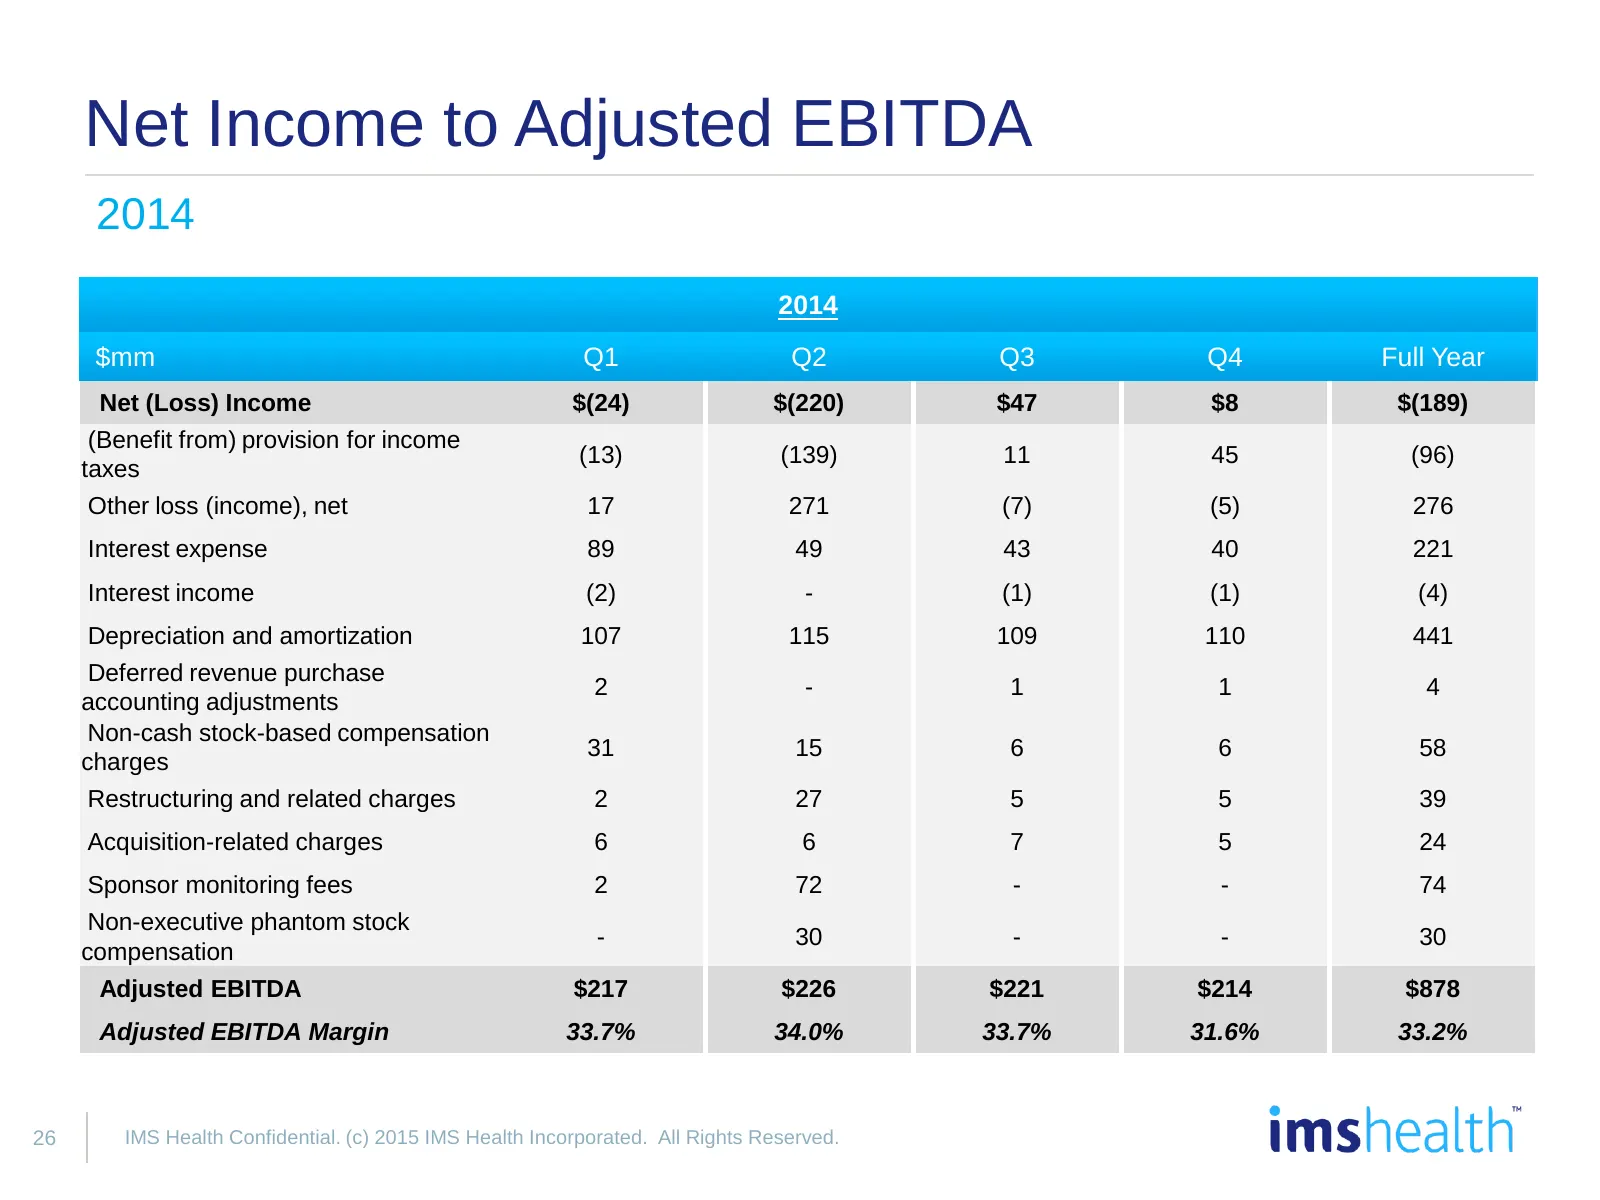
Net Income to Adjusted EBITDA 2014 2014 $mm Q1 Q2 Q3 Q4 Full Year Net (Loss) Income $(24) $(220) $47 $8 $(189) (Benefit from) provision for income (13) (139) 11 45 (96) taxes Other loss (income), net 17 271 (7) (5) 276 Interest expense 89 49 43 40 221 Interest income (2) - (1) (1) (4) Depreciation a
Slide 28: Pro Forma Adjusted EBITDA
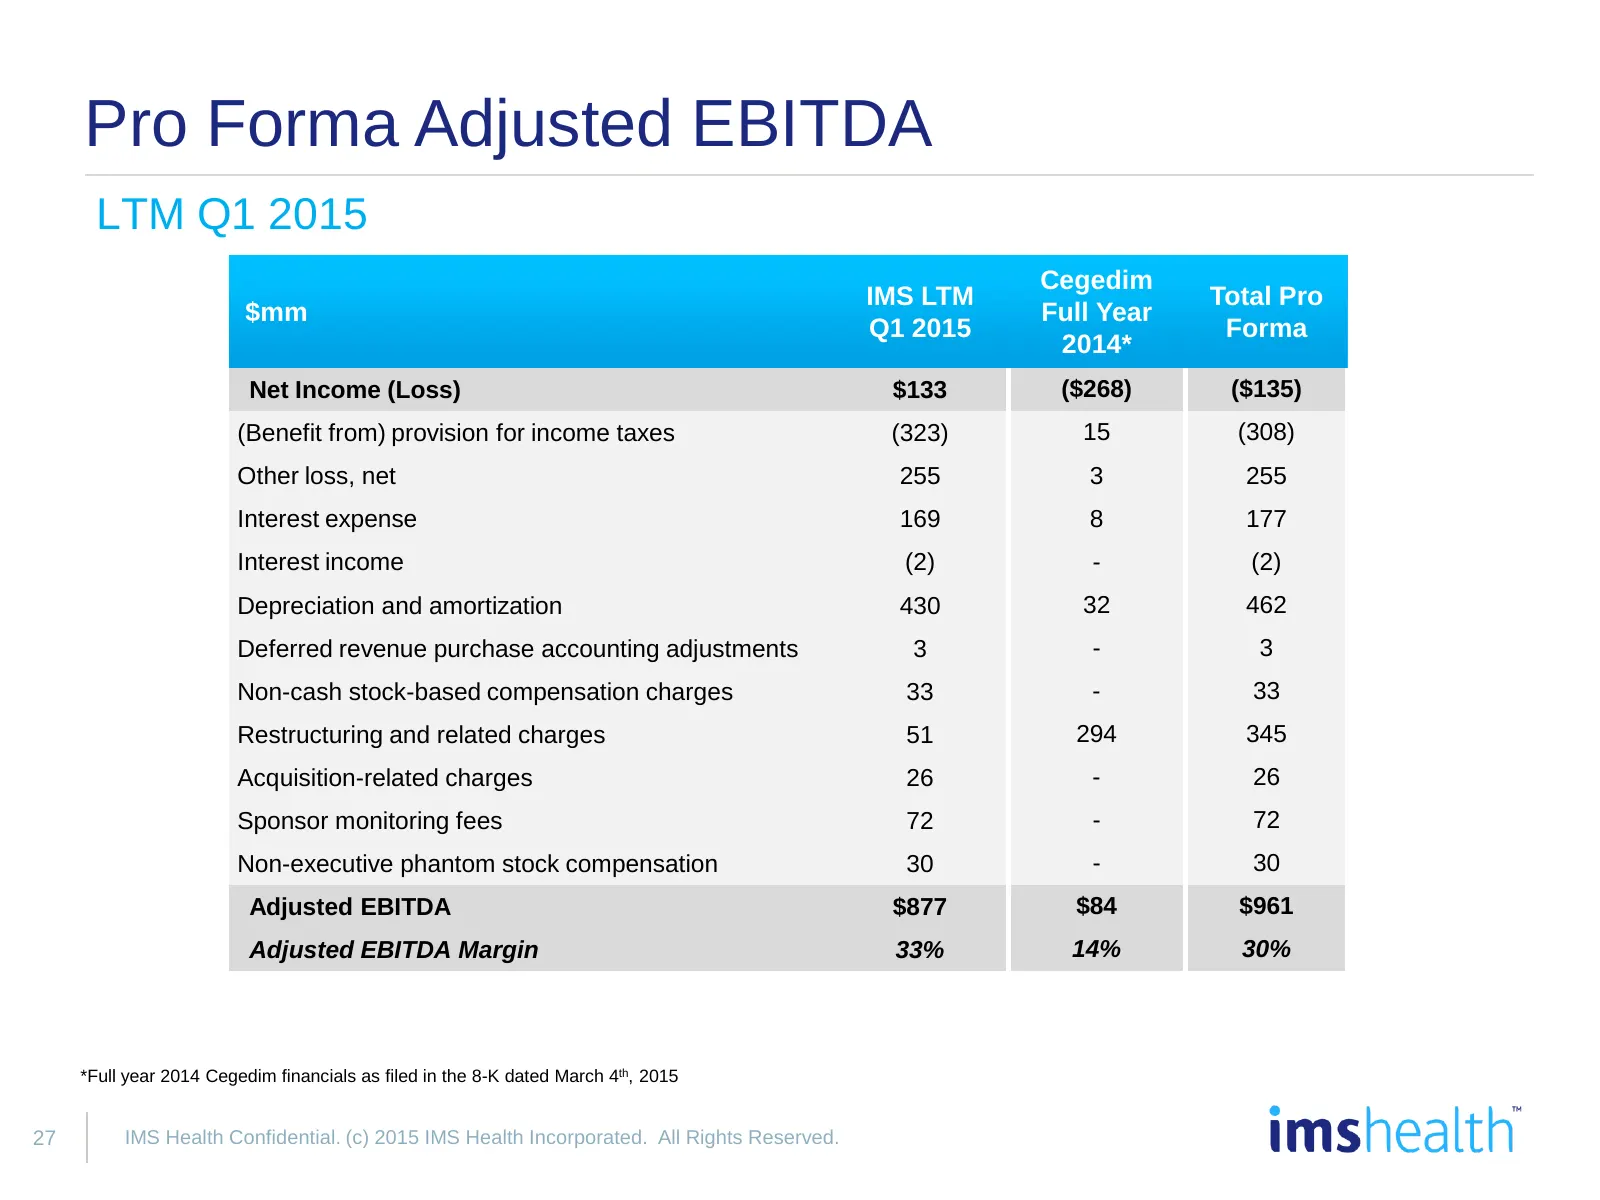
Pro Forma Adjusted EBITDA LTM Q1 2015 Cegedim IMS LTM Total Pro $mm Full Year Q1 2015 Forma 2014* Net Income (Loss) $133 ($268) ($135) (Benefit from) provision for income taxes (323) 15 (308) Other loss, net 255 3 255 Interest expense 169 8 177 Interest income (2) - (2) Depreciation and amortization
Source: Internet Archive copy of s201.q4cdn.com
More decks from IMS Health Holdings Inc
 Q2 2016 Earnings Presentation19 slides · Jul 27, 2016
 Merger or Acquisition (July 2016)23 slides · Jul 19, 2016
 Jefferies 2016 Healthcare Conference21 slides · Jun 6, 2016
 Merger or Acquisition (May 2016)13 slides · May 17, 2016
 Merger or Acquisition (May 2016)10 slides · May 11, 2016
 Merger or Acquisition (May 2016)12 slides · May 4, 2016