Bojangles' — William Blair Annual Growth Stock Conference (June 2016)
39 slides from Bojangles''s conference presentation, Jun 15, 2016
Slide 1: William Blair Annual Growth Stock Conference Investor Presentation
William Blair Annual Growth Stock Conference Investor Presentation June 2016 Exhibit 99.1
Slide 2: Cautionary Statements
Cautionary Statements Forward-Looking Statements This presentation contains forward-looking statements. All statements other than statements of historical fact included in this presentation are forward-looking statements. Forward-looking statements discuss our current expectations and projections re
Slide 3: Introduction to Bojangles'
~~ Introduction to Bojangles’ : 2" Sy te Se
Slide 4: $1+ Billion Iconic Brand with a Year History
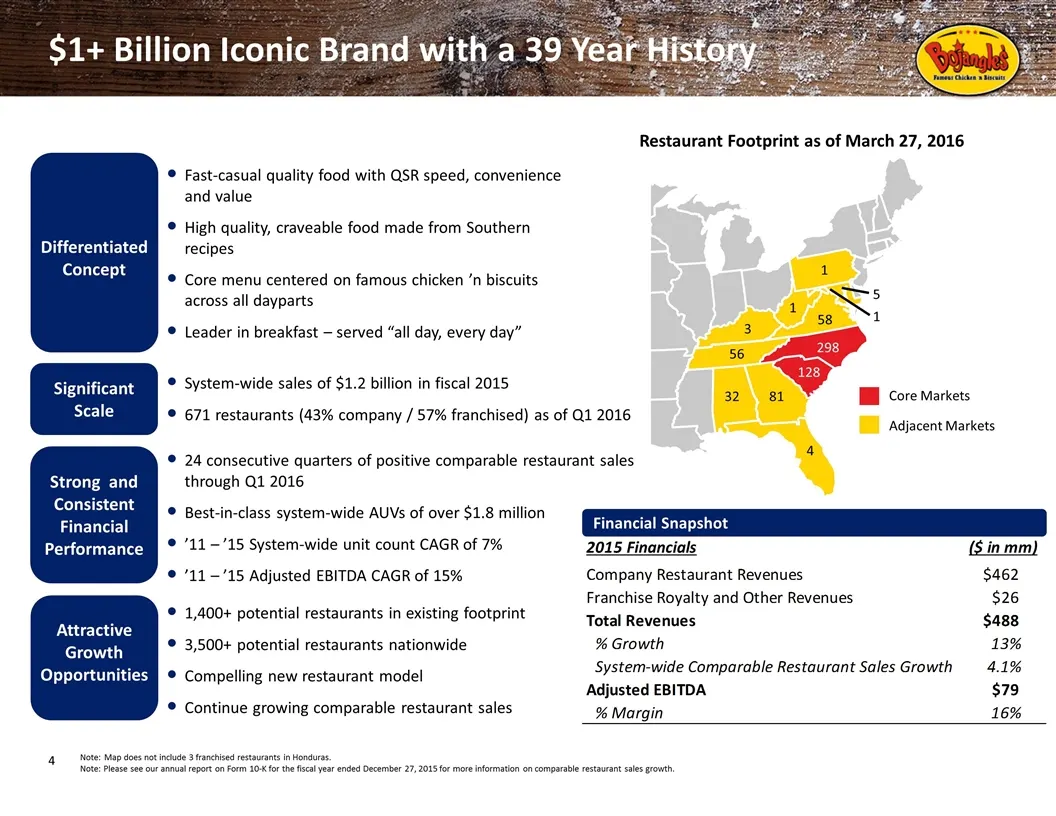
$1+ Billion Iconic Brand with a 39 Year History Strong and Consistent Financial Performance Significant Scale 1 3 4 81 32 58 56 298 128 1 5 Note:Map does not include 3 franchised restaurants in Honduras. Note: Please see our annual report on Form 10-K for the fiscal year ended December 27, 2015 for
Slide 5: Unique Competitive Positioning
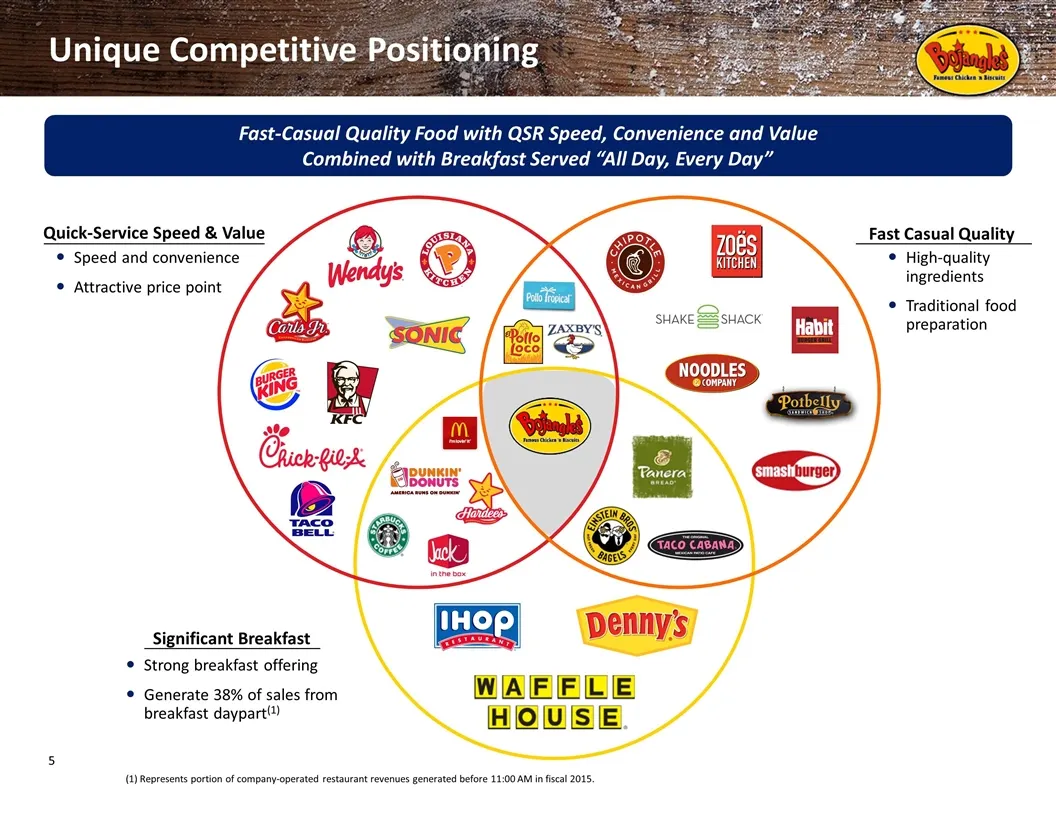
Unique Competitive Positioning Quick-Service Speed & Value Fast Casual Quality Significant Breakfast Speed and convenience Attractive price point High-quality ingredients Traditional food preparation Strong breakfast offering Generate 38% of sales from breakfast daypart(1) Fast-Casual Quality Food w
Slide 6: Right Time, Right Place, Right Reason
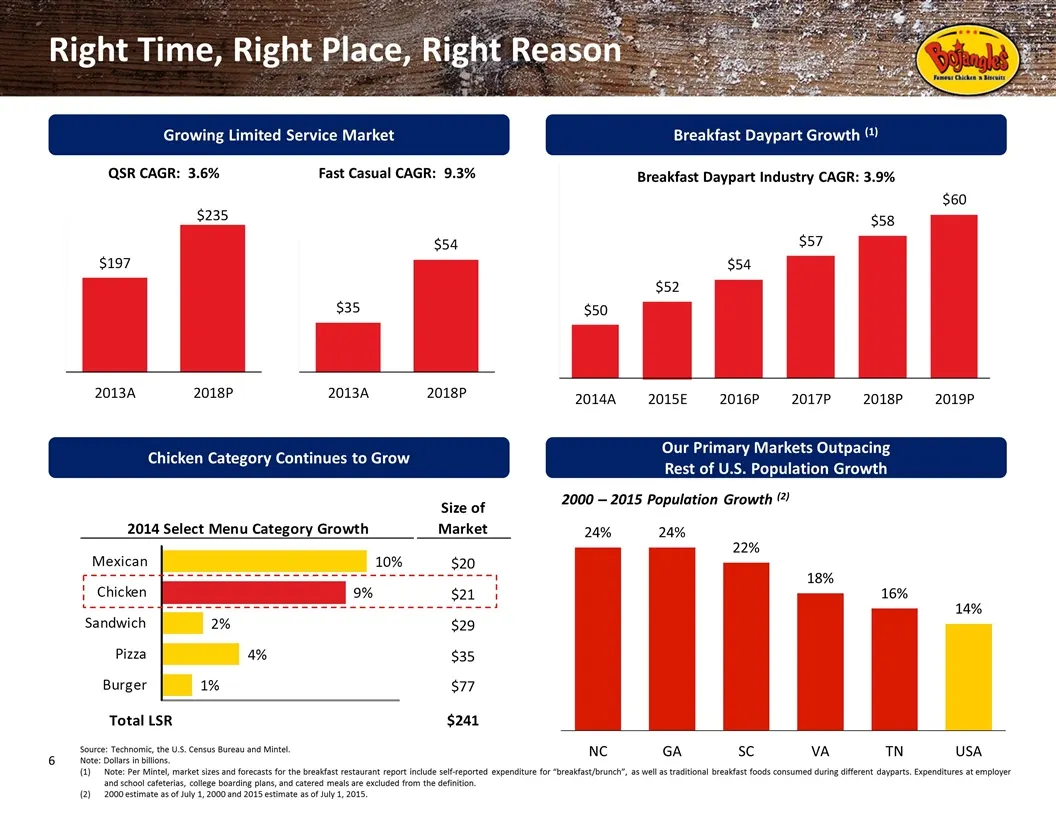
Right Time, Right Place, Right Reason Chicken Category Continues to Grow Source: Technomic, the U.S. Census Bureau and Mintel. Note: Dollars in billions. (1)Note: Per Mintel, market sizes and forecasts for the breakfast restaurant report include self-reported expenditure for “breakfast/brunch”, as w
Slide 7: Track Record of Performance
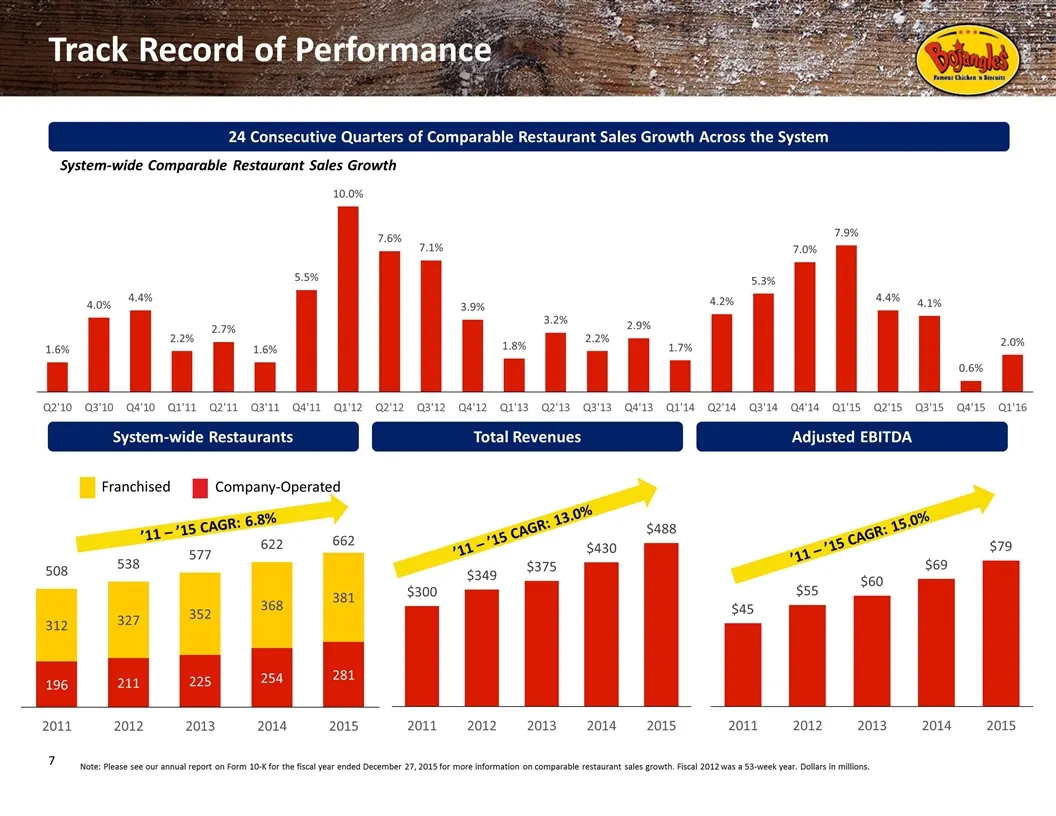
Track Record of Performance Note: Please see our annual report on Form 10-K for the fiscal year ended December 27, 2015 for more information on comparable restaurant sales growth. Fiscal 2012 was a 53-week year. Dollars in millions. 24 Consecutive Quarters of Comparable Restaurant Sales Growth Acros
Slide 8: Significant Whitespace for Expansion
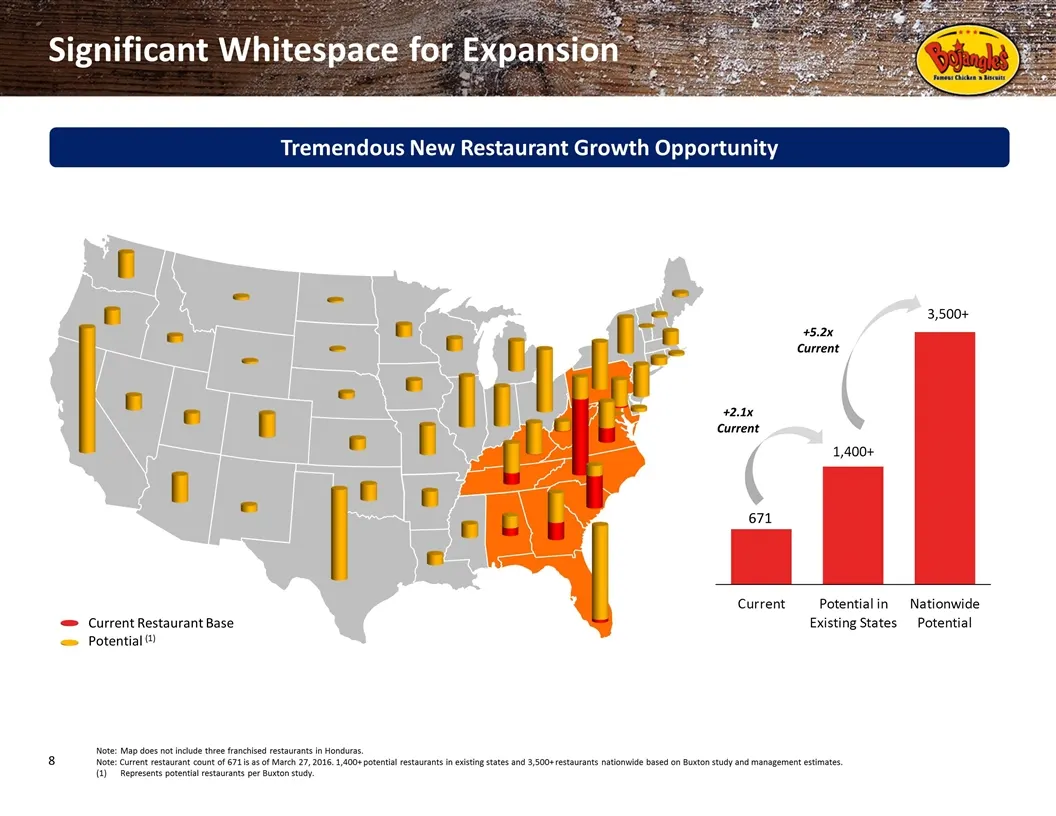
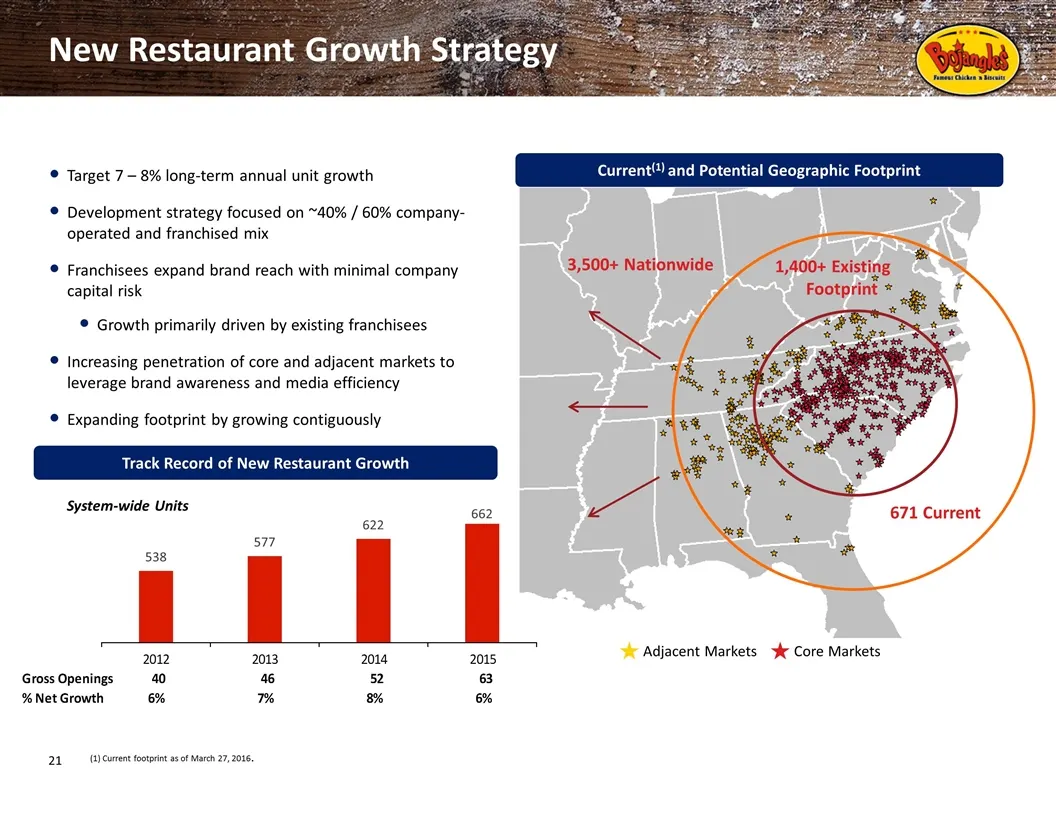
Significant Whitespace for Expansion Note:Map does not include three franchised restaurants in Honduras. Note: Current restaurant count of 671 is as of March 27, 2016. 1,400+ potential restaurants in existing states and 3,500+ restaurants nationwide based on Buxton study and management estimates. Re
Slide 9: Highly Experienced Management Team
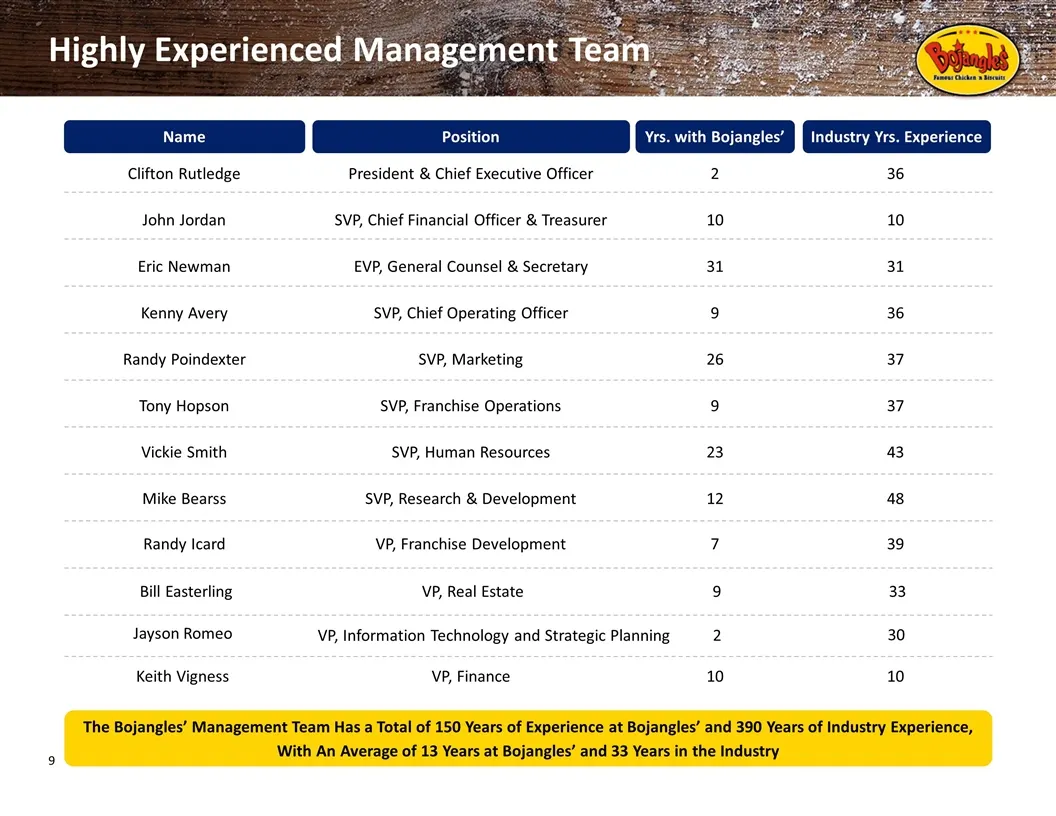
Highly Experienced Management Team Name Position Yrs. with Bojangles’ Industry Yrs. Experience Tony Hopson SVP, Franchise Operations 9 37 Vickie Smith SVP, Human Resources 23 43 Mike Bearss SVP, Research & Development 12 48 Randy Icard VP, Franchise Development 7 39 Bill Easterling VP, Real Estate 9
Slide 10: Culture is Our Secret Sauce
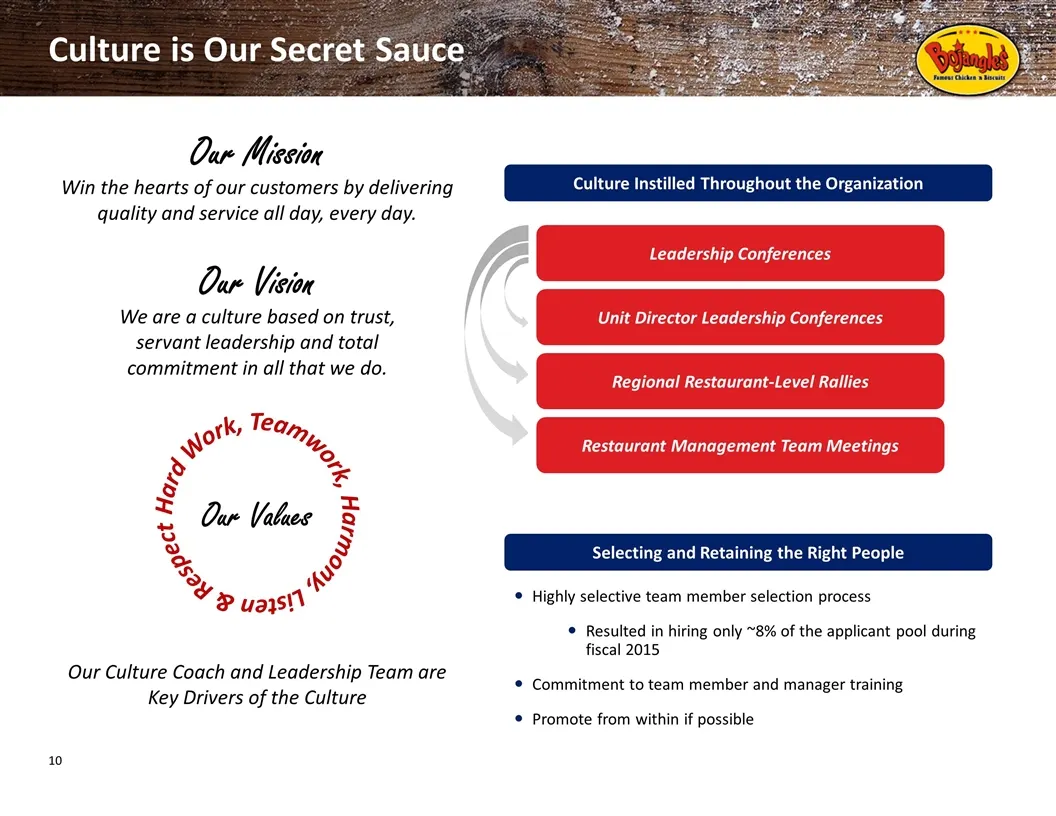
Culture is Our Secret Sauce Our Culture Coach and Leadership Team are Key Drivers of the Culture Our Vision We are a culture based on trust, servant leadership and total commitment in all that we do. Hard Work, Teamwork, Harmony, Listen & Respect Our Values Leadership Conferences Unit Director Leade
Slide 11: Deep Sense of Pride in Bojangles'
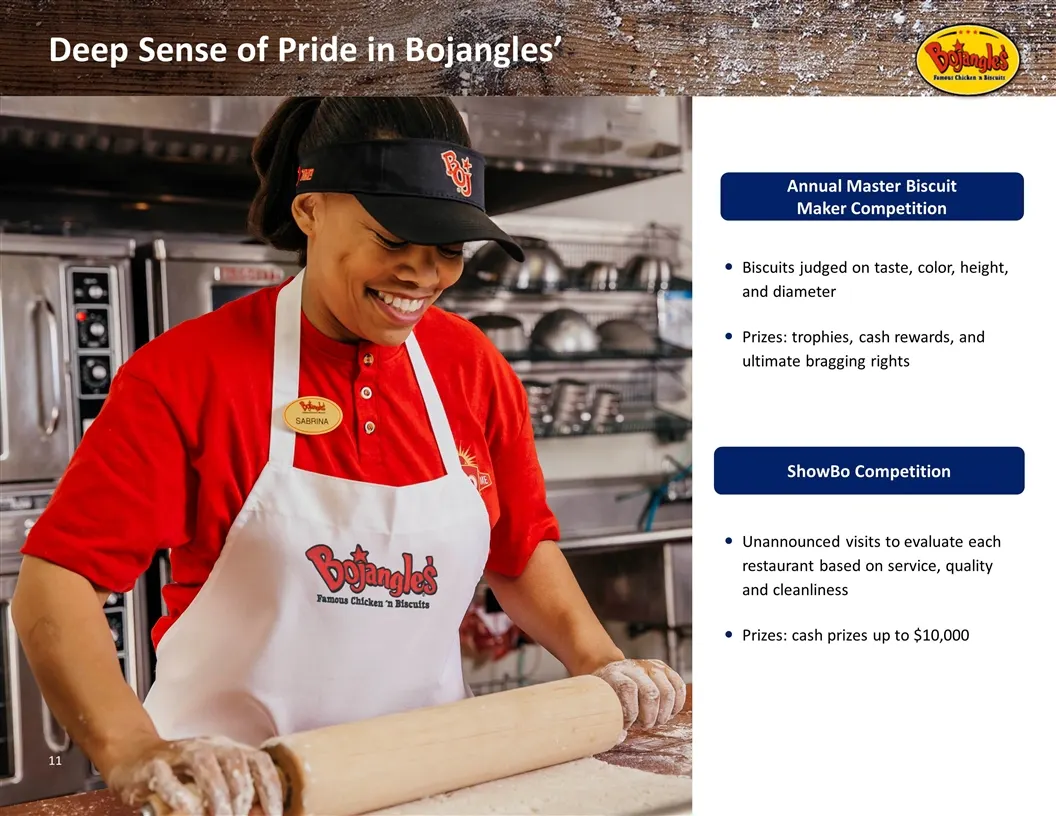
Deep Sense of Pride in Bojangles’ Unannounced visits to evaluate each restaurant based on service, quality and cleanliness Prizes: cash prizes up to $10,000 Biscuits judged on taste, color, height, and diameter Prizes: trophies, cash rewards, and ultimate bragging rights Annual Master Biscuit Maker
Slide 12: The Bo Difference
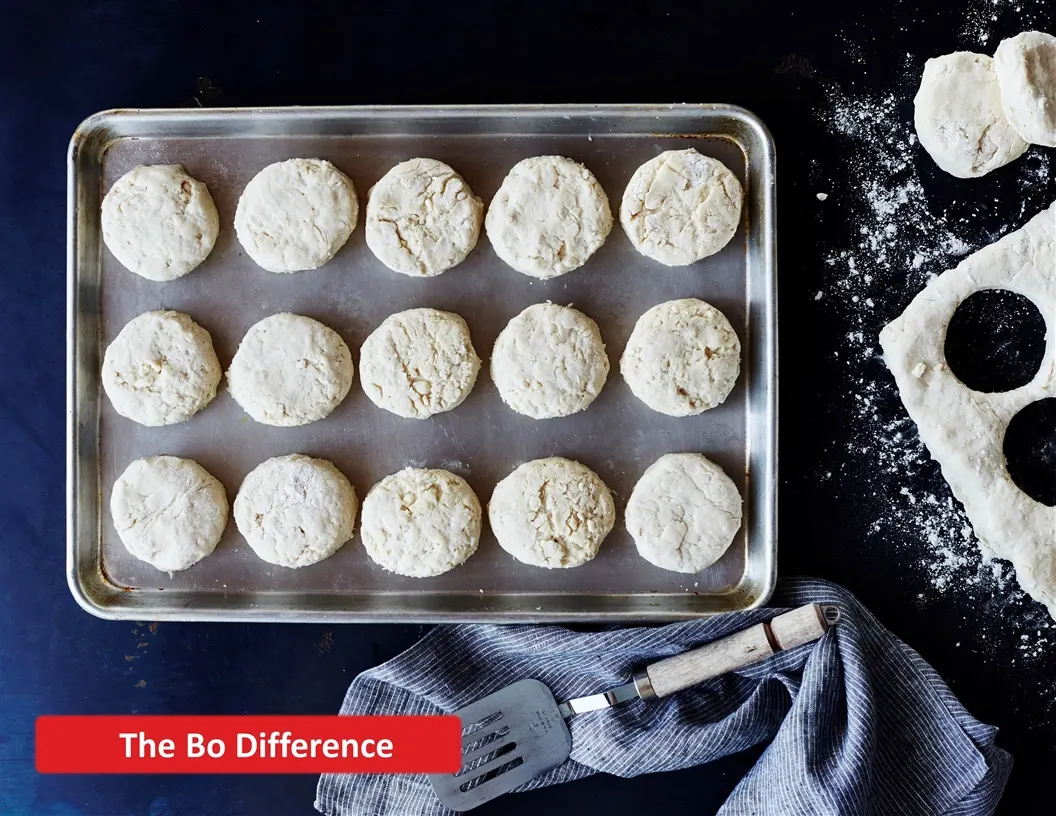
The Bo Difference
Slide 13: Our Investment Highlights
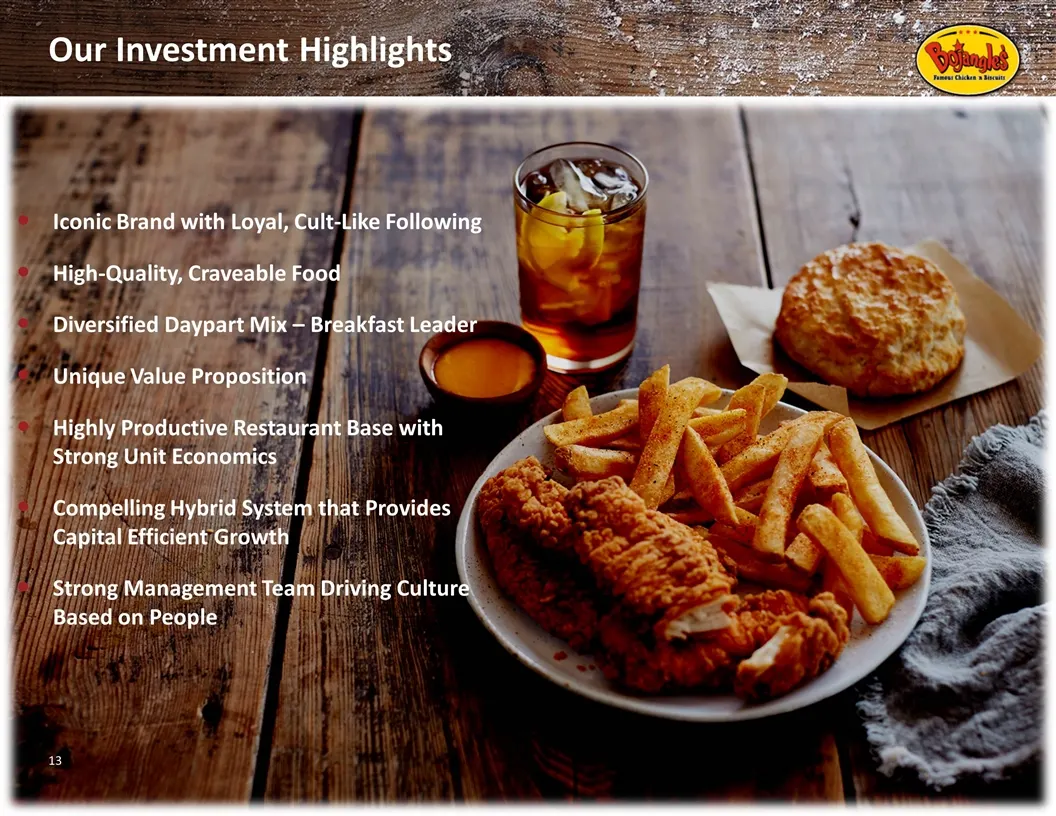
Our Investment Highlights Iconic Brand with Loyal, Cult-Like Following High-Quality, Craveable Food Diversified Daypart Mix – Breakfast Leader Unique Value Proposition Highly Productive Restaurant Base with Strong Unit Economics Compelling Hybrid System that Provides Capital Efficient Growth Strong
Slide 14: Iconic Brand with Loyal, Cult-Like Following
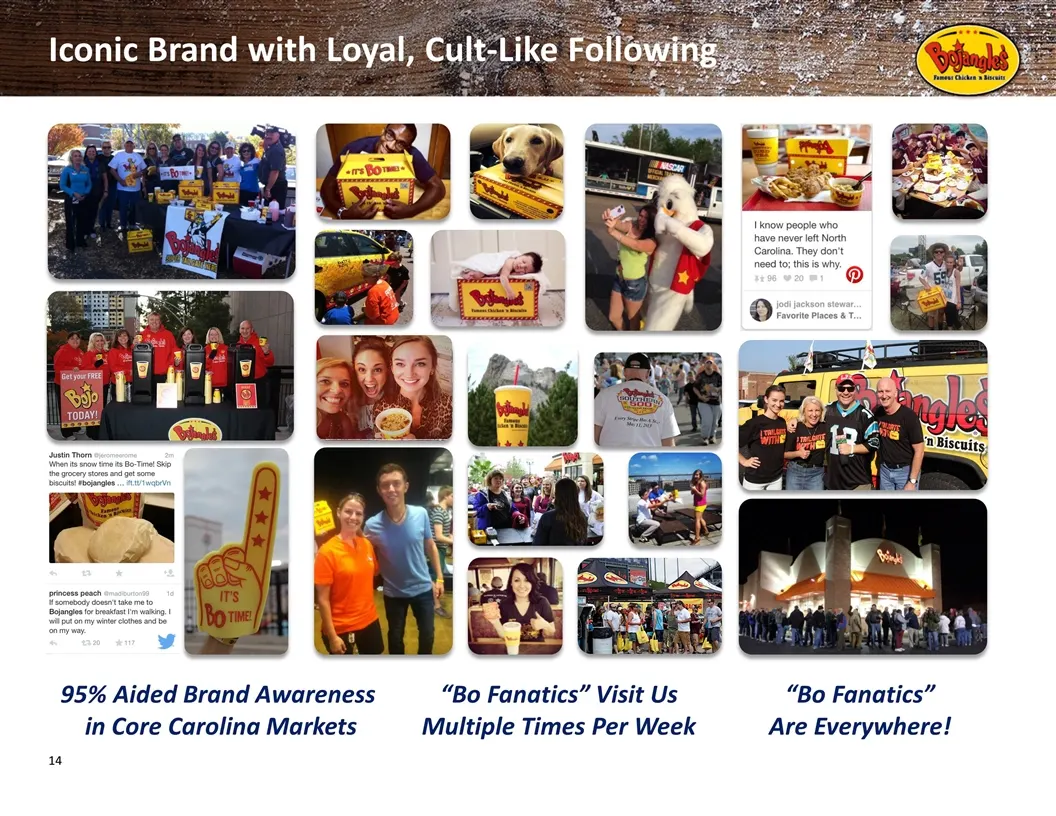
Iconic Brand with Loyal, Cult-Like Following 95% Aided Brand Awareness in Core Carolina Markets “Bo Fanatics” Visit Us Multiple Times Per Week “Bo Fanatics” Are Everywhere!
Slide 15: It's All About the High-Quality, Craveable Food
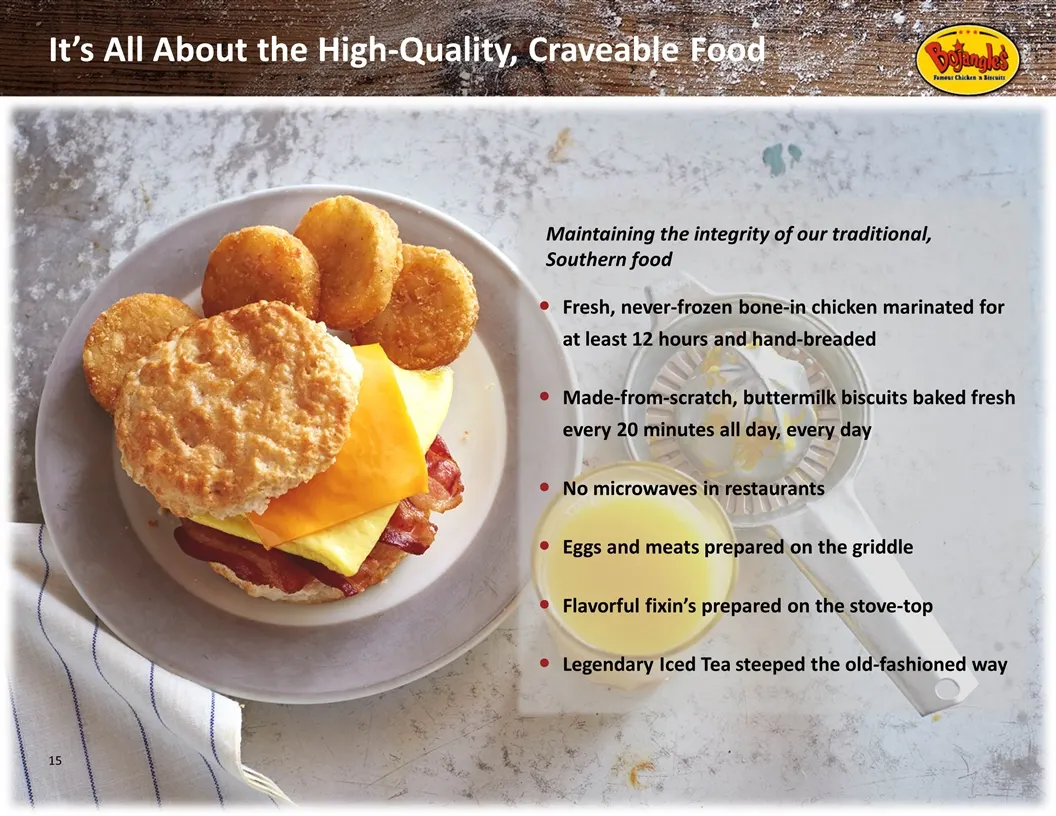
It’s All About the High-Quality, Craveable Food Fresh, never-frozen bone-in chicken marinated for at least 12 hours and hand-breaded Made-from-scratch, buttermilk biscuits baked fresh every 20 minutes all day, every day No microwaves in restaurants Eggs and meats prepared on the griddle Flavorful fi
Slide 16: Broad Menu with Value Across All Dayparts
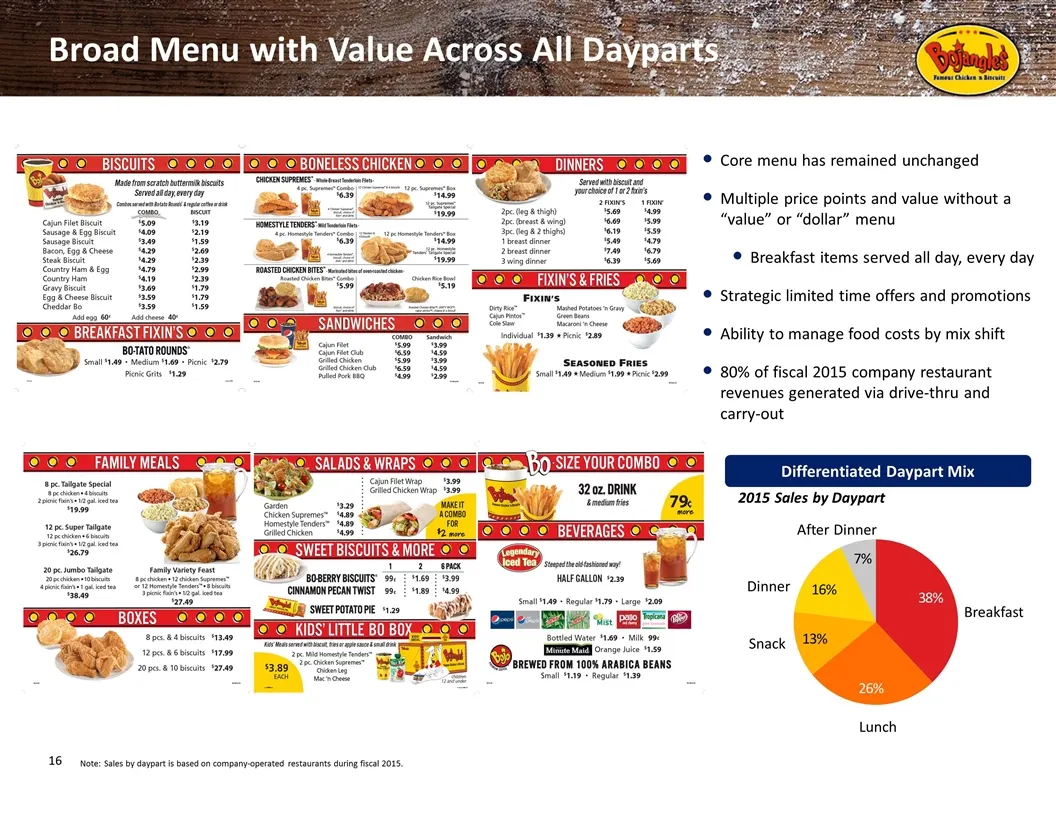
Broad Menu with Value Across All Dayparts Core menu has remained unchanged Multiple price points and value without a “value” or “dollar” menu Breakfast items served all day, every day Strategic limited time offers and promotions Ability to manage food costs by mix shift 80% of fiscal 2015 company re
Slide 17: Unique Value Proposition
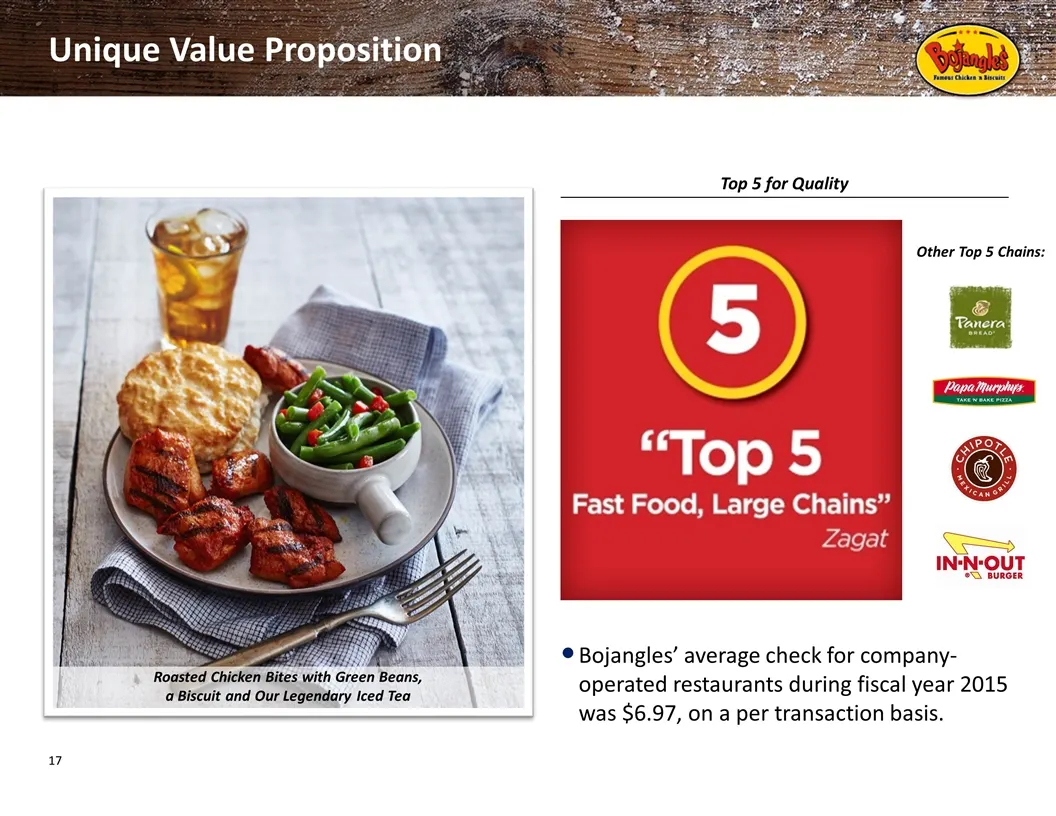
Roasted Chicken Bites with Green Beans, a Biscuit and Our Legendary Iced Tea Unique Value Proposition Other Top 5 Chains: Top 5 for Quality Bojangles’ average check for company-operated restaurants during fiscal year 2015 was $6.97, on a per transaction basis.
Slide 18: We Own Breakfast
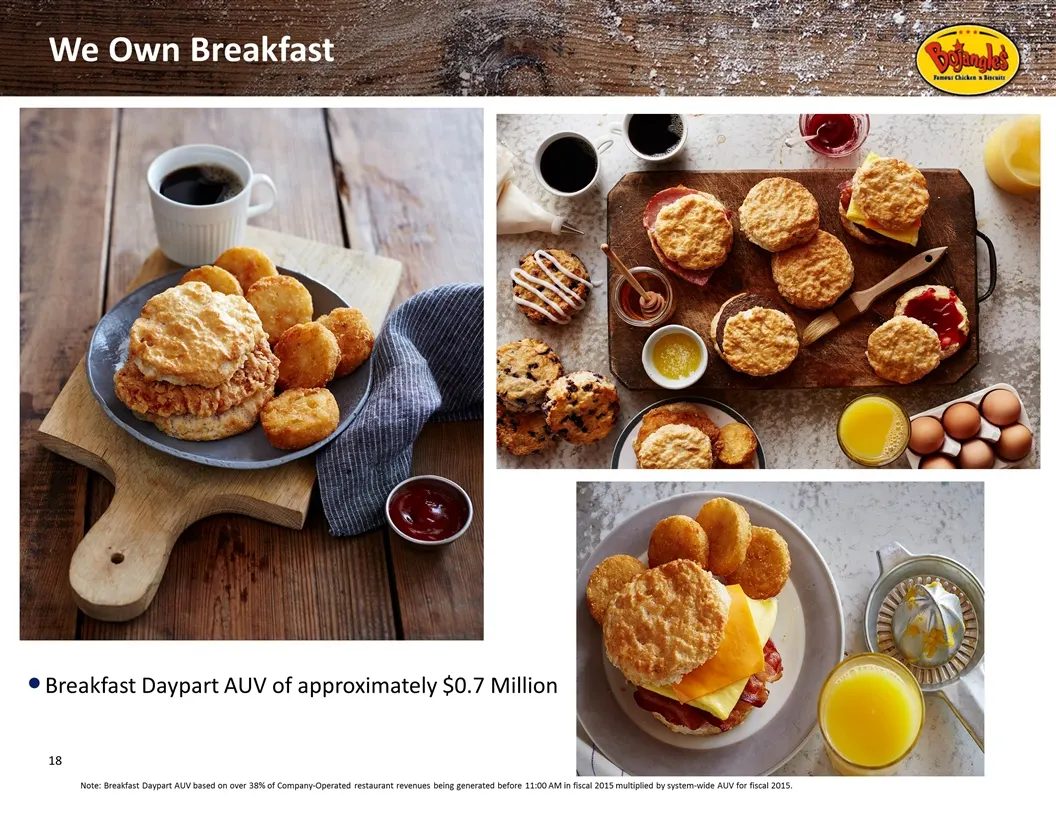
We Own Breakfast Note: Breakfast Daypart AUV based on over 38% of Company-Operated restaurant revenues being generated before 11:00 AM in fiscal 2015 multiplied by system-wide AUV for fiscal 2015. Breakfast Daypart AUV of approximately $0.7 Million
Slide 19: Highly Productive Restaurant Base
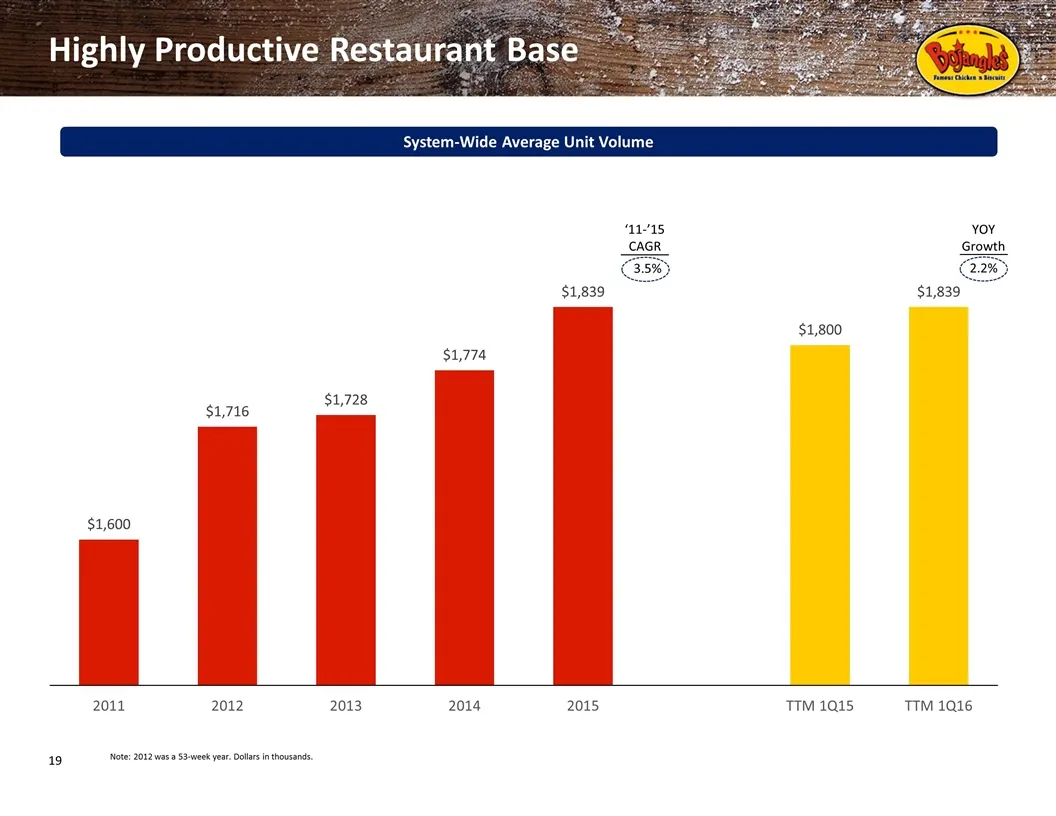
Highly Productive Restaurant Base Note: 2012 was a 53-week year. Dollars in thousands. System-Wide Average Unit Volume YOY Growth 2.2% ‘11-’15 CAGR 3.5%
Slide 20: Growth Strategies
Growth Strategies
Slide 21: New Restaurant Growth Strategy
New Restaurant Growth Strategy Track Record of New Restaurant Growth System-wide Units Target 7 – 8% long-term annual unit growth Development strategy focused on ~40% / 60% company-operated and franchised mix Franchisees expand brand reach with minimal company capital risk Growth primarily driven by
Slide 22: Market Development Strategy
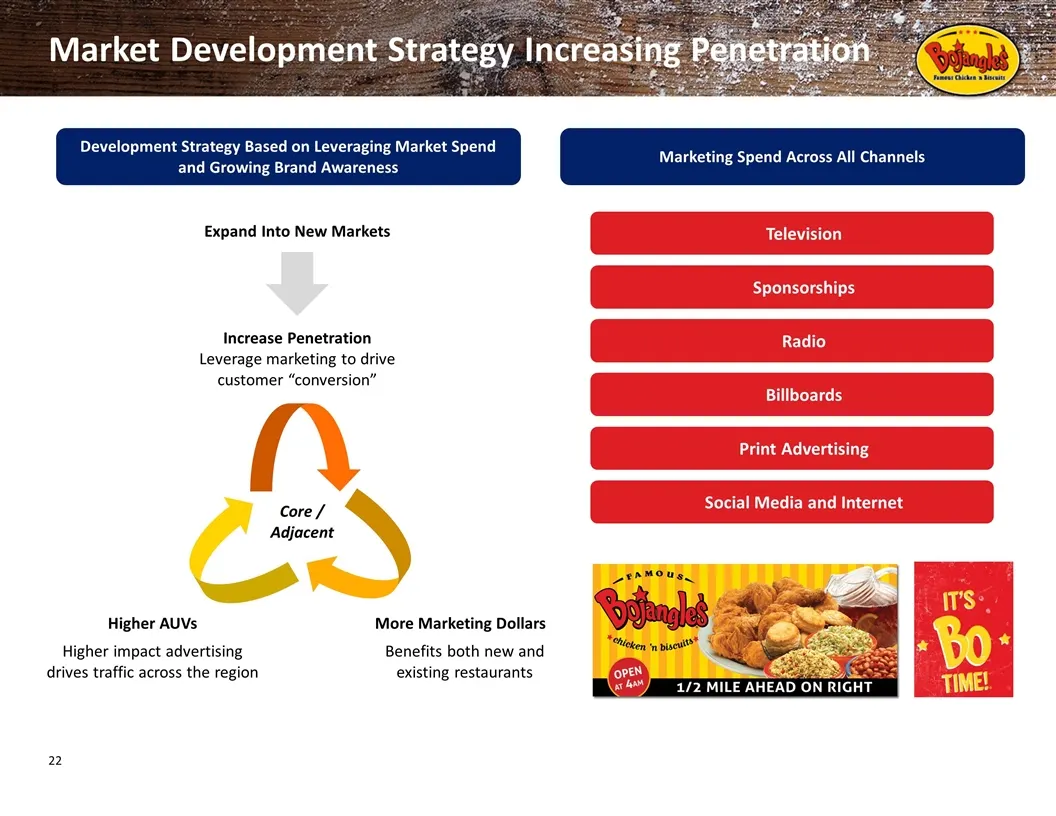
Market Development Strategy Increasing Penetration Marketing Spend Across All Channels Development Strategy Based on Leveraging Market Spend and Growing Brand Awareness Leverage marketing to drive customer “conversion” Benefits both new and existing restaurants Higher impact advertising drives traff
Slide 23: Compelling New Restaurant Model
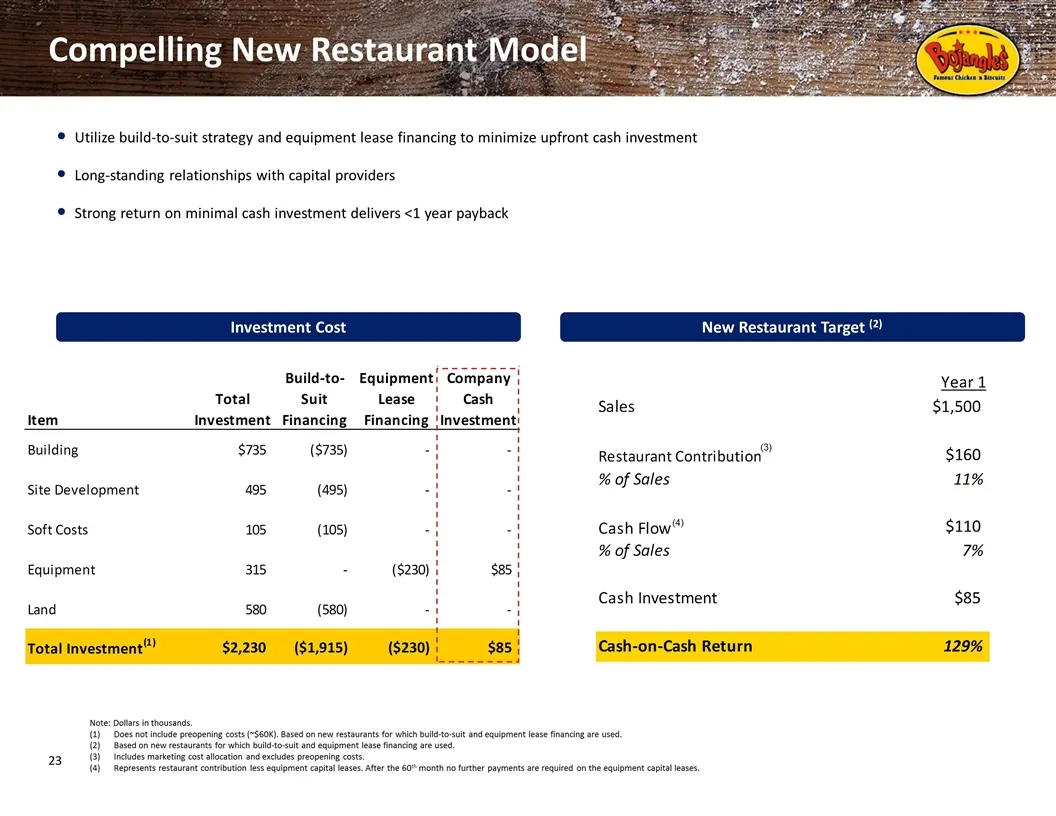
Compelling New Restaurant Model New Restaurant Target (2) Investment Cost Utilize build-to-suit strategy and equipment lease financing to minimize upfront cash investment Long-standing relationships with capital providers Strong return on minimal cash investment delivers <1 year payback Note: Dollar
Slide 24: Healthy and Growing Franchisee Base
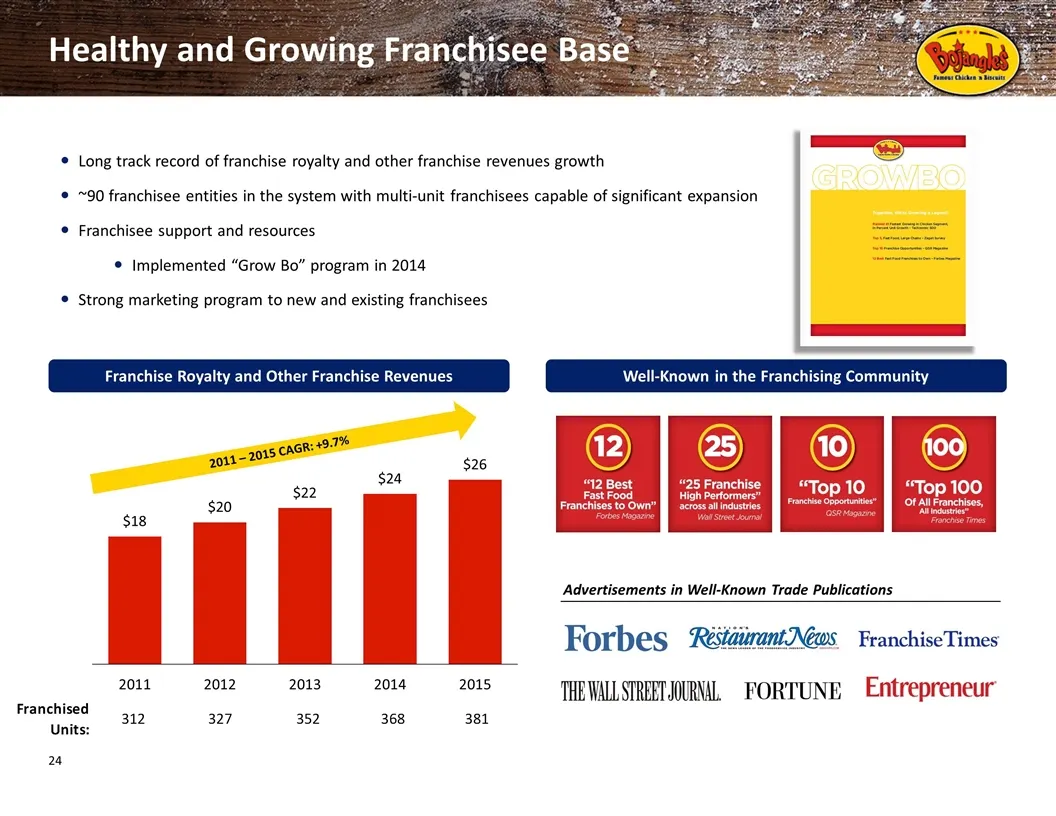
Healthy and Growing Franchisee Base Long track record of franchise royalty and other franchise revenues growth ~90 franchisee entities in the system with multi-unit franchisees capable of significant expansion Franchisee support and resources Implemented “Grow Bo” program in 2014 Strong marketing pr
Slide 25: Continue Driving Comparable Restaurant Sales Growth
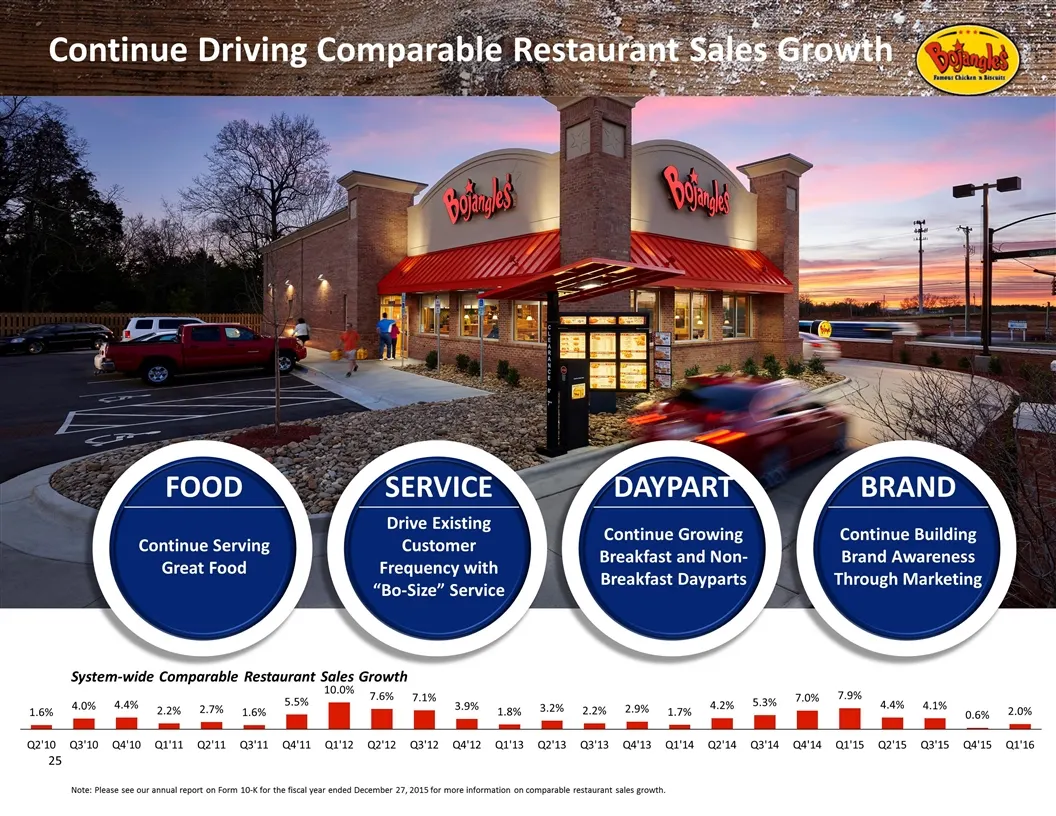
Continue Driving Comparable Restaurant Sales Growth Continue Building Brand Awareness Through Marketing BRAND Continue Growing Breakfast and Non-Breakfast Dayparts DAYPART Drive Existing Customer Frequency with “Bo-Size” Service SERVICE Continue Serving Great Food FOOD System-wide Comparable Restaur
Slide 26: Delivering "Bo-Size" Service
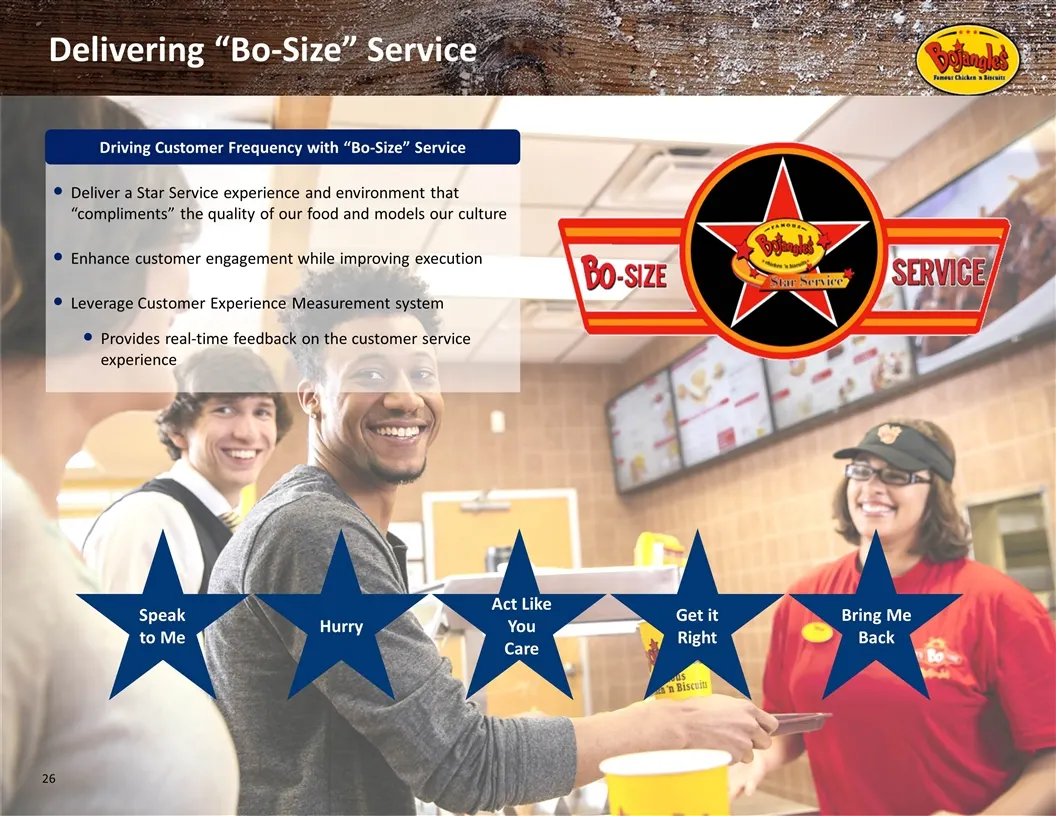
Delivering “Bo-Size” Service Speak to Me Act Like You Care Hurry Get it Right Bring Me Back Driving Customer Frequency with “Bo-Size” Service Deliver a Star Service experience and environment that “compliments” the quality of our food and models our culture Enhance customer engagement while improvin
Slide 27: Growing Across Breakfast and Non-Breakfast Dayparts
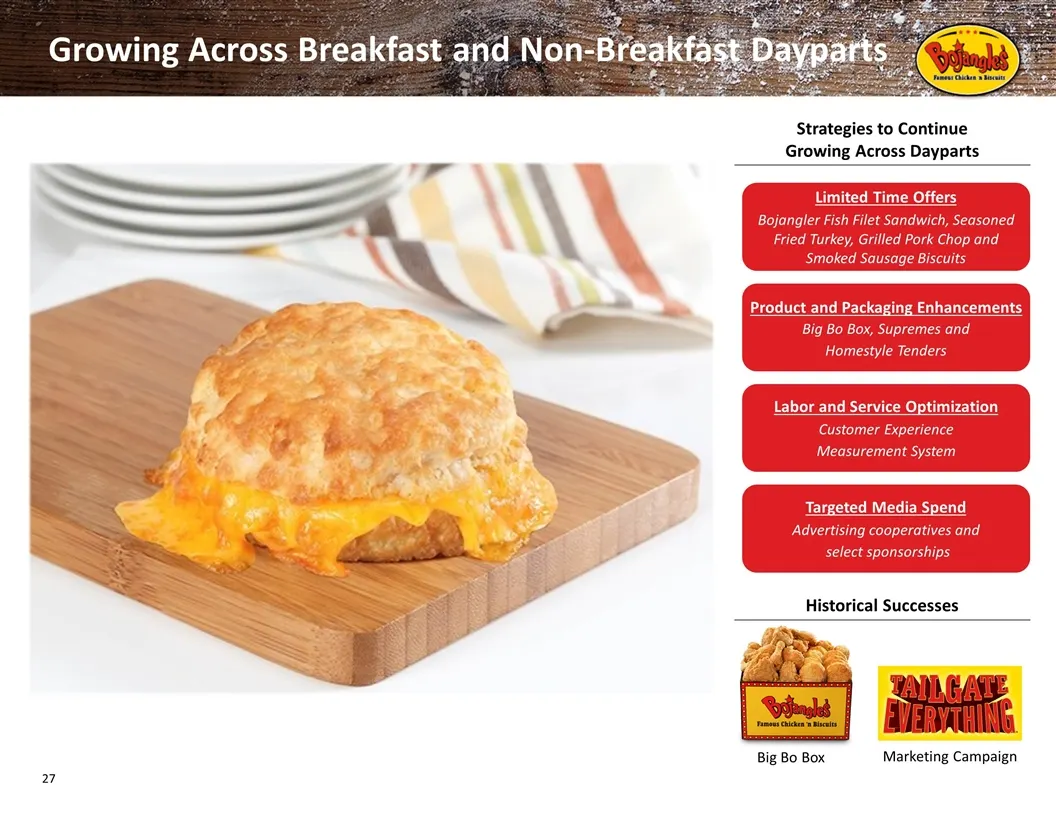
Growing Across Breakfast and Non-Breakfast Dayparts Strategies to Continue Growing Across Dayparts Historical Successes Limited Time Offers Bojangler Fish Filet Sandwich, Seasoned Fried Turkey, Grilled Pork Chop and Smoked Sausage Biscuits Labor and Service Optimization Customer Experience Measureme
Slide 28: Financials
Financials
Slide 29: Strong Historical Growth
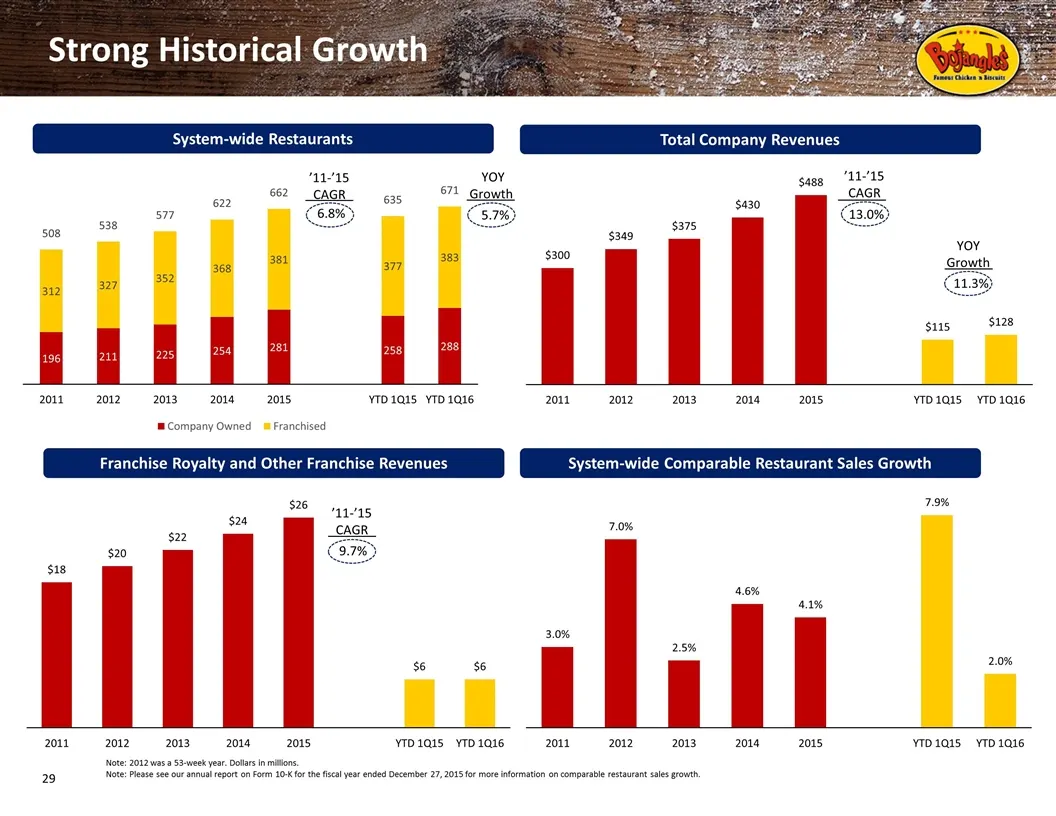
Strong Historical Growth Total Company Revenues Franchise Royalty and Other Franchise Revenues System-wide Comparable Restaurant Sales Growth Note: 2012 was a 53-week year. Dollars in millions. Note: Please see our annual report on Form 10-K for the fiscal year ended December 27, 2015 for more infor
Slide 30: Track Record of Driving Profitability
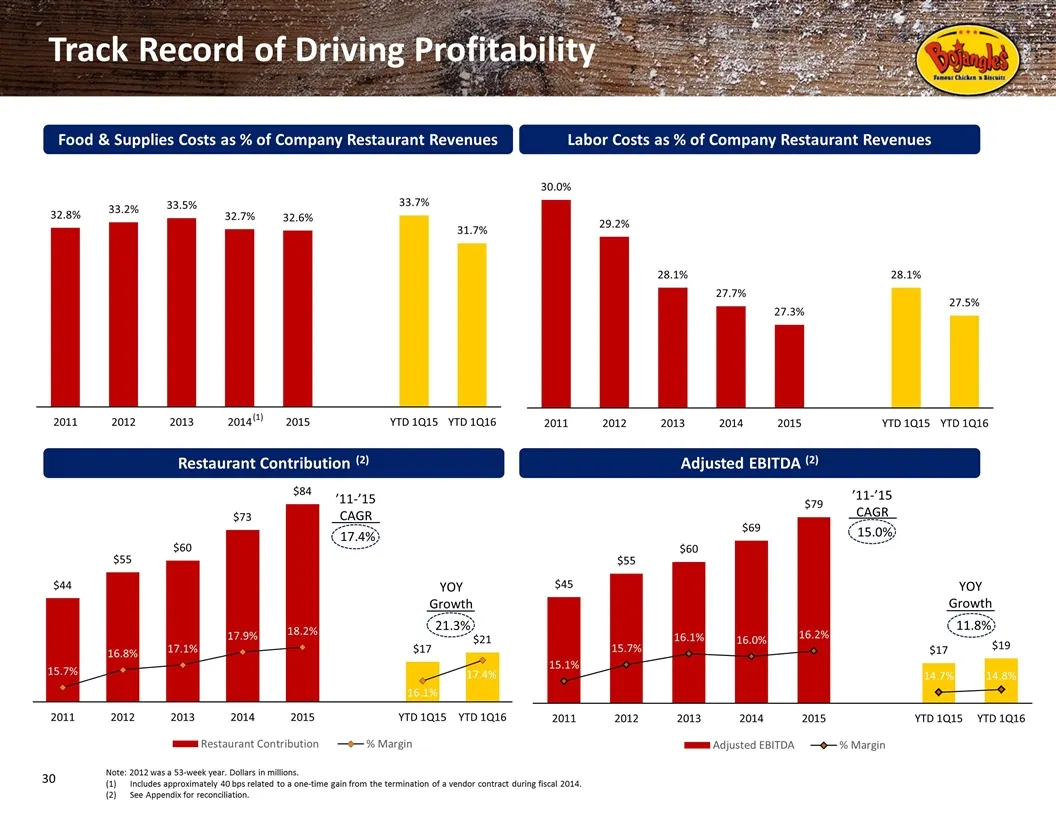
Track Record of Driving Profitability Note: 2012 was a 53-week year. Dollars in millions. Includes approximately 40 bps related to a one-time gain from the termination of a vendor contract during fiscal 2014. See Appendix for reconciliation. ’11-’15 CAGR 15.0% ’11-’15 CAGR 17.4% Labor Costs as % of
Slide 31: Strong Free Cash Flow and Capitalization
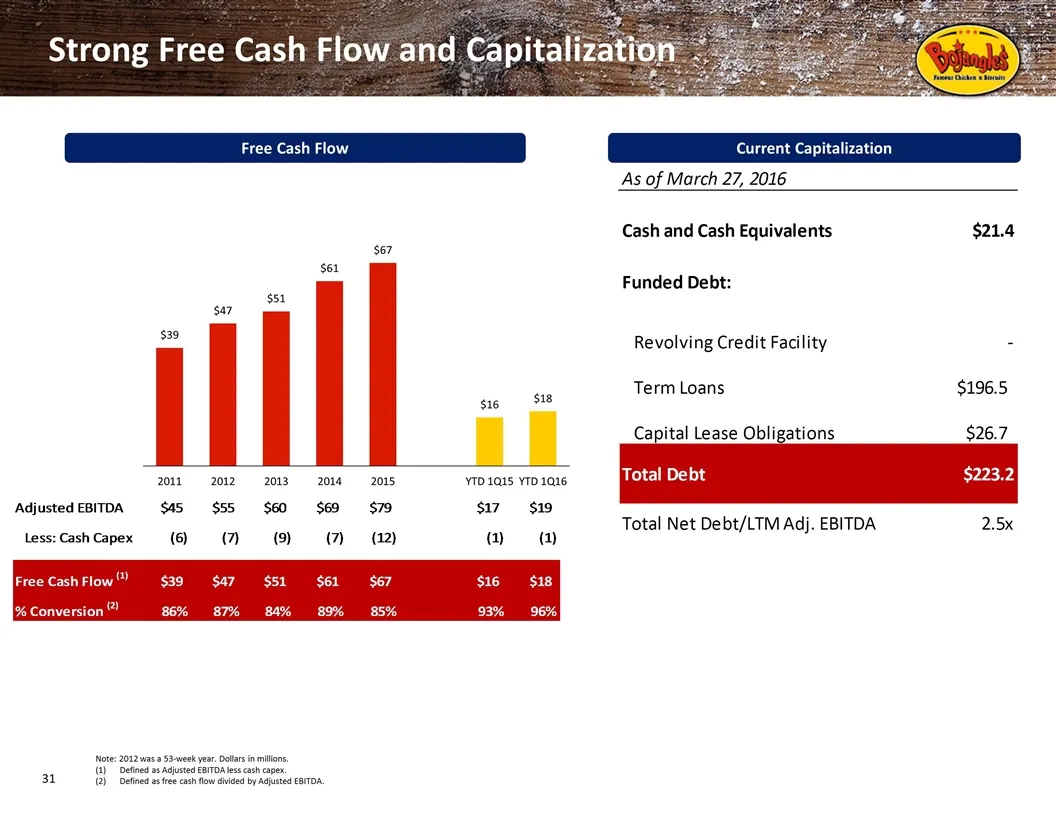
Strong Free Cash Flow and Capitalization Note: 2012 was a 53-week year. Dollars in millions. Defined as Adjusted EBITDA less cash capex. Defined as free cash flow divided by Adjusted EBITDA. Free Cash Flow Current Capitalization 2011 2012 2013 2014 YTD 3Q14 YTD 3Q15 Adjusted EBITDA $45 $55 $60 $69 $
Slide 32: Q1 2016 Highlights
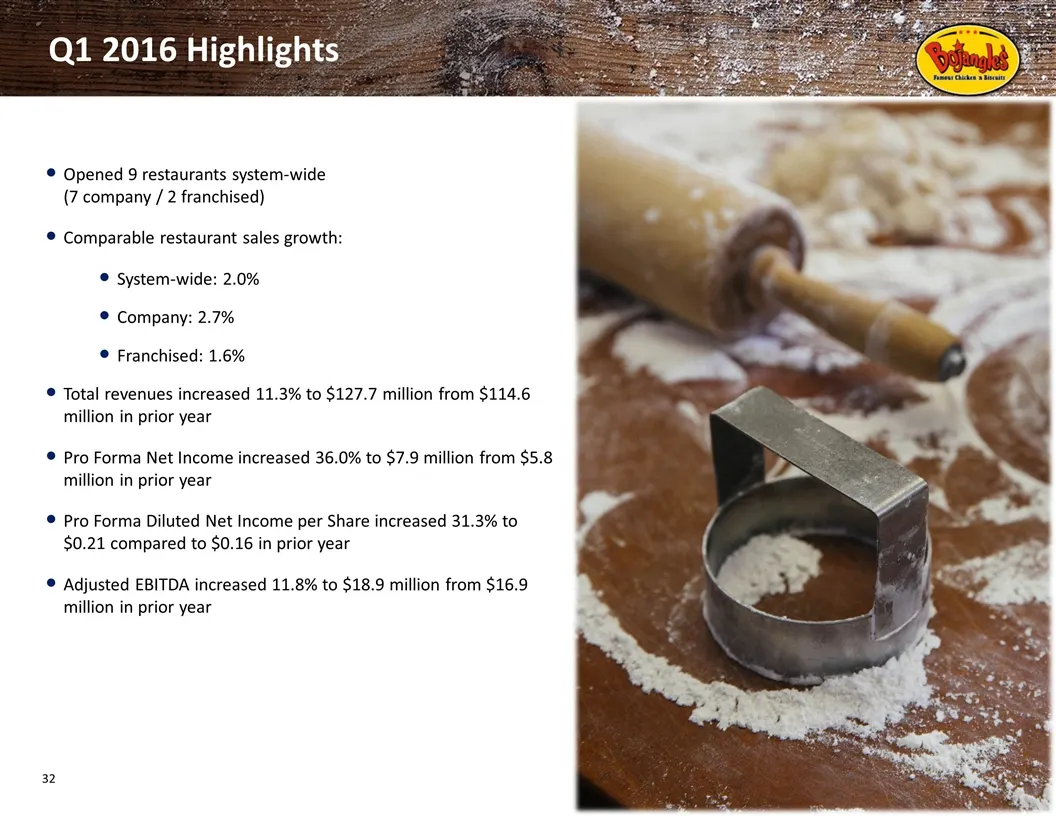
Q1 2016 Highlights Opened 9 restaurants system-wide (7 company / 2 franchised) Comparable restaurant sales growth: System-wide: 2.0% Company: 2.7% Franchised: 1.6% Total revenues increased 11.3% to $127.7 million from $114.6 million in prior year Pro Forma Net Income increased 36.0% to $7.9 million
Slide 33: Historical Performance Supports Long-Term Plan
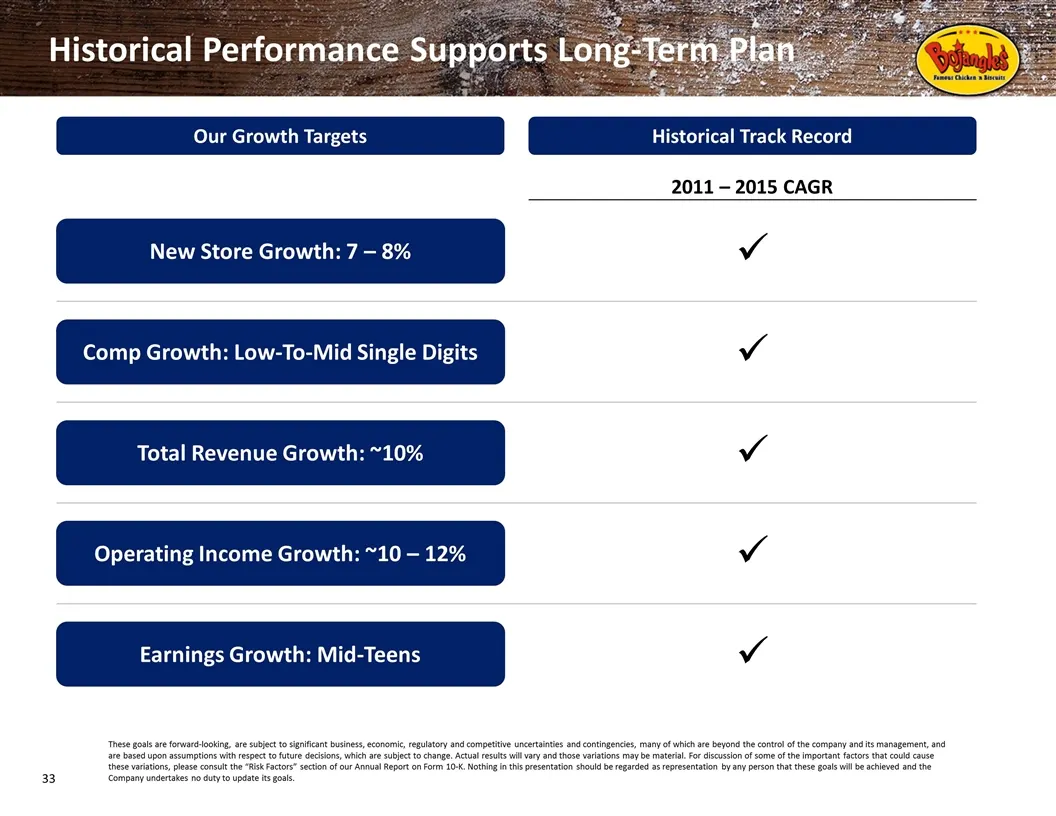
Historical Performance Supports Long-Term Plan New Store Growth: 7 – 8% Comp Growth: Low-To-Mid Single Digits Total Revenue Growth: ~10% Operating Income Growth: ~10 – 12% Earnings Growth: Mid-Teens Our Growth Targets Historical Track Record 2011 – 2015 CAGR ü ü ü ü ü These goals are forward-looking
Slide 34: It's Bo Time!
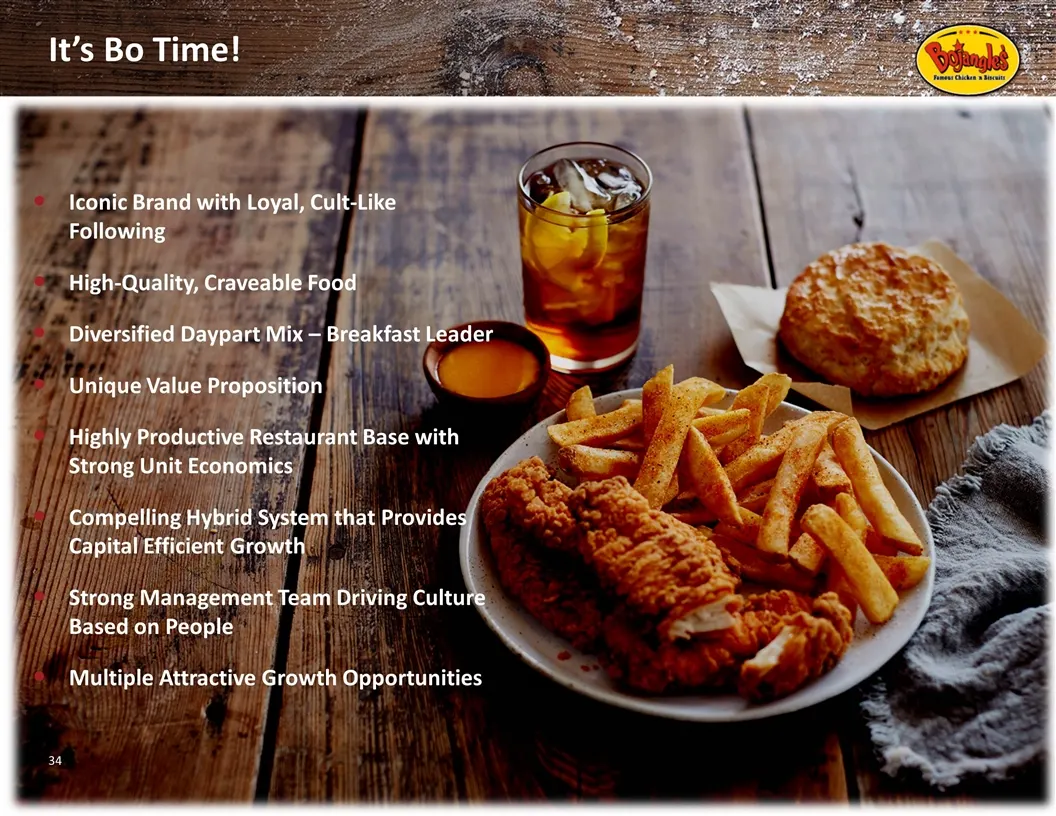
It’s Bo Time! Iconic Brand with Loyal, Cult-Like Following High-Quality, Craveable Food Diversified Daypart Mix – Breakfast Leader Unique Value Proposition Highly Productive Restaurant Base with Strong Unit Economics Compelling Hybrid System that Provides Capital Efficient Growth Strong Management T
Slide 35: Boo
0} Boo XE One 6 e Of = f OF0 © ‘| OW Ok a \
Slide 36: Restaurant Contribution Reconciliation
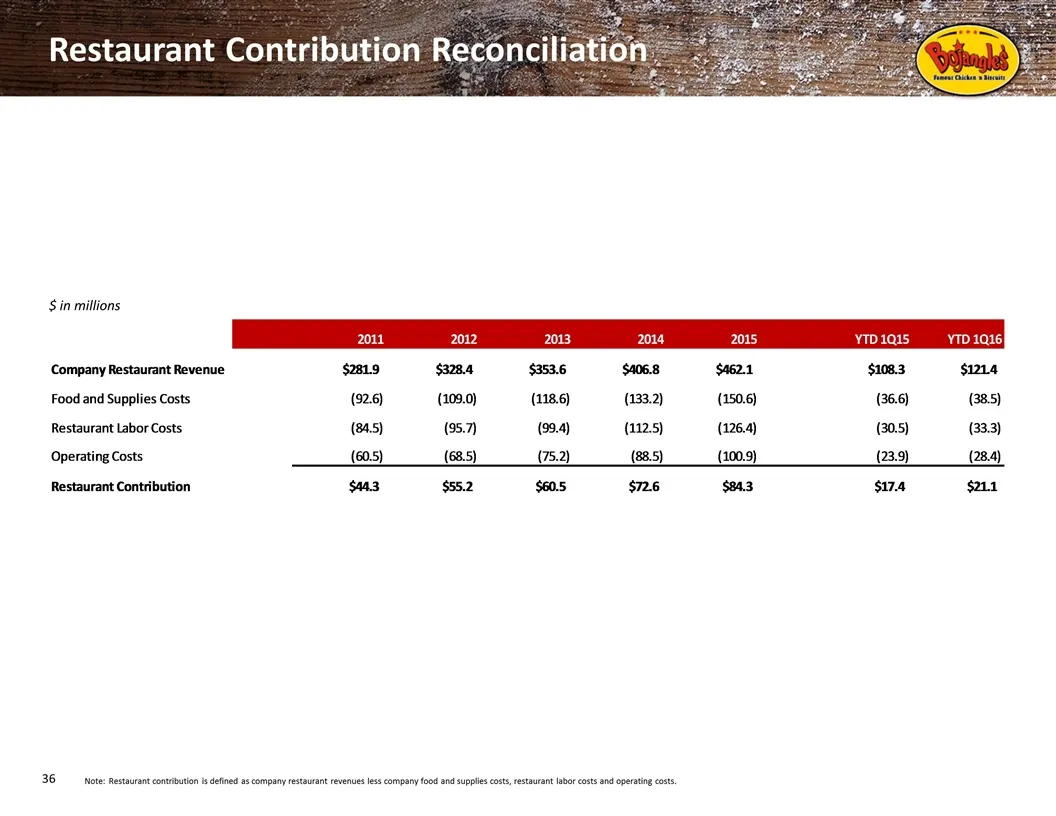
Restaurant Contribution Reconciliation $ in millions Note:Restaurant contribution is defined as company restaurant revenues less company food and supplies costs, restaurant labor costs and operating costs. RECONCILIATION From Press Release 2011 2012 2013 2014 2015 YTD 1Q15 YTD 1Q16 Company Restauran
Slide 37: Adjusted EBITDA Reconciliation
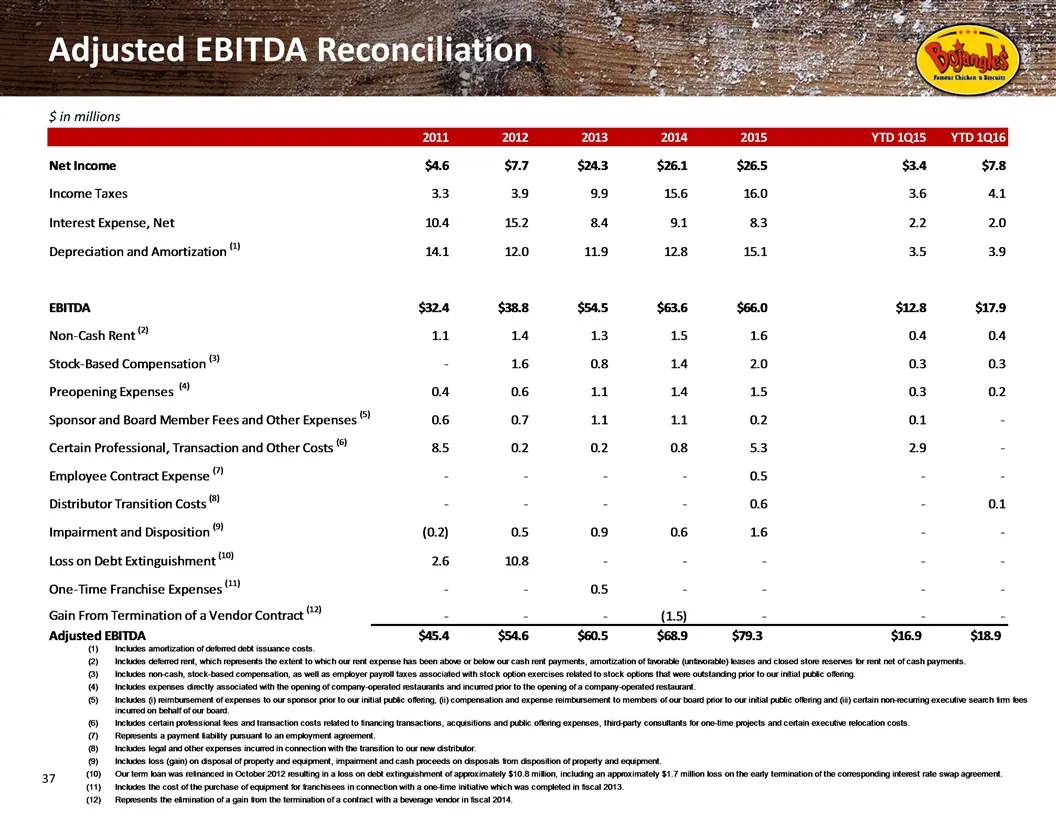
Adjusted EBITDA Reconciliation $ in millions 2011 2012 2013 2014 2015 YTD 1Q15 YTD 1Q16 Net Income $4.5999999999999996 $7.7 $24.3 $26.1 $26.5 $3.4 $7.8 Income Taxes 3.3 3.9 9.9 15.6 16 3.6 4.0999999999999996 Interest Expense, Net 10.4 15.2 8.4 9.1 8.3000000000000007 2.2000000000000002 2 Depreciation
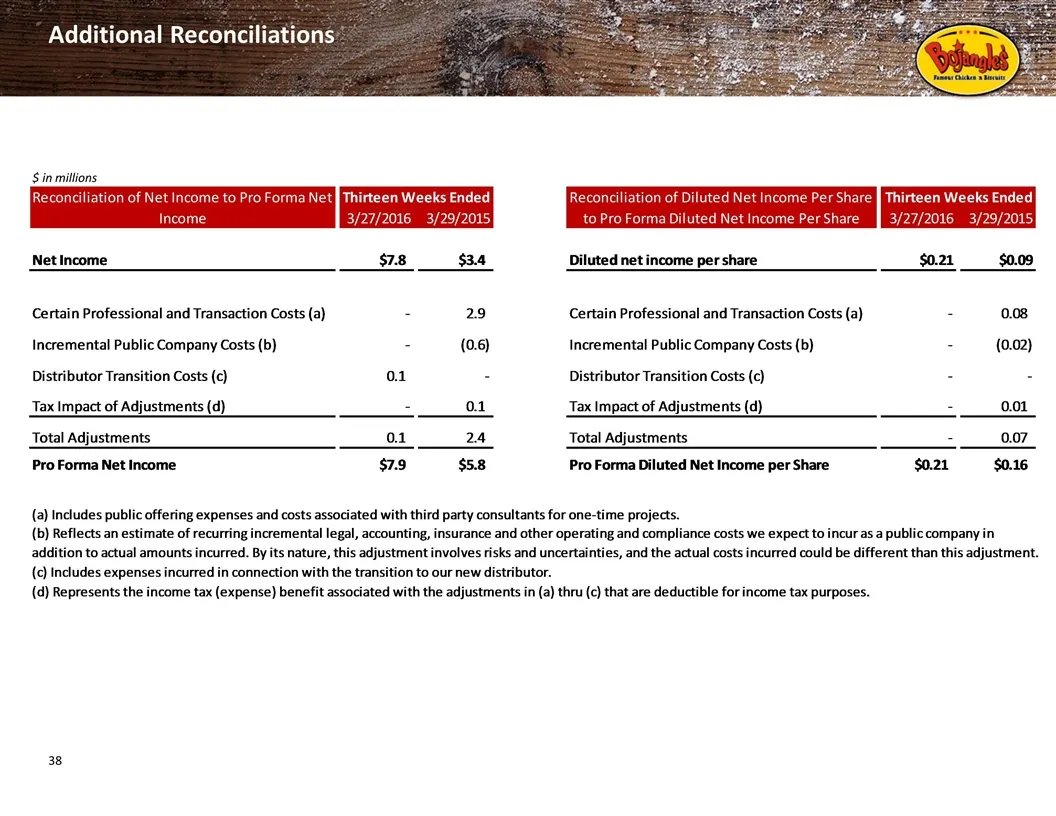
Slide 38: Additional Reconciliations
Additional Reconciliations $ in millions Reconciliation of Net Income to Pro Forma Net Income Thirteen Weeks Ended Reconciliation of Diluted Net Income Per Share to Pro Forma Diluted Net Income Per Share Thirteen Weeks Ended Reconciliation of Net Income to EBITDA and Adjusted EBITDA Thirteen Weeks E
Slide 39
Source: SEC EDGAR · 8-K filed Jun 15, 2016