Bridge Investment Group Holdings Inc
Bridge Investment — Q3 2021 Earnings Presentation
31 slides from Bridge Investment's earnings presentation, Nov 12, 2021
Slide 1: 3rd Quarter Earnings Supplemental
rd 3 Quarter Earnings Supplemental NOVEMBER 12, 2021
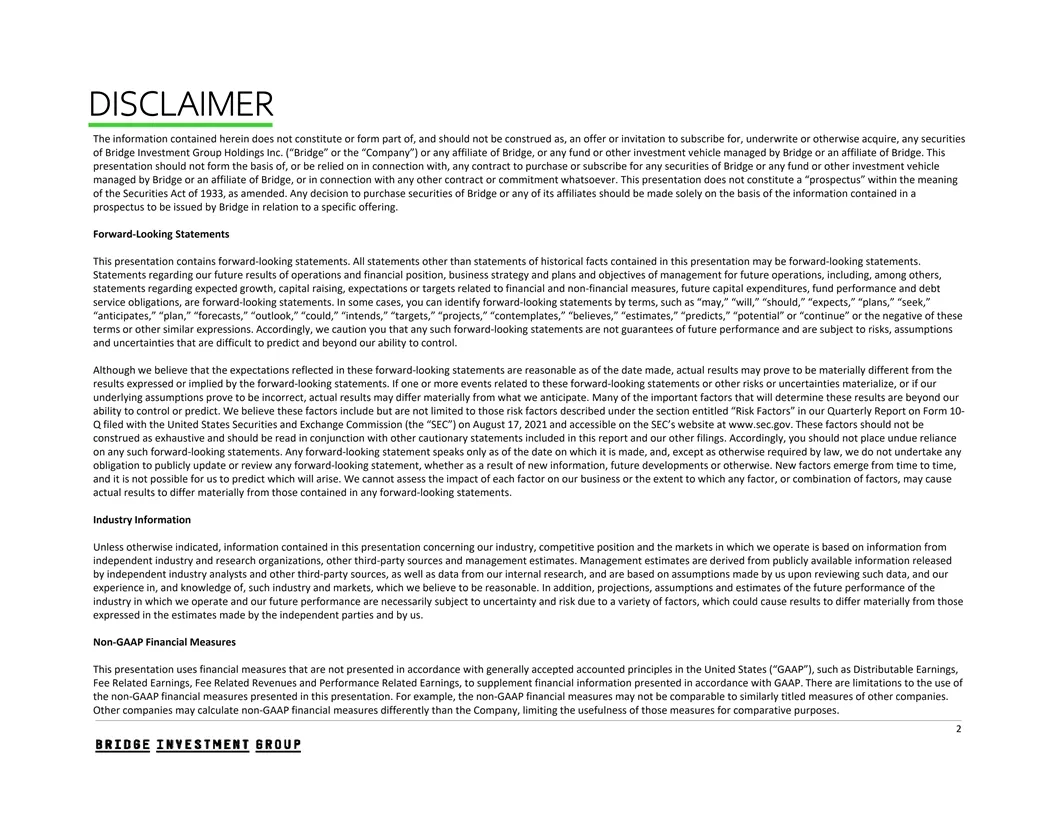
Slide 2: Disclaimer
DISCLAIMER The information contained herein does not constitute or form part of, and should not be construed as, an offer or invitation to subscribe for, underwrite or otherwise acquire, any securities of Bridge Investment Group Holdings Inc. (“Bridge” or the “Company”) or any affiliate of Bridge, o
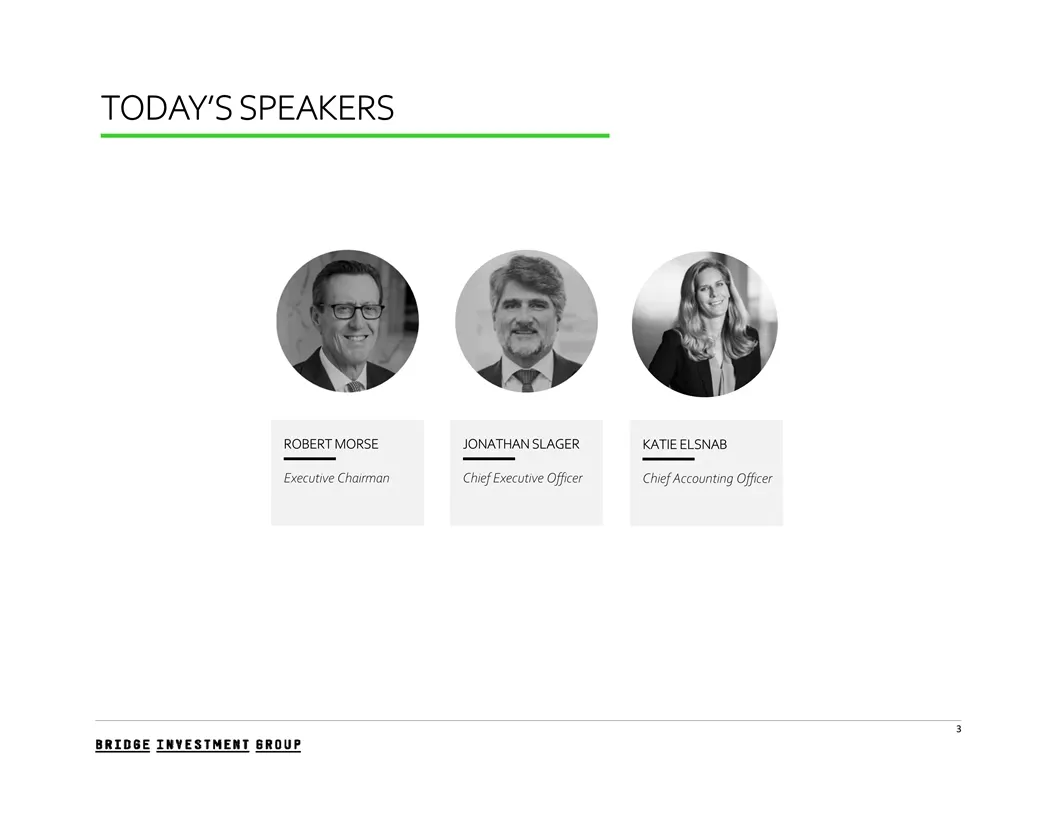
Slide 3: Today's Speakers
TODAY’S SPEAKERS ROBERT MORSE JONATHAN SLAGER KATIE ELSNAB Executive Chairman Chief Executive Officer Chief Accounting Officer 3
Slide 4: Chairman Commentary
CHAIRMAN COMMENTARY RIDGE NVESTMENT ROUP
Slide 5: Proven Record of Strong and Steady Growth
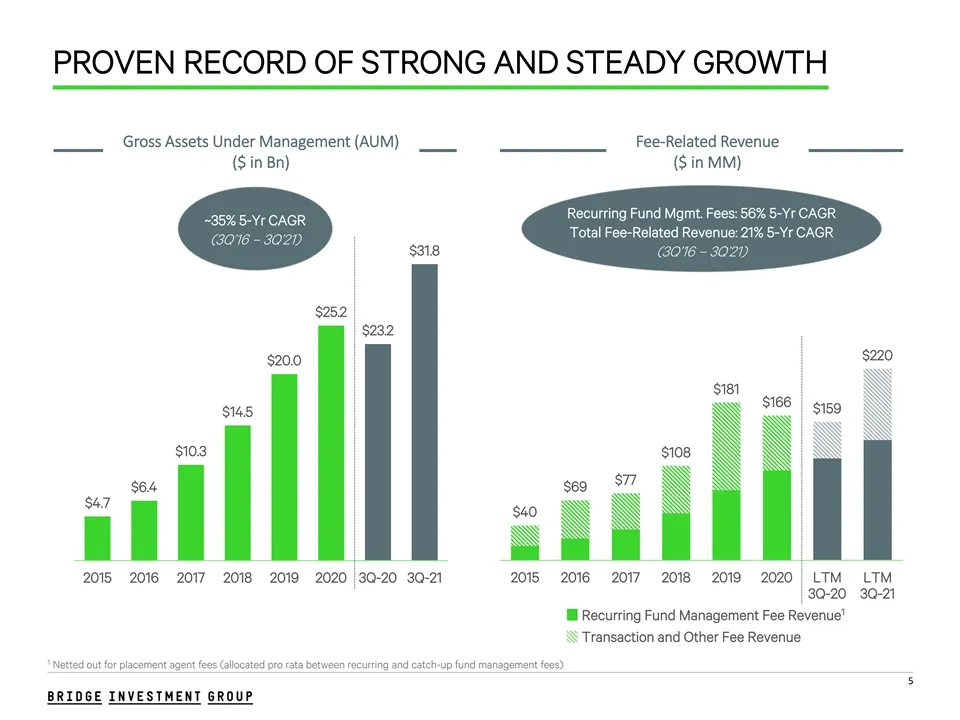
PROVEN RECORD OF STRONG AND STEADY GROWTH Gross Assets Under Management (AUM) Fee-Related Revenue ($ in Bn) ($ in MM) Recurring Fund Mgmt. Fees: 56% 5-Yr CAGR ~35% 5-Yr CAGR Total Fee-Related Revenue: 21% 5-Yr CAGR (3Q’16 – 3Q’21) $31.8 (3Q’16 – 3Q’21) $25.2 $23.2 $220 $20.0 $181 $166 $159 $14.5 $10
Slide 6: 3rd Quarter – Execution Highlights
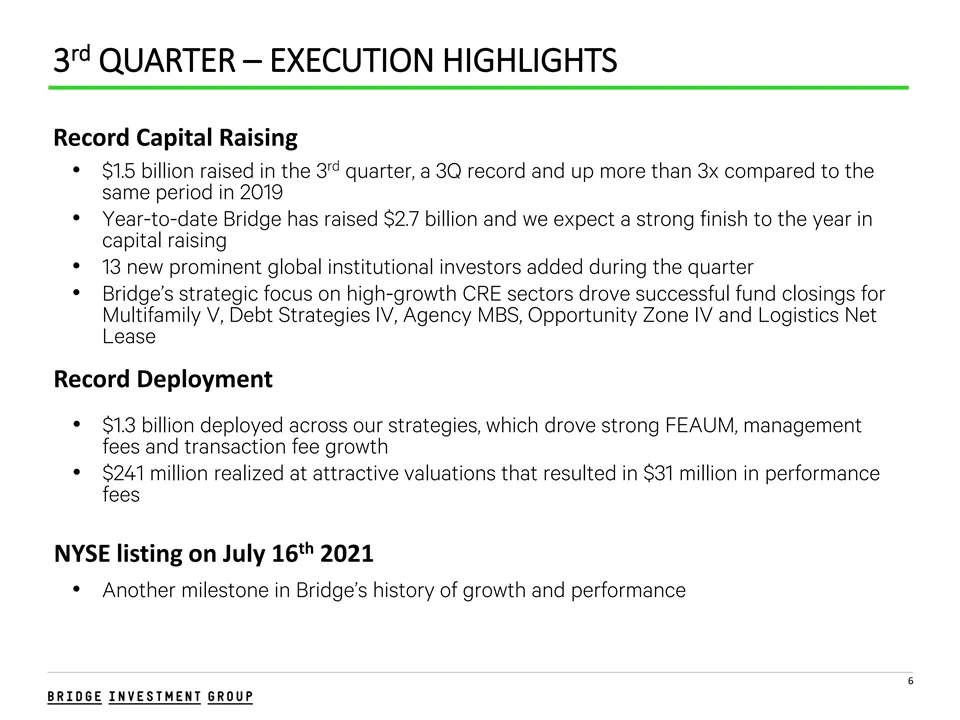
rd 3 QUARTER – EXECUTION HIGHLIGHTS Record Capital Raising rd • $1.5 billion raised in the 3 quarter, a 3Q record and up more than 3x compared to the same period in 2019 • Year-to-date Bridge has raised $2.7 billion and we expect a strong finish to the year in capital raising • 13 new prominent glob
Slide 7: Compelling Investment-Level Track Record
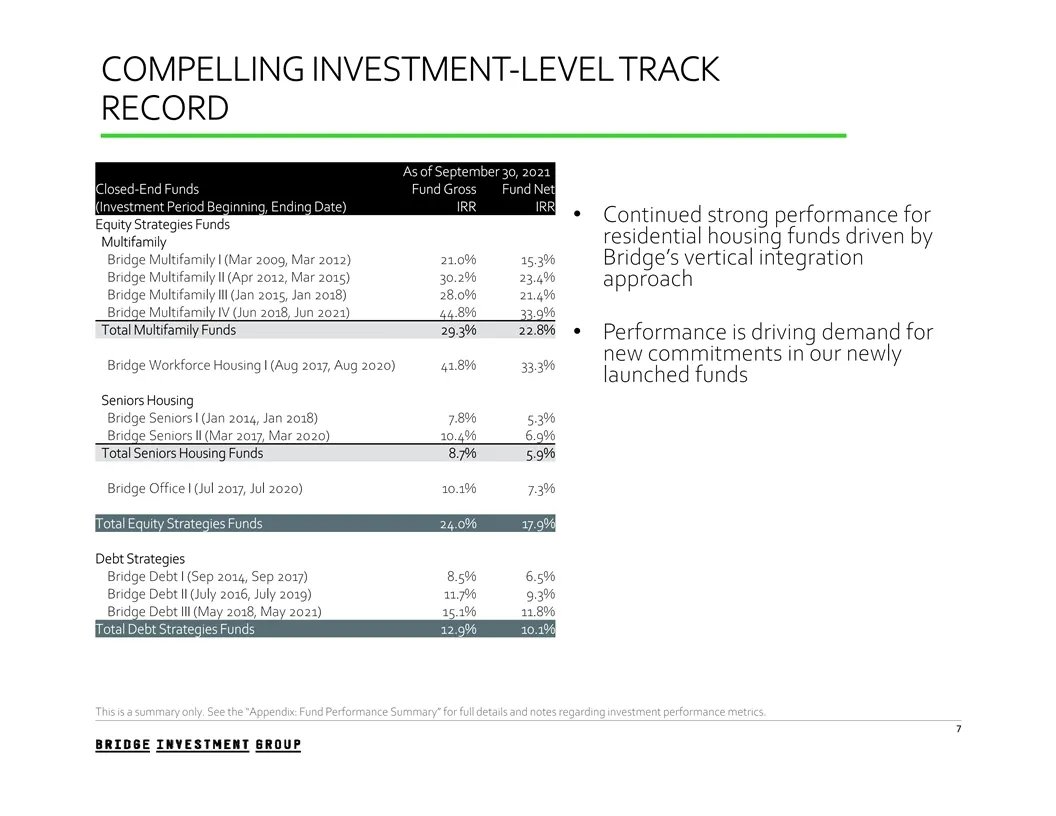
COMPELLING INVESTMENT-LEVEL TRACK RECORD As of September 30, 2021 Closed-End Funds Fund Gross Fund Net (Investment Period Beginning, Ending Date) IRR IRR • Continued strong performance for Equity Strategies Funds residential housing funds driven by Multifamily Bridge Multifamily I (Mar 2009, Mar 201
Slide 8: Bridge Investment Strategy Update
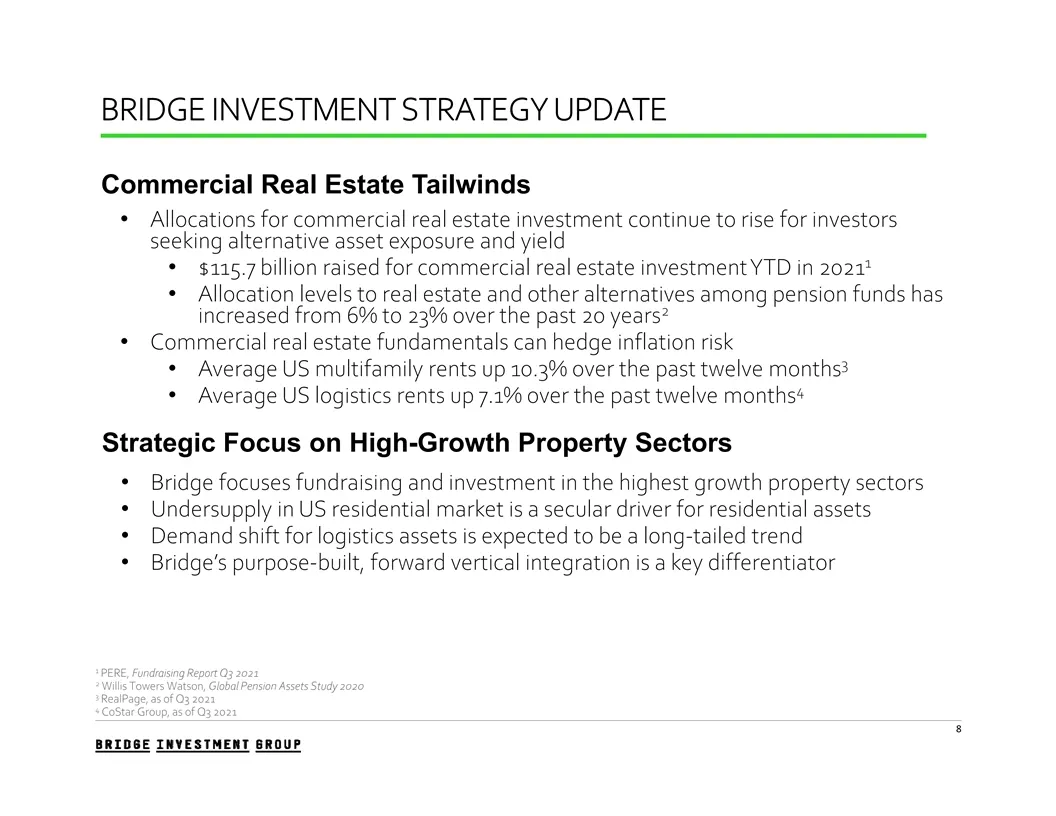
BRIDGE INVESTMENT STRATEGY UPDATE Commercial Real Estate Tailwinds • Allocations for commercial real estate investment continue to rise for investors seeking alternative asset exposure and yield 1 • $115.7 billion raised for commercial real estate investment YTD in 2021 • Allocation levels to real e
Slide 9: ESG and DE&I Initiatives
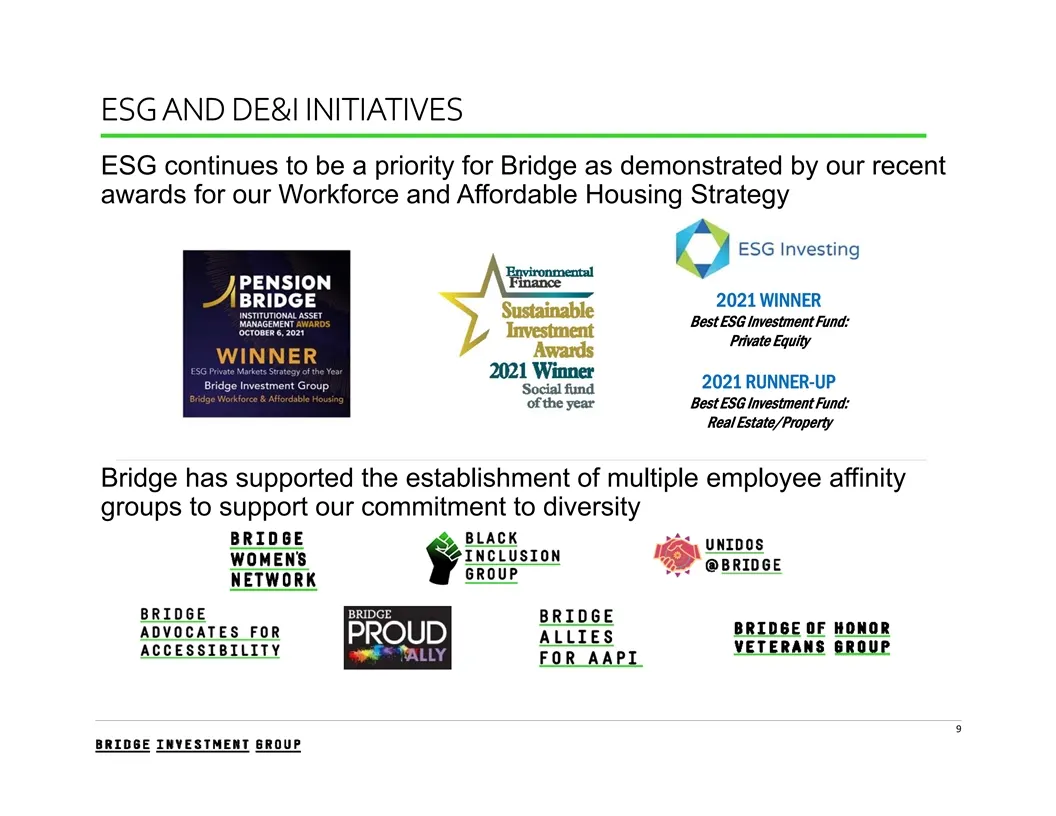
ESG AND DE&I INITIATIVES ESG continues to be a priority for Bridge as demonstrated by our recent awards for our Workforce and Affordable Housing Strategy 2021 WINNER Best ESG Investment Fund: Private Equity 2021 RUNNER-UP Best ESG Investment Fund: Real Estate/Property Bridge has supported the establ
Slide 10: 3rd Quarter Summary Highlights
RD 3 QUARTER SUMMARY HIGHLIGHTS
Slide 11: 3rd Quarter – Summary Highlights
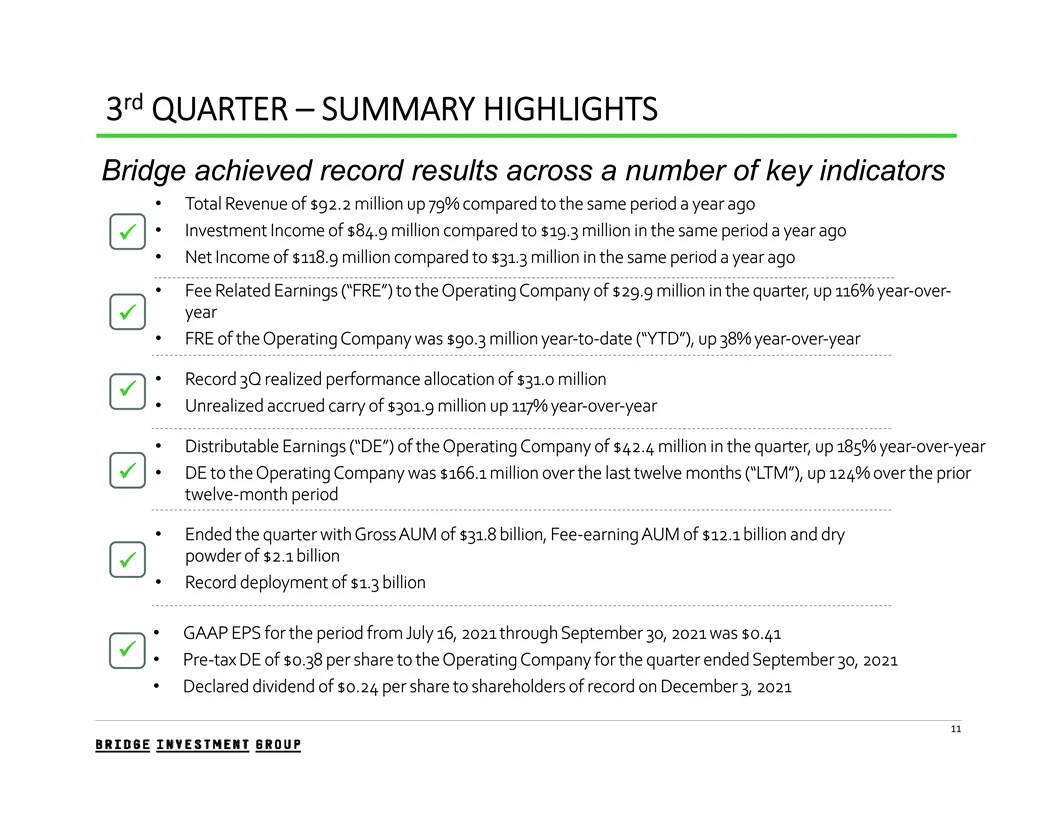
rd 3 QUARTER – SUMMARY HIGHLIGHTS Bridge achieved record results across a number of key indicators • Total Revenue of $92.2 million up 79% compared to the same period a year ago • Investment Income of $84.9 million compared to $19.3 million in the same period a year ago üü • Net Income of $118.9 mil
Slide 12: 3rd Quarter – Summary Results
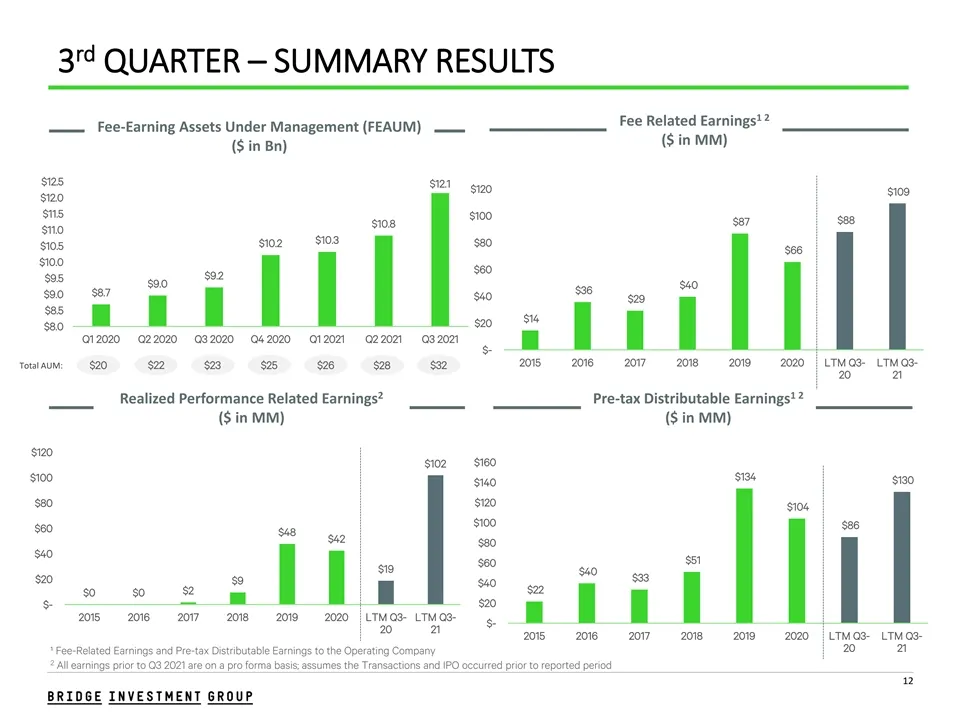
rd 3 QUARTER – SUMMARY RESULTS 1 2 Fee Related Earnings Fee-Earning Assets Under Management (FEAUM) ($ in MM) ($ in Bn) $12.5 $12.1 $120 $109 $12.0 $11.5 $100 $88 $87 $10.8 $11.0 $10.3 $10.2 $80 $10.5 $66 $10.0 $60 $9.2 $9.5 $9.0 $40 $36 $8.7 $9.0 $40 $29 $8.5 $14 $20 $8.0 Q1 2020 Q2 2020 Q3 2020 Q4
Slide 13: Long Duration Capital Drives Fee Visibility
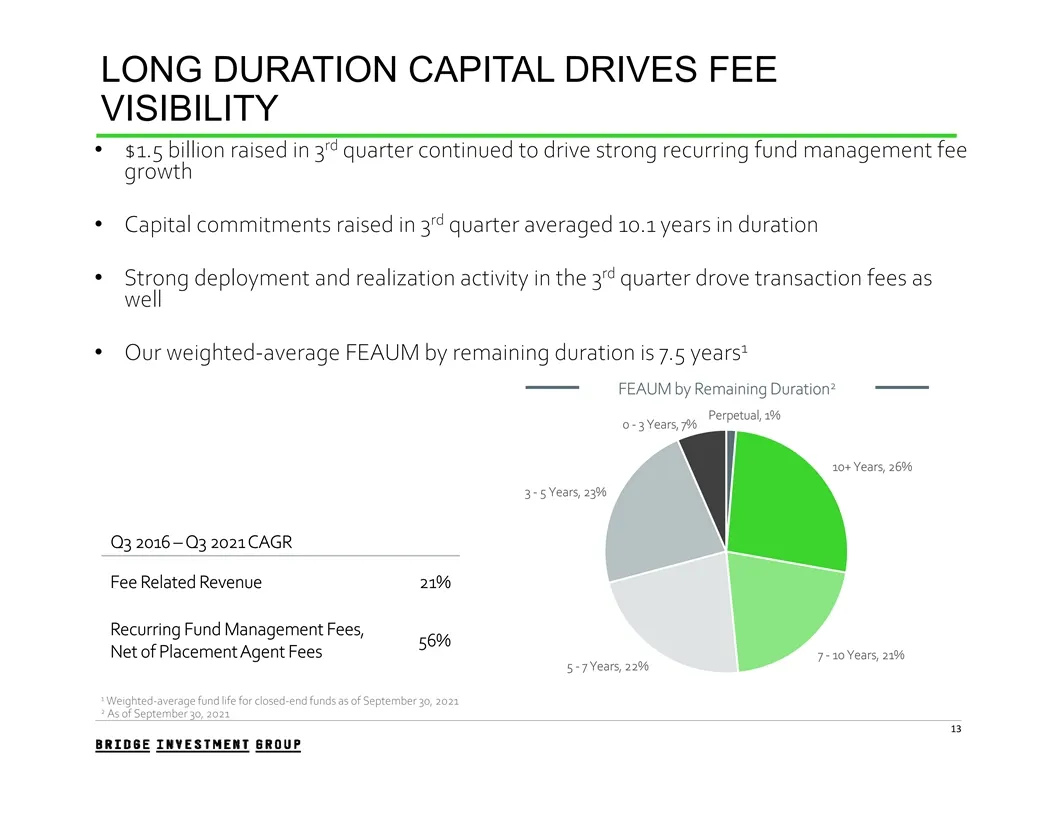
LONG DURATION CAPITAL DRIVES FEE VISIBILITY rd • $1.5 billion raised in 3 quarter continued to drive strong recurring fund management fee growth rd • Capital commitments raised in 3 quarter averaged 10.1 years in duration rd • Strong deployment and realization activity in the 3 quarter drove transac
Slide 14: Performance Fees
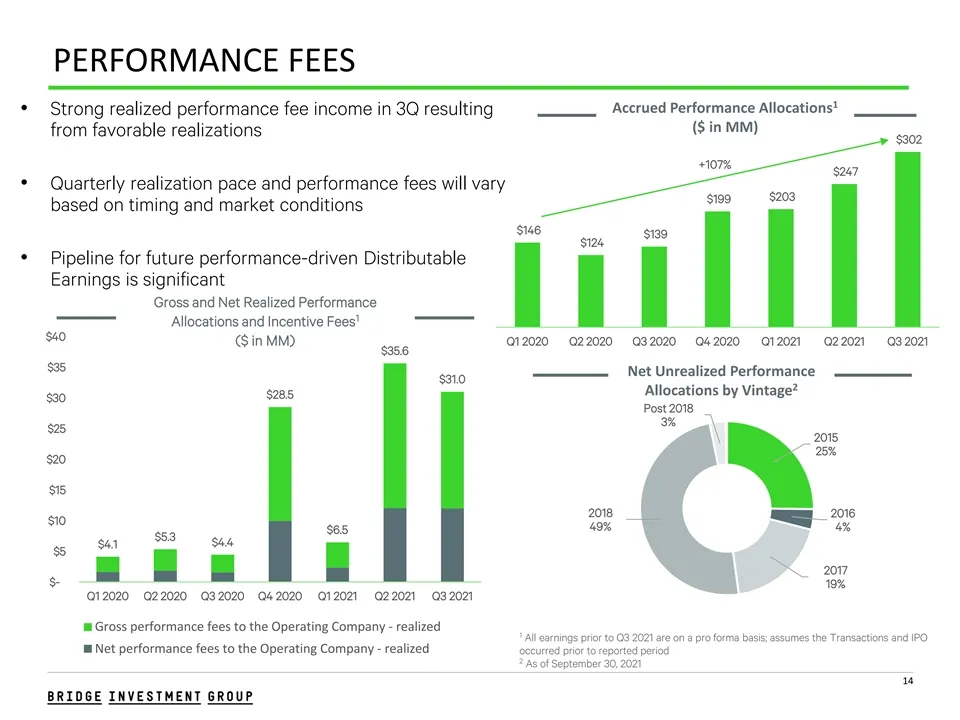
PERFORMANCE FEES 1 Accrued Performance Allocations • Strong realized performance fee income in 3Q resulting ($ in MM) from favorable realizations $302 +107% $247 • Quarterly realization pace and performance fees will vary $203 $199 based on timing and market conditions $146 $139 $124 • Pipeline for
Slide 15: Fundraising Is a Key Growth Driver
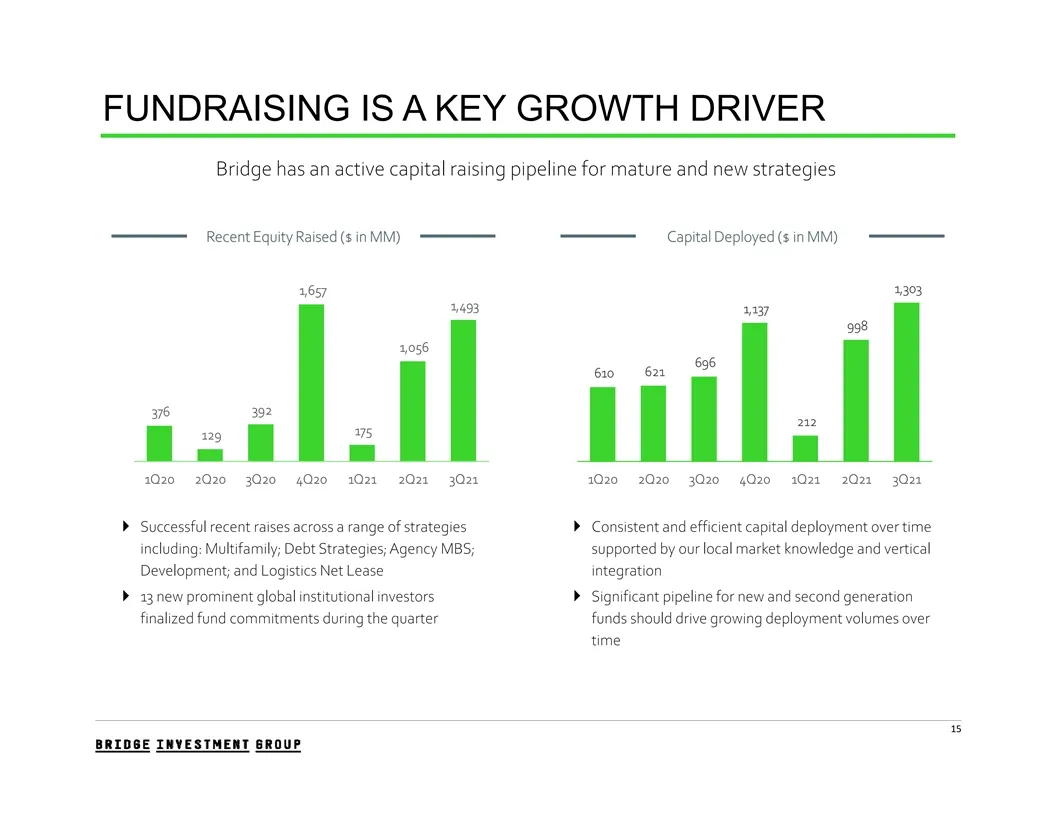
FUNDRAISING IS A KEY GROWTH DRIVER Bridge has an active capital raising pipeline for mature and new strategies Recent Equity Raised ($ in MM) Capital Deployed ($ in MM) 1,303 1,657 1,493 1,137 998 1,056 696 621 610 392 376 212 175 129 1Q20 2Q20 3Q20 4Q20 1Q21 2Q21 3Q21 1Q20 2Q20 3Q20 4Q20 1Q21 2Q21
Slide 16: 3rd Quarter Financial Review
RD 3 QUARTER FINANCIAL REVIEW
Slide 17: GAAP Income Statement
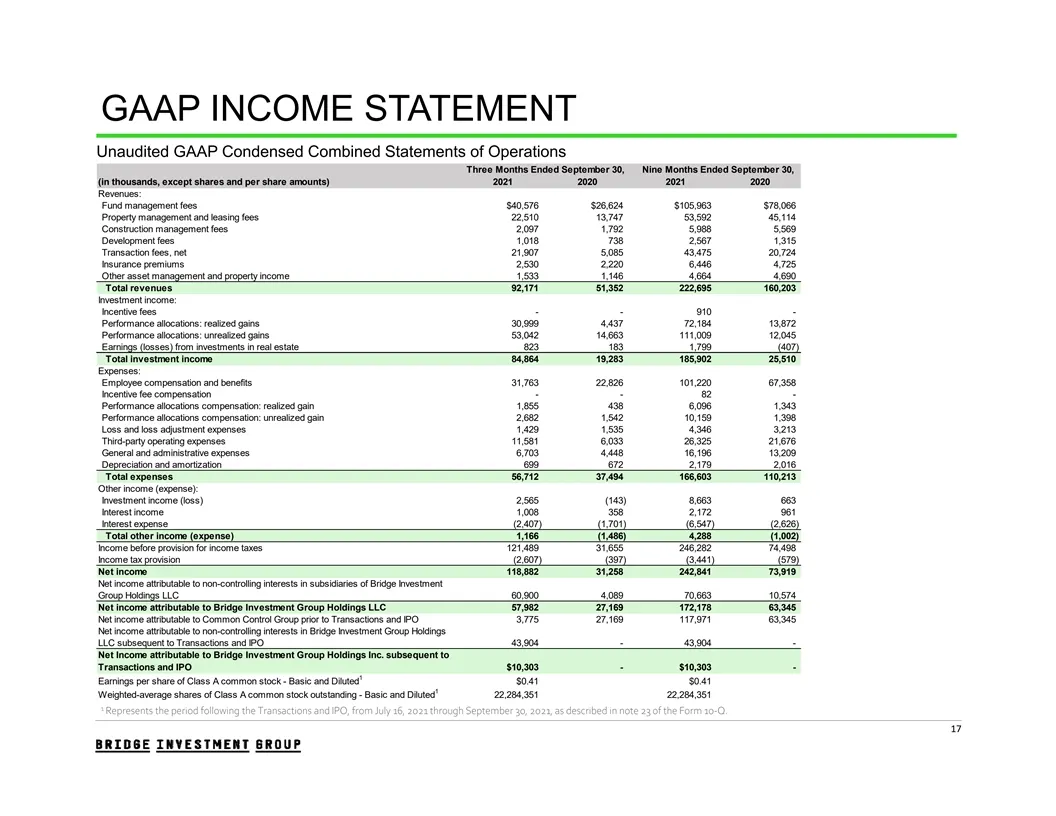
GAAP INCOME STATEMENT Unaudited GAAP Condensed Combined Statements of Operations Three Months Ended September 30, Nine Months Ended September 30, (in thousands, except shares and per share amounts) 2021 2020 2021 2020 Revenues: Fund management fees $40,576 $26,624 $105,963 $78,066 Property managemen
Slide 18: Non-GAAP Income Statement Summary
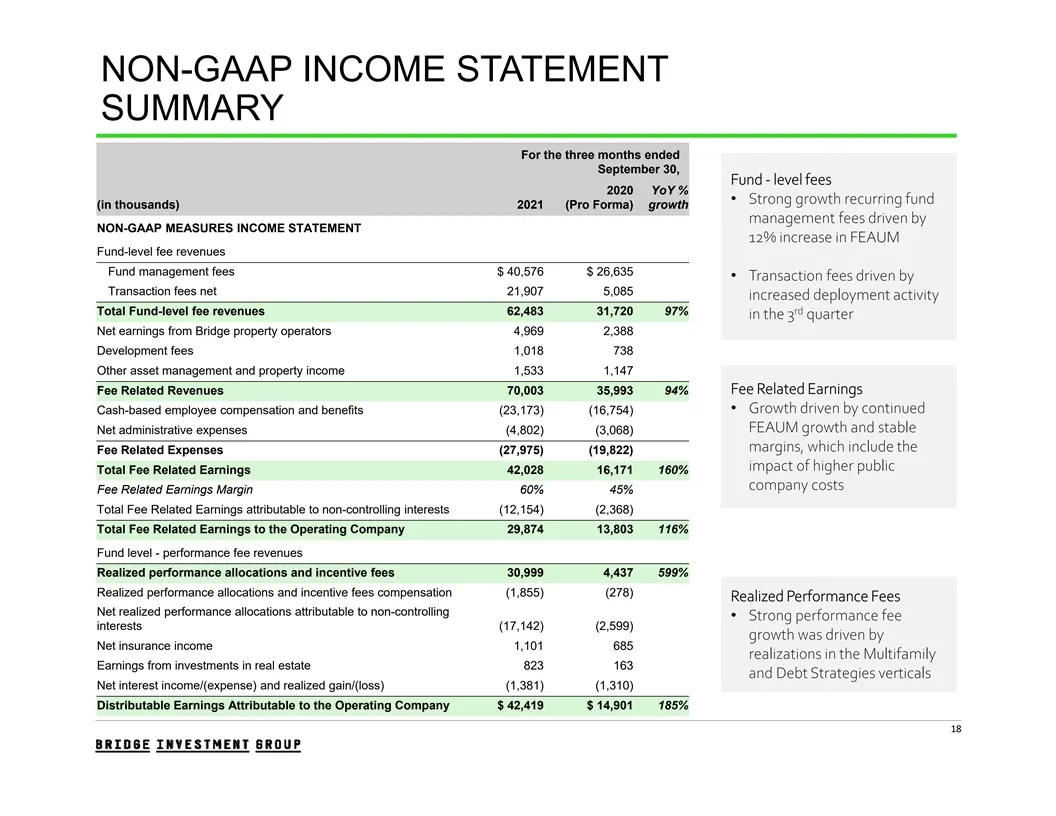
NON-GAAP INCOME STATEMENT SUMMARY For the three months ended September 30, Fund - level fees 2020 YoY % • Strong growth recurring fund (in thousands) 2021 (Pro Forma) growth management fees driven by NON-GAAP MEASURES INCOME STATEMENT 12% increase in FEAUM Fund-level fee revenues Fund management fee
Slide 19: Non-Controlling Interests
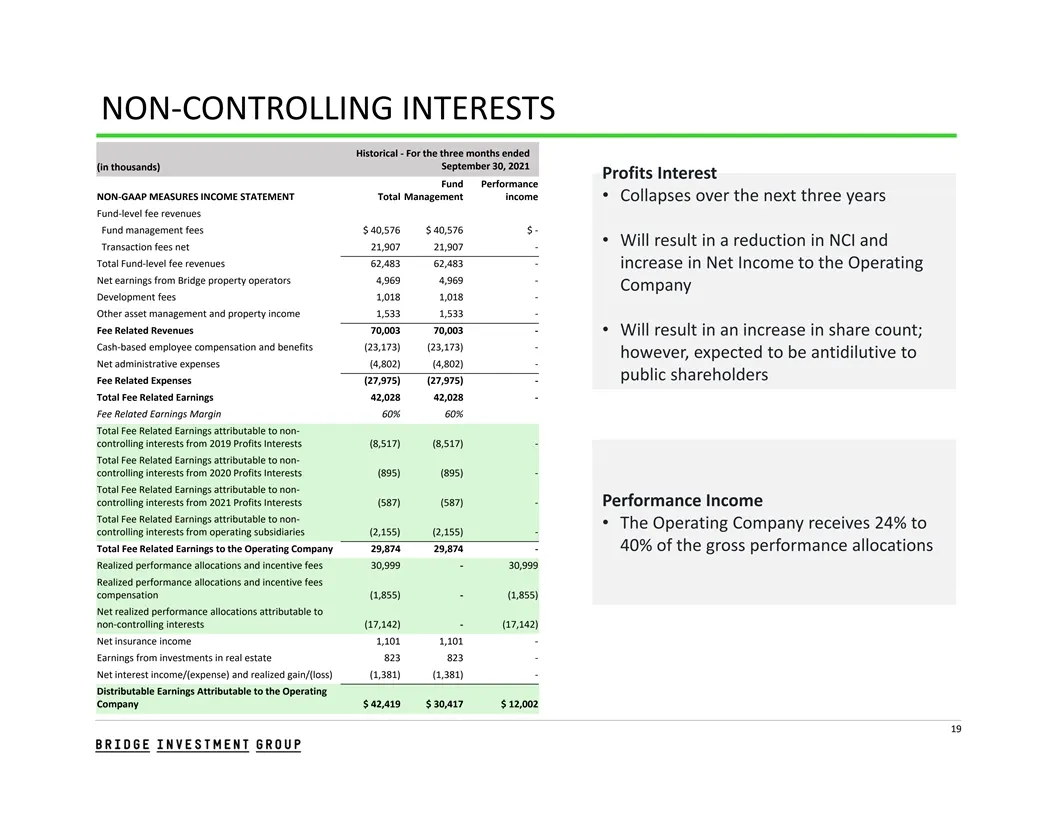
NON‐CONTROLLING INTERESTS Historical ‐ For the three months ended September 30, 2021 (in thousands) Profits Interest Fund Performance NON‐GAAP MEASURES INCOME STATEMENT Total Management income • Collapses over the next three years Fund‐level fee revenues Fund management fees $ 40,576 $ 40,576 $ ‐ •
Slide 20: Distributable Earnings and Capitalization
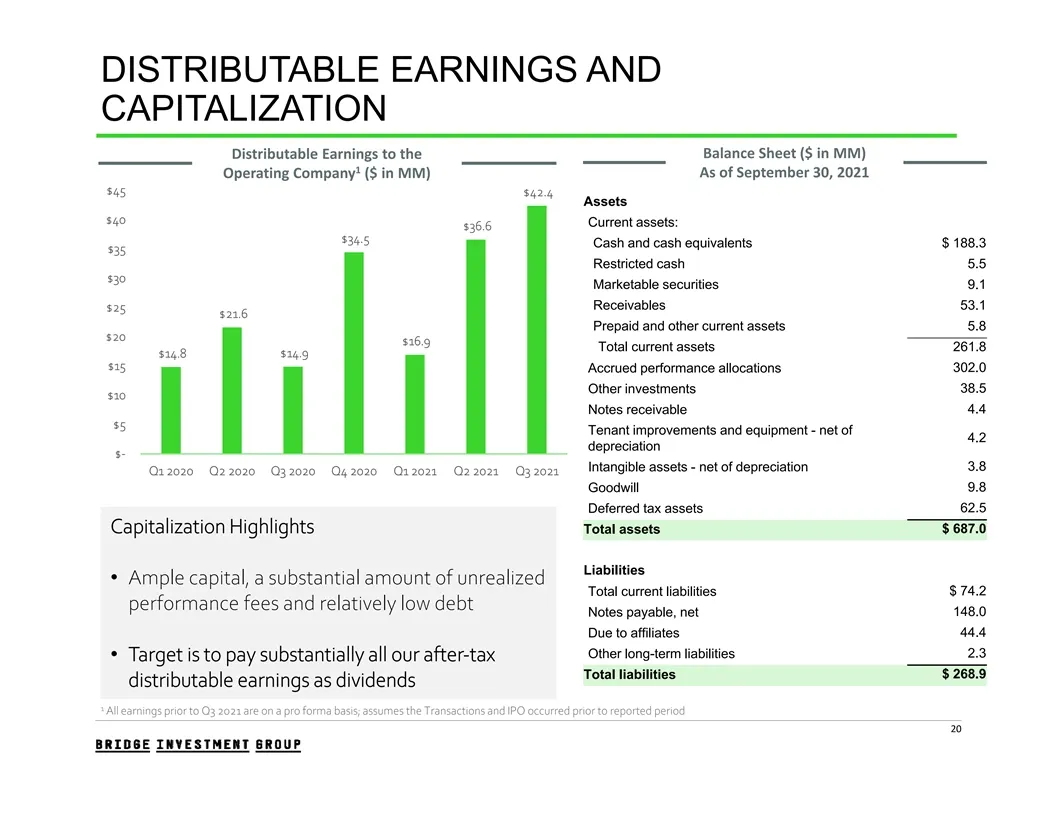
DISTRIBUTABLE EARNINGS AND CAPITALIZATION Distributable Earnings to the Balance Sheet ($ in MM) 1 As of September 30, 2021 Operating Company ($ in MM) $45 $42.4 Assets $40 Current assets: $36.6 $34.5 Cash and cash equivalents $ 188.3 $35 Restricted cash 5.5 $30 Marketable securities 9.1 Receivables
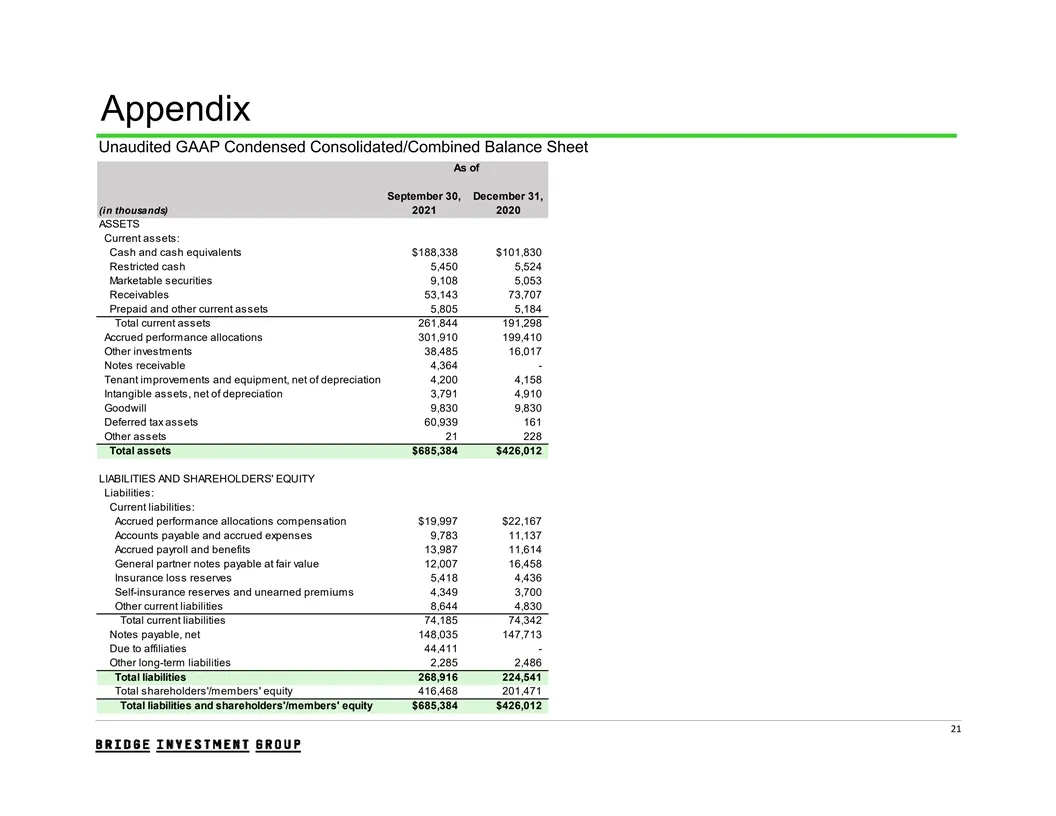
Slide 21: Unaudited GAAP Condensed Consolidated/Combined Balance Sheet
Appendix Unaudited GAAP Condensed Consolidated/Combined Balance Sheet As of September 30, December 31, (in thousands) 2021 2020 ASSETS Current assets: Cash and cash equivalents $188,338 $101,830 Restricted cash 5,450 5,524 Marketable securities 9,108 5,053 Receivables 53,143 73,707 Prepaid and other
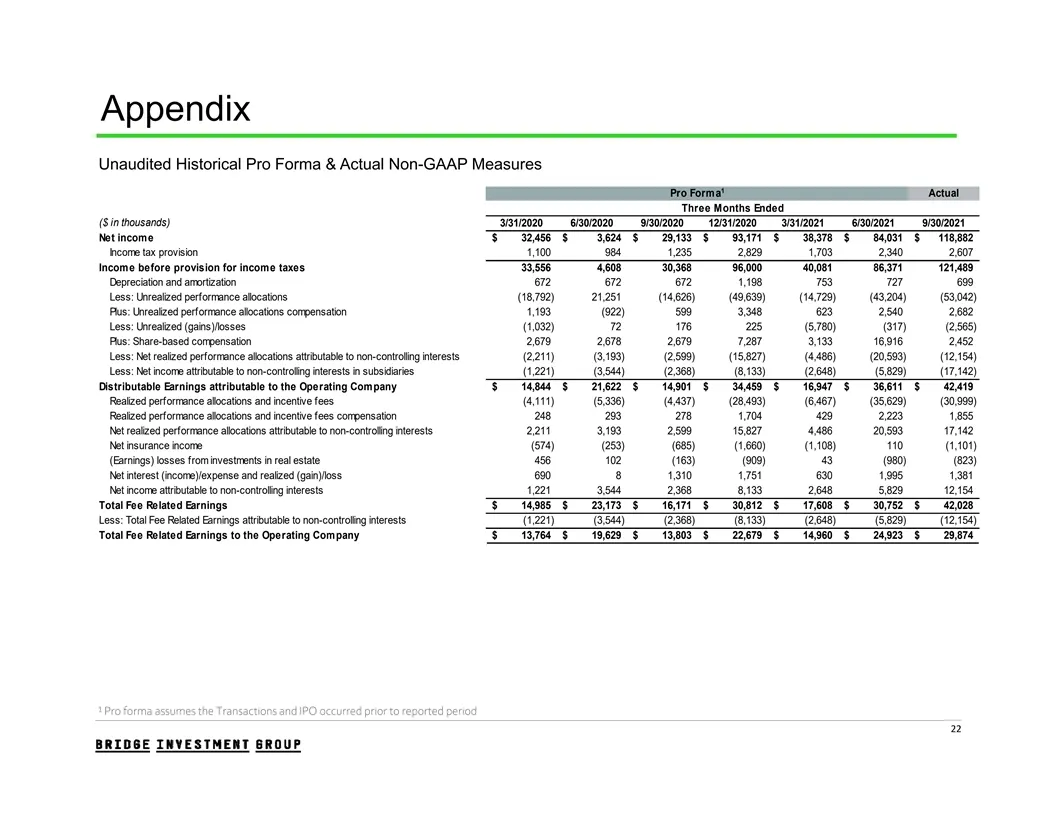
Slide 22: Unaudited Historical Pro Forma & Actual Non-GAAP Measures
Appendix Unaudited Historical Pro Forma & Actual Non-GAAP Measures 1 Pro Forma Actual Three Months Ended ($ in thousands) 3/31/2020 6/30/2020 9/30/2020 12/31/2020 3/31/2021 6/30/2021 9/30/2021 Net incom e $ 32,456 $ 3,624 $ 29,133 $ 93,171 $ 38,378 $ 84,031 $ 1 18,882 Income tax provision 1,100 984
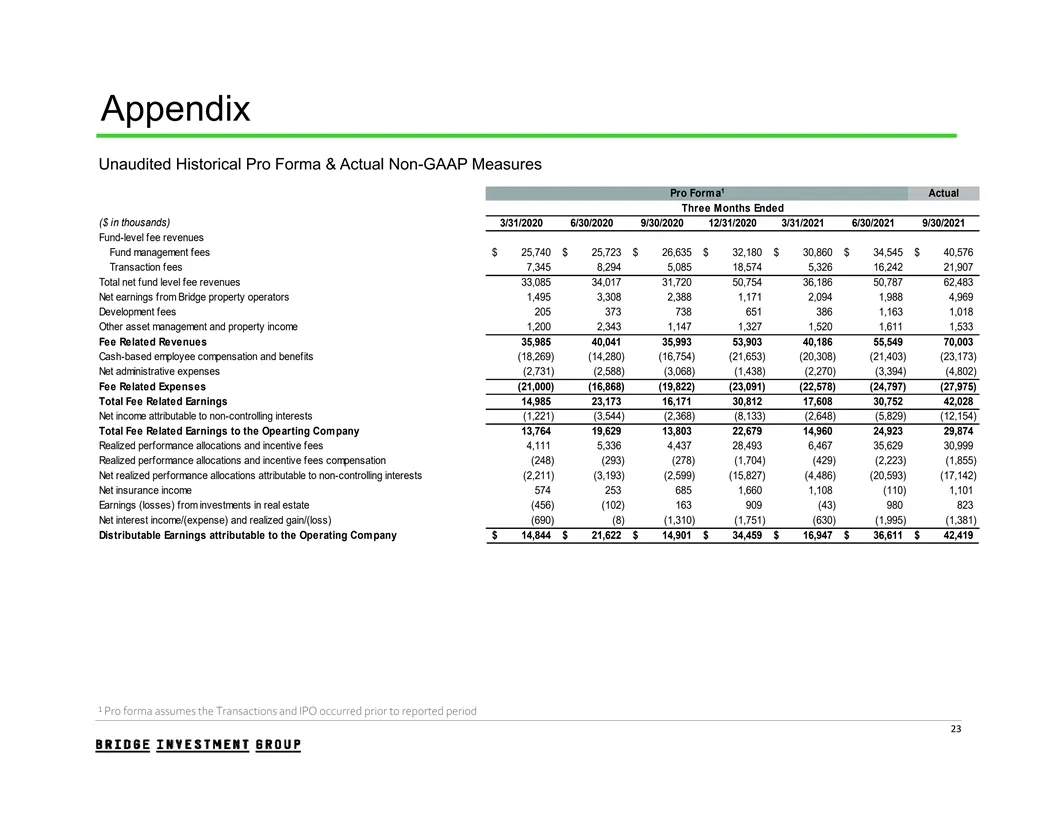
Slide 23: Unaudited Historical Pro Forma & Actual Non-GAAP Measures
Appendix Unaudited Historical Pro Forma & Actual Non-GAAP Measures 1 Pro Forma Actual Three Months Ended ($ in thousands) 3/31/2020 6/30/2020 9/30/2020 12/31/2020 3/31/2021 6/30/2021 9/30/2021 Fund-level fee revenues Fund management fees $ 25,740 $ 25,723 $ 26,635 $ 32,180 $ 30,860 $ 34,545 $ 40,576
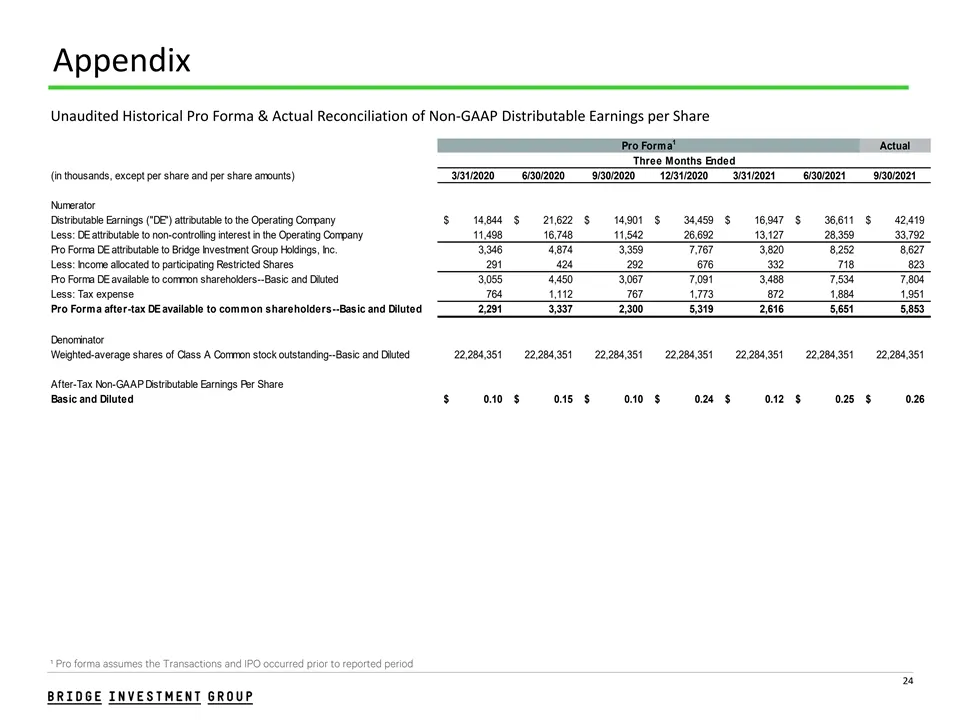
Slide 24: Reconciliation of Non-GAAP Distributable Earnings per Share
Appendix Unaudited Historical Pro Forma & Actual Reconciliation of Non-GAAP Distributable Earnings per Share 1 Pro Forma Actual Three Months Ended (in thousands, except per share and per share amounts) 3/31/2020 6/30/2020 9/30/2020 12/31/2020 3/31/2021 6/30/2021 9/30/2021 Numerator Distributable Ear
Slide 25: Non-GAAP to GAAP Reconciliation
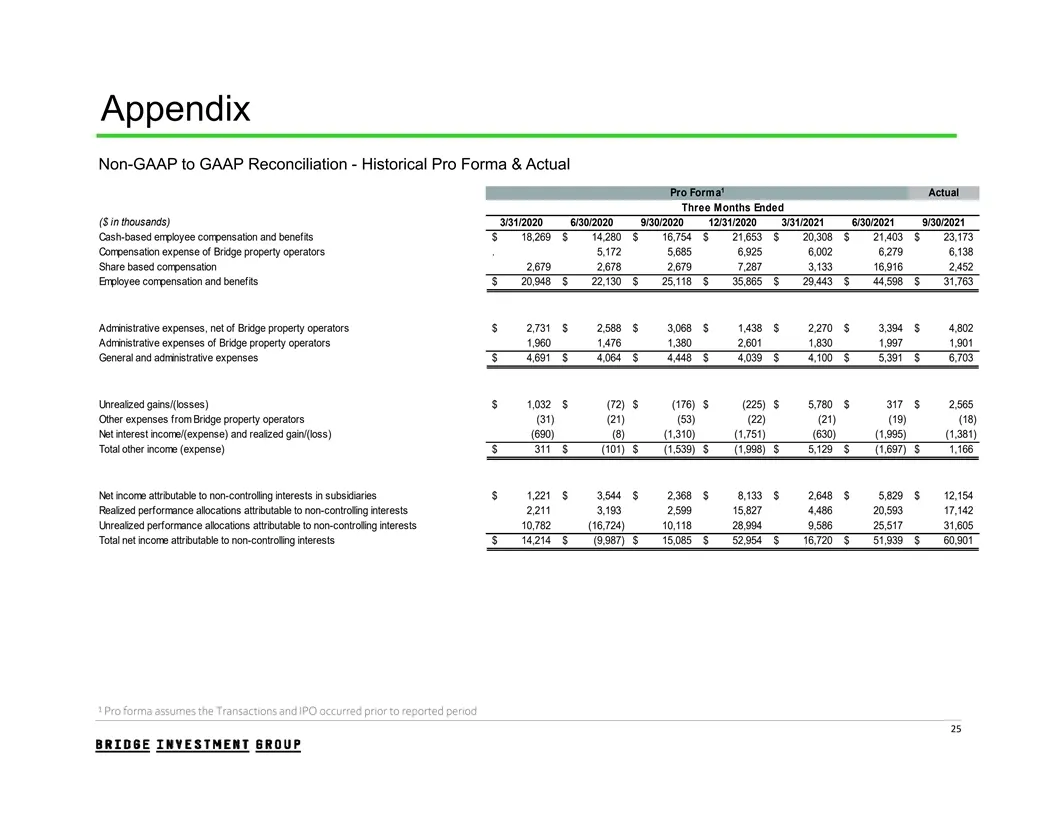
Appendix Non-GAAP to GAAP Reconciliation - Historical Pro Forma & Actual 1 Pro Forma Actual Three Months Ended ($ in thousands) 3/31/2020 6/30/2020 9/30/2020 12/31/2020 3/31/2021 6/30/2021 9/30/2021 Cash-based employee compensation and benefits $ 18,269 $ 14,280 $ 16,754 $ 21,653 $ 20,308 $ 21,403 $
Slide 26: AUM and FEAUM Roll Forward
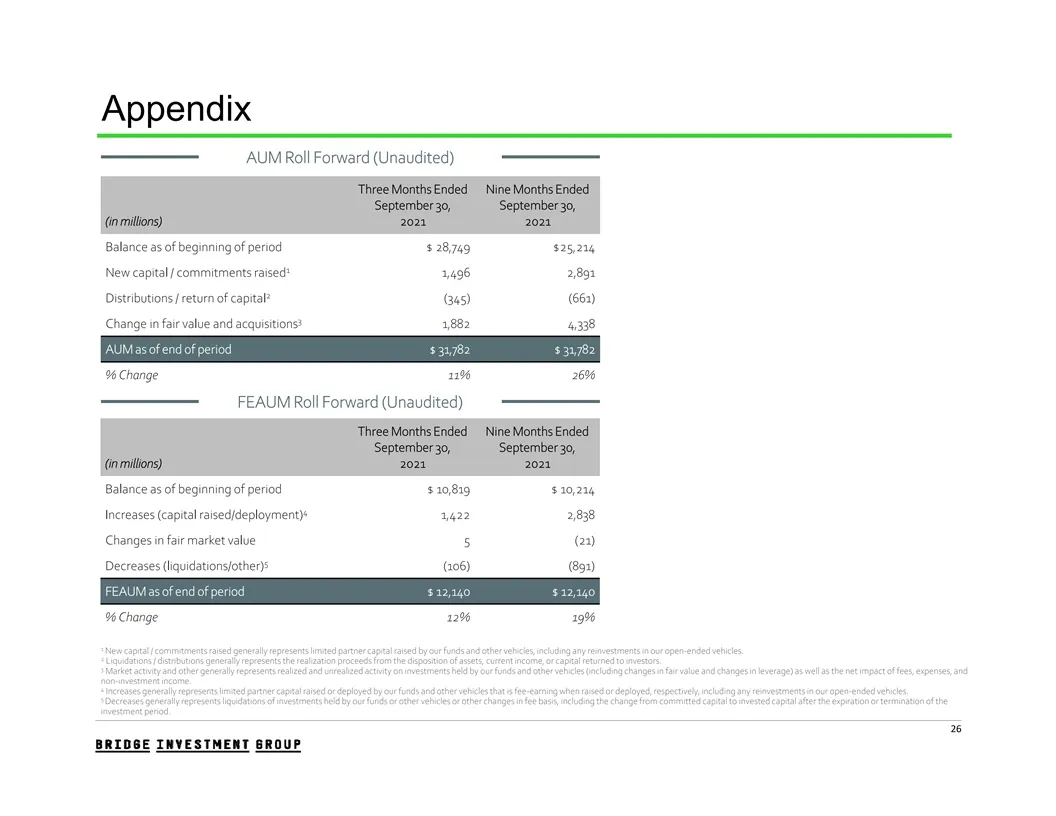
Appendix AUM Roll Forward (Unaudited) Three Months Ended Nine Months Ended September 30, September 30, (in millions) 2021 2021 Balance as of beginning of period $ 28,749 $25,214 1 New capital / commitments raised 1,496 2,891 2 Distributions / return of capital (345) (661) 3 Change in fair value and
Slide 27: Fund Performance Summary
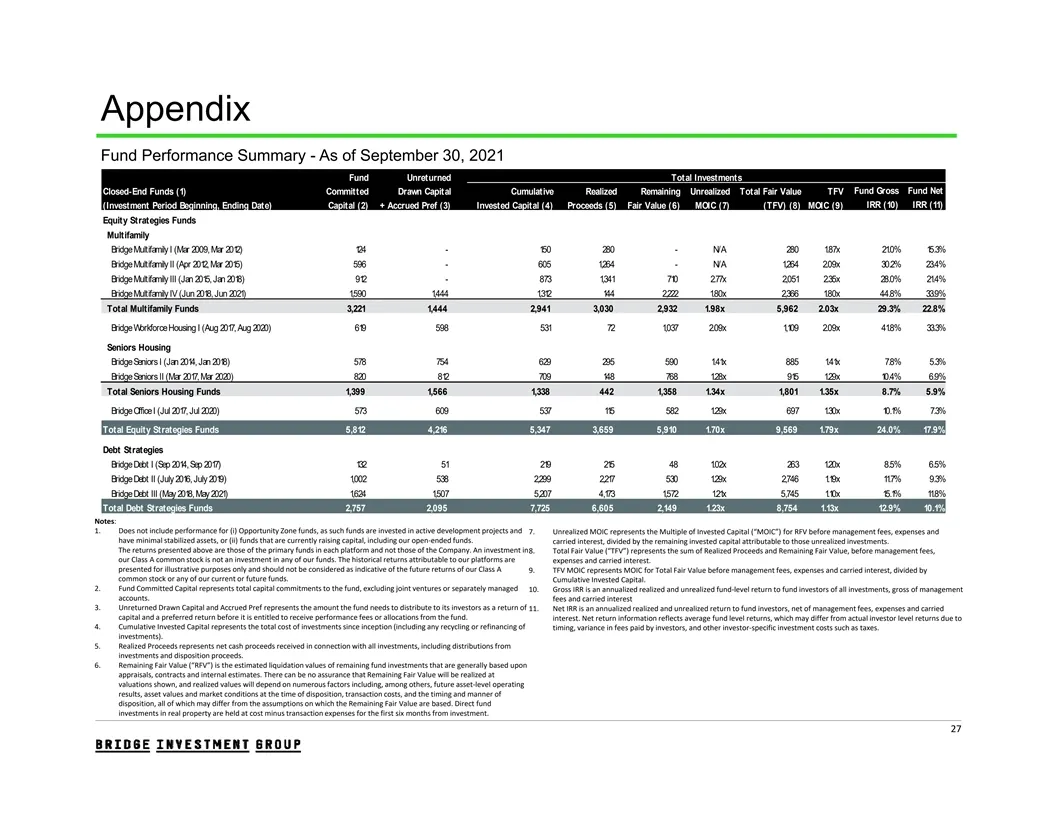
Appendix Fund Performance Summary - As of September 30, 2021 Fund Unreturned Total Investments Closed-End Funds (1) Committed Drawn Capital Cumulative Realized Remaining Unrealized Total Fair Value TFV Fund Gross Fund Net IRR (10) IRR (11) (Investment Period Beginning, Ending Date) Capital (2) + Acc
Slide 28: Reconciliation of GAAP Shares Outstanding to Total Shares Outstanding
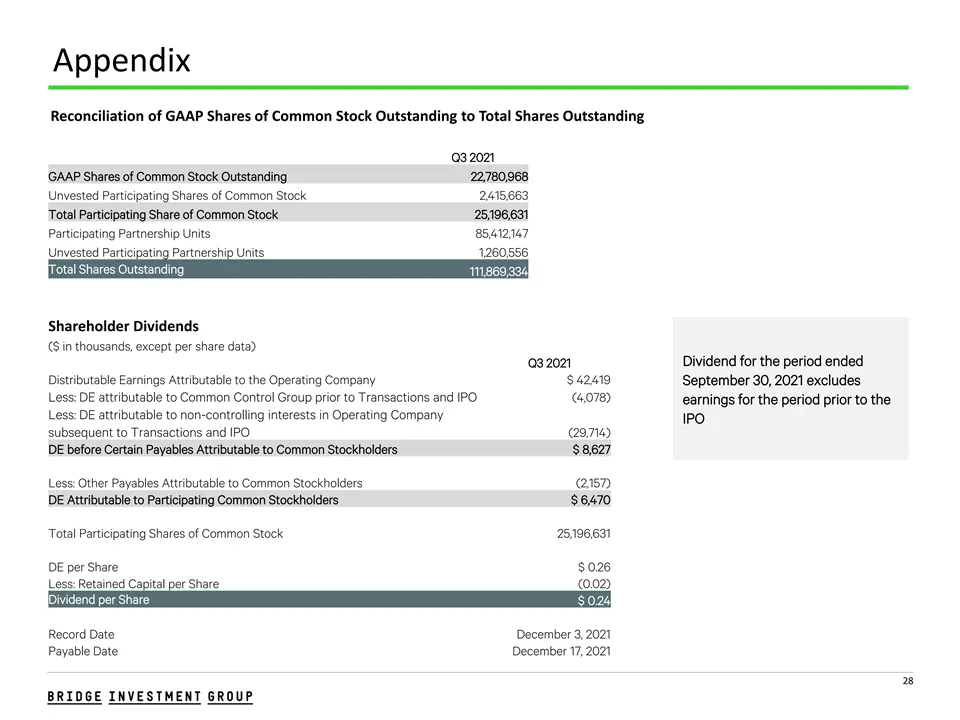
Appendix Reconciliation of GAAP Shares of Common Stock Outstanding to Total Shares Outstanding Q3 2021 GAAP Shares of Common Stock Outstanding 22,780,968 Unvested Participating Shares of Common Stock 2,415,663 Total Participating Share of Common Stock 25,196,631 Participating Partnership Units 85,41
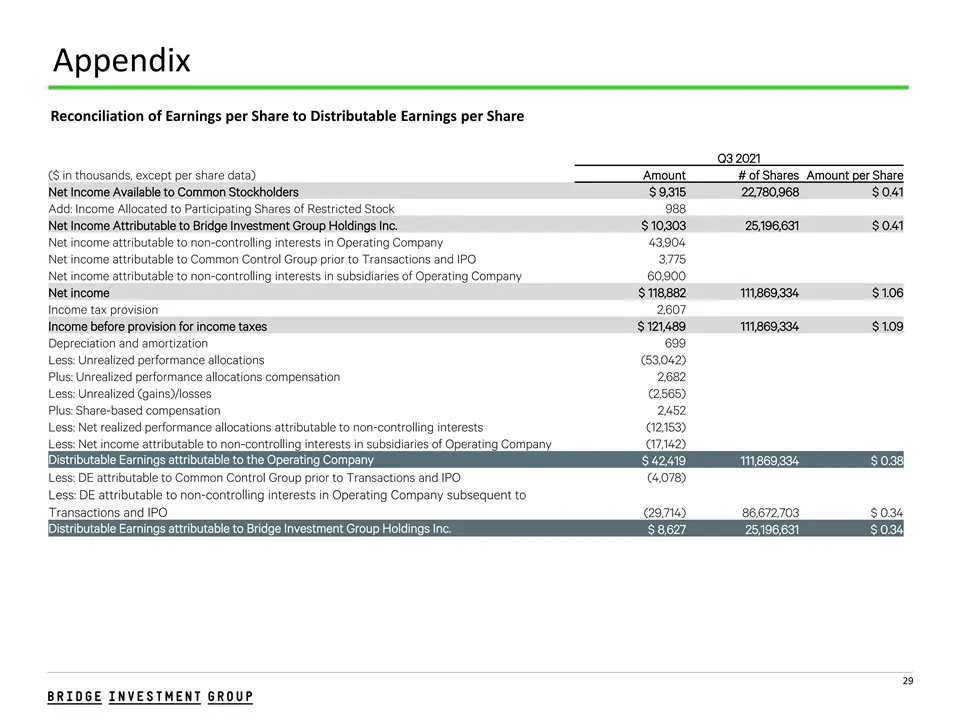
Slide 29: Reconciliation of Earnings per Share to Distributable Earnings per Share
Appendix Reconciliation of Earnings per Share to Distributable Earnings per Share Q3 2021 ($ in thousands, except per share data) Amount # of Shares Amount per Share Net Income Available to Common Stockholders $ 9,315 22,780,968 $ 0.41 Add: Income Allocated to Participating Shares of Restricted Stoc
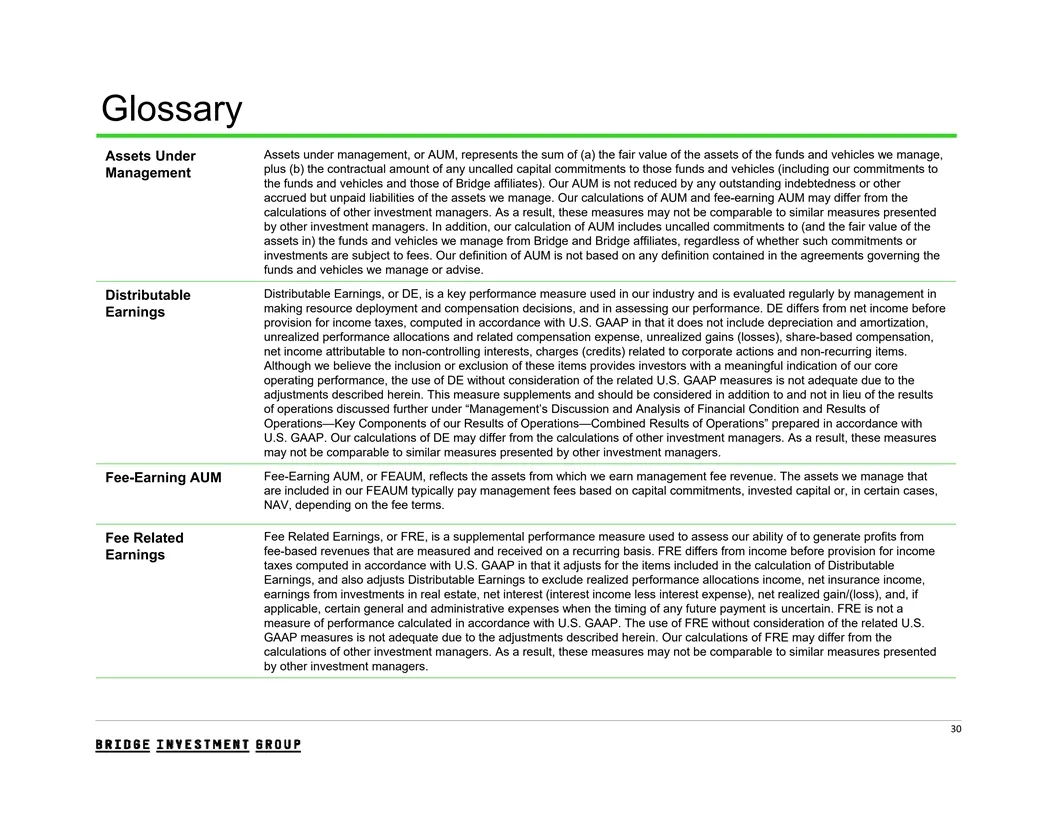
Slide 30: Glossary
Glossary Assets under management, or AUM, represents the sum of (a) the fair value of the assets of the funds and vehicles we manage, Assets Under plus (b) the contractual amount of any uncalled capital commitments to those funds and vehicles (including our commitments to Management the funds and ve
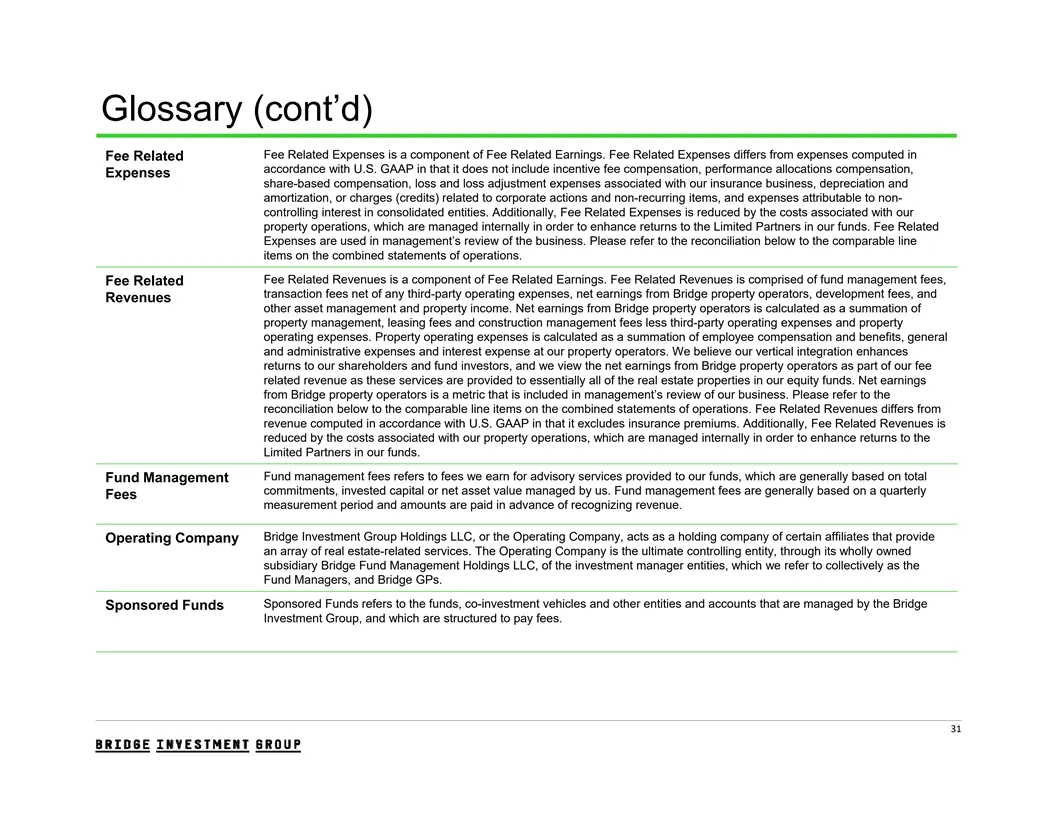
Slide 31: Glossary (cont'd)
Glossary (cont’d) Fee Related Expenses is a component of Fee Related Earnings. Fee Related Expenses differs from expenses computed in Fee Related accordance with U.S. GAAP in that it does not include incentive fee compensation, performance allocations compensation, Expenses share-based compensation,
Source: SEC EDGAR · 8-K filed Nov 12, 2021
More decks from Bridge Investment Group Holdings Inc
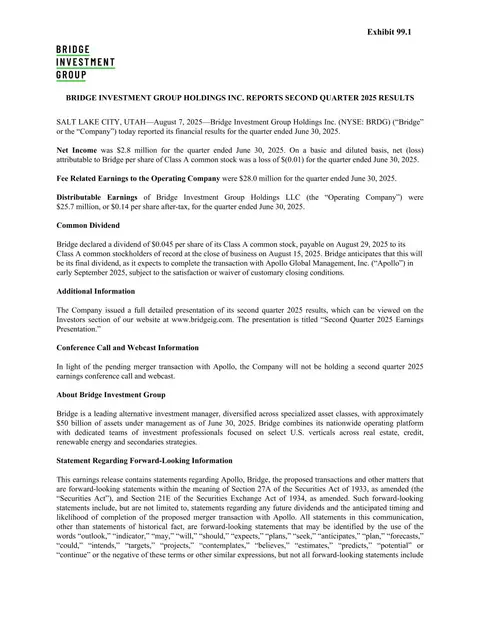 Q2 2025 Earnings Presentation40 slides · Aug 7, 2025
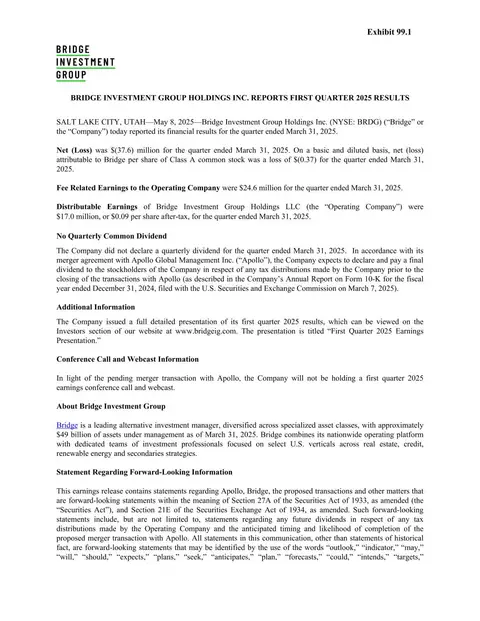 Q1 2025 Earnings Presentation41 slides · May 8, 2025
 Q4 2024 Earnings Presentation34 slides · Feb 24, 2025
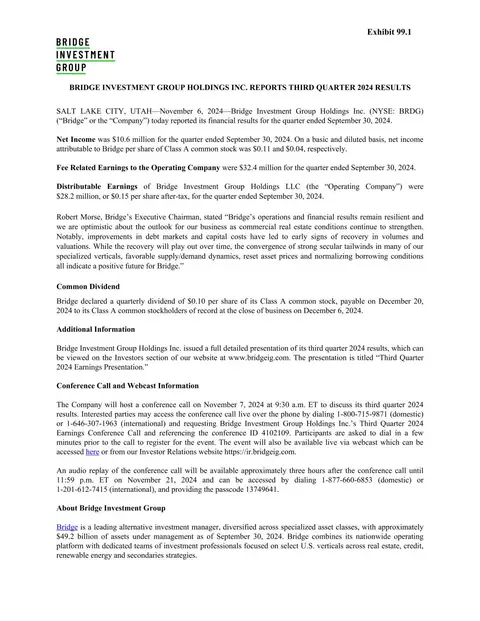 Q3 2024 Earnings Presentation36 slides · Nov 6, 2024
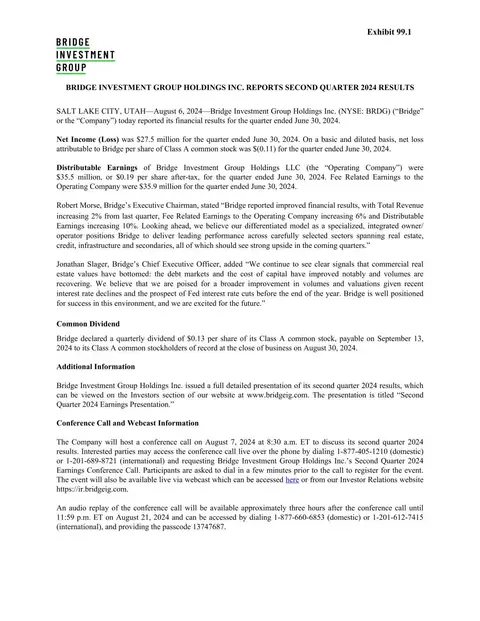 Q2 2024 Earnings Presentation38 slides · Aug 6, 2024
 Q1 2024 Earnings Presentation38 slides · May 8, 2024