Varian Medical Systems — Q1 FY2019 Earnings Presentation
33 slides from Varian Medical Systems's earnings presentation, Jan 23, 2019

Slide 1: First Quarter Fiscal Year 2019
J. Michael Bruff Senior Vice President, Investor Relations [email protected] January 23, 2019 First Quarter Fiscal Year 2019
Slide 2: Forward-Looking Statements
This presentation is intended exclusively for investors. It is not intended for use in Sales or Marketing. Forward - Looking Statements Except for historical information, this presentation contains forward - looking statements within the meaning of the Private Securities Litigation Reform Act of 199

Slide 3: Q1 FY 2019 earnings Agenda
VARIAN CONFIDENTIAL/ PROPRIETARY: DISCLOSED SOLELY FOR IMMEDIATE RECIPIENT ONLY 1. First Quarter Results 2. Total Company Performance 3. Segment Performance 4. FY 2019 Guidance 5. Appendix Q1 FY 2019 earnings Agenda
Slide 4: Q1 FY 2019 key financial metrics
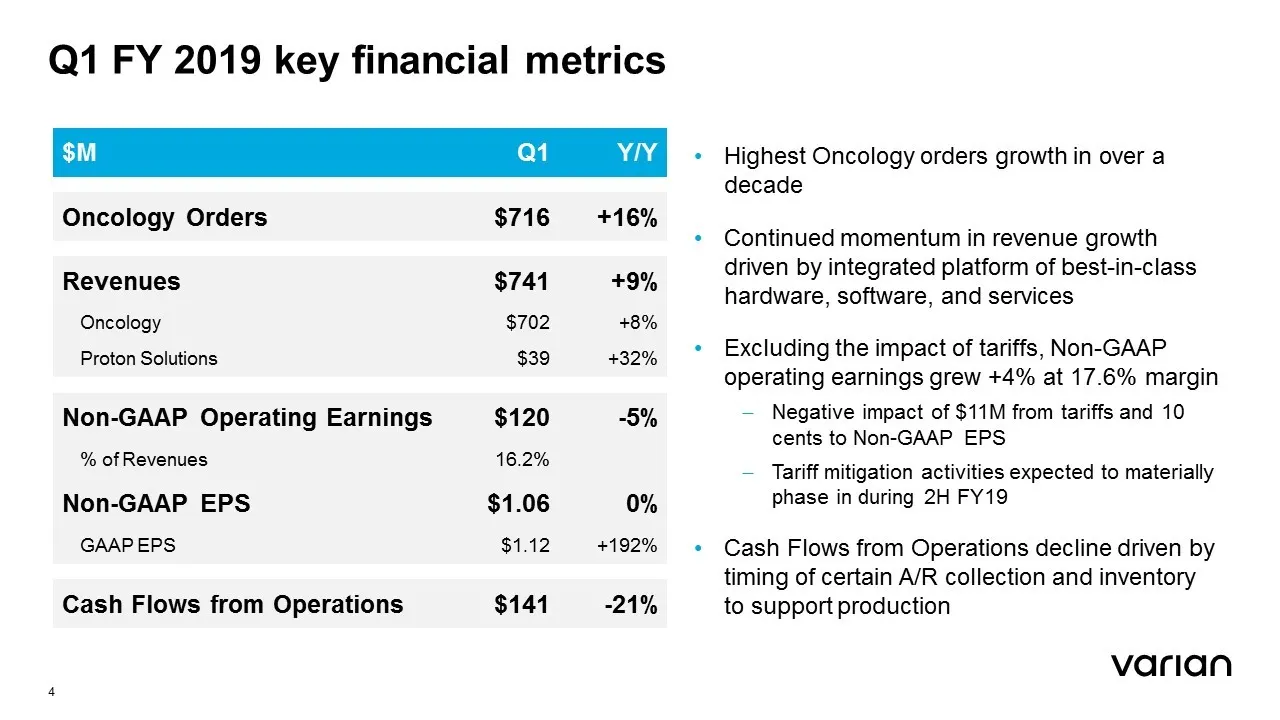
Q1 FY 2019 key financial metrics $M Q1 Y/Y Oncology Orders $716 +16% Revenues $741 +9% Oncology $702 +8% Proton Solutions $39 +32% Non - GAAP Operating Earnings $120 - 5% % of Revenues 16.2% Non - GAAP EPS $1.06 0% GAAP EPS $1.12 +192% Cash Flows from Operations $141 - 21% • Highest Oncology orders
Slide 5: Long-term growth and value creation strategy
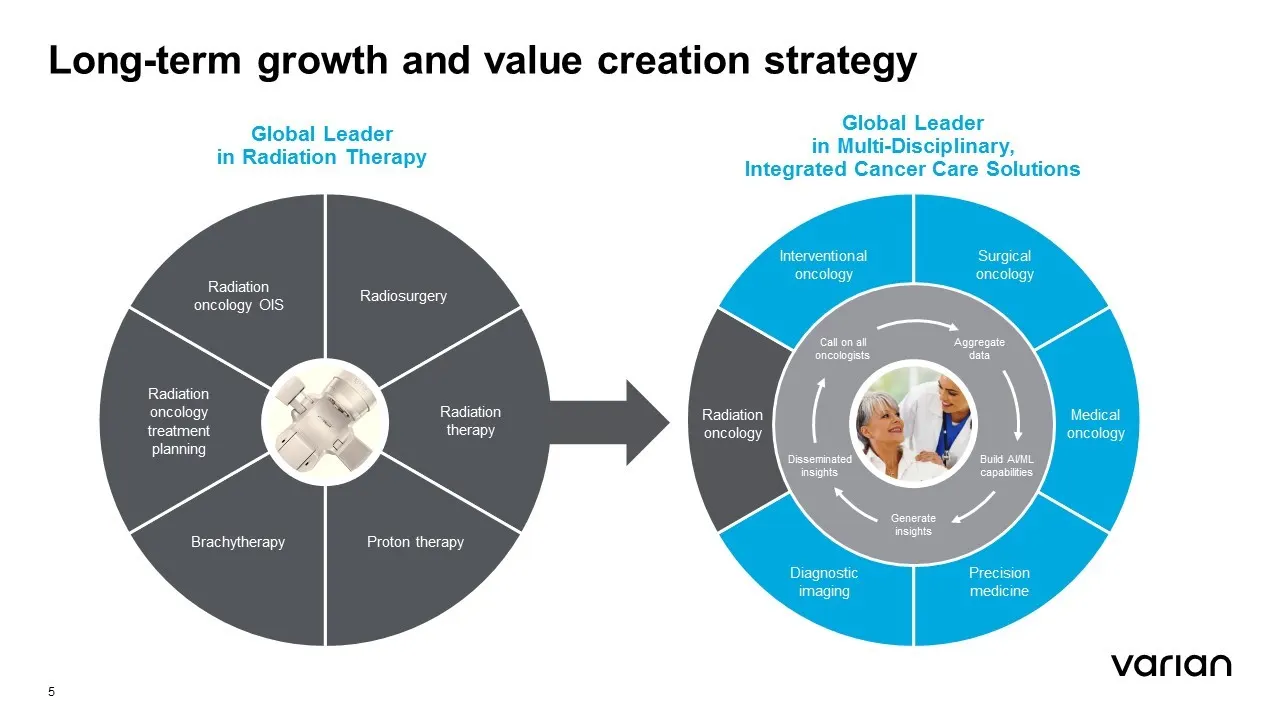
Long - term growth and value creation strategy Global Leader in Radiation Therapy Radiation oncology OIS Radiosurgery Brachytherapy Radiation oncology treatment planning Proton therapy Radiation therapy Global Leader in Multi - Disciplinary, Integrated Cancer Care Solutions Interventional oncology S
Slide 6: How we plan to achieve our strategy
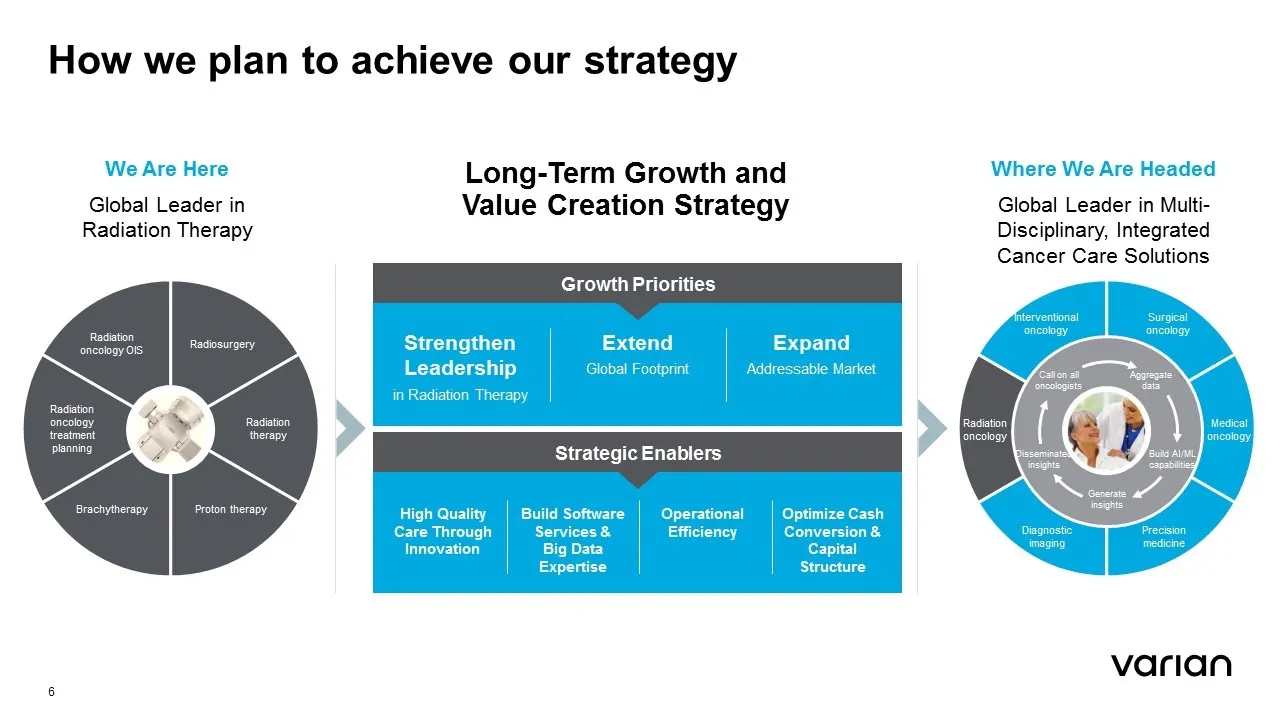
How we plan to achieve our strategy 6 Strengthen Leadership in Radiation Therapy Extend Global Footprint Expand Addressable Market Growth Priorities High Quality Care Through Innovation Build Software Services & Big Data Expertise Operational Efficiency Optimize Cash Conversion & Capital Structure S
Slide 7: Executing on long-term growth strategy
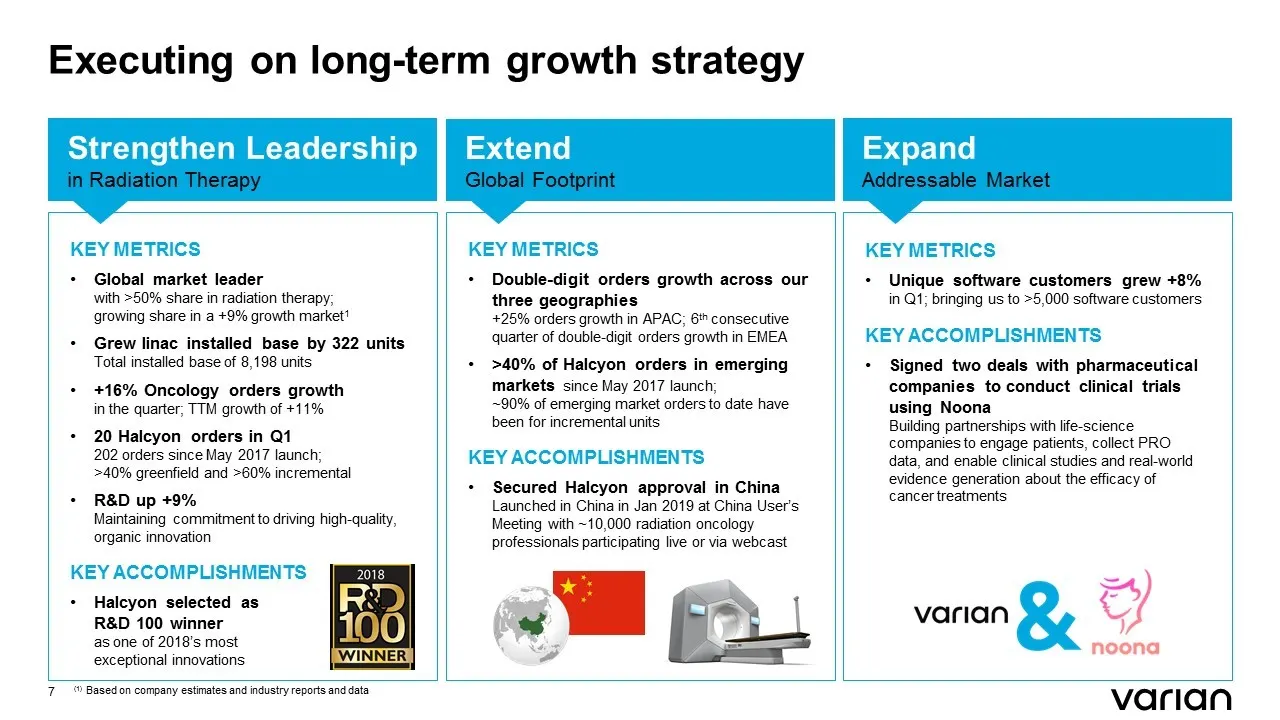
Executing on long - term growth strategy Strengthen Leadership in Radiation Therapy Extend Global Footprint Expand Addressable Market 7 KEY METRICS • Global market leader with >50% share in radiation therapy; growing share in a +9% gr owth market 1 • Grew linac installed base by 322 units Total inst
Slide 8: Key wins
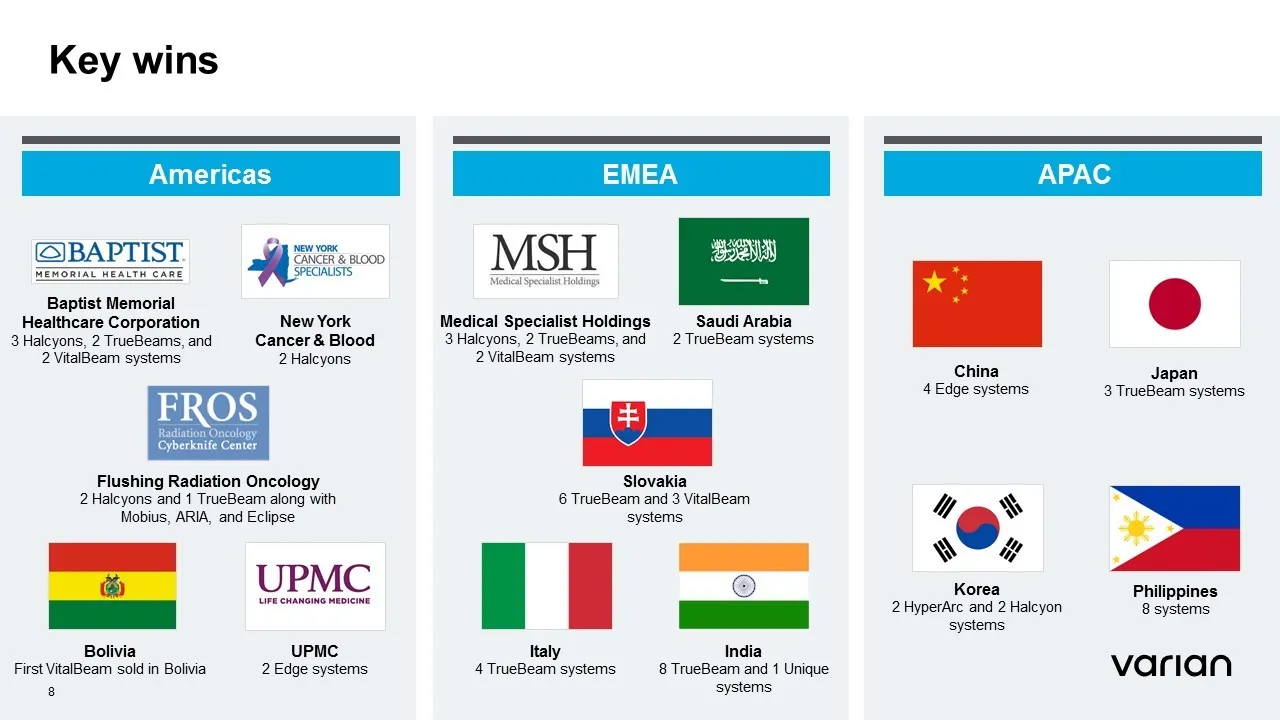
VARIAN CONFIDENTIAL – INTERNAL USE ONLY Key wins Americas EMEA APAC Medical Specialist Holdings 3 Halcyons, 2 TrueBeams , and 2 VitalBeam systems Baptist Memorial Healthcare Corporation 3 Halcyons, 2 TrueBeams , and 2 VitalBeam systems New York Cancer & Blood 2 Halcyons UPMC 2 Edge systems Bolivia F
Slide 9: Varian linac net installed base
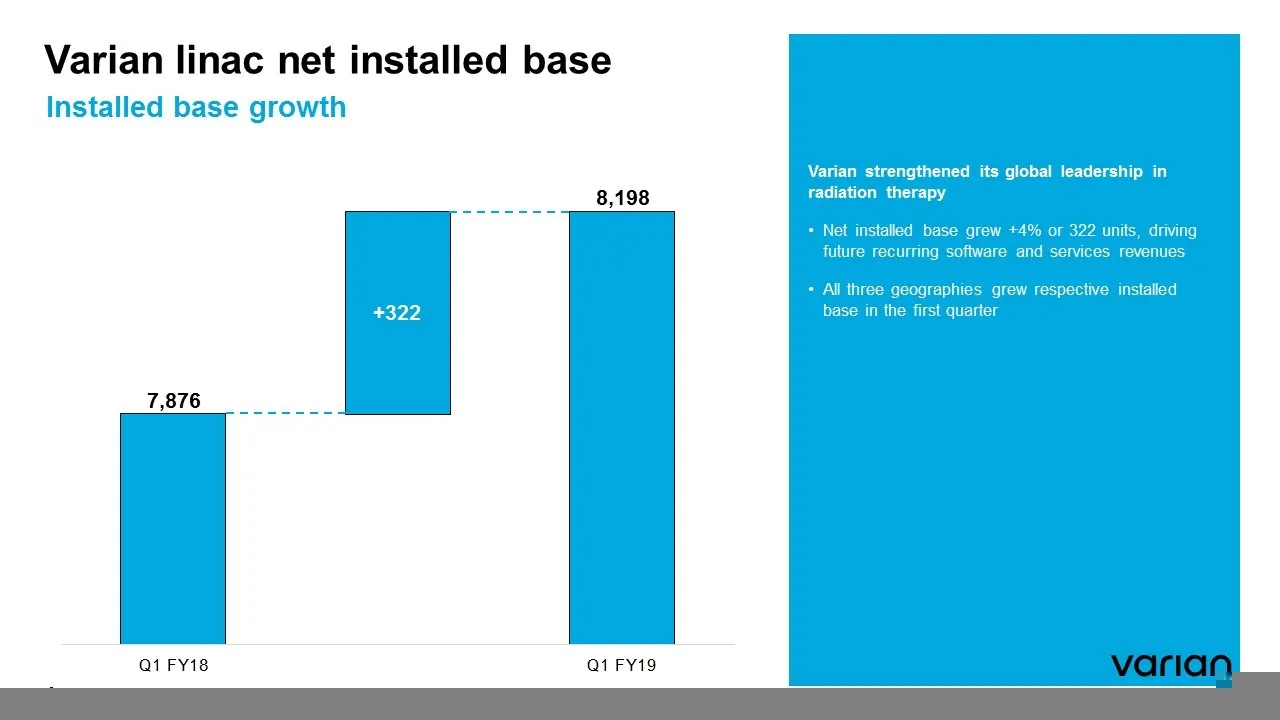
Varian linac net installed base Installed base growth Varian strengthened its global leadership in radiation therapy • Net installed base grew +4% or 322 units, driving future recurring software and services revenues • All three geographies grew respective installed base in the first quarter Q1 FY18

Slide 10: Total Company Performance
Total Company Performance
Slide 11: Total company results (GAAP)
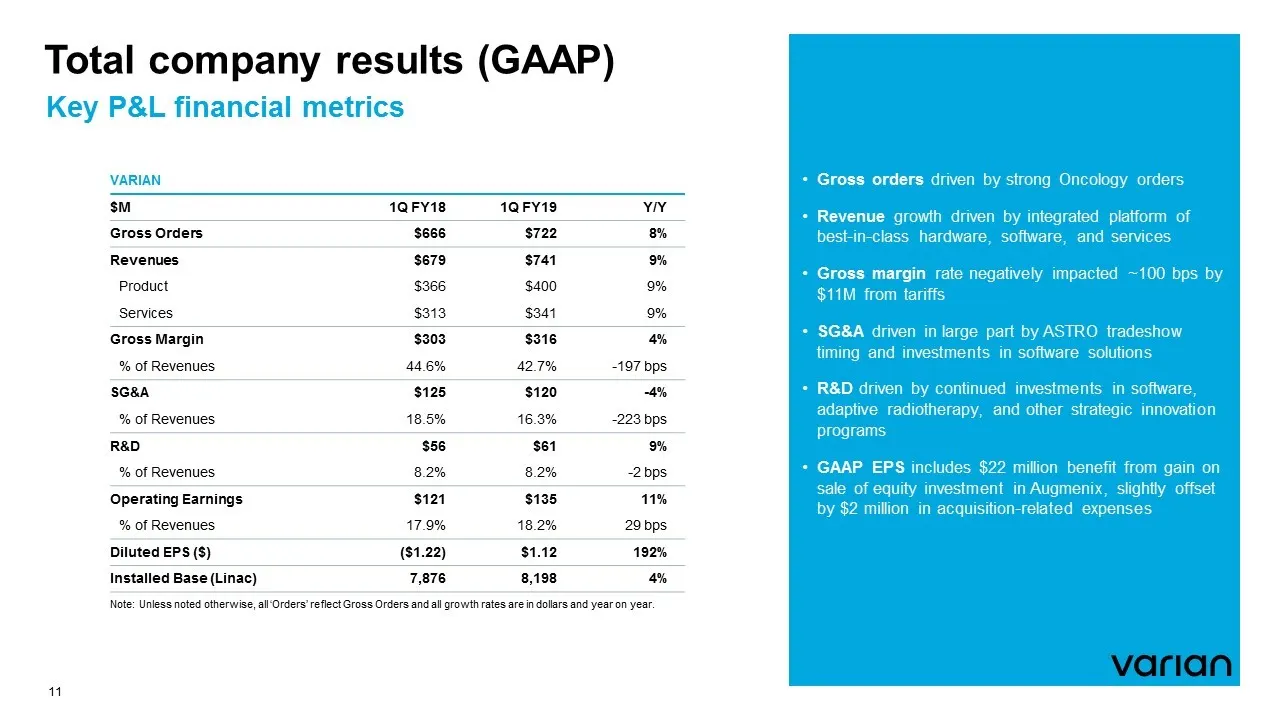
Total company results (GAAP) Key P&L financial metrics 11 • Gross orders driven by strong Oncology orders • Revenue growth driven by integrated platform of best - in - class hardware, software, and services • Gross margin rate negatively impacted ~100 bps by $11M from tariffs • SG&A driven in large
Slide 12: Total company results (non-GAAP)
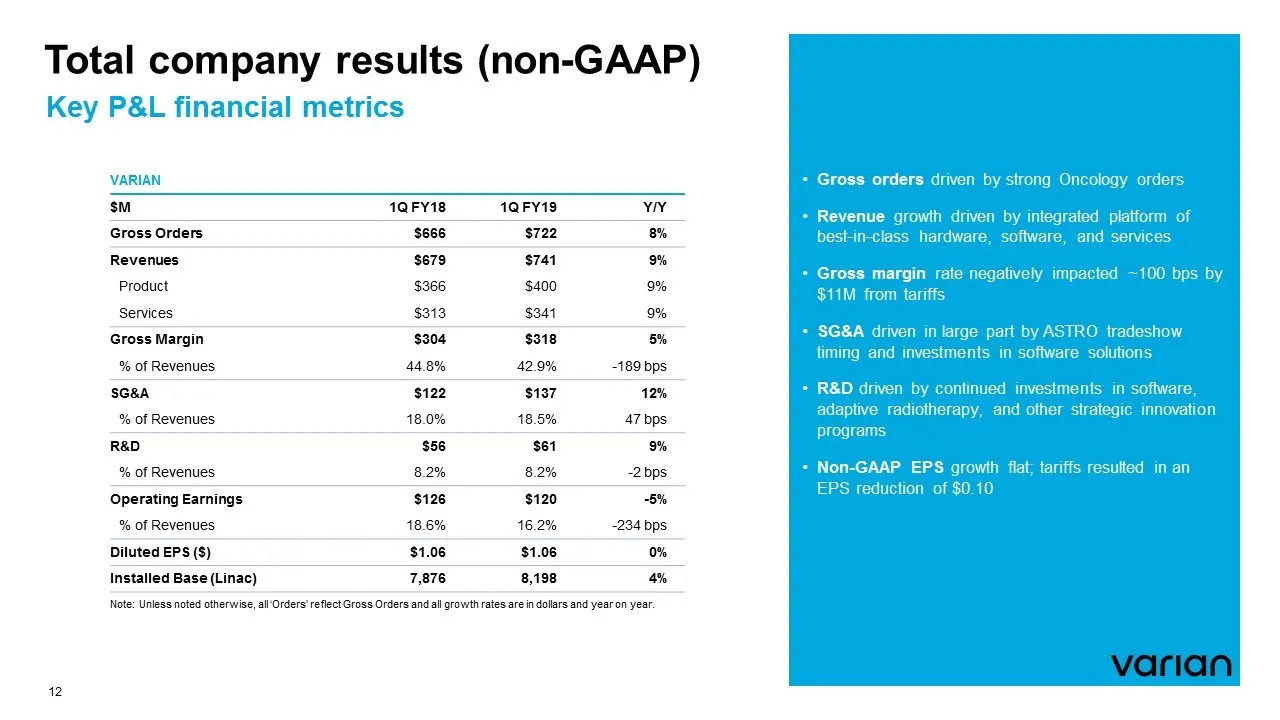
Total company results (non - GAAP) Key P&L financial metrics 12 • Gross orders driven by strong Oncology orders • Revenue growth driven by integrated platform of best - in - class hardware, software, and services • Gross margin rate negatively impacted ~100 bps by $11M from tariffs • SG&A driven in
Slide 13: Total company results: balance sheet and cash flow metrics
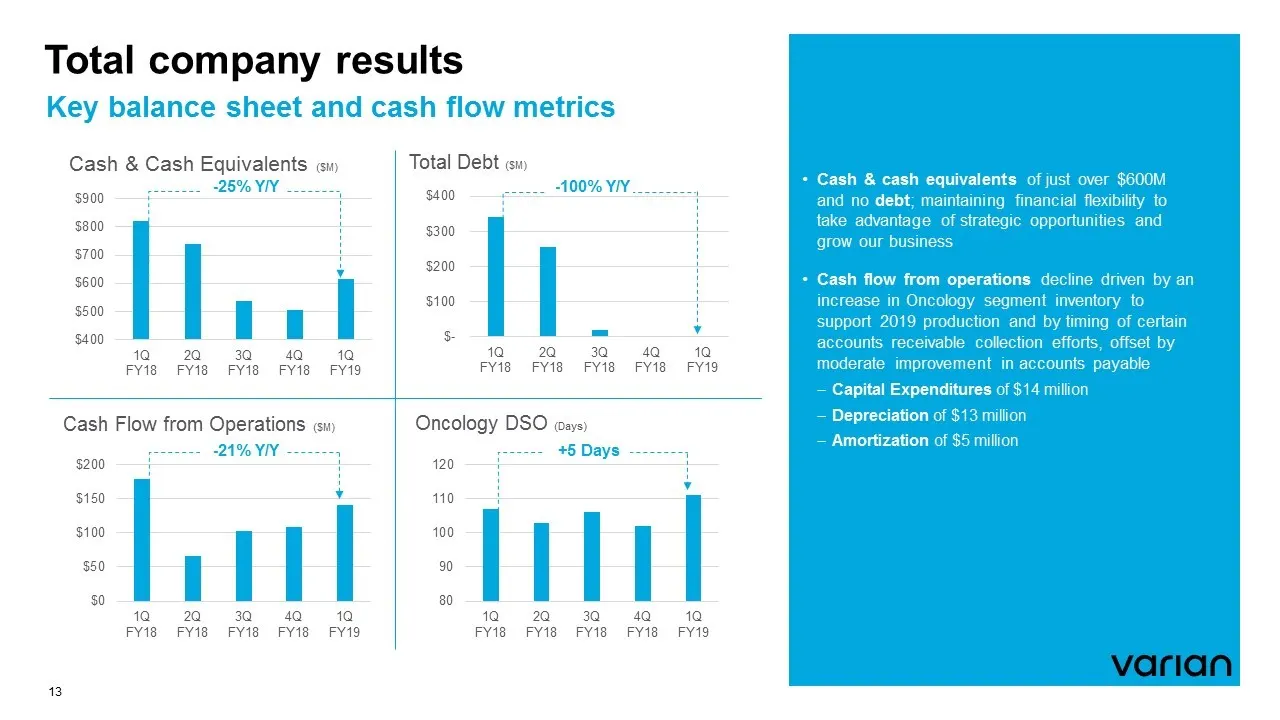
$- $100 $200 $300 $400 1Q FY18 2Q FY18 3Q FY18 4Q FY18 1Q FY19 - 100% Y/Y Cash Flow from Operations ($M) $0 $50 $100 $150 $200 1Q FY18 2Q FY18 3Q FY18 4Q FY18 1Q FY19 Total Debt ($M) Total company results Key balance sheet and cash flow metrics Cash & Cash Equivalents ($M) $400 $500 $600 $700 $800 $
Slide 14: Capital allocation priorities
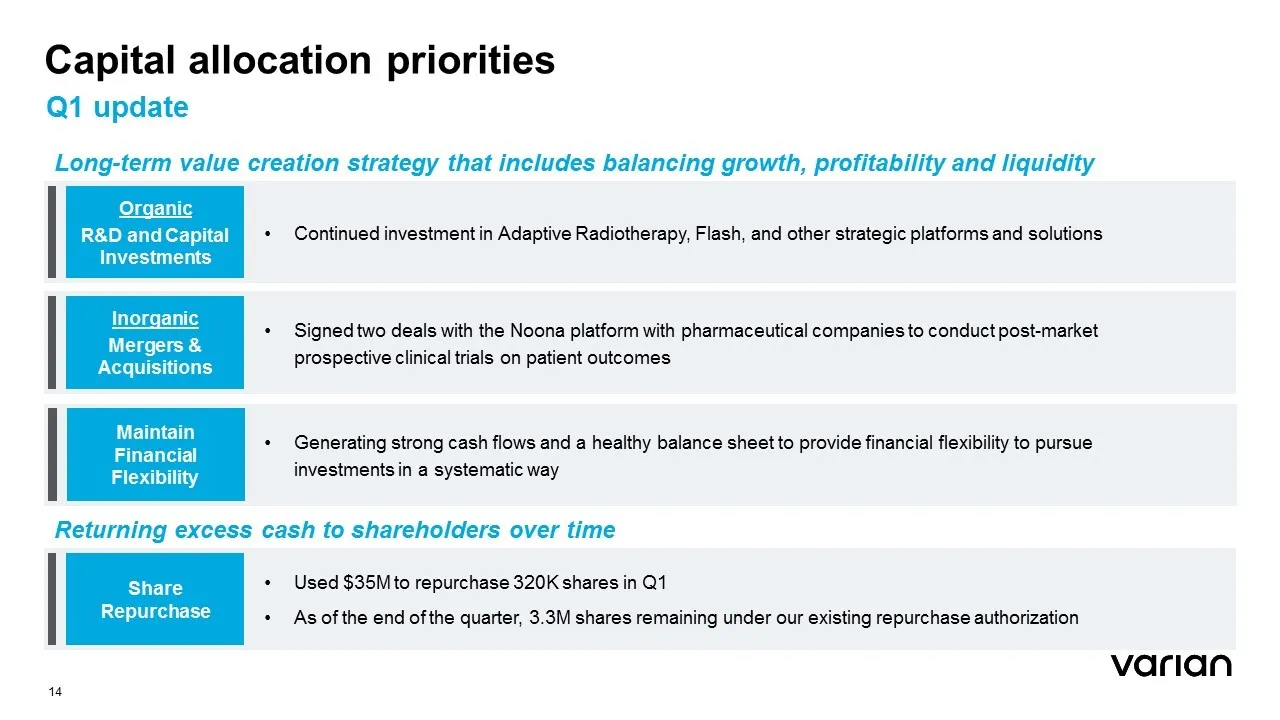
• Used $35M to repurchase 320K shares in Q1 • As of the end of the quarter, 3.3M shares remaining under our existing repurchase authorization Organic R&D and Capital Investments • Continued investment in Adaptive Radiotherapy, Flash, and other strategic platforms and solutions Inorganic Mergers & Ac

Slide 15: Segment Performance
Segment Performance
Slide 16: Oncology Systems segment (GAAP)
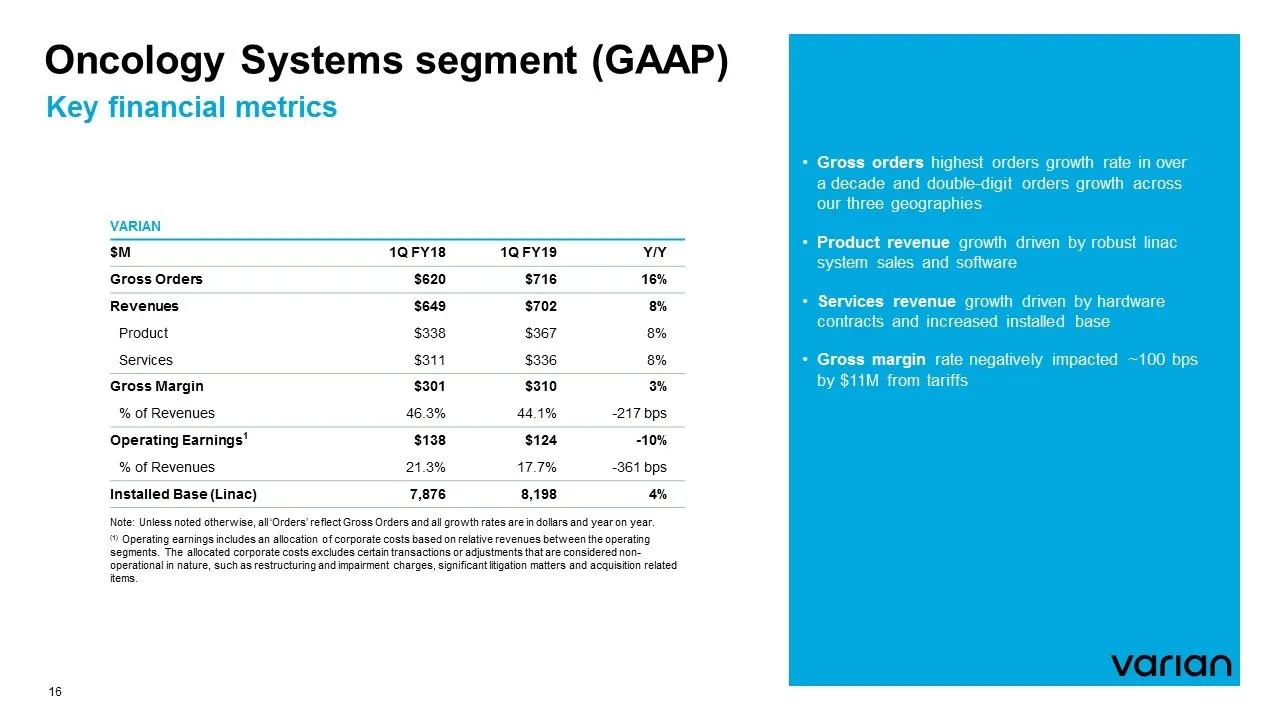
Oncology Systems segment (GAAP) Key financial metrics 16 Note: Unless noted otherwise, all ‘Orders’ reflect Gross Orders and all growth rates are in dollars and year on year. (1) Operating earnings includes an allocation of corporate costs based on relative revenues between the operating segments. T
Slide 17: Oncology Systems gross orders by geography
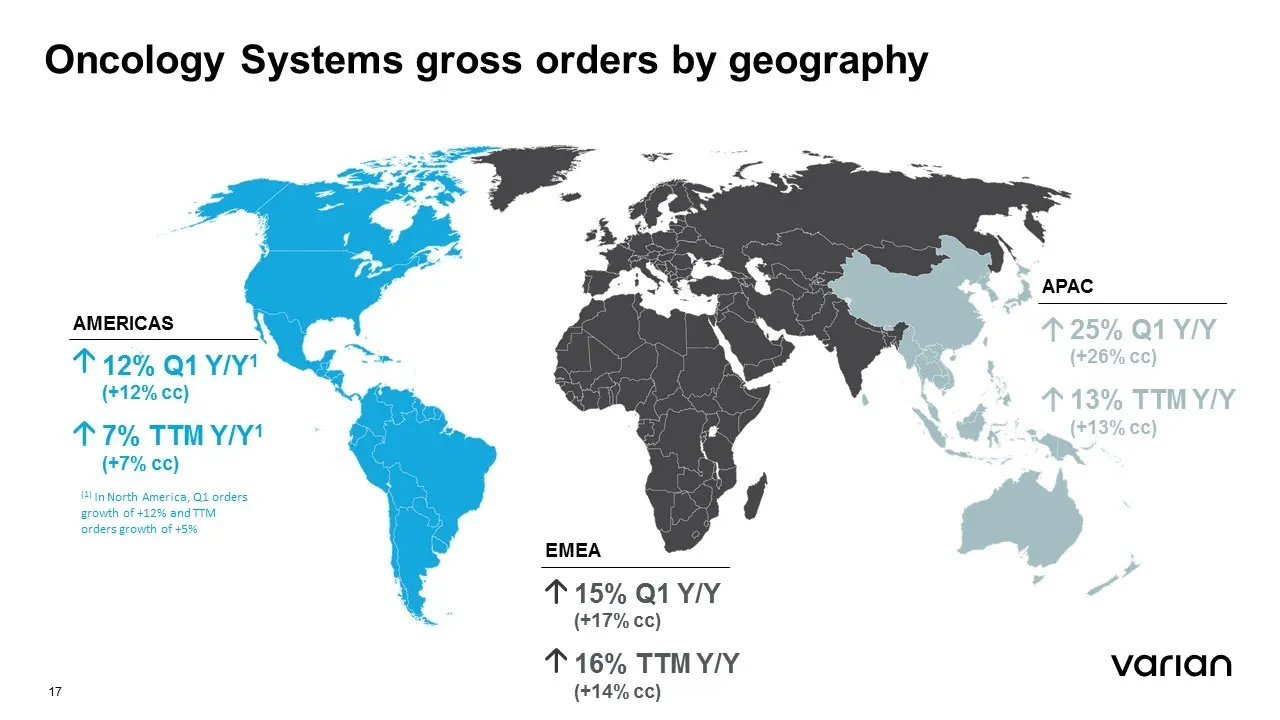
17 Oncology Systems gross orders by geography AMERICAS 12% Q1 Y/Y 1 (+12% c c) 7% TTM Y/Y 1 (+7% cc ) APAC 25% Q1 Y/Y (+26% cc ) 13% TTM Y/Y (+13% cc ) EMEA 15% Q1 Y/Y (+17% cc ) 16% TTM Y/Y (+14% cc ) (1) In North America, Q1 orders growth of +12% and TTM orders growth of +5%
Slide 18: Proton Solutions segment (GAAP)
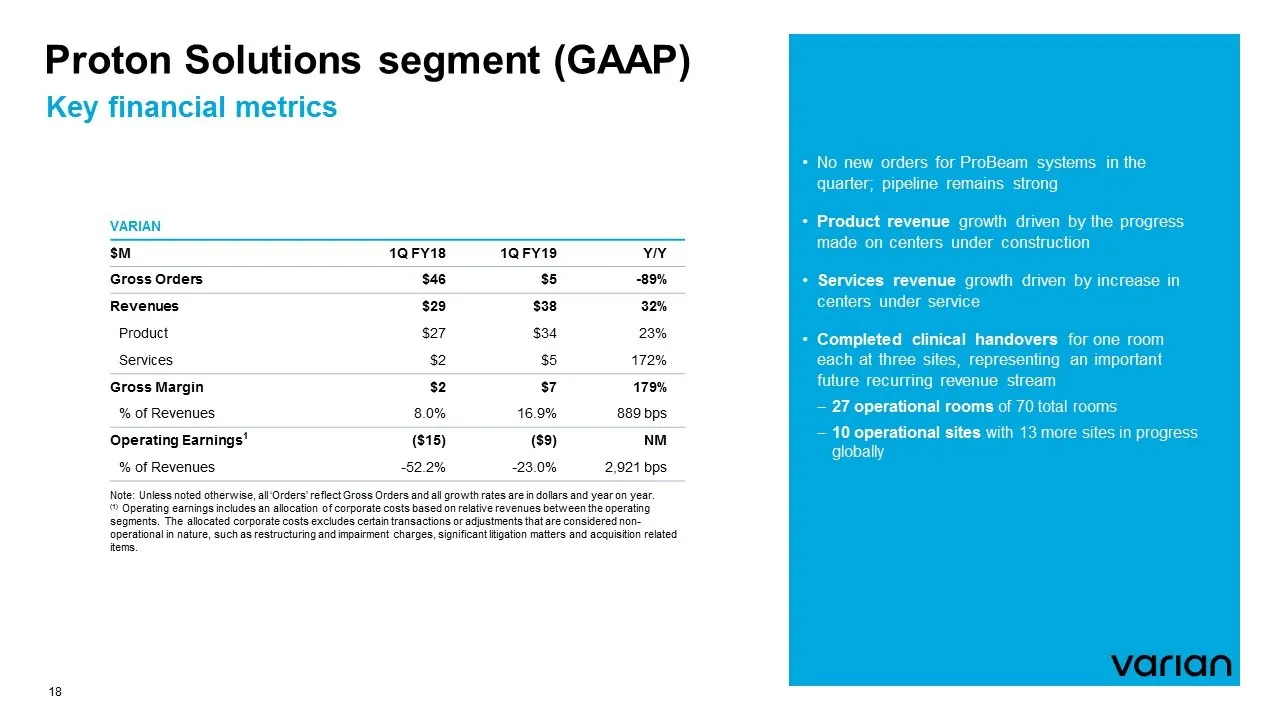
Proton Solutions segment (GAAP) Key financial metrics 18 Note: Unless noted otherwise, all ‘Orders’ reflect Gross Orders and all growth rates are in dollars and year on year. (1) Operating earnings includes an allocation of corporate costs based on relative revenues between the operating segments. T
Slide 19: ProBeam proton therapy system sites
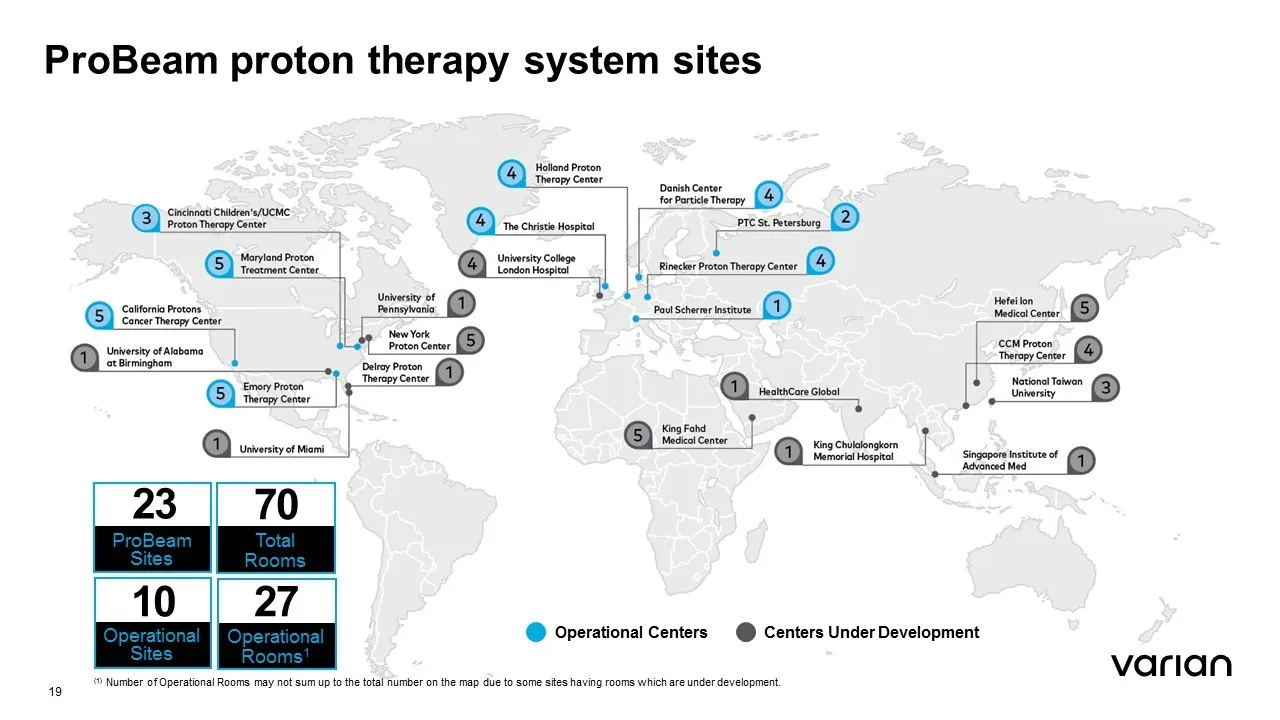
ProBeam proton therapy system sites Operational Centers Centers Under Development Total Rooms ProBeam Sites Operational R ooms 1 Operational Sites 70 27 10 23 (1) Number of Operational Rooms may not sum up to the total number on the map due to some sites having rooms which are under development. 19

Slide 20: FY 2019 Guidance
FY 2019 Guidance
Slide 21: Varian consolidated: Reaffirming guidance for fiscal year
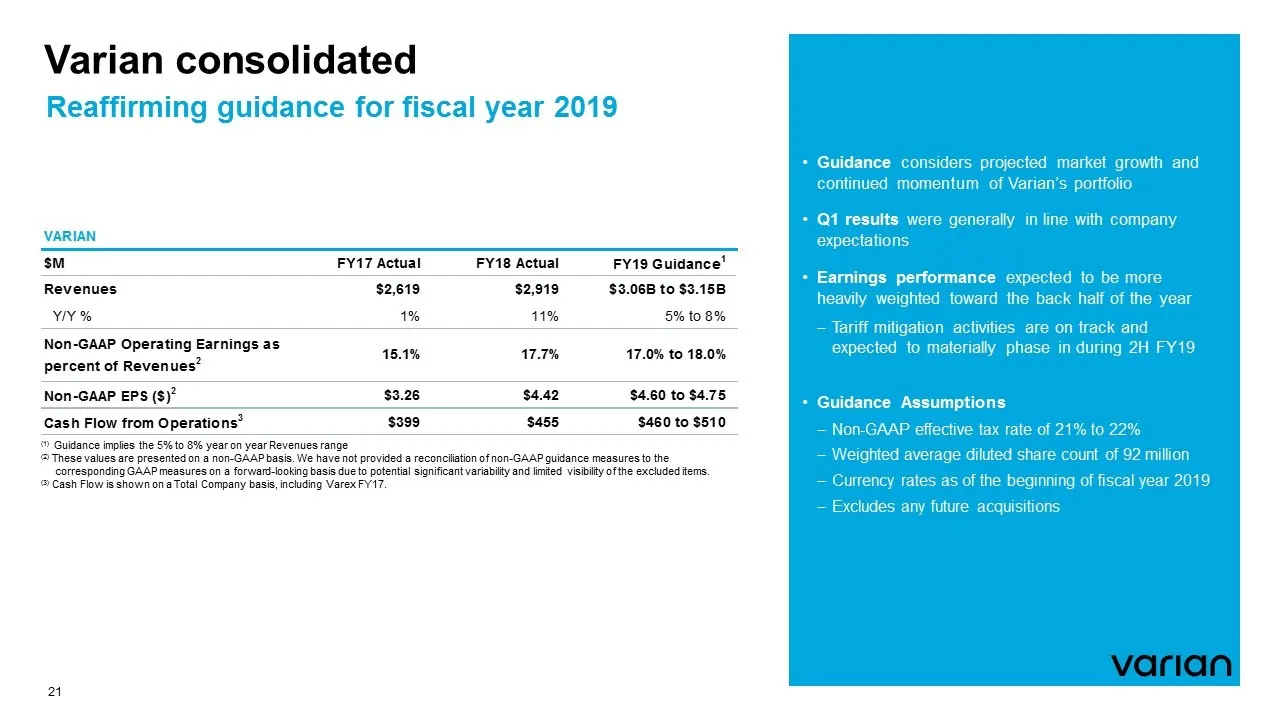
Varian consolidated Reaffirming guidance for fiscal year 2019 21 • Guidance considers projected market growth and continued momentum of Varian’s portfolio • Q1 results were generally in line with company expectations • Earnings performance expected to be more heavily weighted toward the back half of
Slide 22: In summary, we are...
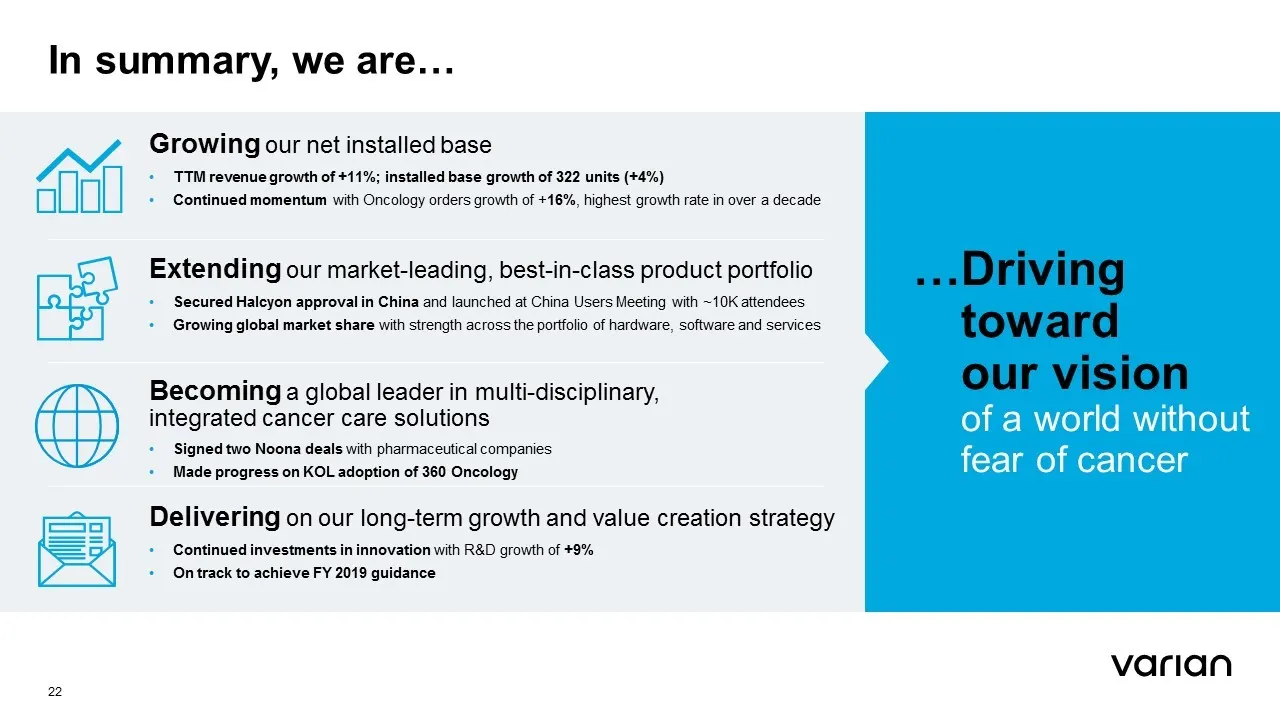
FOR INVESTOR USE ONLY In summary, we are… …Driving toward our vision of a world without fear of cancer Delivering on our long - term growth and value creation strategy Growing our net installed base Extending our market - leading, best - in - class product portfolio Becoming a global leader in multi

Slide 23: Appendix
Appendix
Slide 24: Non-GAAP disclosure
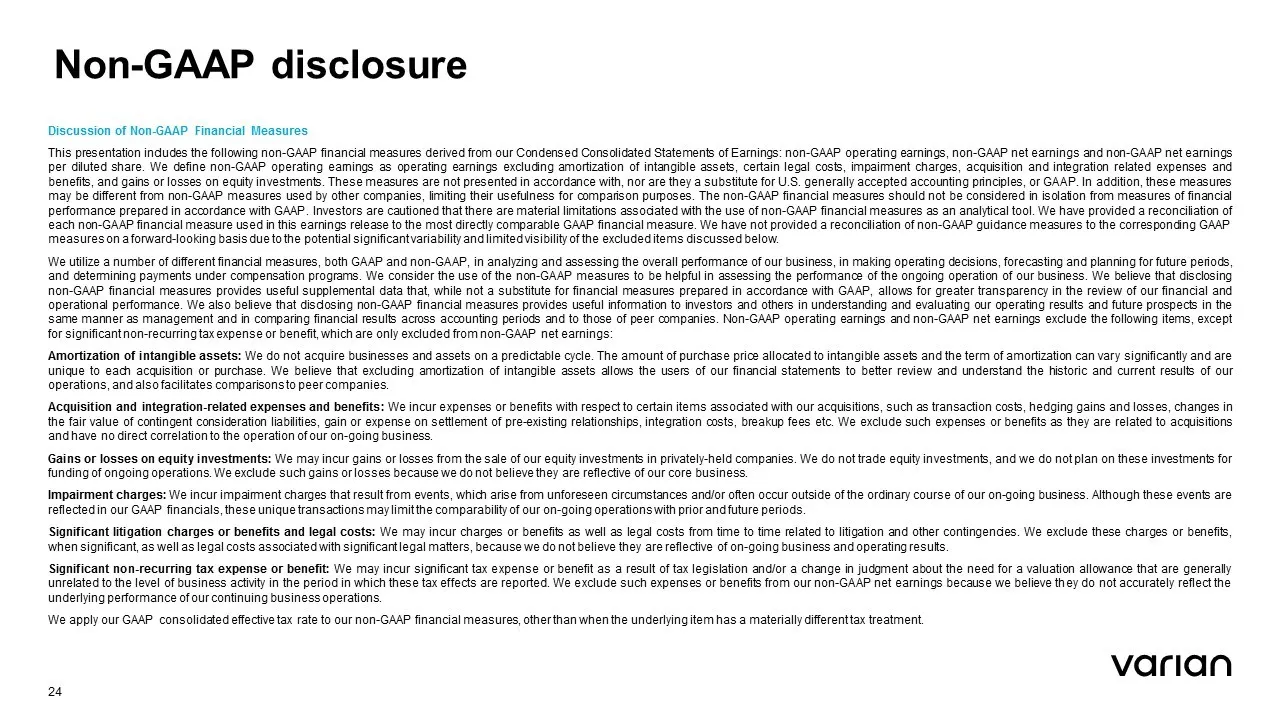
Non - GAAP disclosure 24 Discussion of Non - GAAP Financial Measures This presentation includes the following non - GAAP financial measures derived from our Condensed Consolidated Statements of Earnings : non - GAAP operating earnings, non - GAAP net earnings and non - GAAP net earnings per diluted
Slide 25: GAAP to non-GAAP reconciliation
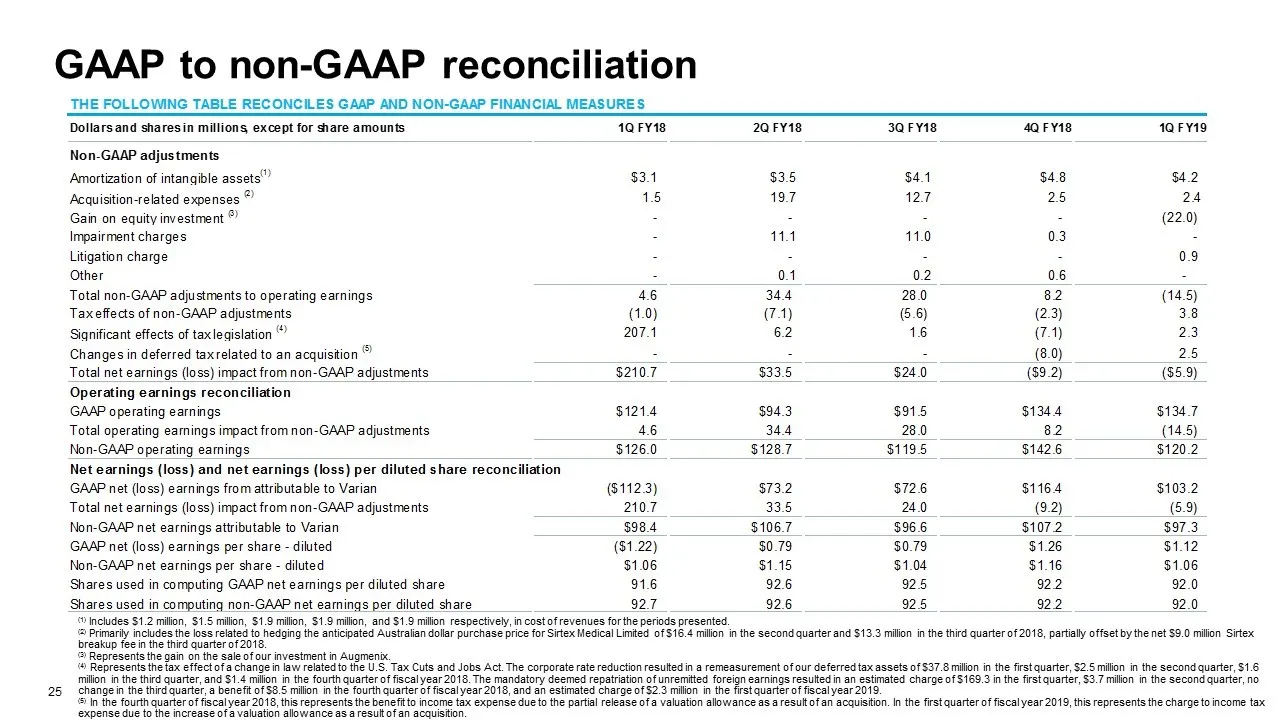
GAAP to non - GAAP reconciliation 25 (1) Includes $1.2 million, $1.5 million, $1.9 million, $1.9 million, and $1.9 million respectively, in cost of revenues for the p eri ods presented. (2) Primarily includes the loss related to hedging the anticipated Australian dollar purchase price for Sirtex Med
Slide 26: Total revenues by sales classification
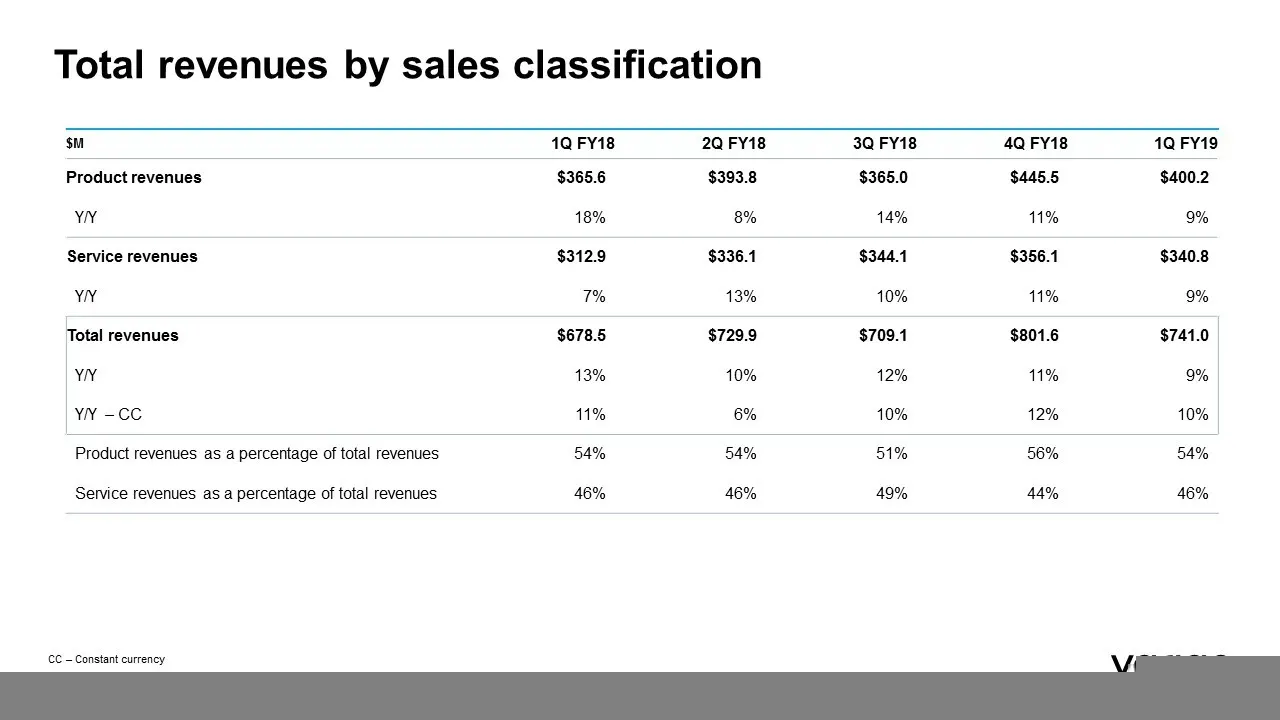
Total revenues by sales classification 26 CC – Constant currency $M 1Q FY18 2Q FY18 3Q FY18 4Q FY18 1Q FY19 Product revenues $365.6 $393.8 $365.0 $445.5 $400.2 Y/Y 18% 8% 14% 11% 9% Service revenues $312.9 $336.1 $344.1 $356.1 $340.8 Y/Y 7% 13% 10% 11% 9% Total revenues $678.5 $729.9 $709.1 $801.6 $
Slide 27: Total revenues by product type
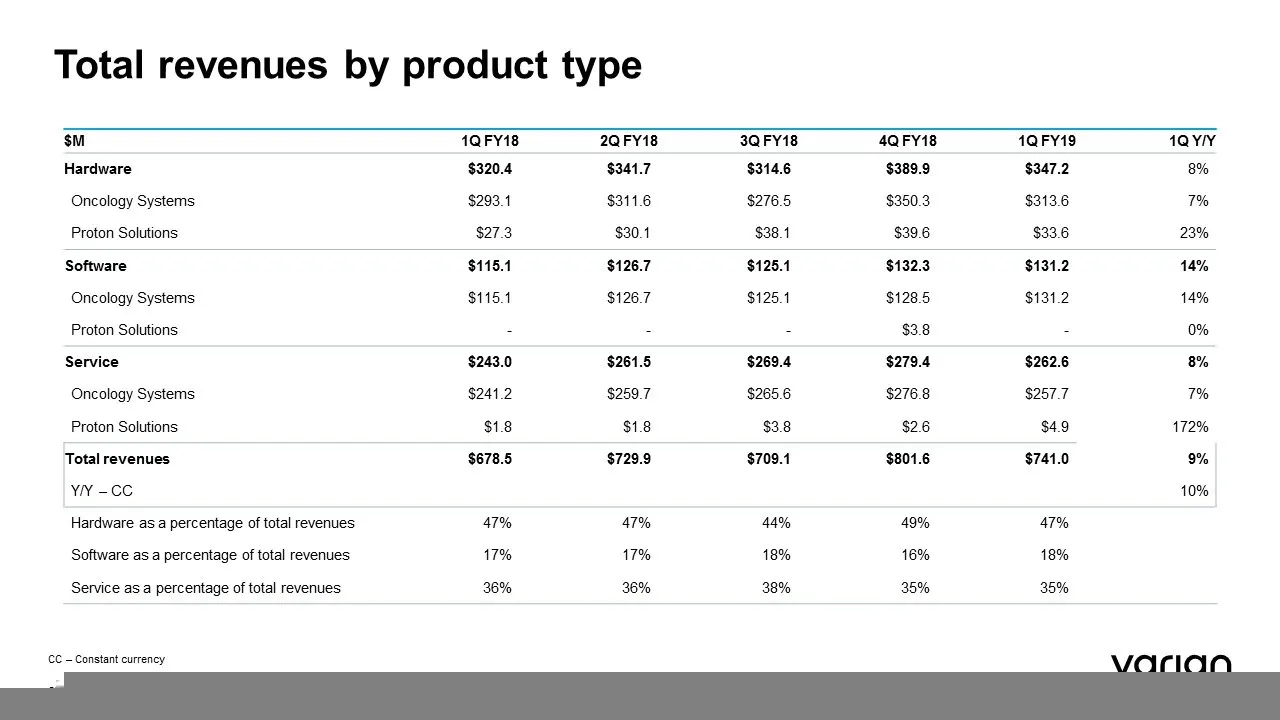
Total revenues by product type 27 CC – Constant currency $M 1Q FY18 2Q FY18 3Q FY18 4Q FY18 1Q FY19 1Q Y/Y Hardware $320.4 $341.7 $314.6 $389.9 $347.2 8% Oncology Systems $293.1 $311.6 $276.5 $350.3 $313.6 7% Proton Solutions $27.3 $30.1 $38.1 $39.6 $33.6 23% Software $115.1 $126.7 $125.1 $132.3 $13
Slide 28: Total revenues by region
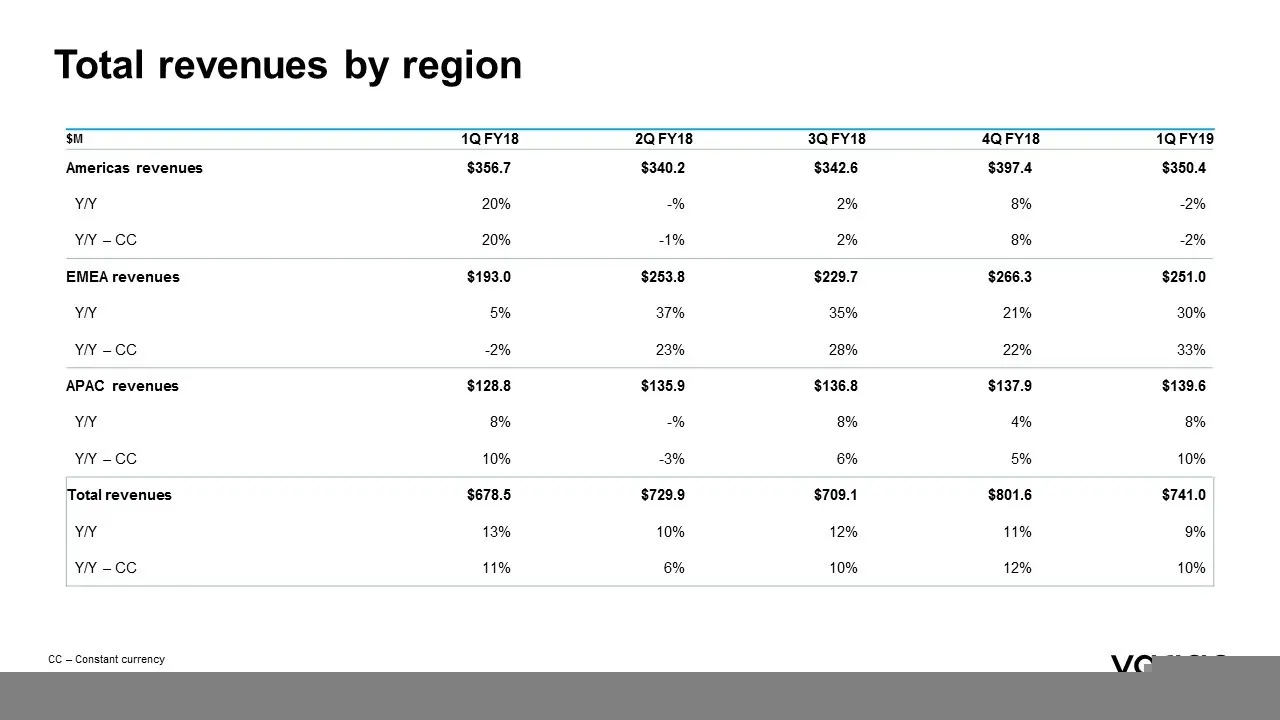
Total revenues by region 28 CC – Constant currency $M 1Q FY18 2Q FY18 3Q FY18 4Q FY18 1Q FY19 Americas revenues $356.7 $340.2 $342.6 $397.4 $350.4 Y/Y 20% - % 2% 8% - 2% Y/Y – CC 20% - 1% 2% 8% - 2% EMEA revenues $193.0 $253.8 $229.7 $266.3 $251.0 Y/Y 5% 37% 35% 21% 30% Y/Y – CC - 2% 23% 28% 22% 33%
Slide 29: Total Oncology Systems revenues by sales classification
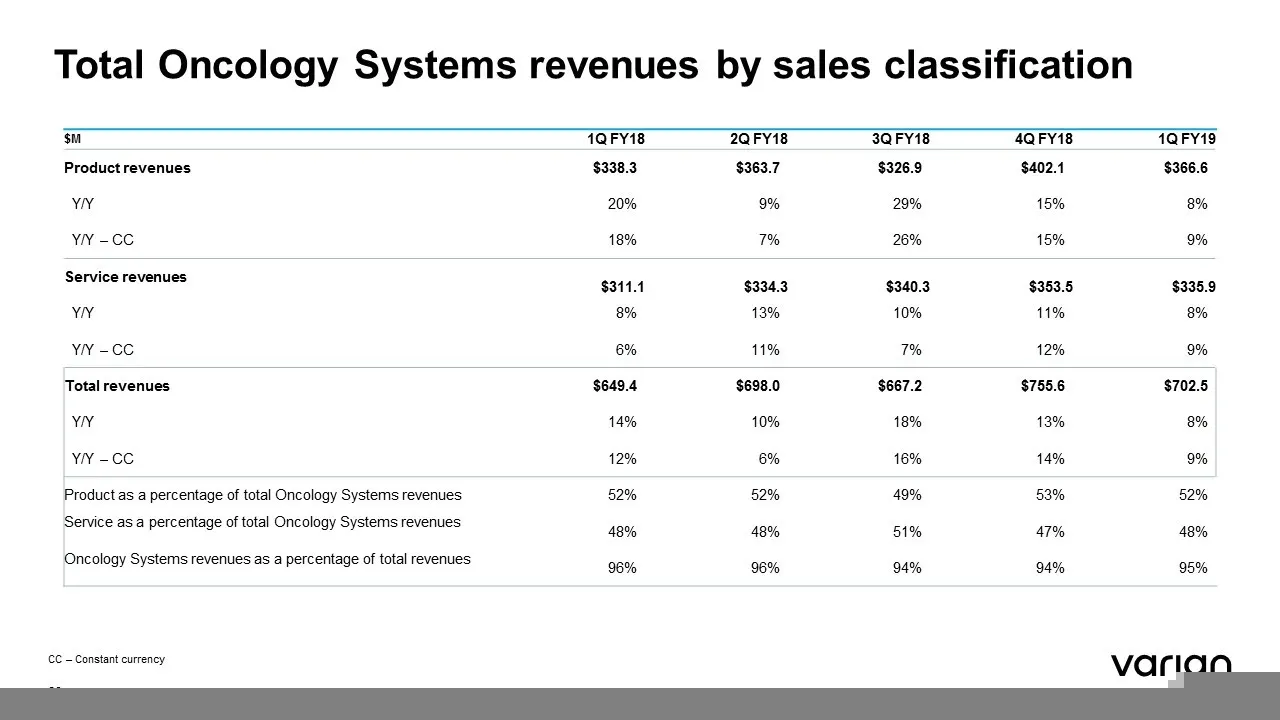
Total Oncology Systems revenues by sales classification 29 CC – Constant currency $M 1Q FY18 2Q FY18 3Q FY18 4Q FY18 1Q FY19 Product revenues $338.3 $363.7 $326.9 $402.1 $366.6 Y/Y 20% 9% 29% 15% 8% Y/Y – CC 18% 7% 26% 15% 9% Service revenues $311.1 $334.3 $340.3 $353.5 $335.9 Y/Y 8% 13% 10% 11% 8%
Slide 30: Total Oncology Systems revenues by region
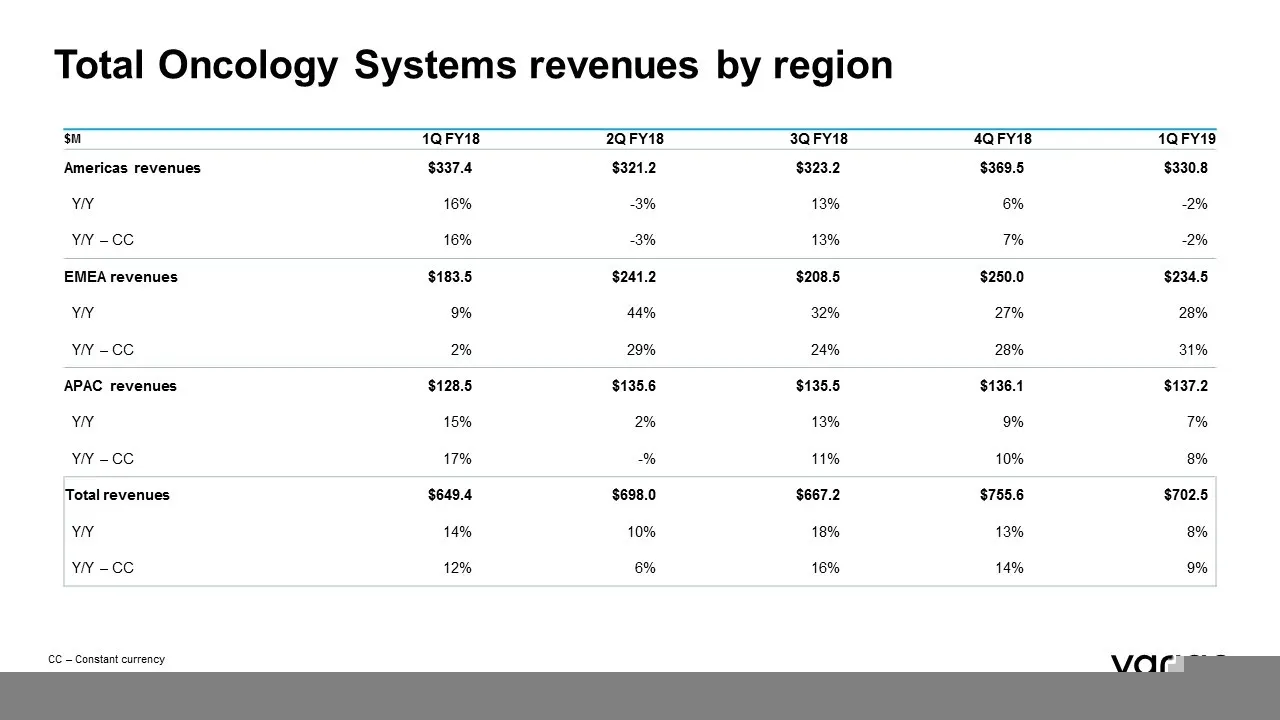
Total Oncology Systems revenues by region 30 CC – Constant currency $M 1Q FY18 2Q FY18 3Q FY18 4Q FY18 1Q FY19 Americas revenues $337.4 $321.2 $323.2 $369.5 $330.8 Y/Y 16% - 3% 13% 6% - 2% Y/Y – CC 16% - 3% 13% 7% - 2% EMEA revenues $183.5 $241.2 $208.5 $250.0 $234.5 Y/Y 9% 44% 32% 27% 28% Y/Y – CC
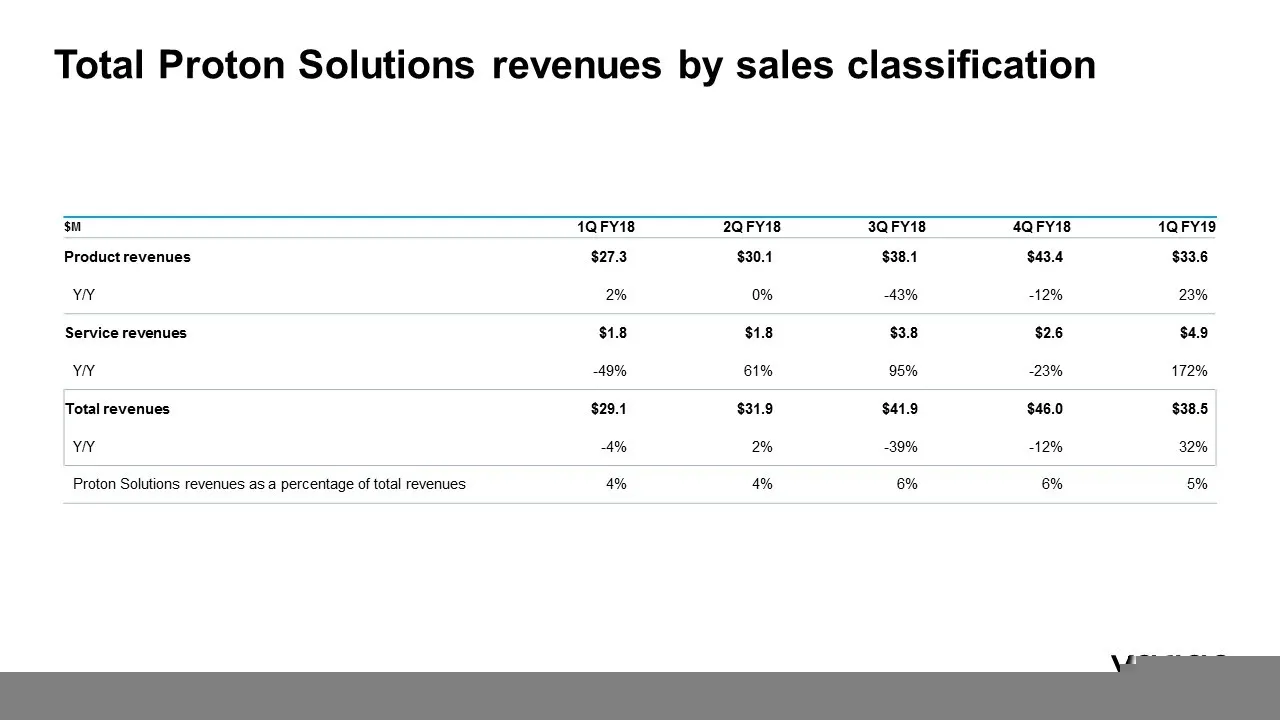
Slide 31: Total Proton Solutions revenues by sales classification
Total Proton Solutions revenues by sales classification 31 $M 1Q FY18 2Q FY18 3Q FY18 4Q FY18 1Q FY19 Product revenues $27.3 $30.1 $38.1 $43.4 $33.6 Y/Y 2% 0% - 43% - 12% 23% Service revenues $1.8 $1.8 $3.8 $2.6 $4.9 Y/Y - 49% 61% 95% - 23% 172% Total revenues $29.1 $31.9 $41.9 $46.0 $38.5 Y/Y - 4%
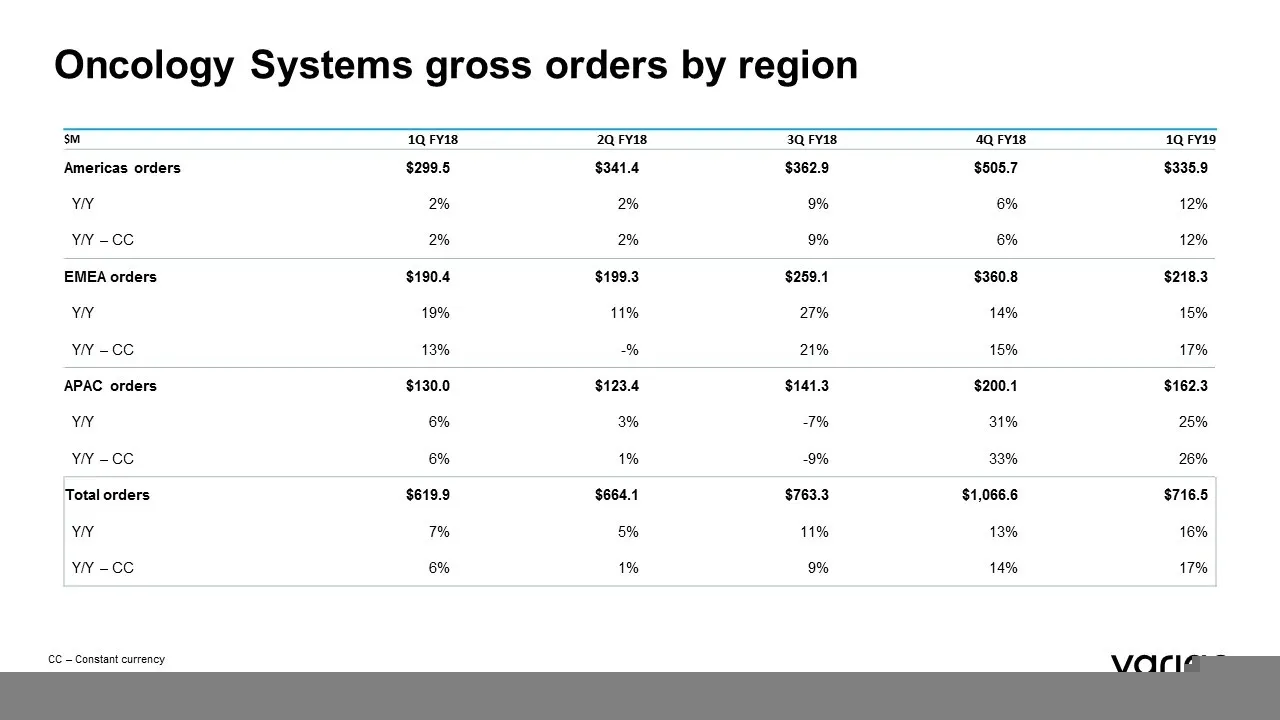
Slide 32: Oncology Systems gross orders by region
Oncology Systems gross orders by region 32 CC – Constant currency $M 1Q FY18 2Q FY18 3Q FY18 4Q FY18 1Q FY19 Americas orders $299.5 $341.4 $362.9 $505.7 $335.9 Y/Y 2% 2% 9% 6% 12% Y/Y – CC 2% 2% 9% 6% 12% EMEA orders $190.4 $199.3 $259.1 $360.8 $218.3 Y/Y 19% 11% 27% 14% 15% Y/Y – CC 13% - % 21% 15%

Slide 33: Our promise: People powering victories
Our promise 33 People powering victories Imagine a world without fear of cancer. We do, every day. We innovate new technologies for treating cancer and for connecting clinical teams to advance patient outcomes. Through ingenuity we inspire new victories and empower people in the fight against cancer
Source: SEC EDGAR · 8-K filed Jan 23, 2019
More decks from Varian Medical Systems Inc
 Q1 FY2021 Earnings Presentation29 slides · Jan 26, 2021
 Q4 FY2020 Earnings Presentation30 slides · Oct 27, 2020
 Merger or Acquisition (August 2020)33 slides · Aug 4, 2020
 Merger or Acquisition (August 2020)18 slides · Aug 3, 2020
 Q3 FY2020 Earnings Presentation36 slides · Aug 3, 2020
 Q2 FY2020 Earnings Presentation36 slides · May 4, 2020