Altabancorp — People's Utah Bancorp — Investor Presentation (January 2019)
24 slides from Altabancorp's investor presentation, Jan 30, 2019

Slide 1: Investor Presentation
Investor Presentation Len Williams, President & CEO Mark Olson, EVP & CFO January 30, 2019 Exhibit 99.1
Slide 2: Forward Looking Statements
Forward Looking Statements This presentation contains forward-looking statements within the meaning of the Private Securities Litigation Reform Act of 1995. These forward-looking statements are subject to risks and uncertainties, including, but not limited to: The credit and concentration risks of o
Slide 3: Company Overview
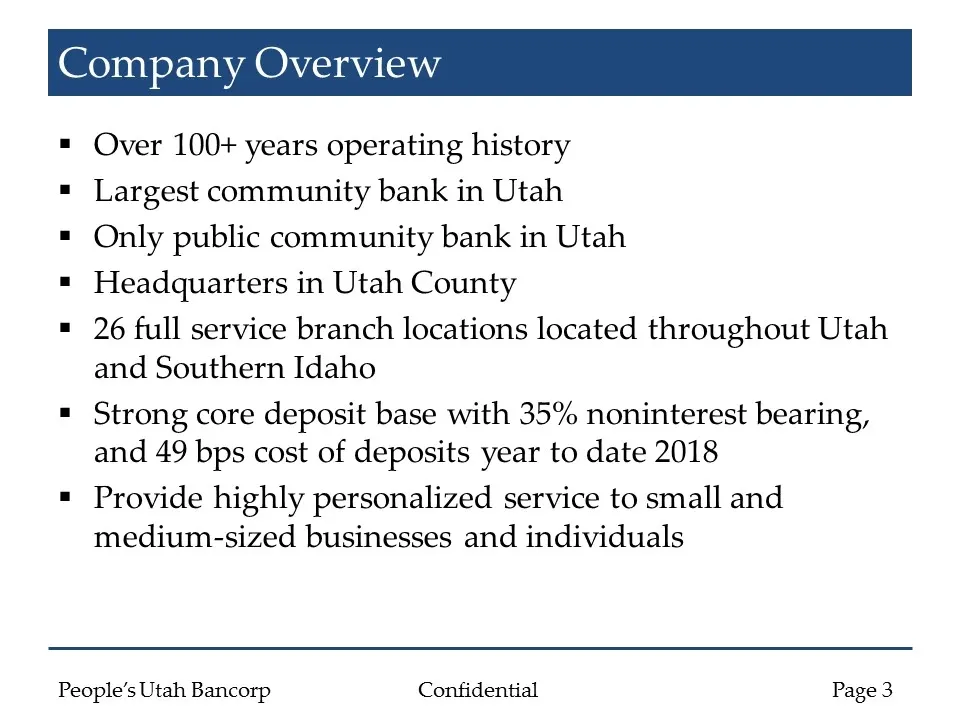
Company Overview Over 100+ years operating history Largest community bank in Utah Only public community bank in Utah Headquarters in Utah County 26 full service branch locations located throughout Utah and Southern Idaho Strong core deposit base with 35% noninterest bearing, and 49 bps cost of depos
Slide 4: Operating Structure
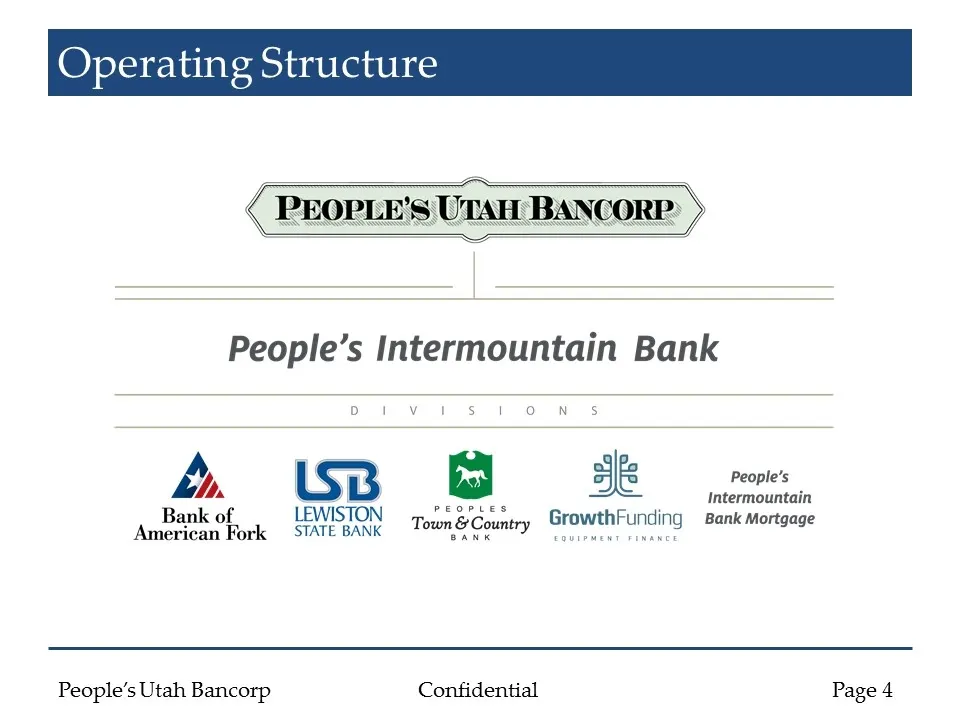
Operating Structure People’s Intermountain Bank Dives ton s yo People’s Ld Smee h ) Lo ambank of. LEWISTON Town & Country GrowthFunding Bank Mortgage People’s Utah Bancorp Confidential Page 4
Slide 5: Branch location map
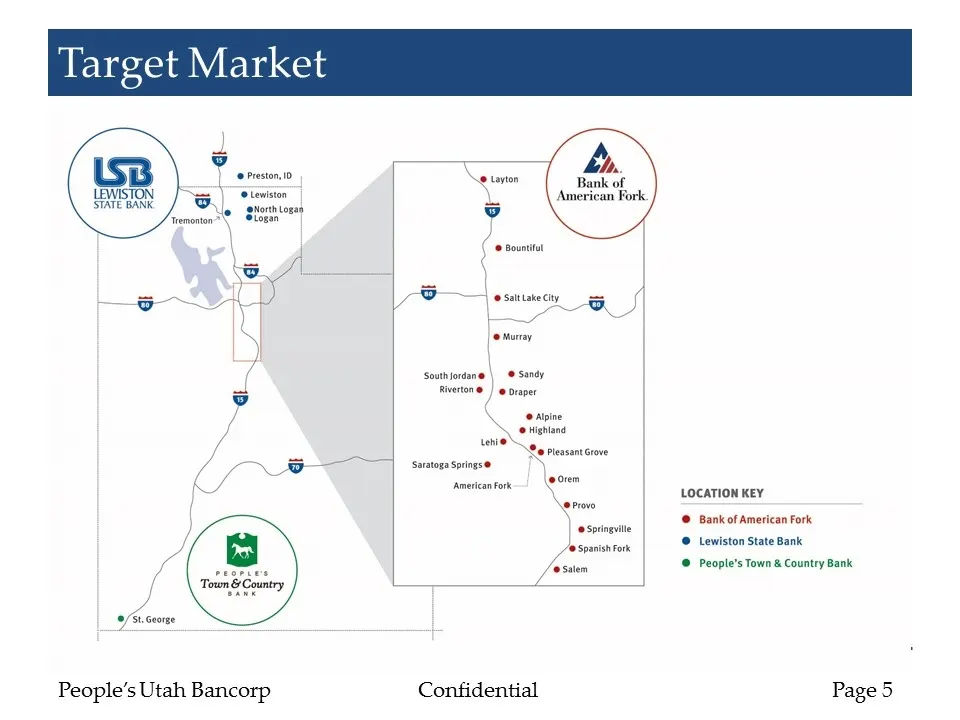
/St.ceorge pO esmistecn aera Bank of American Fork. je moray People’s Utah Bancorp Confidential LOCATION KEY © People’s Town & Country Bank Page 5
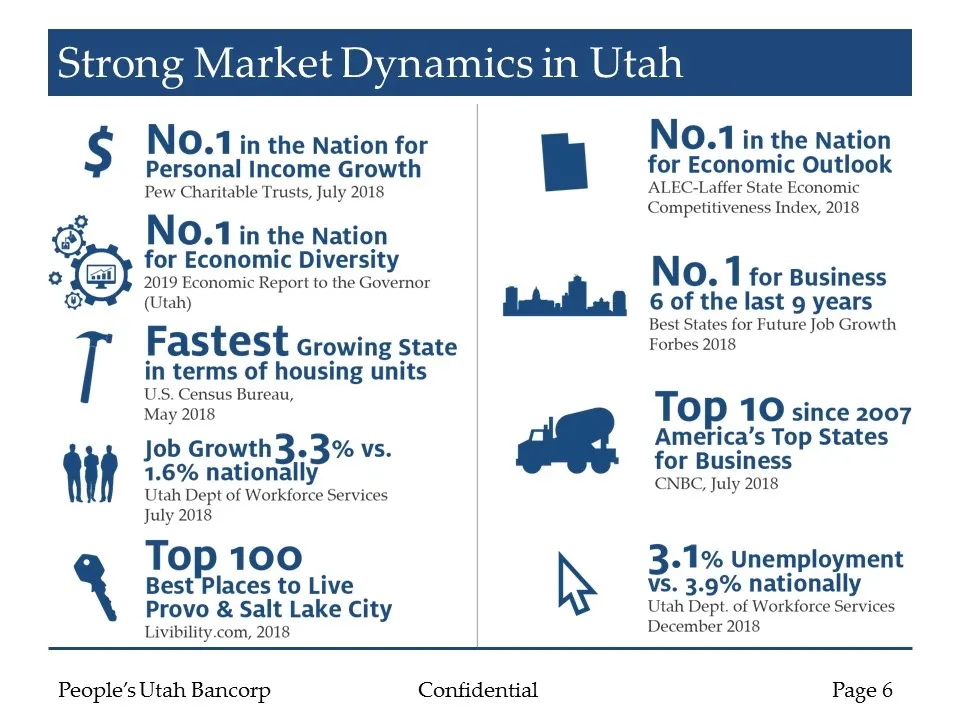
Slide 6: Strong Market Dynamics in Utah
Strong Market Dynamics in Utah
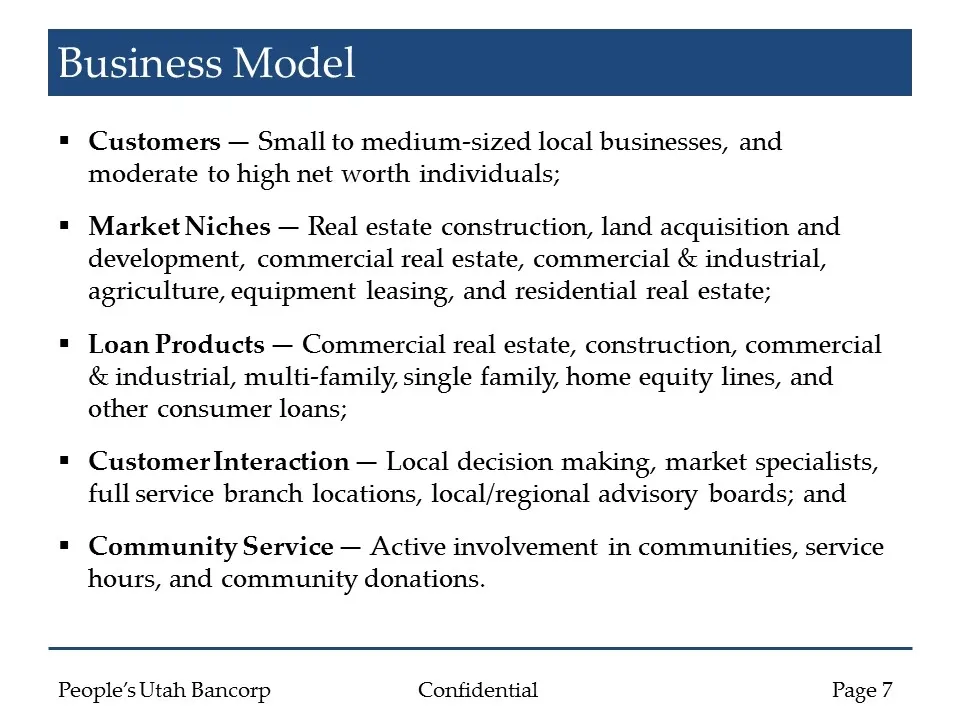
Slide 7: Business Model
Business Model Customers — Small to medium-sized local businesses, and moderate to high net worth individuals; Market Niches — Real estate construction, land acquisition and development, commercial real estate, commercial & industrial, agriculture, equipment leasing, and residential real estate; Loa
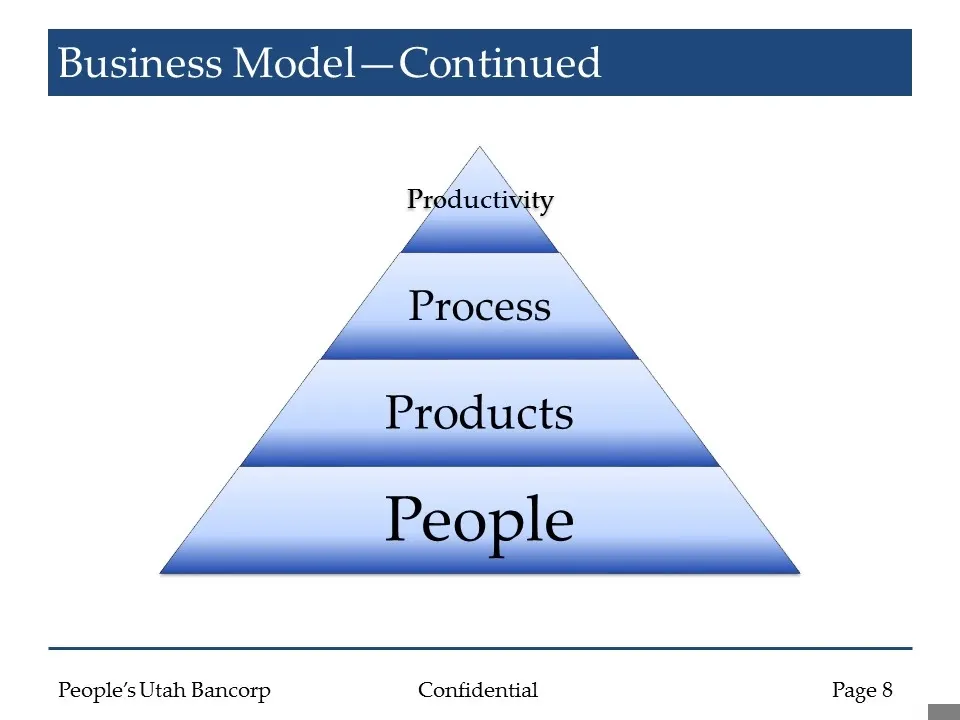
Slide 8: Business Model—Continued
Business Model—Continued Productivity Process Products People
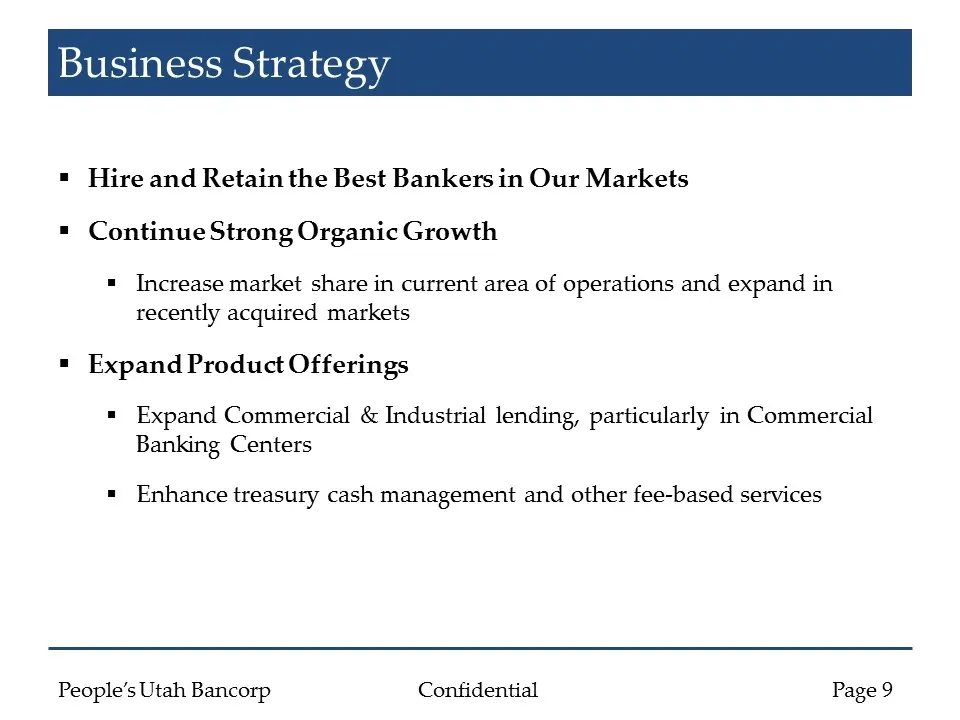
Slide 9: Business Strategy
Business Strategy Hire and Retain the Best Bankers in Our Markets Continue Strong Organic Growth Increase market share in current area of operations and expand in recently acquired markets Expand Product Offerings Expand Commercial & Industrial lending, particularly in Commercial Banking Centers Enh
Slide 10: Business Strategy—continued
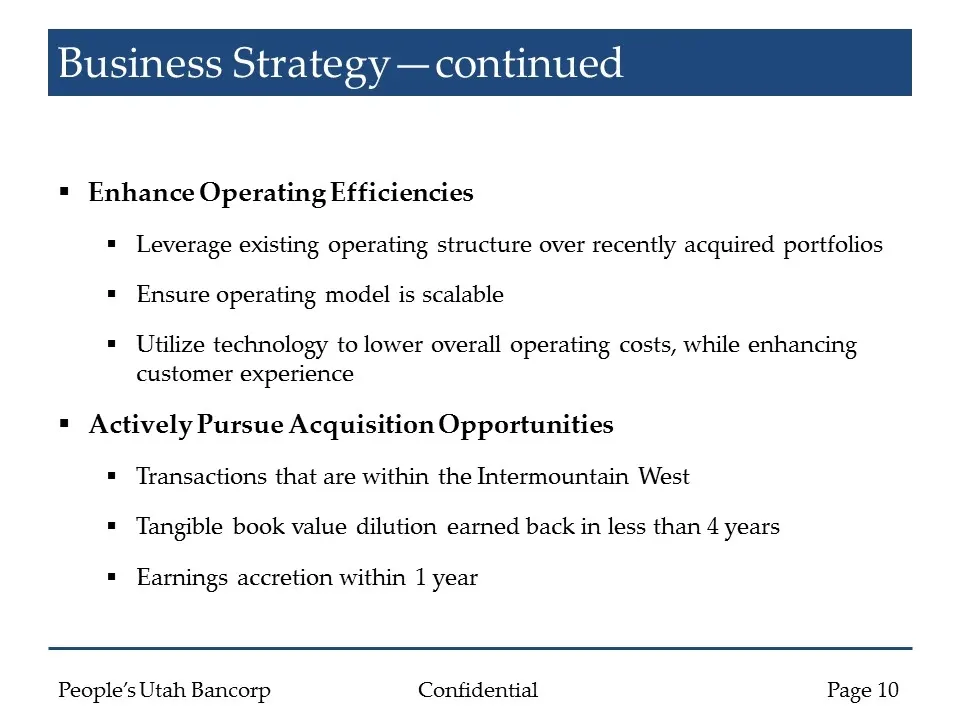
Business Strategy—continued Enhance Operating Efficiencies Leverage existing operating structure over recently acquired portfolios Ensure operating model is scalable Utilize technology to lower overall operating costs, while enhancing customer experience Actively Pursue Acquisition Opportunities Tra
Slide 11: Deposit Market Share in Utah
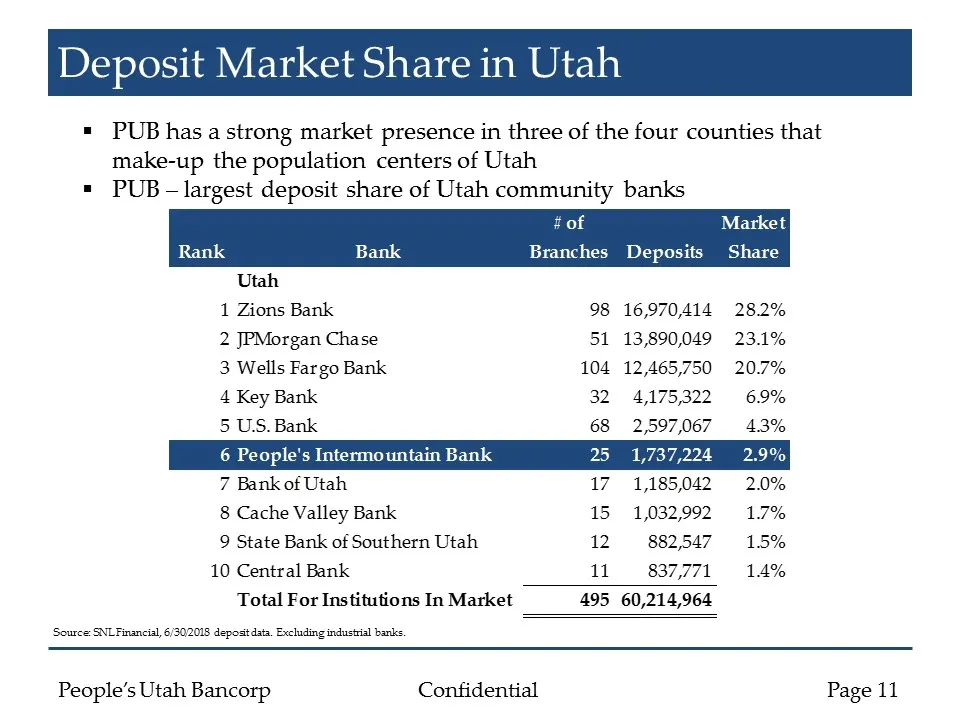
Deposit Market Share in Utah PUB has a strong market presence in three of the four counties that make-up the population centers of Utah PUB – largest deposit share of Utah community banks Source: SNL Financial, 6/30/2018 deposit data. Excluding industrial banks.
Slide 12: Deposit Market Share in Utah
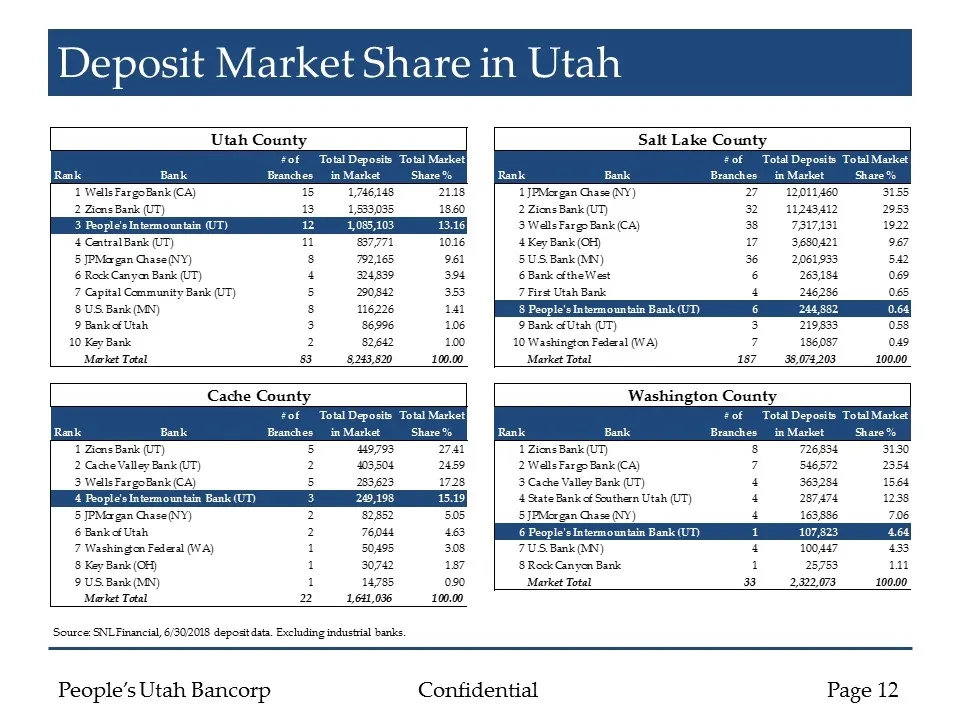
Deposit Market Share in Utah Source: SNL Financial, 6/30/2018 deposit data. Excluding industrial banks.
Slide 13: Loan Growth Trend & Composition
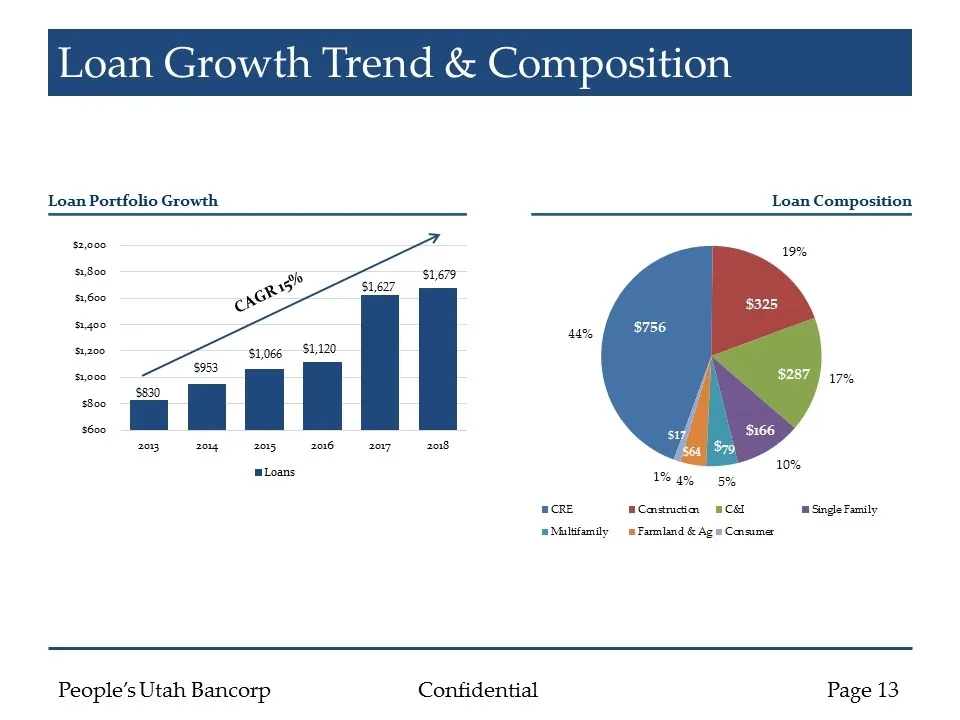
Loan Growth Trend & Composition Loan Portfolio Growth $830 $953 $1,066 $1,120 $1,627 CAGR 15% Loan Composition $1,679
Slide 14: Deposit Growth Trend & Composition
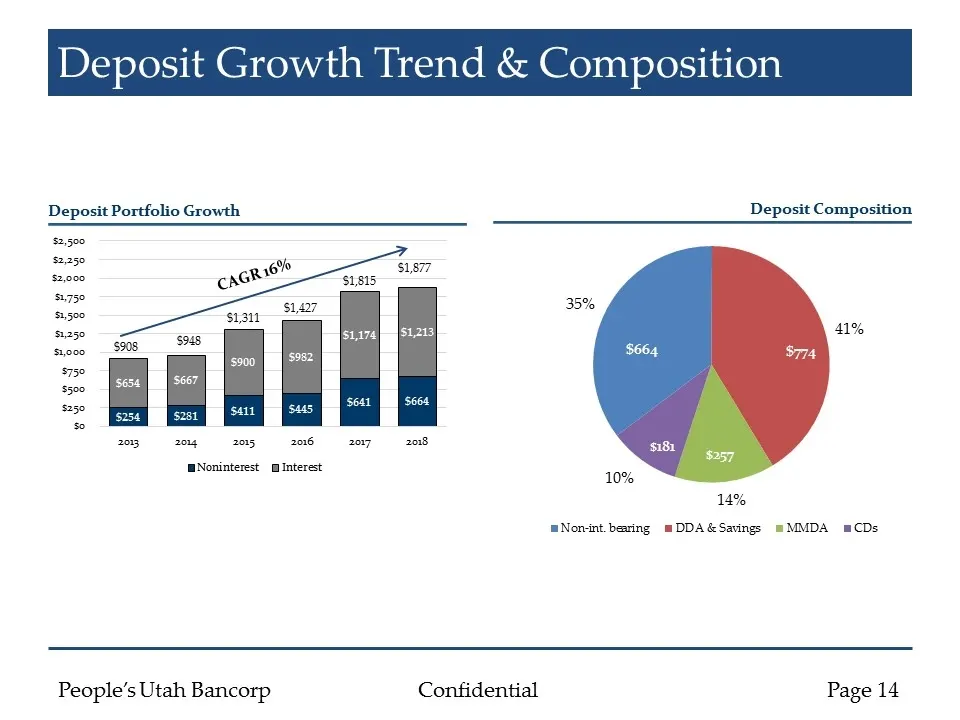
Deposit Growth Trend & Composition Deposit Portfolio Growth CAGR 16% $908 $948 $1,311 $1,427 $1,877 Deposit Composition $1,815
Slide 15: Asset Quality Trends
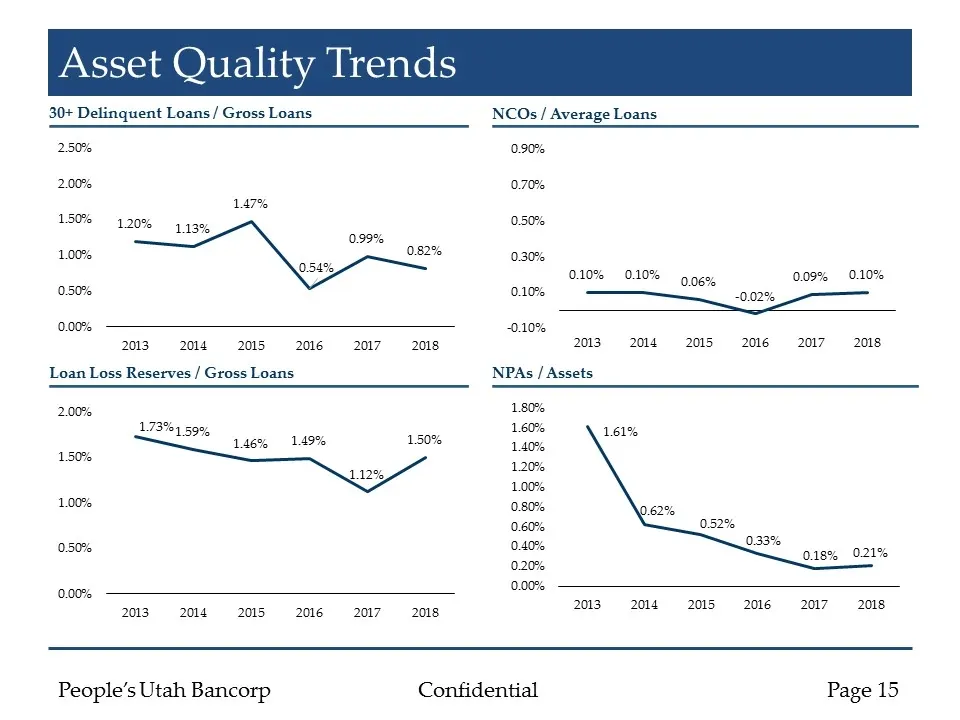
Asset Quality Trends 30+ Delinquent Loans / Gross Loans NCOs / Average Loans Loan Loss Reserves / Gross Loans NPAs / Assets
Slide 16: Financial Performance
Financial Performance
Slide 17: Company Snapshot
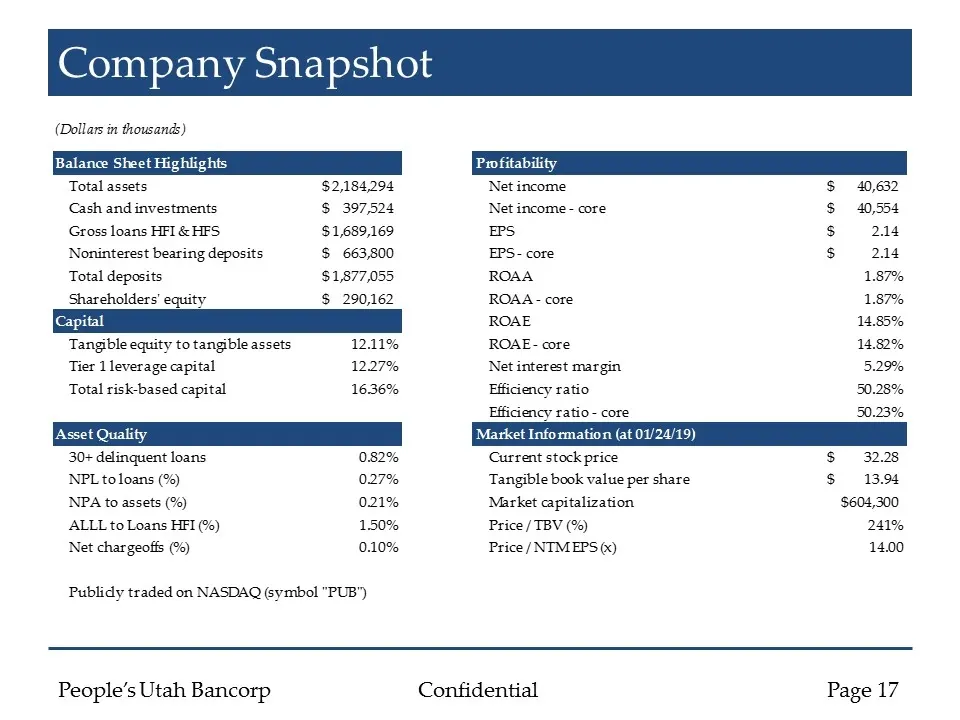
Company Snapshot (Dollars in thousands) alae Stet Fg Total assets $2,184,294 Net income $ 40,632 Cash and investments 7/524 Net income - core $40,554 Gross loans HEI & HES $1,689,169 S S$ 244 Noninterest bearing deposits 663, EPS- core S$ 244 Total deposits $187,055 ROAA 1.87% Shareholders’ equity $
Slide 18: Net Income ("Core")
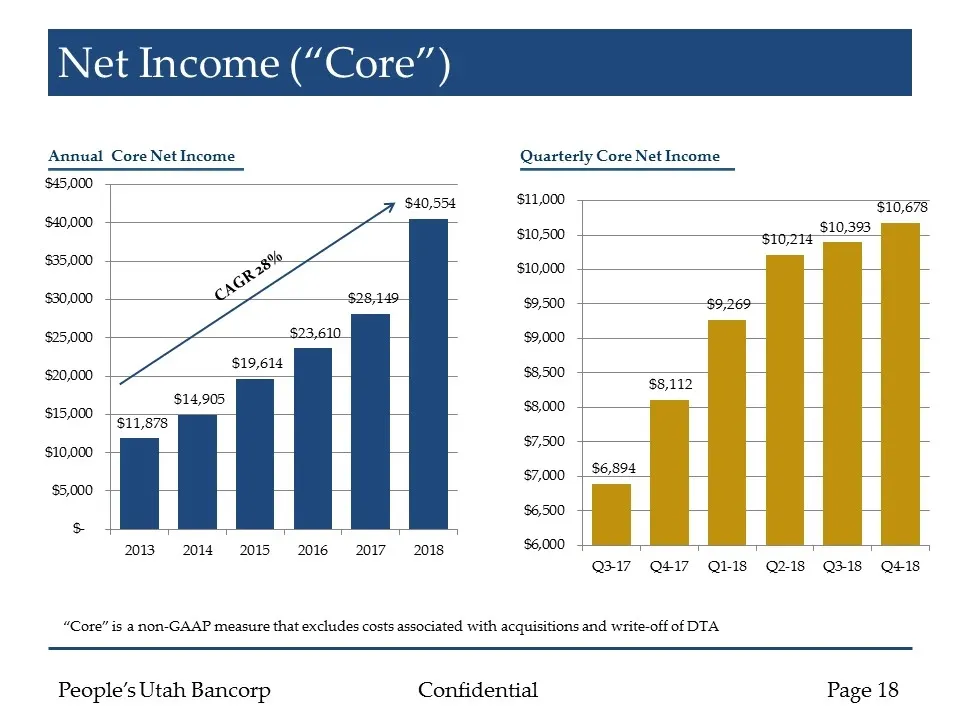
Net Income (“Core”) Annual Core Net Income Quarterly Core Net Income “Core” is a non-GAAP measure that excludes costs associated with acquisitions and write-off of DTA CAGR 28%
Slide 19: Diluted Earnings Per Share ("Core")
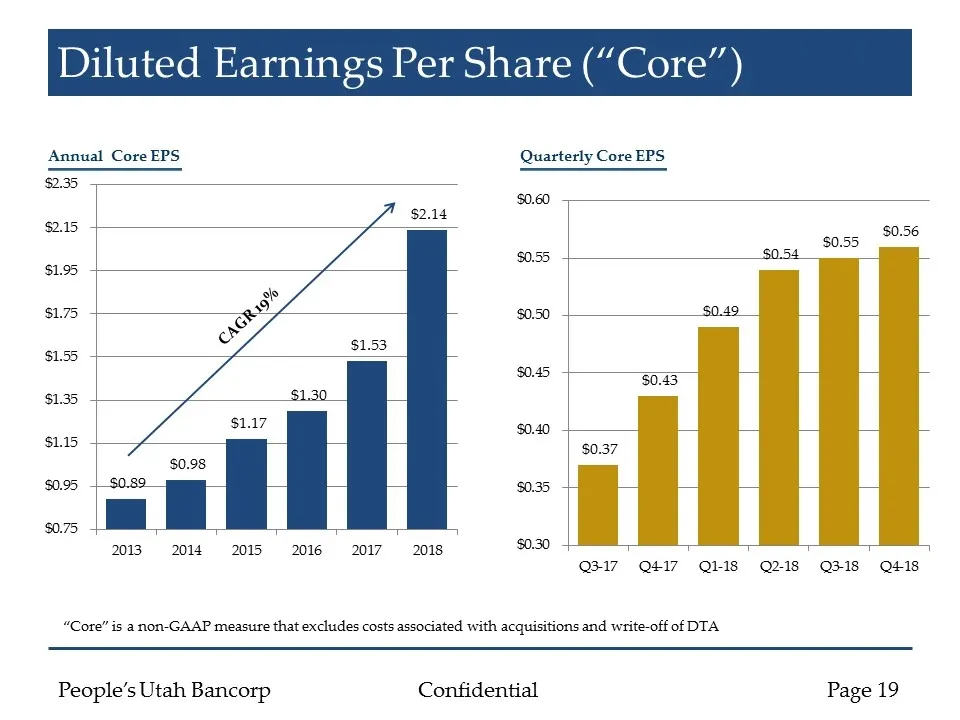
Diluted Earnings Per Share (“Core”) Annual Core EPS Quarterly Core EPS “Core” is a non-GAAP measure that excludes costs associated with acquisitions and write-off of DTA CAGR 19%
Slide 20: Dividends Per Share
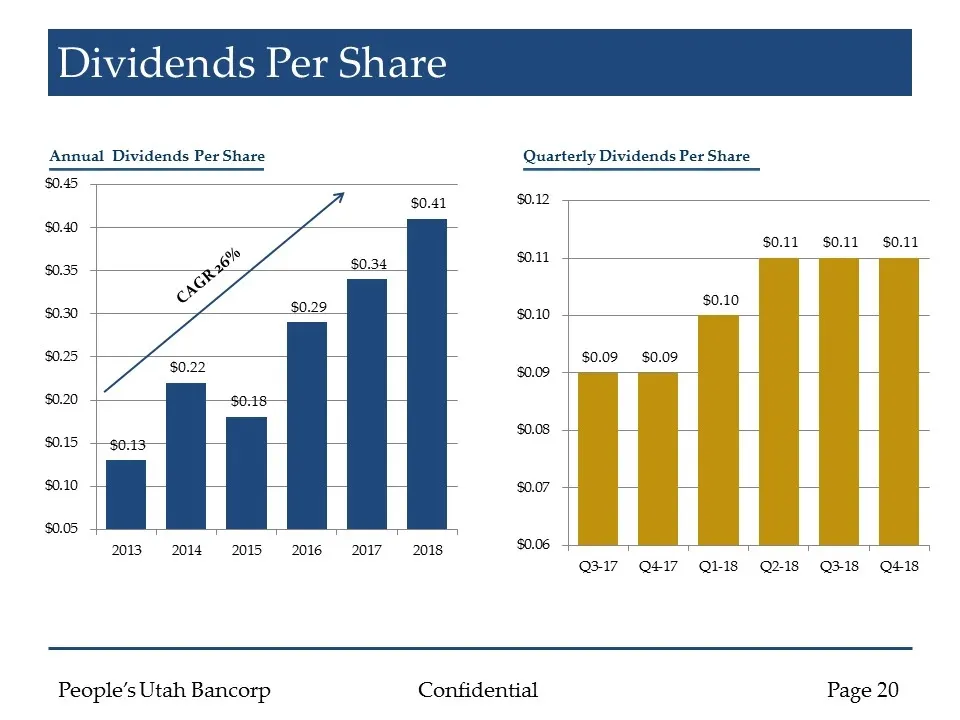
Dividends Per Share Annual Dividends Per Share Quarterly Dividends Per Share CAGR 26%
Slide 21: Net Interest Margin
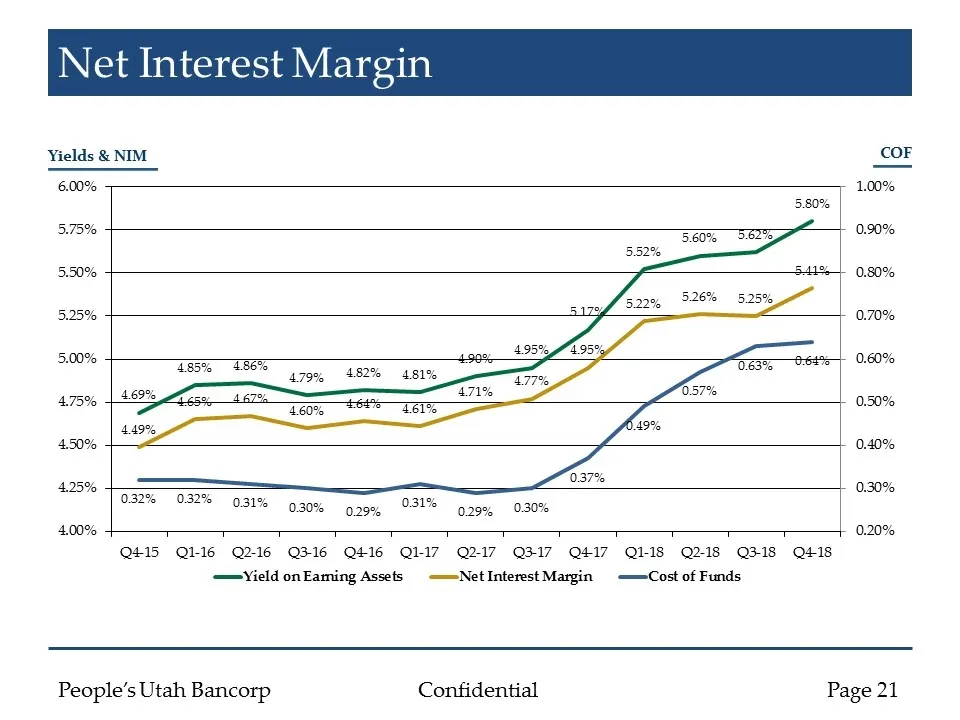
Net Interest Margin Yields & NIM COF
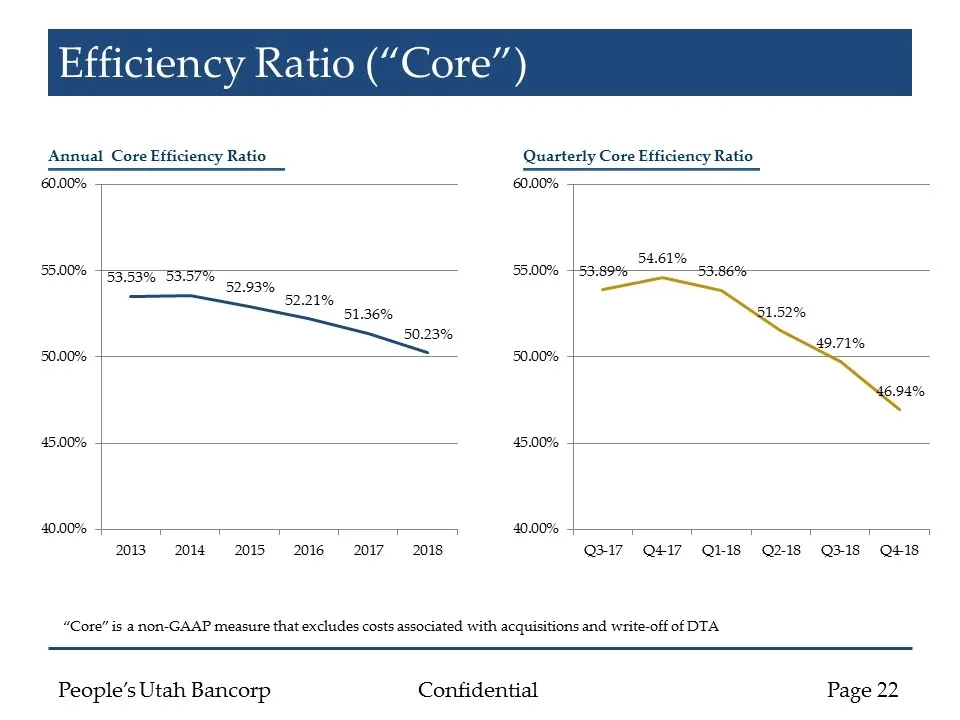
Slide 22: Efficiency Ratio ("Core")
Efficiency Ratio (“Core”) Annual Core Efficiency Ratio Quarterly Core Efficiency Ratio “Core” is a non-GAAP measure that excludes costs associated with acquisitions and write-off of DTA
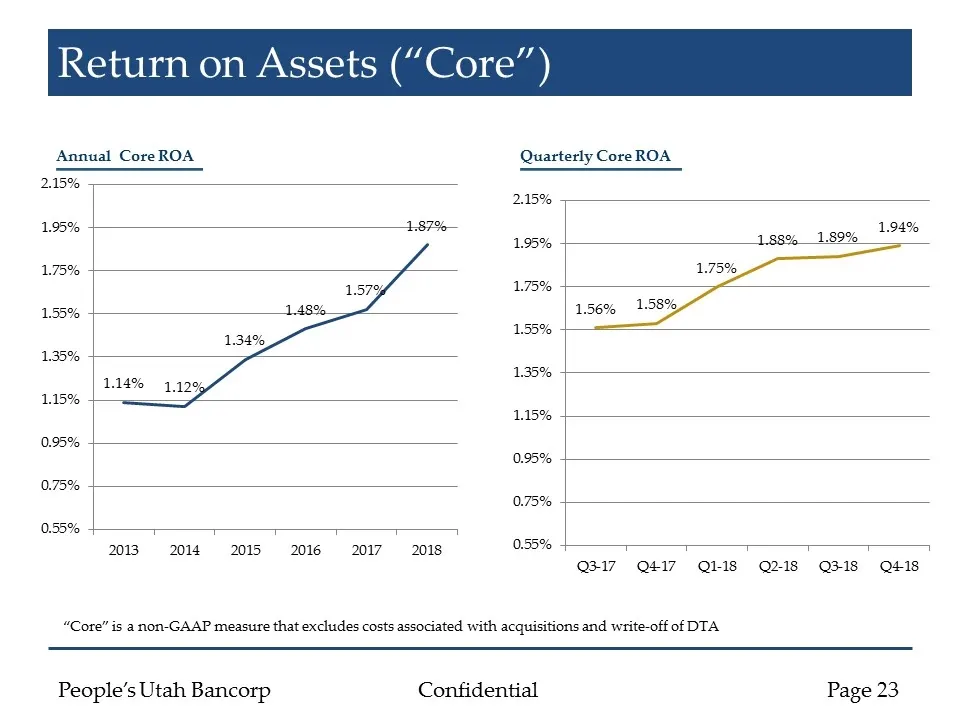
Slide 23: Return on Assets ("Core")
Return on Assets (“Core”) Annual Core ROA Quarterly Core ROA “Core” is a non-GAAP measure that excludes costs associated with acquisitions and write-off of DTA
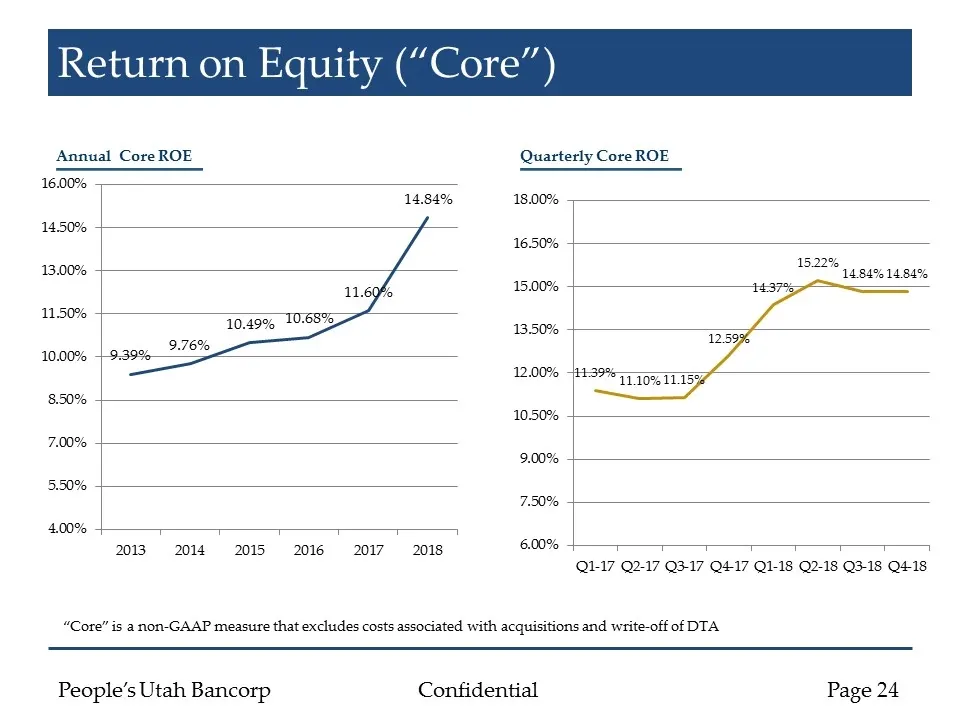
Slide 24: Return on Equity ("Core")
Return on Equity (“Core”) Annual Core ROE Quarterly Core ROE “Core” is a non-GAAP measure that excludes costs associated with acquisitions and write-off of DTA
Source: SEC EDGAR · 8-K filed Jan 30, 2019
More decks from Altabancorp
 Merger or Acquisition (May 2021)19 slides · May 19, 2021
 Q1 2021 Earnings Presentation48 slides · Apr 28, 2021
 Q4 2020 Earnings Presentation51 slides · Jan 27, 2021
 Q3 2020 Earnings Presentation52 slides · Oct 28, 2020
 Q2 2020 Earnings Presentation46 slides · Jul 30, 2020
 People's Utah Bancorp — Shareholder Meeting (May 2020)31 slides · May 28, 2020