Chittenden — Investor Presentation (January 2005)
37 slides from Chittenden's investor presentation, Jan 28, 2005

Slide 1: As of December 31, 2004
cuttrenpenill c As of December 31, 2004 reaching out with more
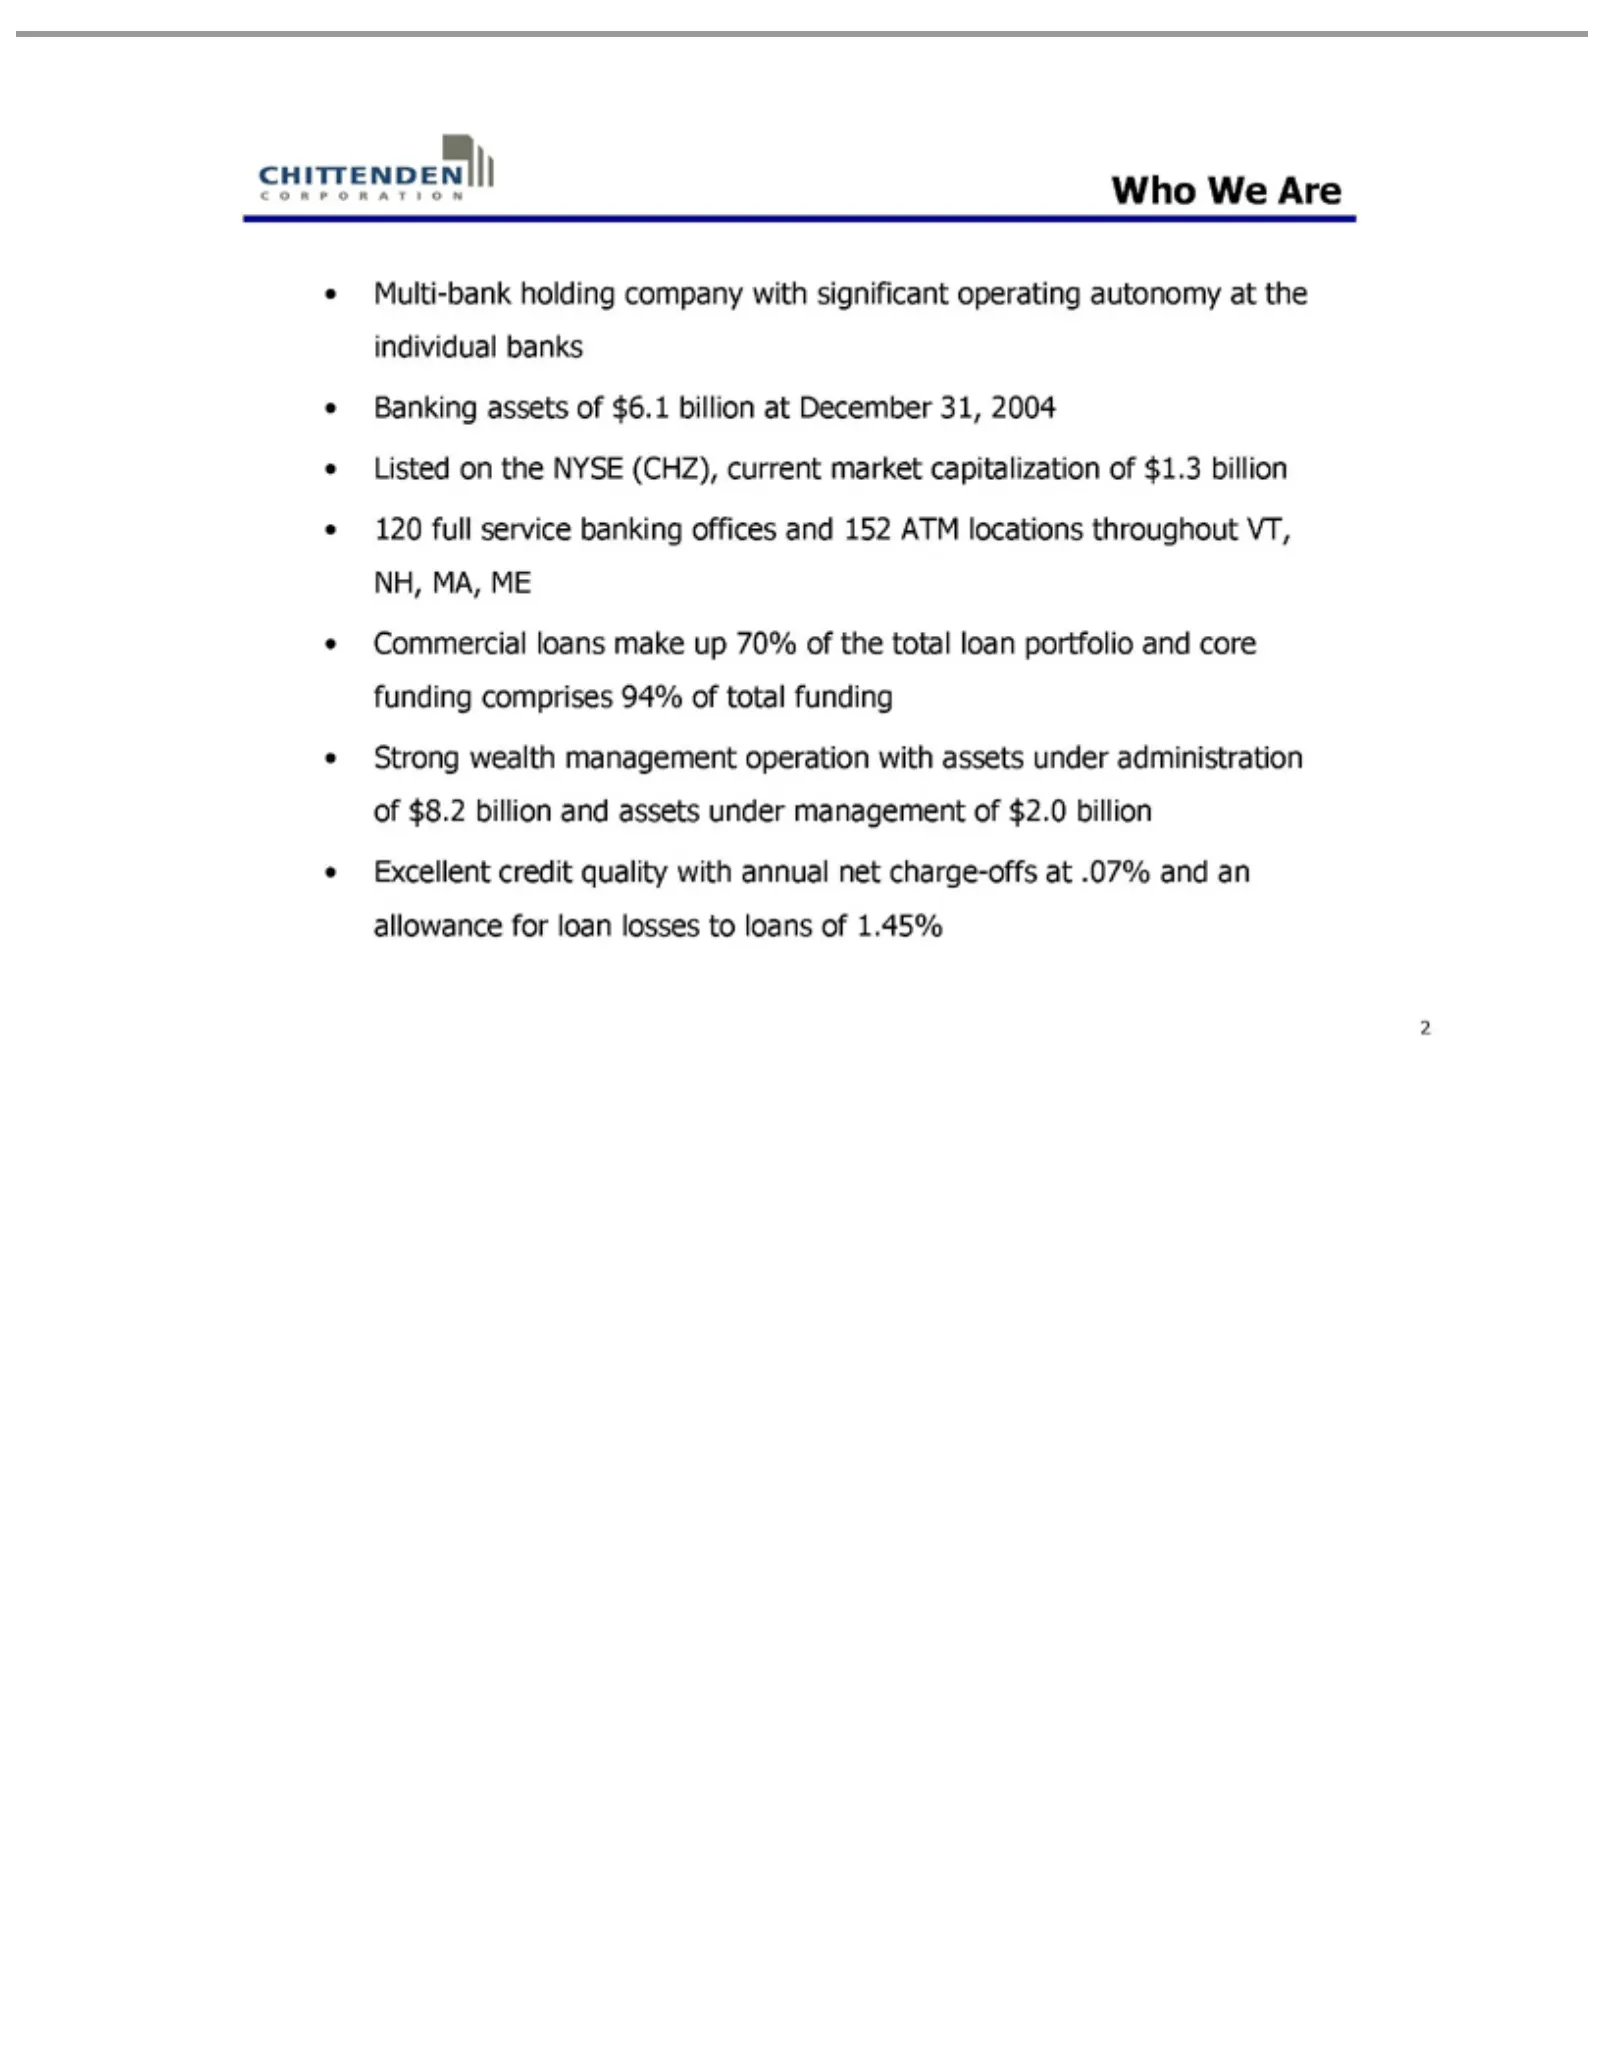
Slide 2: Who We Are
Who We Multi-bank capitalization Commercial assets 2 under Areholding management loans of $1.3 make company billion up of70% $2.0 120 withof full billion significant the service total Excellent loan banking operating portfolio credit offices autonomy quality andand core with 152 atfunding the ATM an
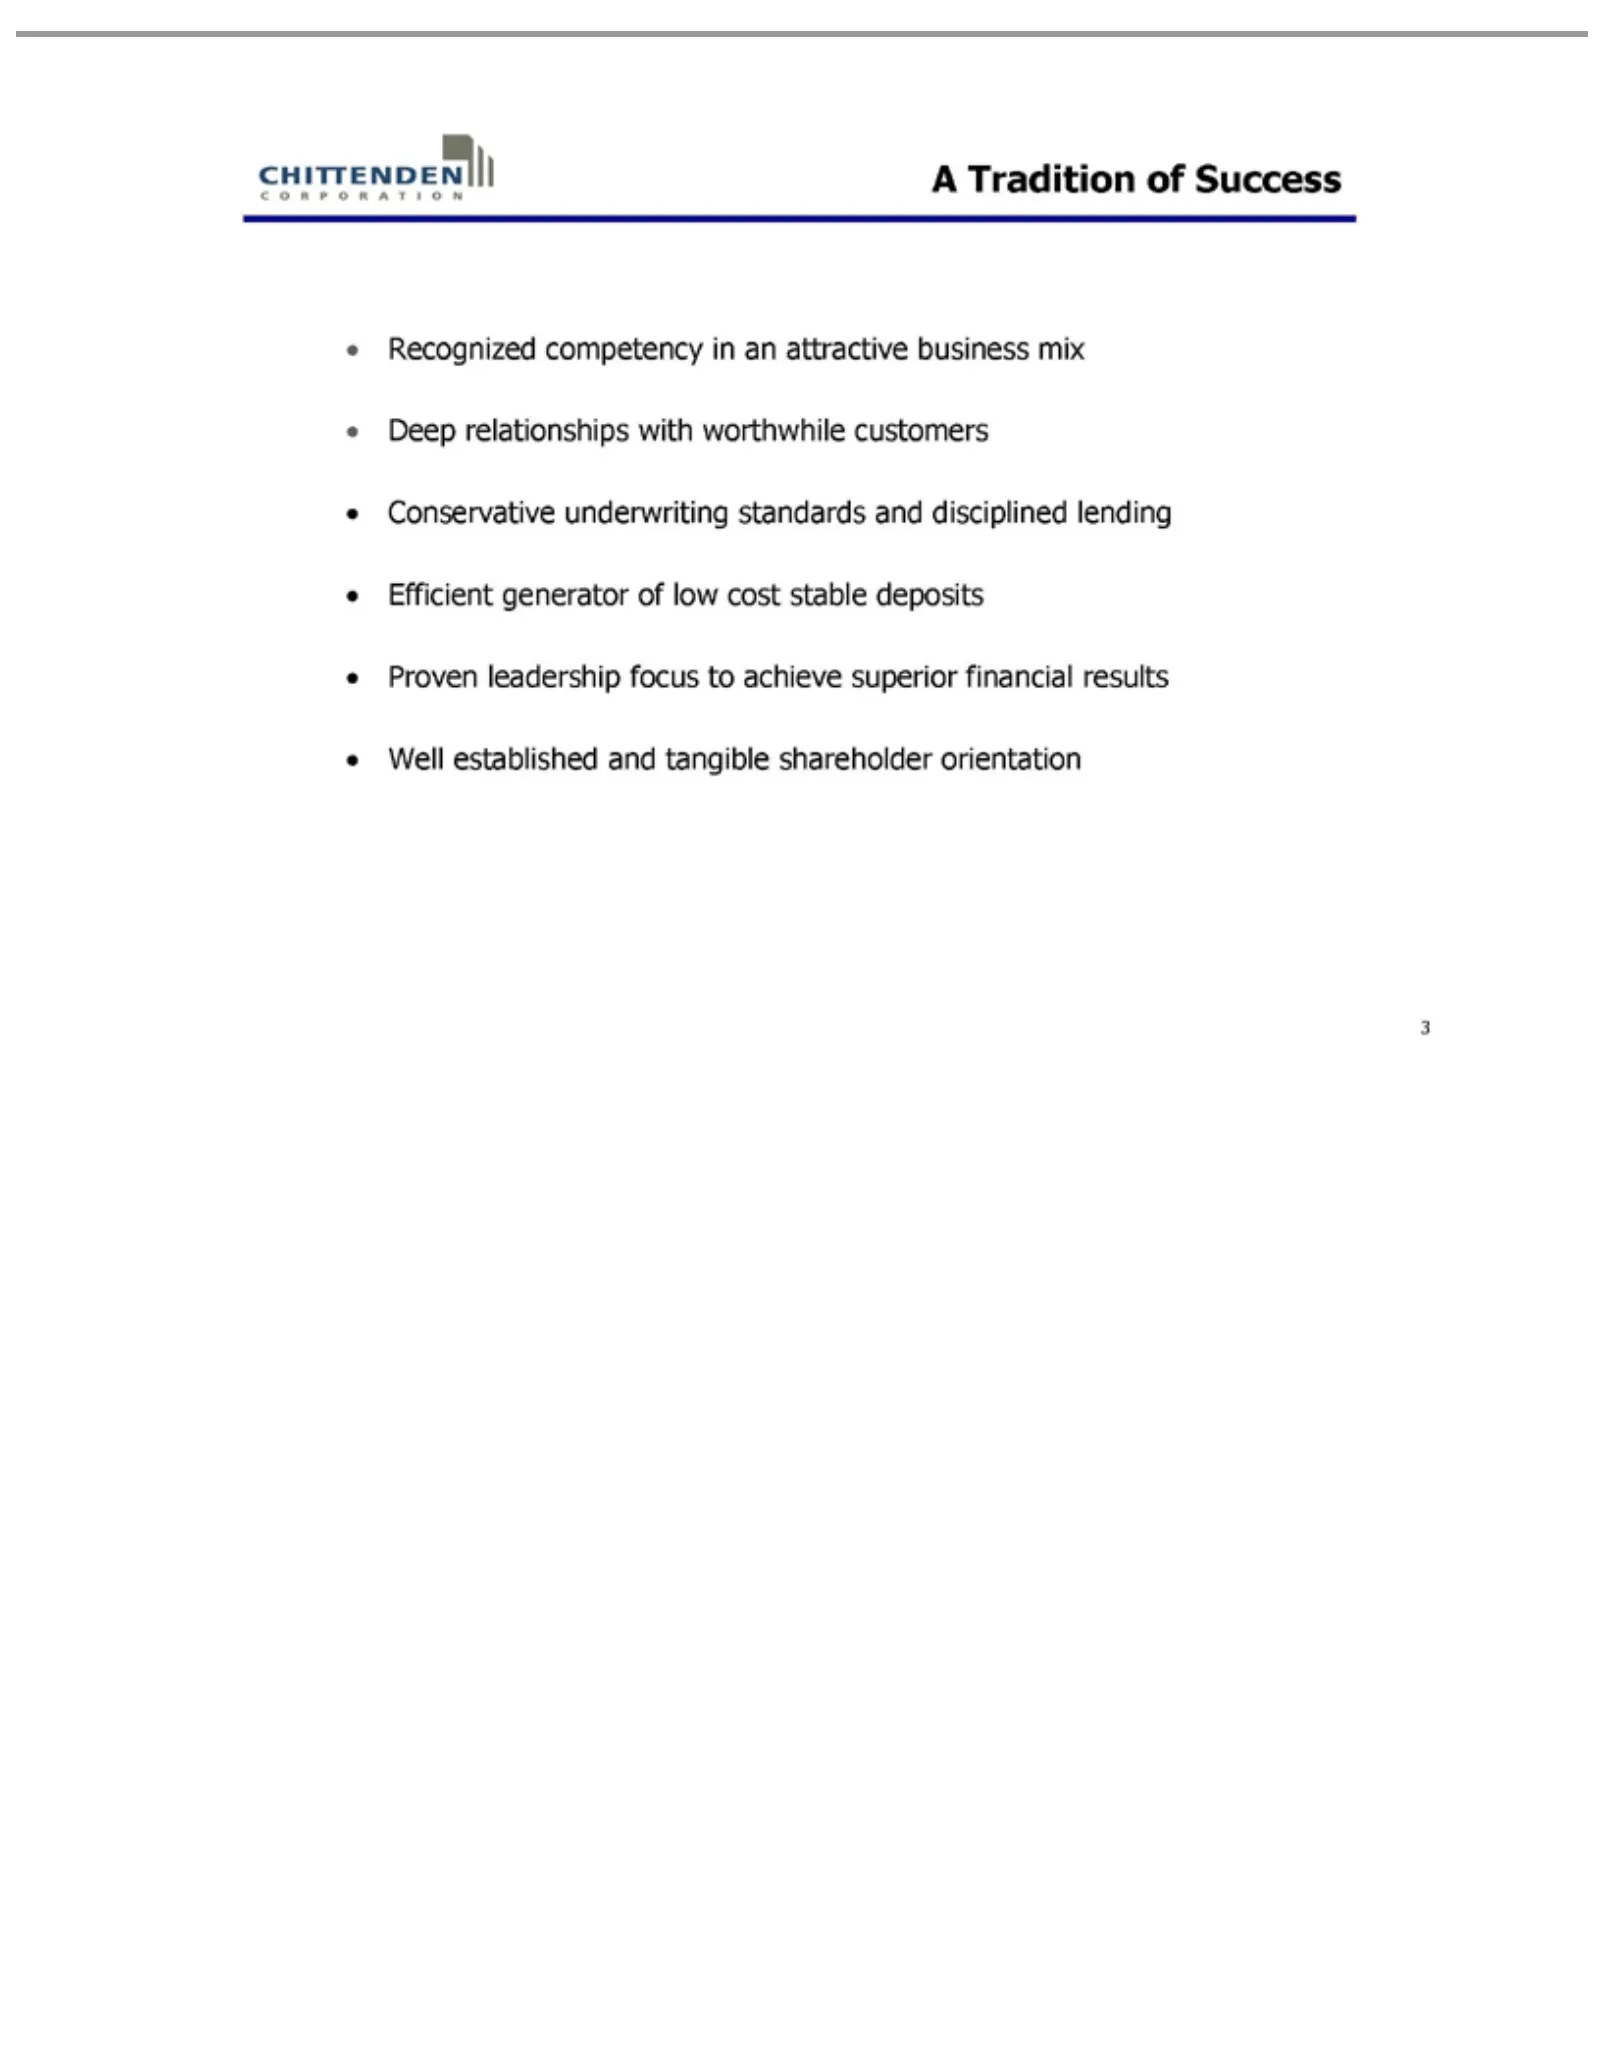
Slide 3: A Tradition of Proven Success
A Tradition Recognized deposits 3 Proven of competency Success leadership in focus an attractive to achieve business superior mixfinancial Deep relationships results Wellwith established worthwhile and customers tangible shareholder Conservative orientation underwriting standards and disciplined len
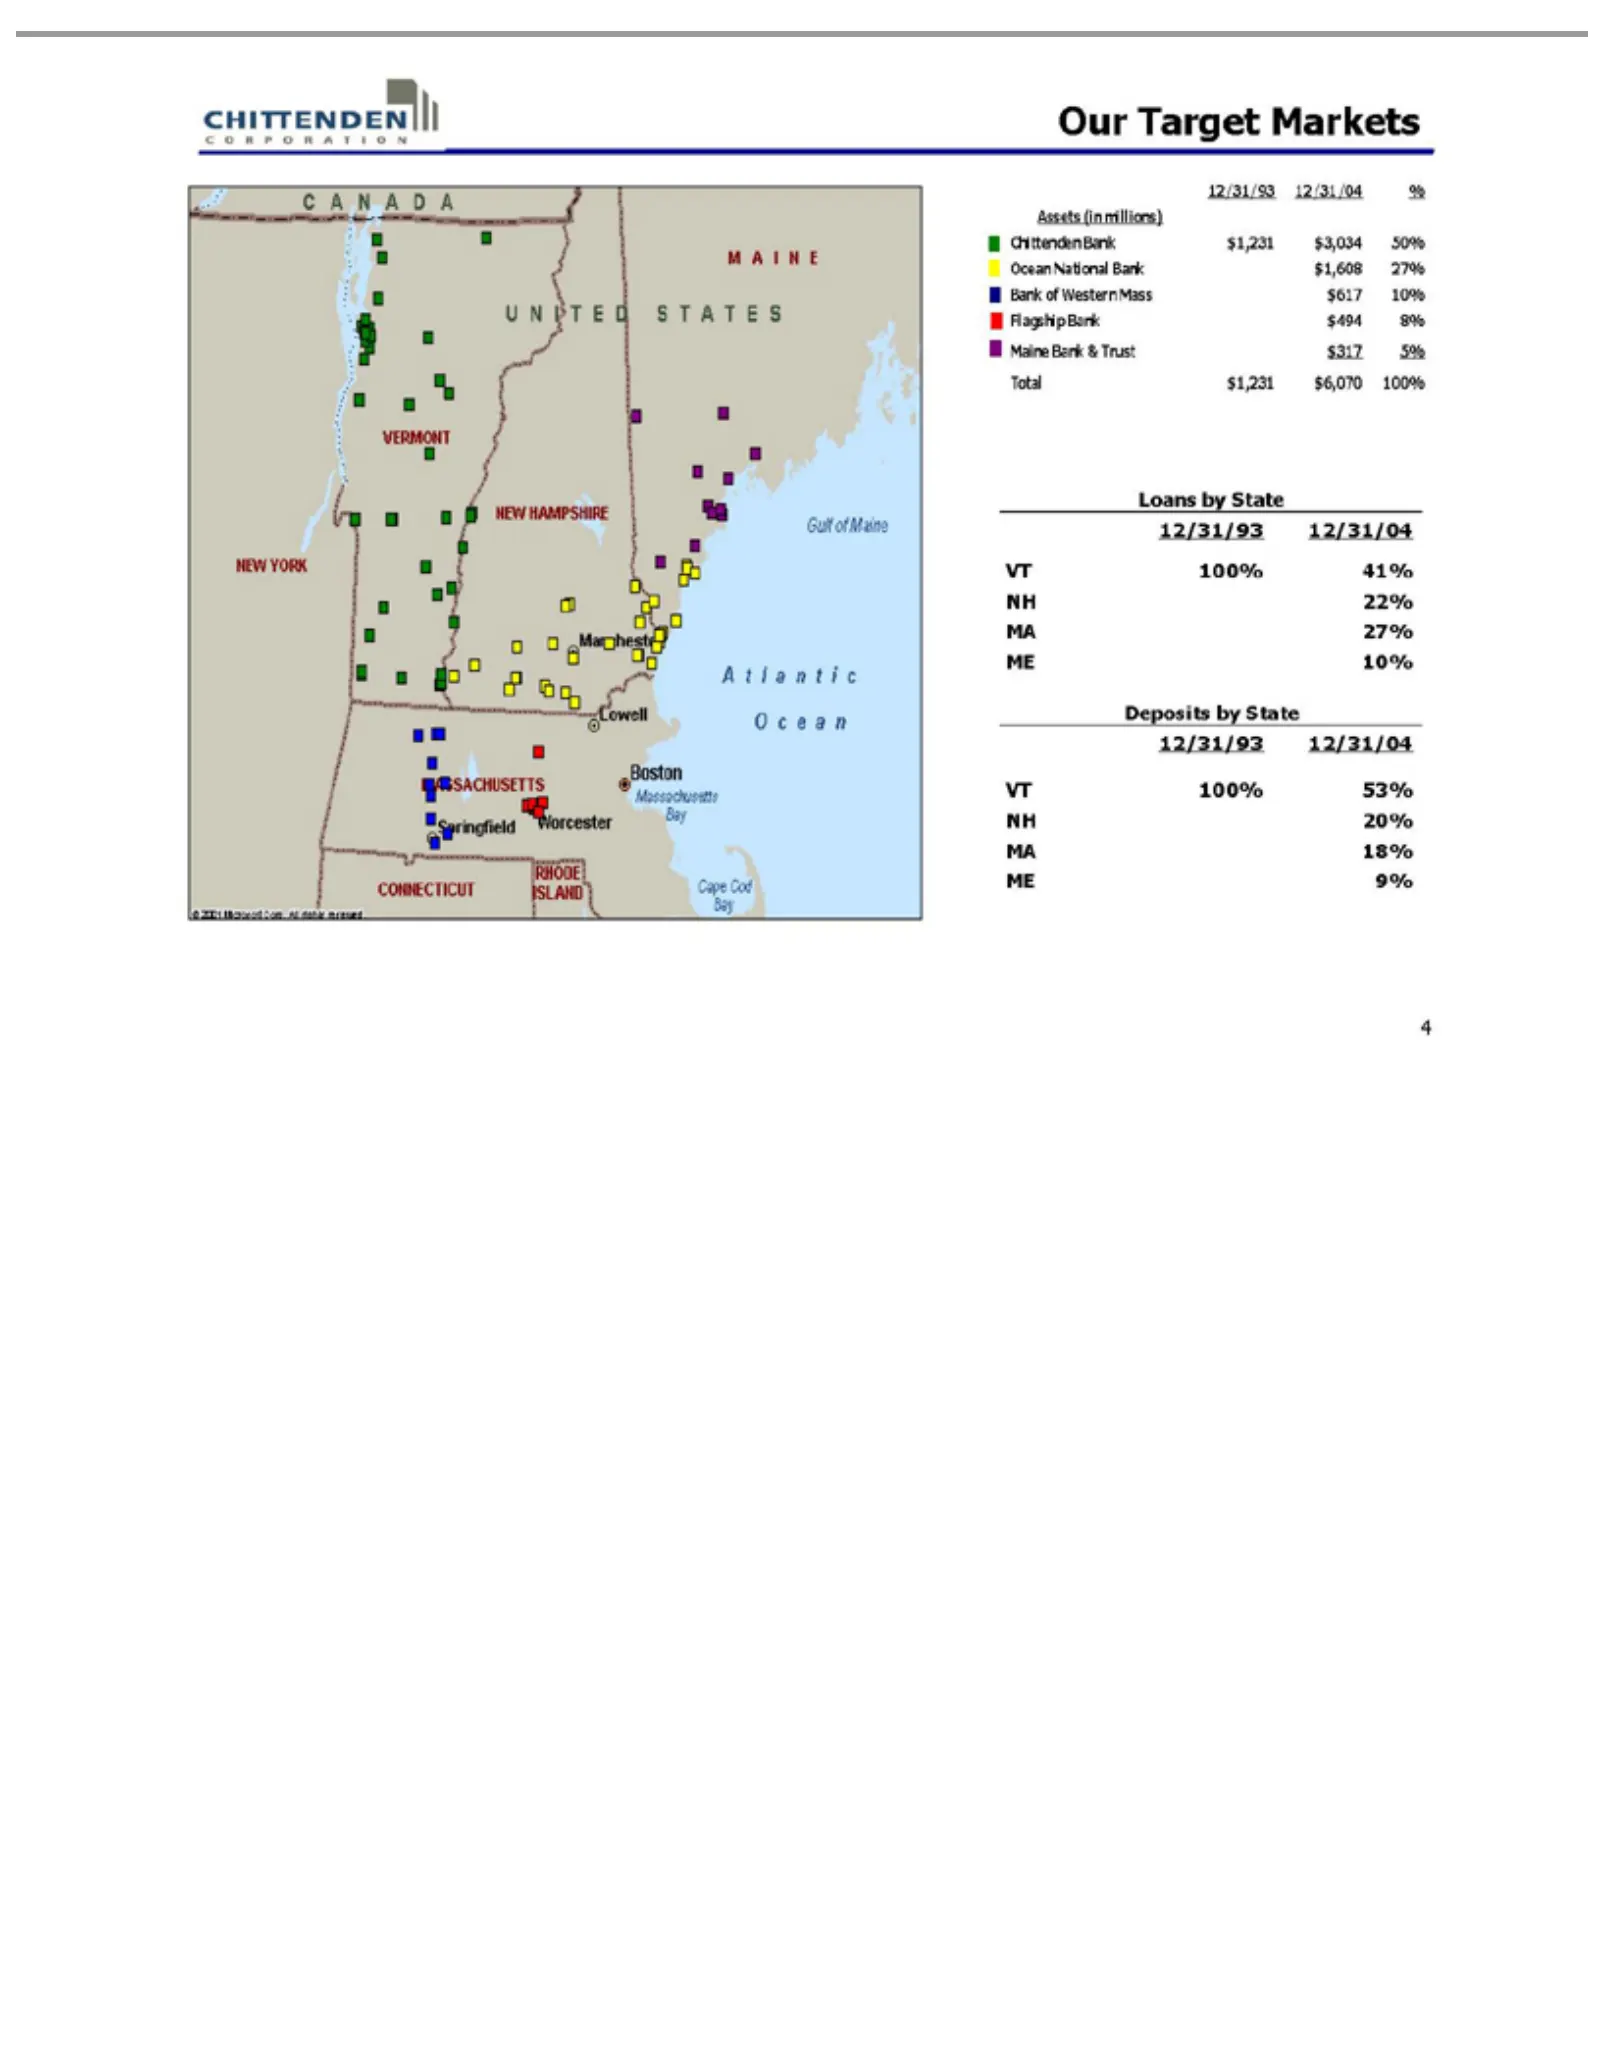
Slide 4: Our Chittenden Banks and Markets
Our100% Assets Chittenden Ocean Bank Flagship Maine Total Loans Deposits 12/31/93 VT NH MA ME 4 22% 20% 10% 9% Target 27% 18% $1,231 ofby National Bank (in Western Bank by 12/31/04 State 41% 53% millions) Markets Bank State &$6,070 $494 Trust Bank Mass $1,231 %100% 8% $317 $1,608 $617 $3,034 5%10% 2
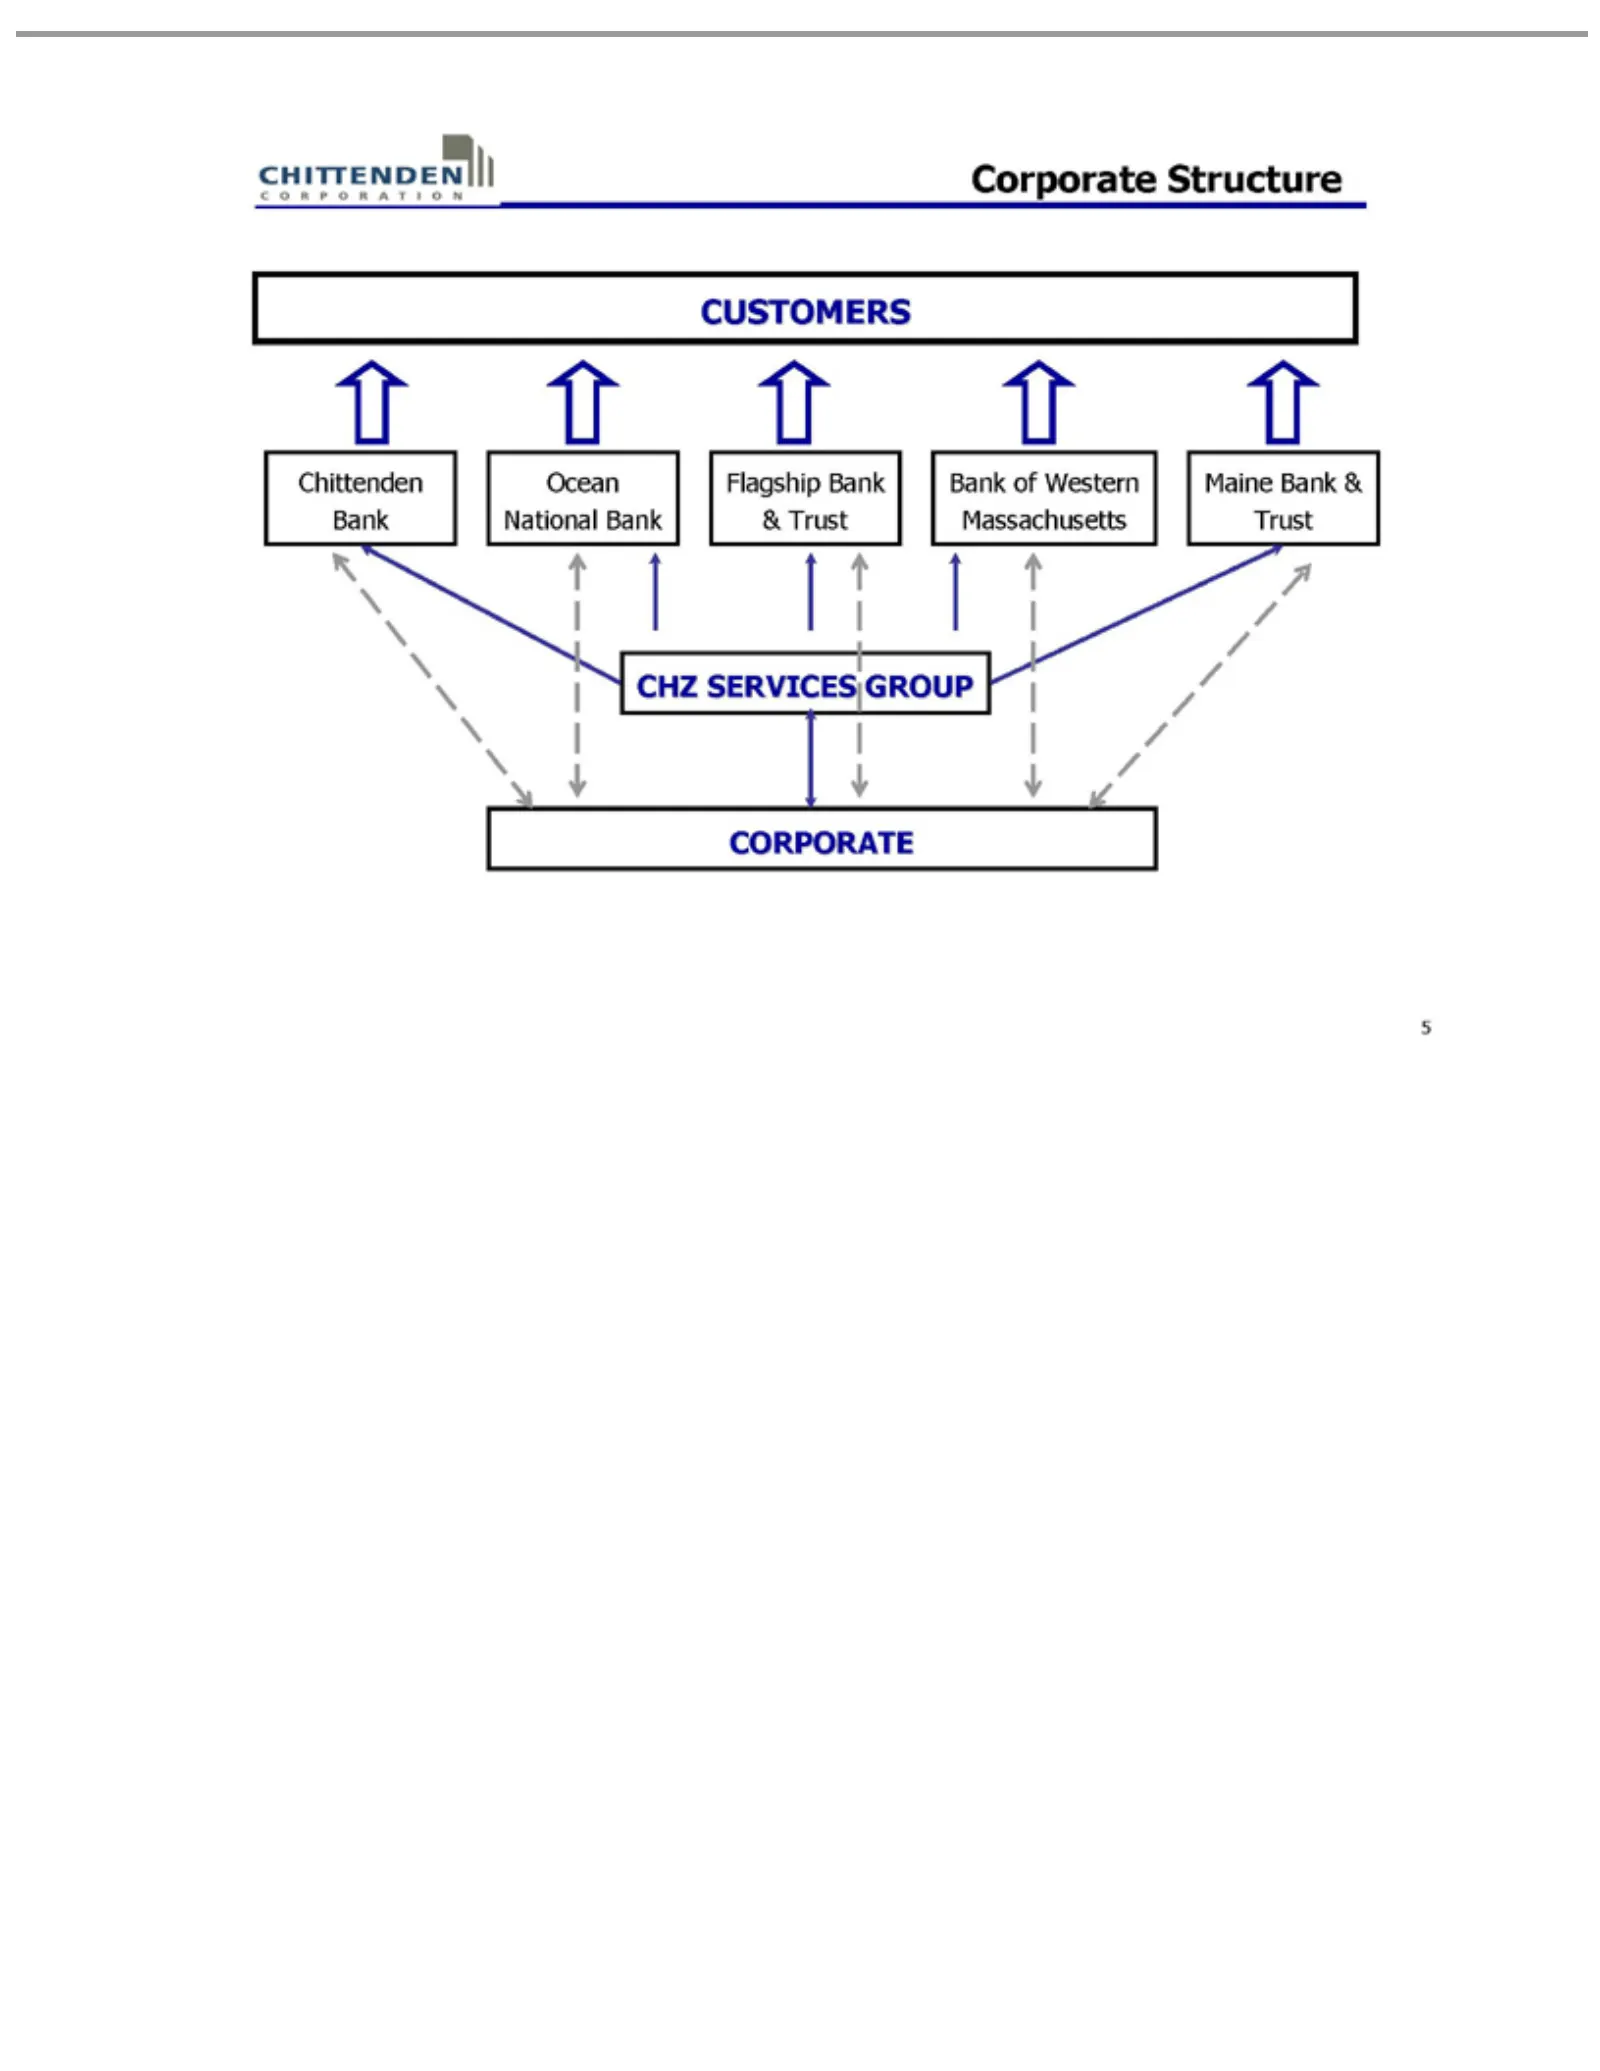
Slide 5: Corporate Structure
Corporate Chittenden CUSTOMERS Ocean Flagship Bank Maine CHZ 5 CORPORATE SERVICES ofNational Bank Western Bank Structure Bank && Trust Bank Massachusetts Trust GROUP
Slide 6: Our Target Markets: Vermont
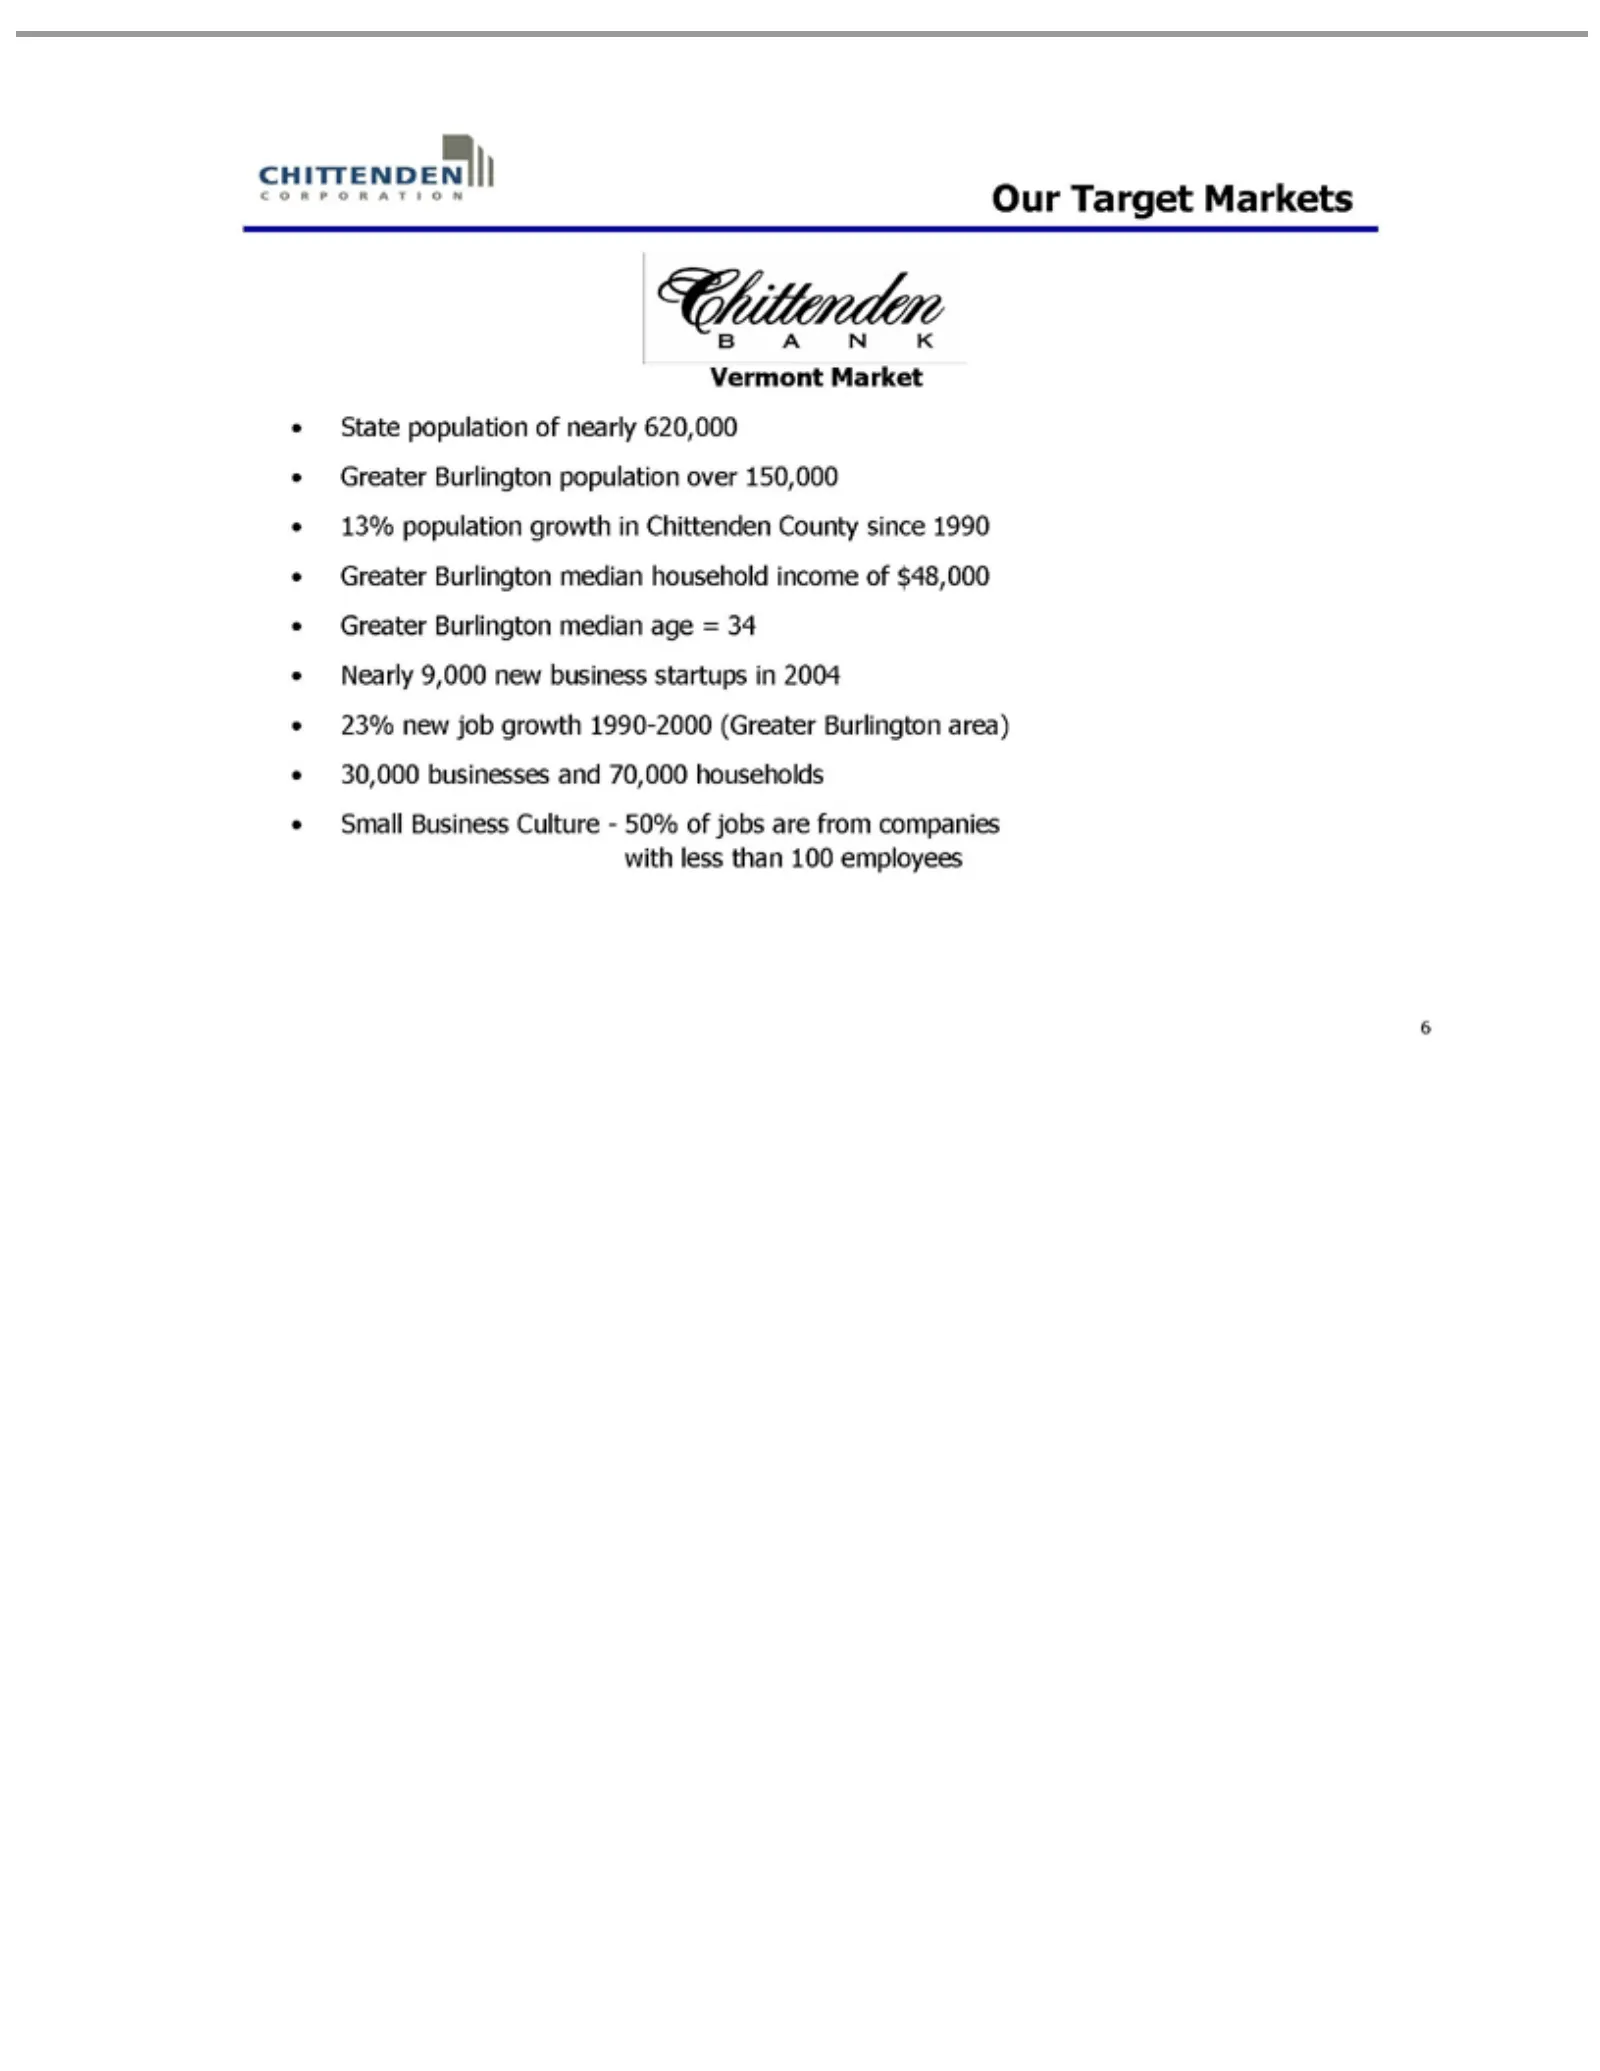
Our Target Vermont State Greater 13% 23% 6 population new population Burlington Market job Markets growth growth of population nearly 1990-2000 in 620,000 Chittenden over (Greater 150,000 County Burlington since 1990 area)Greater 30,000Burlington businesses median and 70,000 household households inc
Slide 7: Our Target Markets: Massachusetts
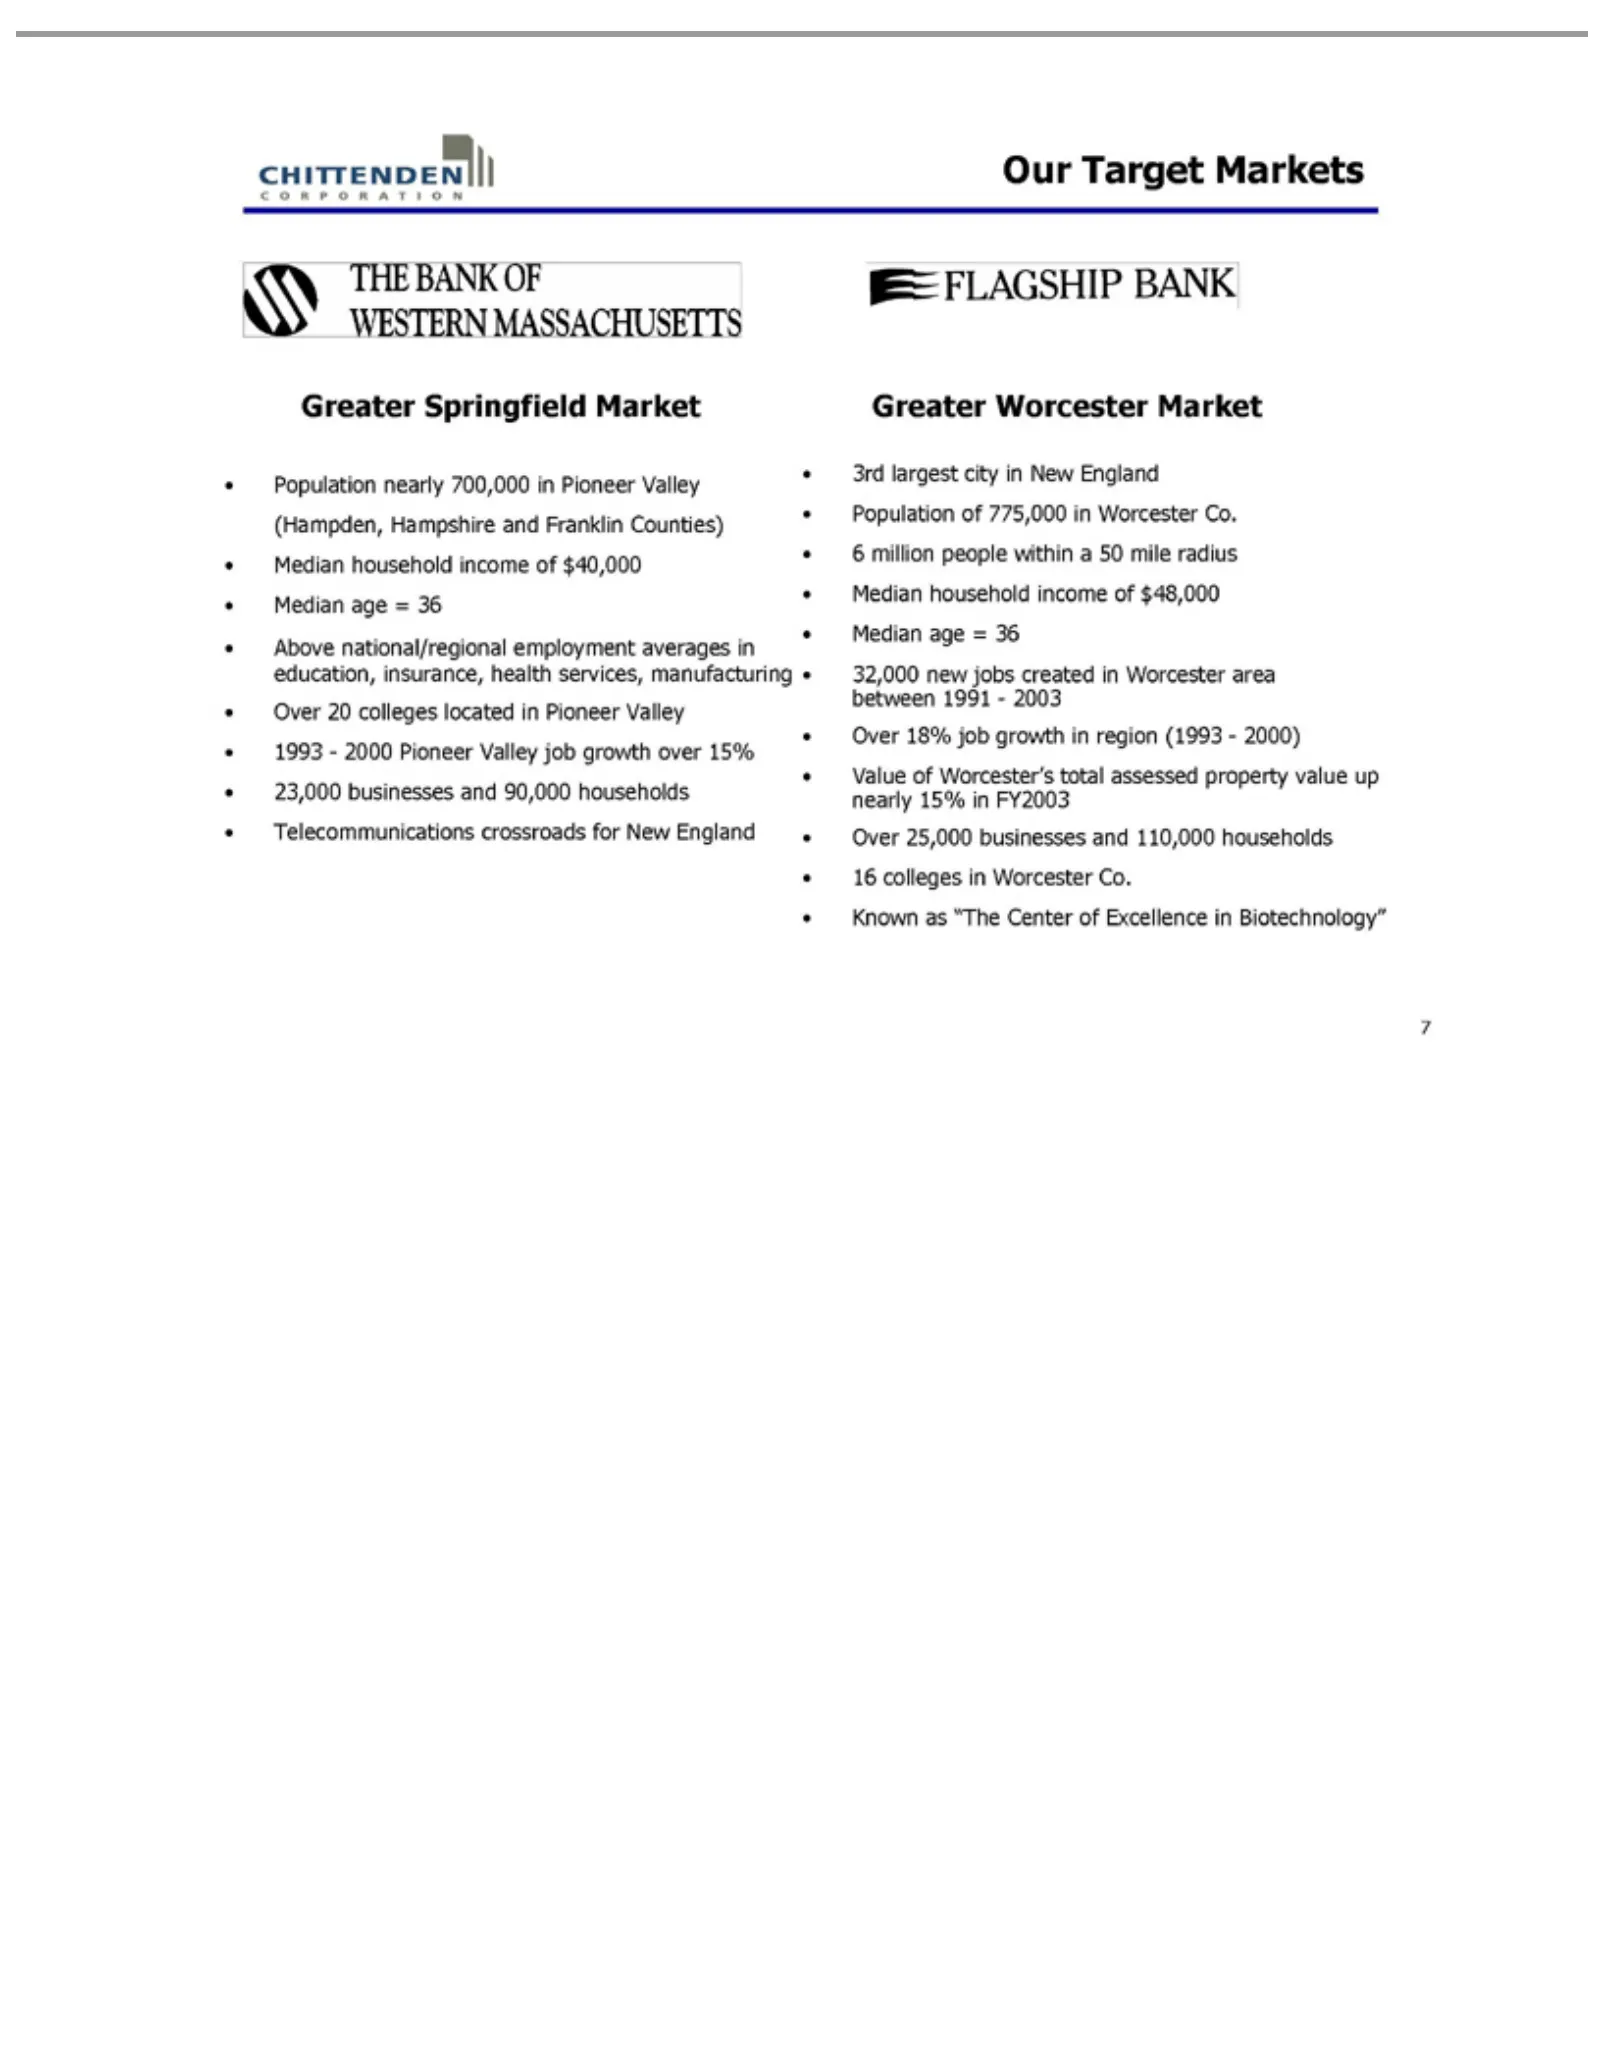
Ourlargest Population education, Telecommunications Greater 3rd Worcester Value Known 7 Target ofas Worcester Springfield Worcester’s “The area insurance, city Markets nearly between inCenter New 700,000 Market Market crossroads total health England of1991 Excellence assessed inservices, Pioneer - 2
Slide 8: Our Target Markets: Southern Maine and New Hampshire
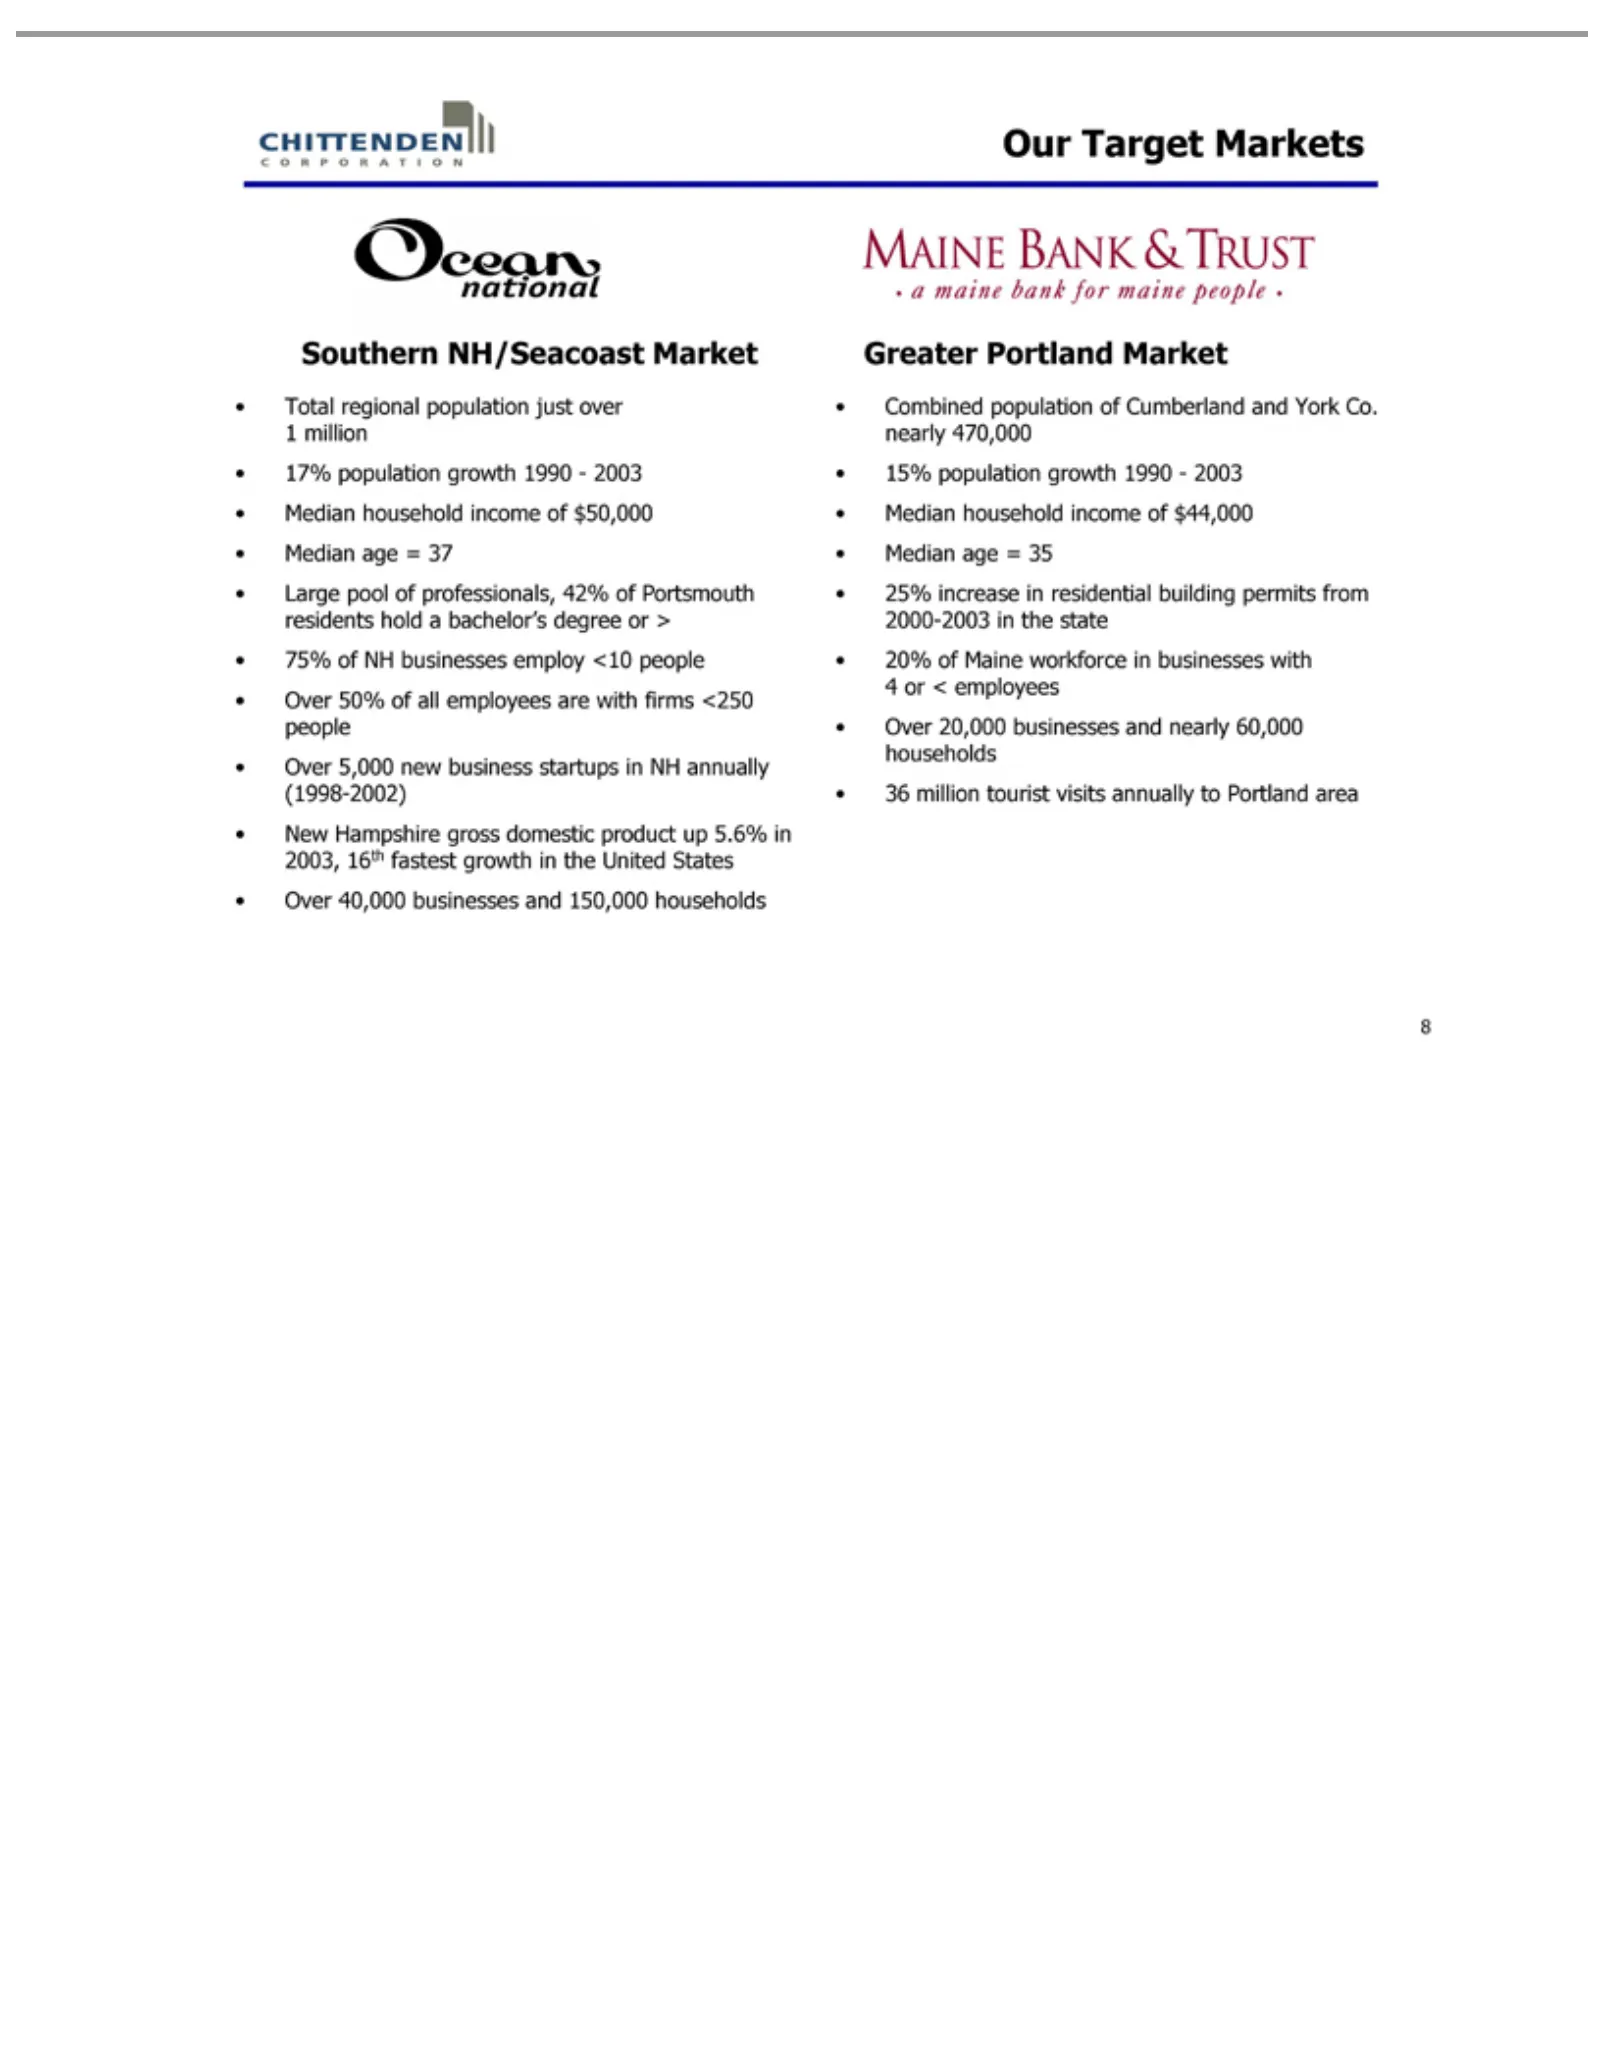
Our Target Southern Total Large new Greater Combined permits 8 area business regional pool Portland from NH/Seacoast population Markets of2000-2003 startups professionals, population Market in ofMarket NH in Cumberland just the 42% annually over state of1 20% Portsmouth million and (1998-2002) of Yo
Slide 9: Our Target Customers
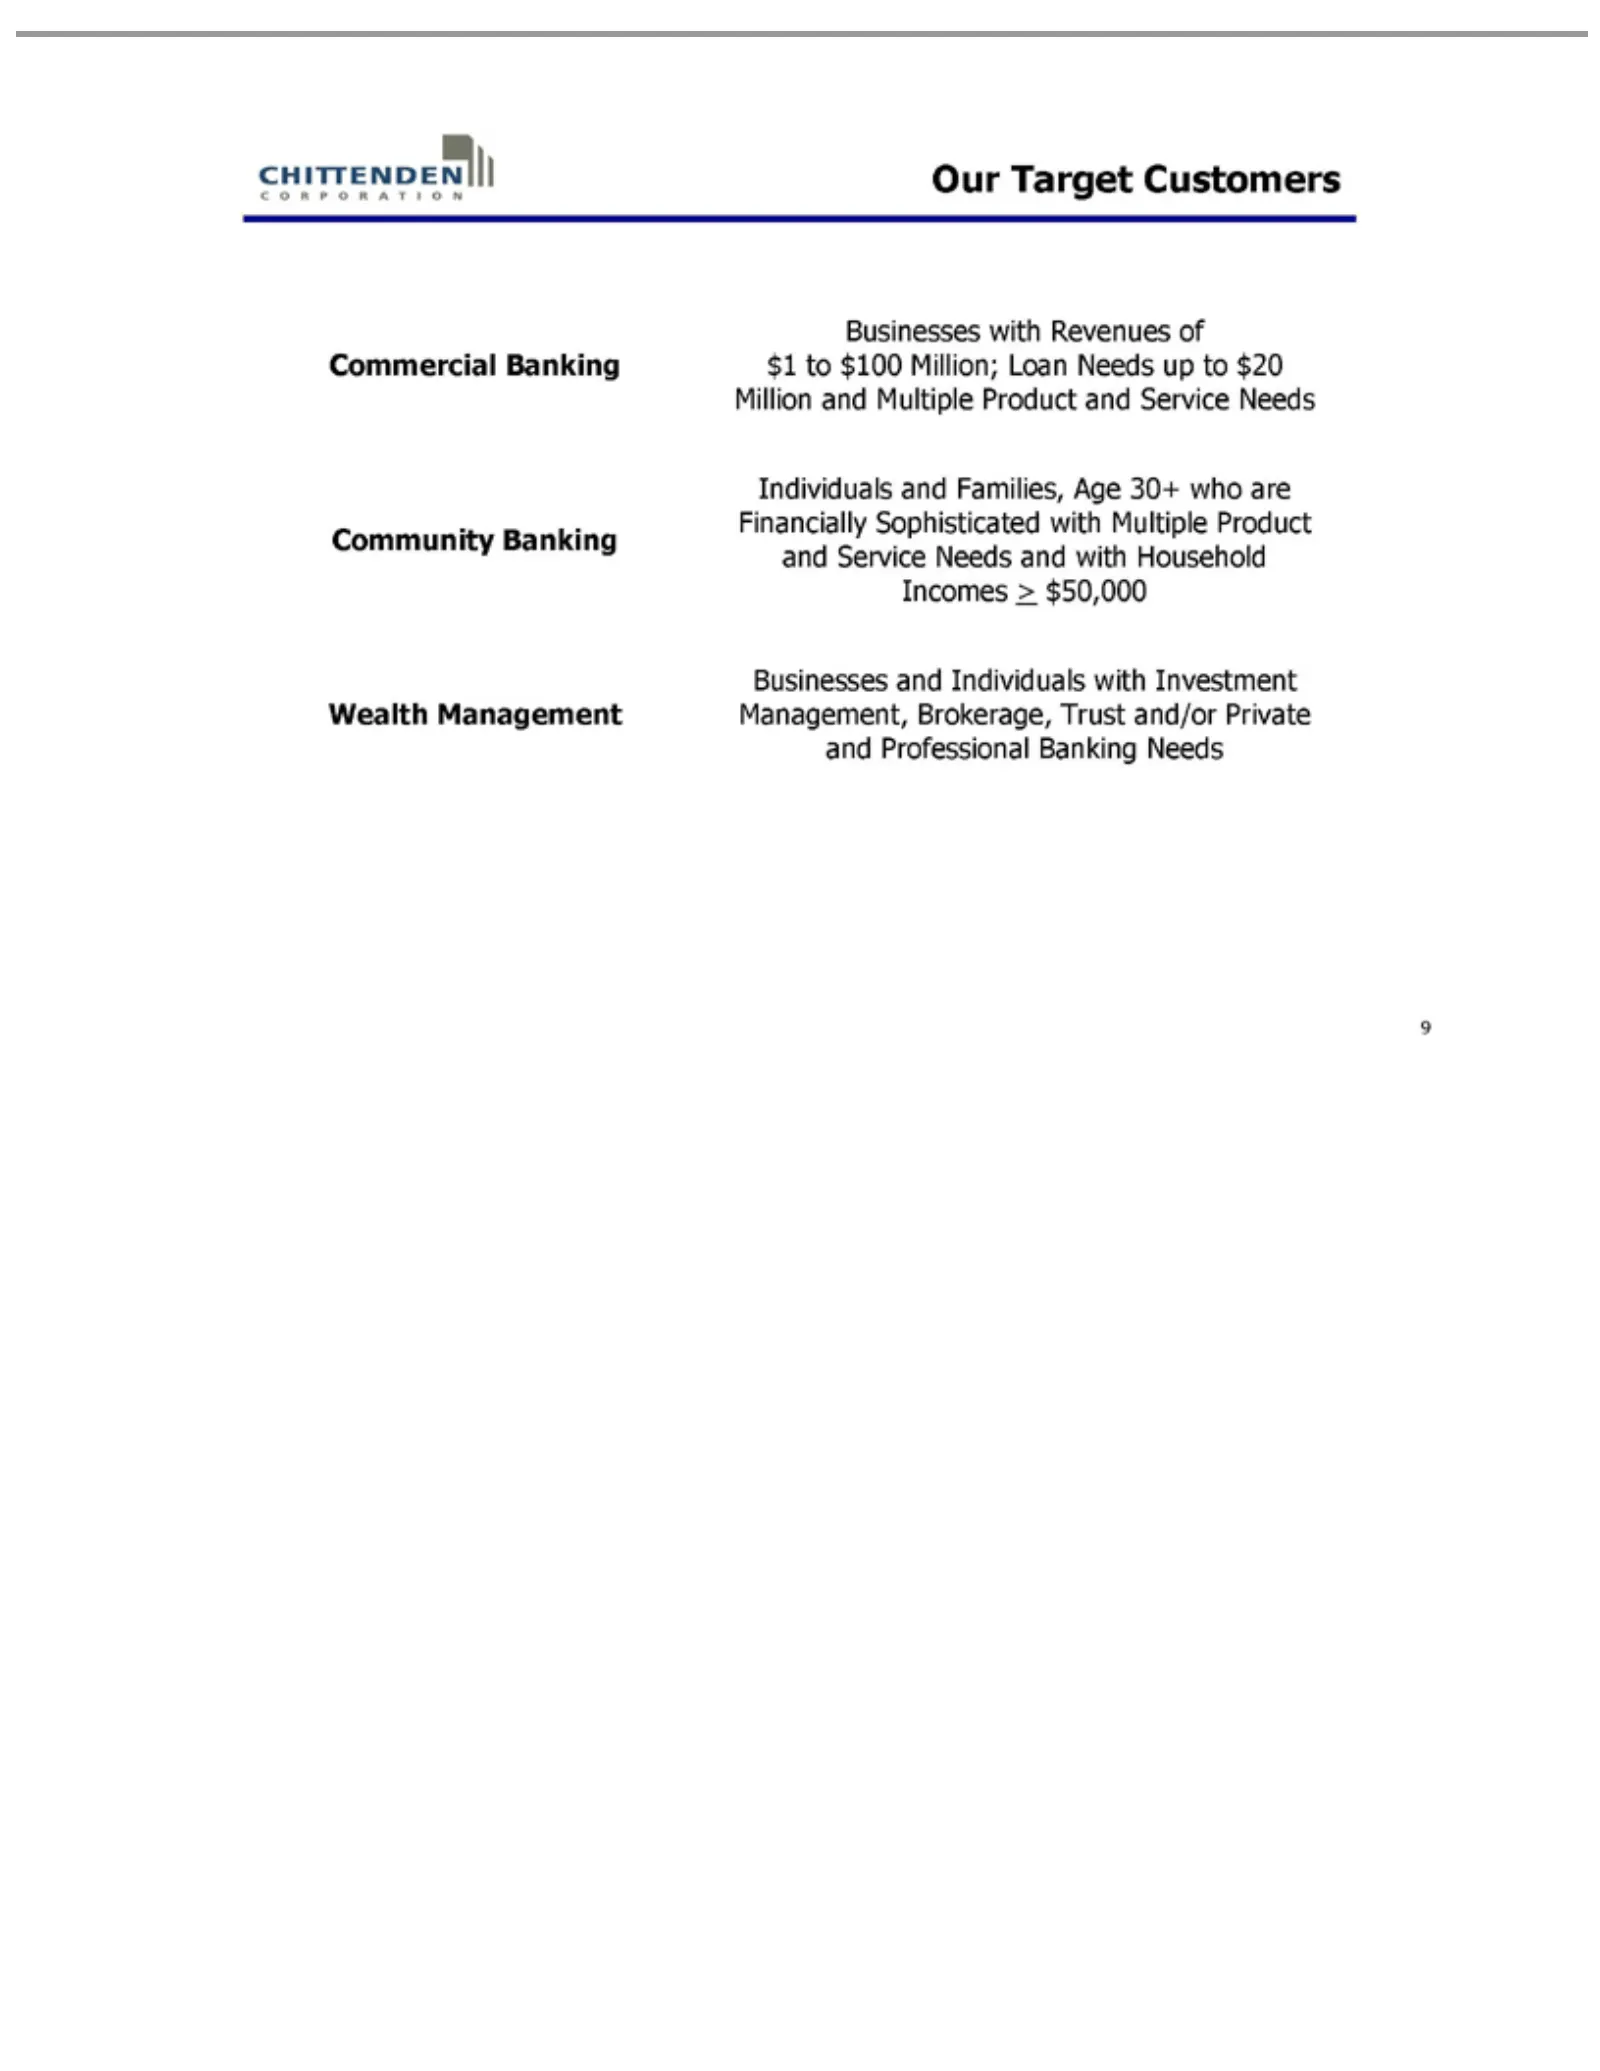
Our Target Commercial Community Individuals Wealth Businesses 9 Management Customers with and and Banking Banking Individuals Families, RevenuesAge of with $1 30+ Investment to who $100are Million; Financially Management, Loan Needs Sophisticated Brokerage, up to $20 with Trust Million Multiple and/
Slide 10: Commercial & Community Banking
Commercial & Community Banking 10
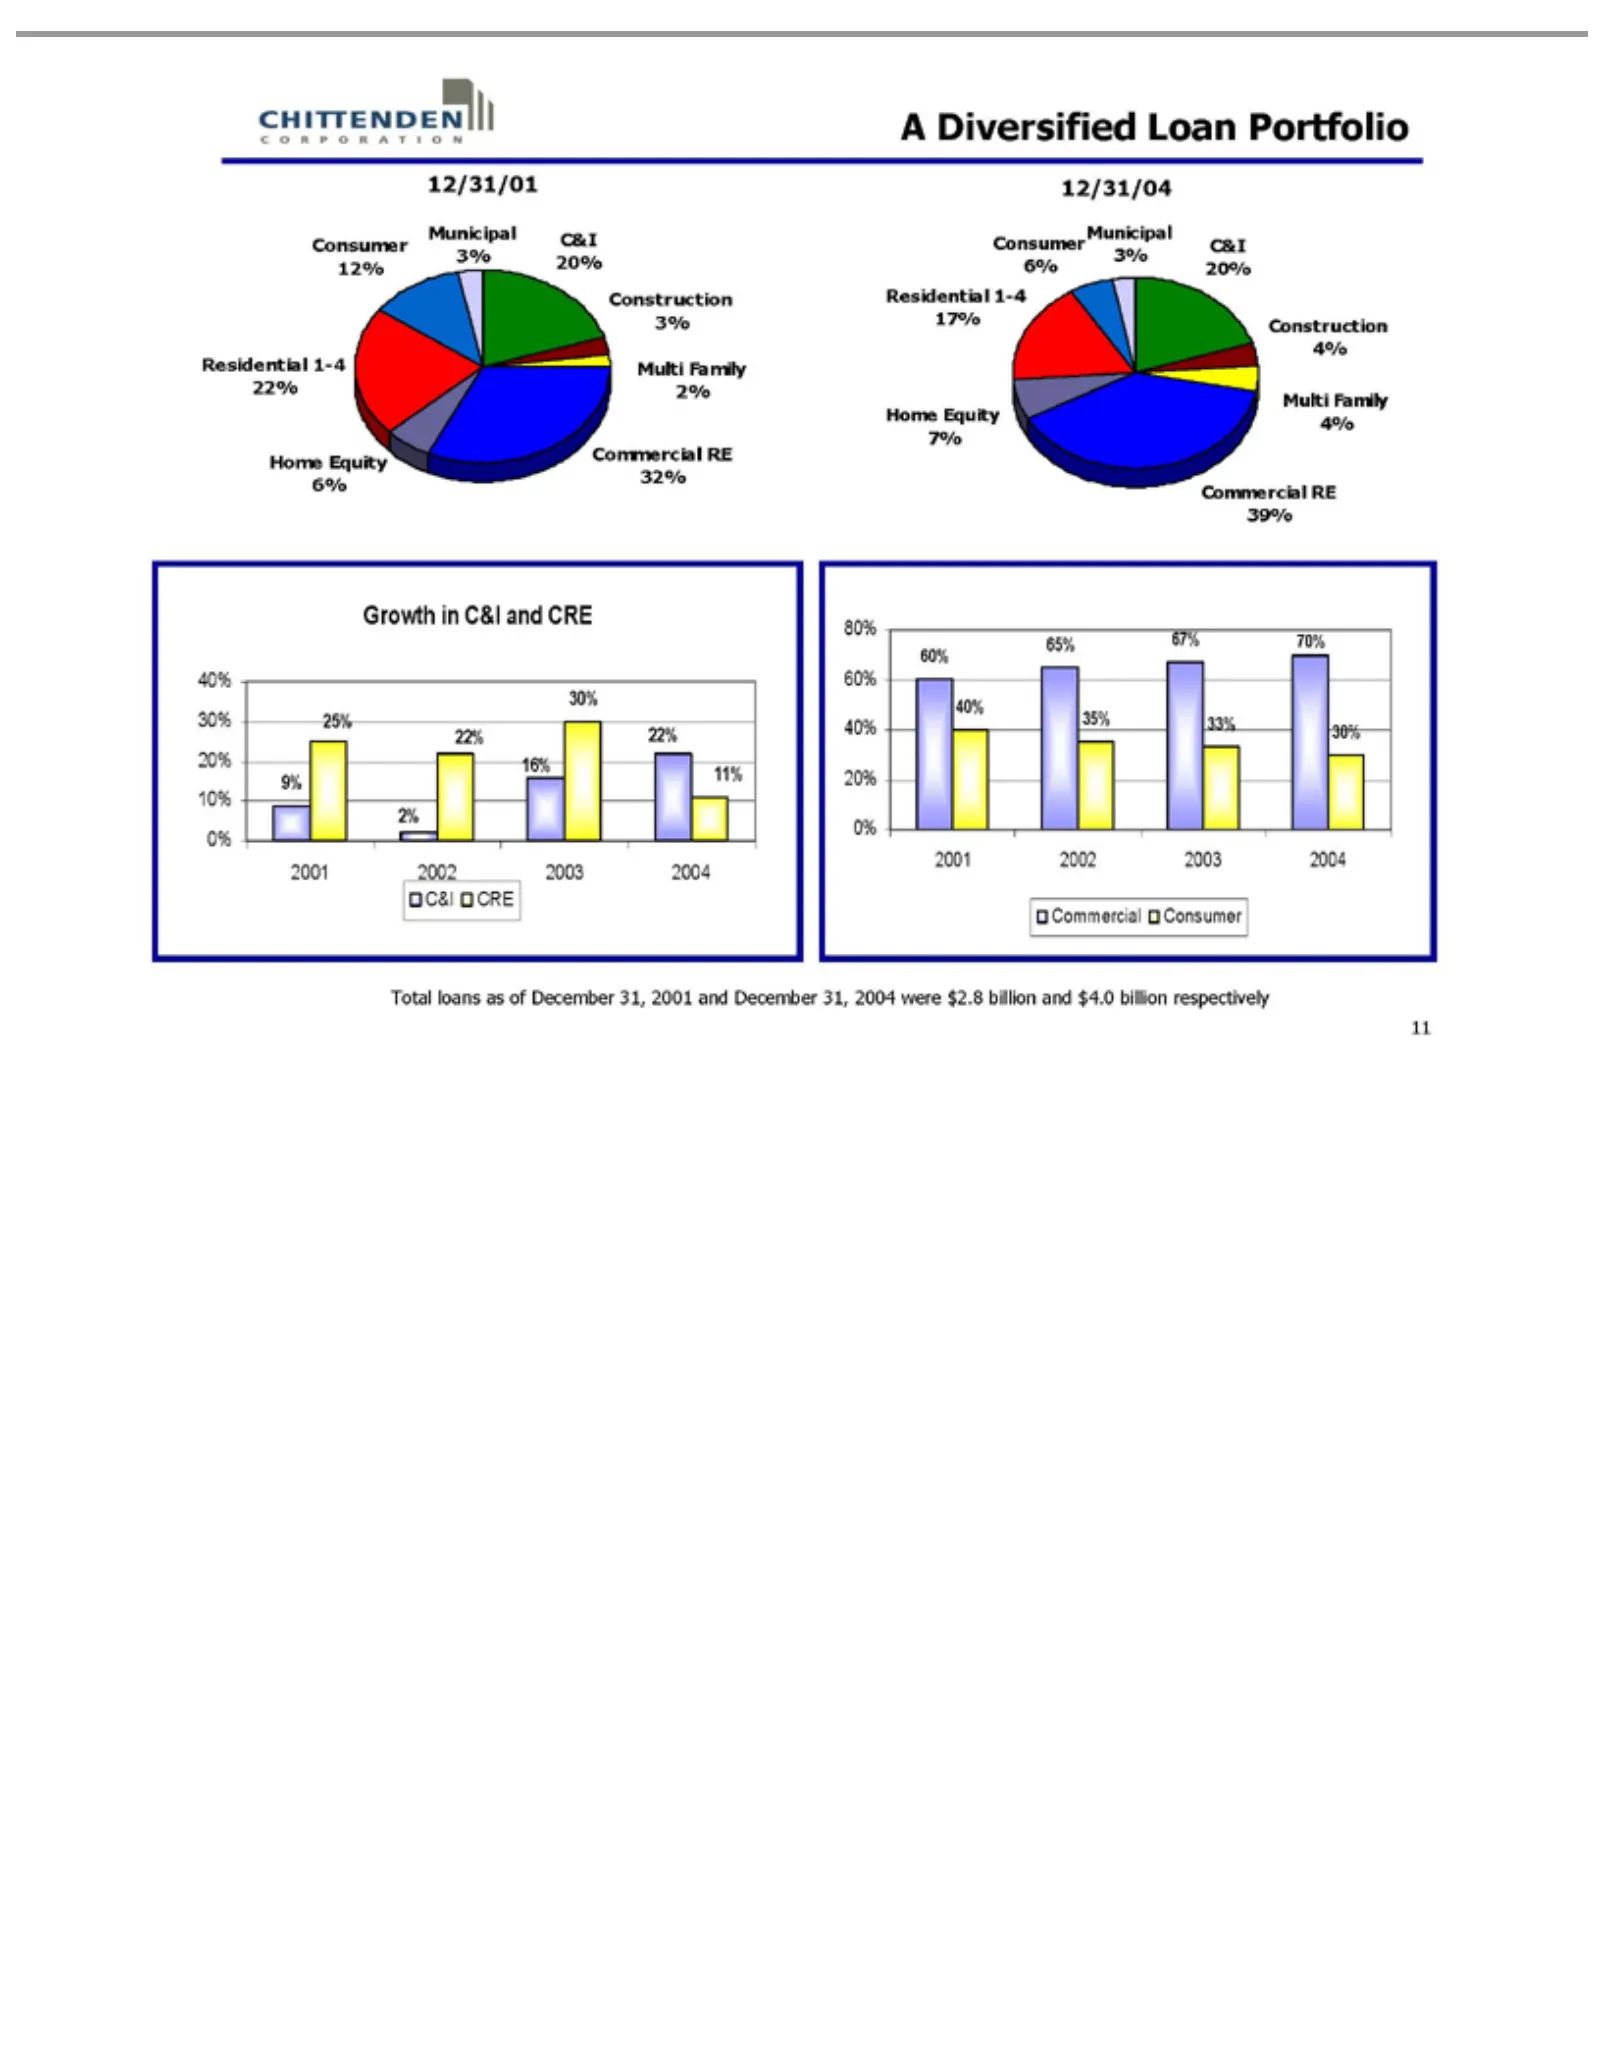
Slide 11: A Diversified Loan Portfolio
A Diversified 12/31/01 32% Municipal 12/31/04 Construction Multi Home 39% Residential Consumer Growth 40% 9% C&I 80% 60% 2001 Commercial Total 11 25% 20% CRE 30% 60% 40% 2002 loans Family Equity in2% 20% 40% 65% C&I 3% 12% 6% 2003 as 1-4 RE Consumer 22% 3% 4% 2% 4% 6% 7% Loan of35% 10% 20% 22% 17% a
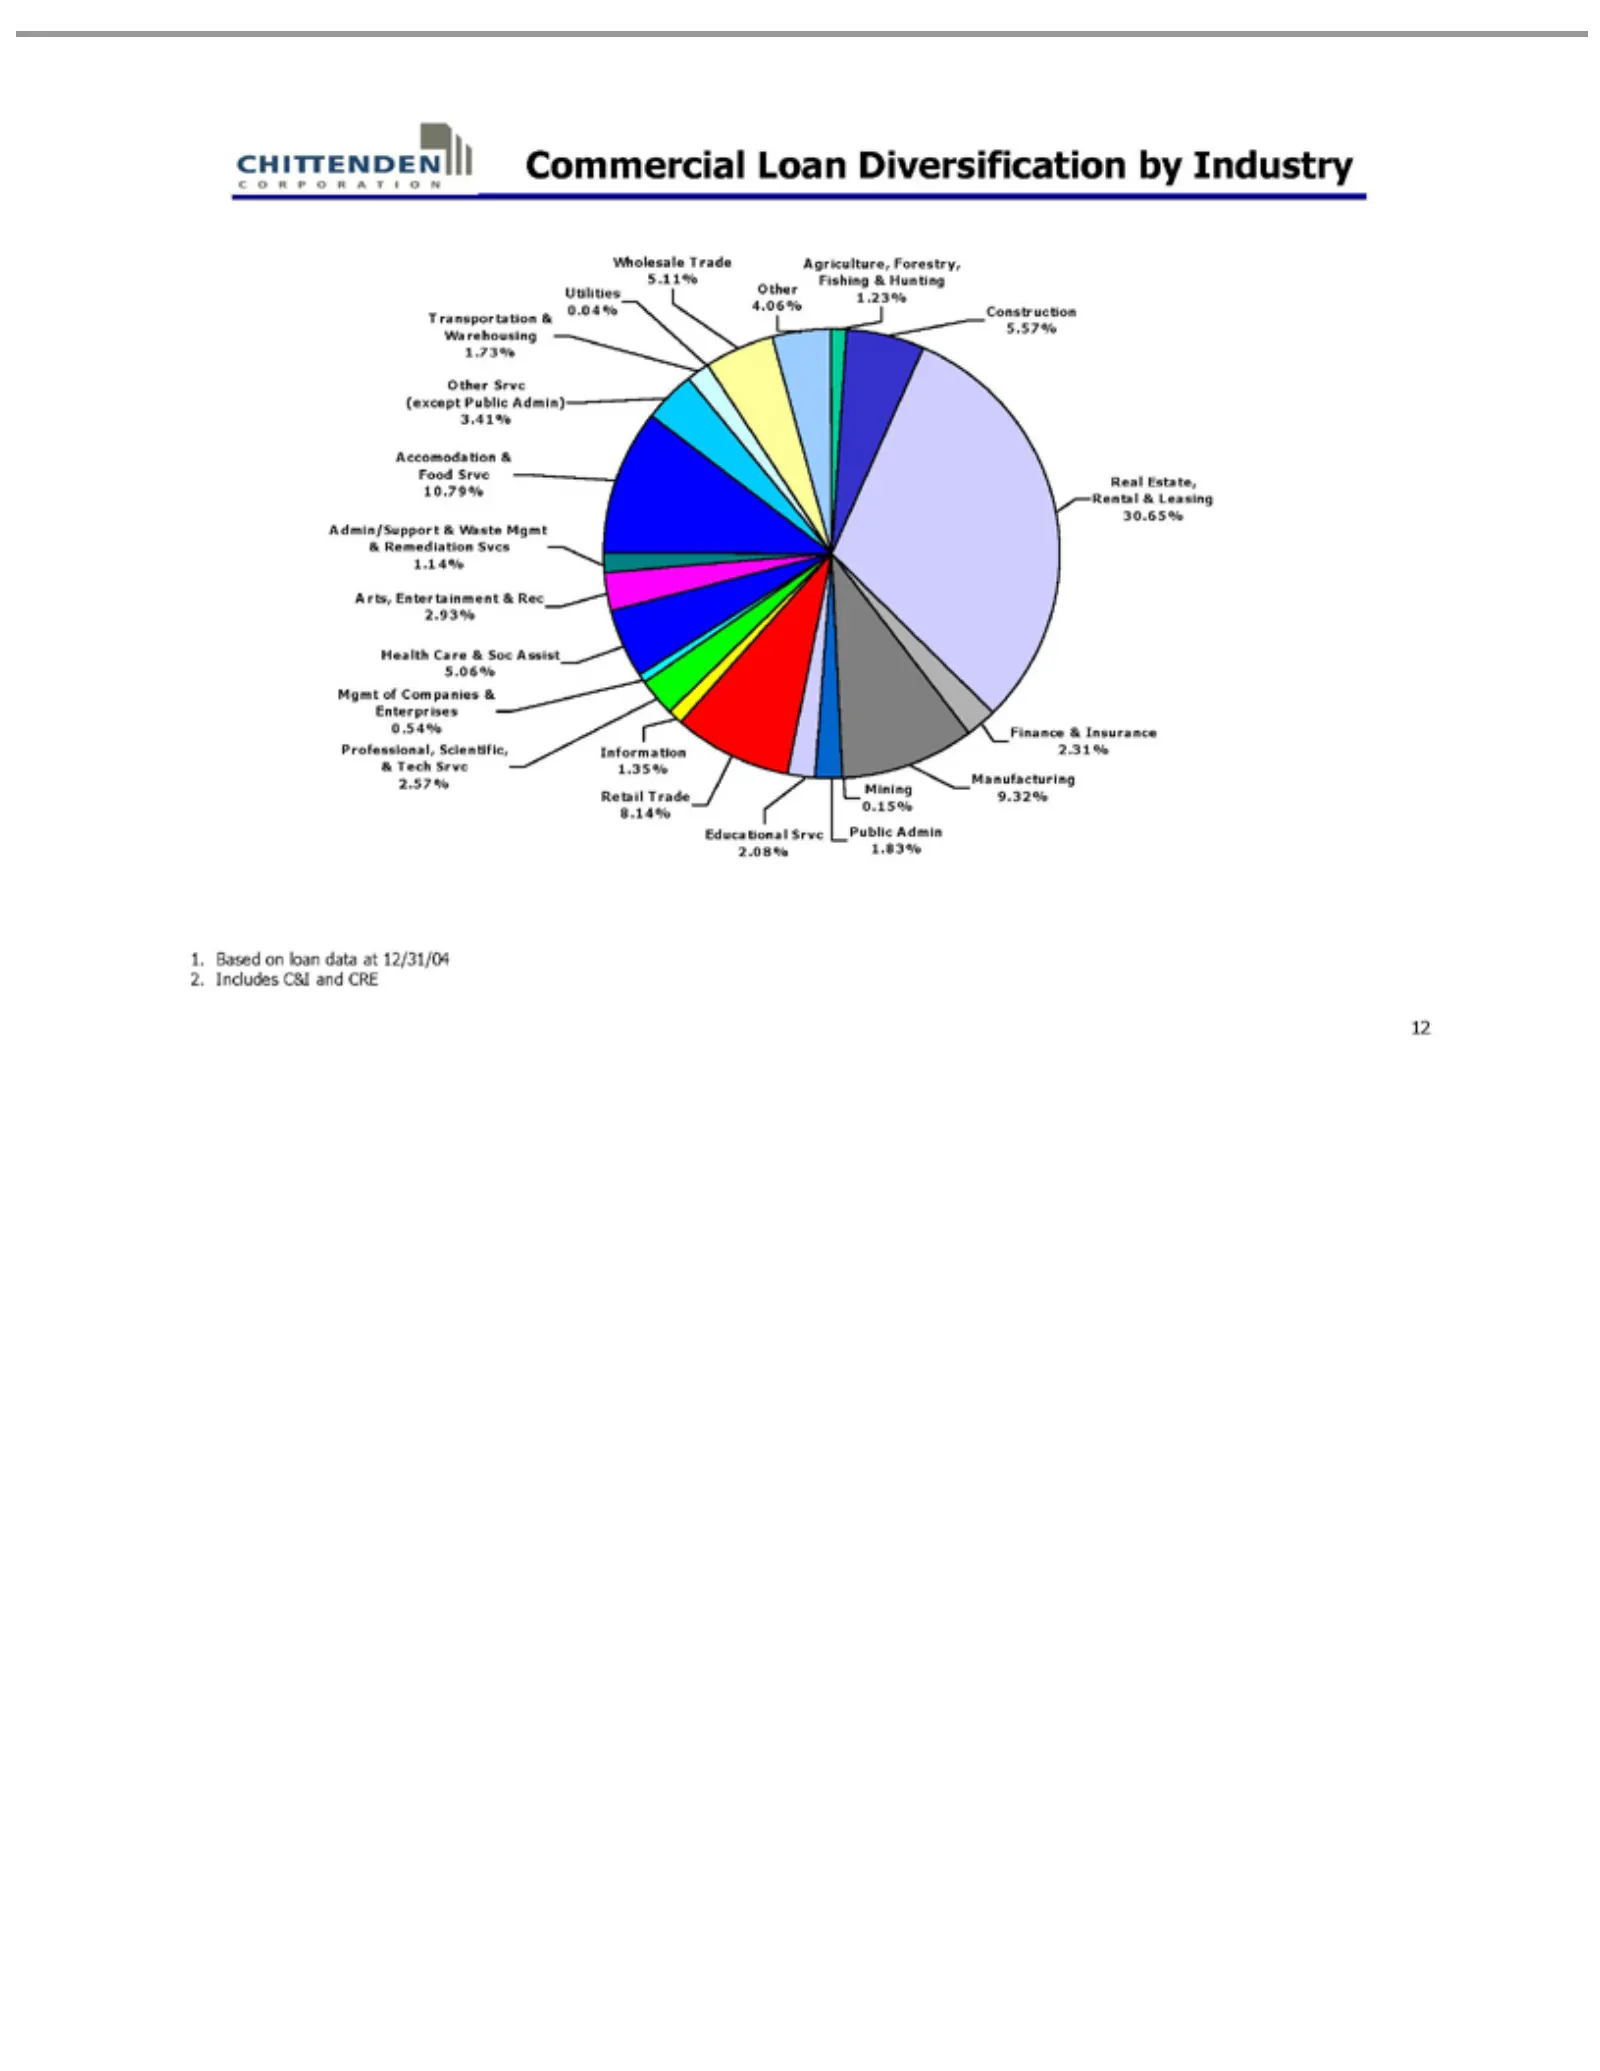
Slide 12: Commercial Loan Diversification by Industry
Commercial Agriculture, Fishing Construction Real Finance Manufacturing Mining Public Educational Retail Information Professional, Mgmt Health Arts, Admin/Support & Accomodation Food Transportation Utilities Wholesale Other 1. 2. 12 Based Includes Remediation Estate, Entertainment Srvc Srvc 4.06% Tr
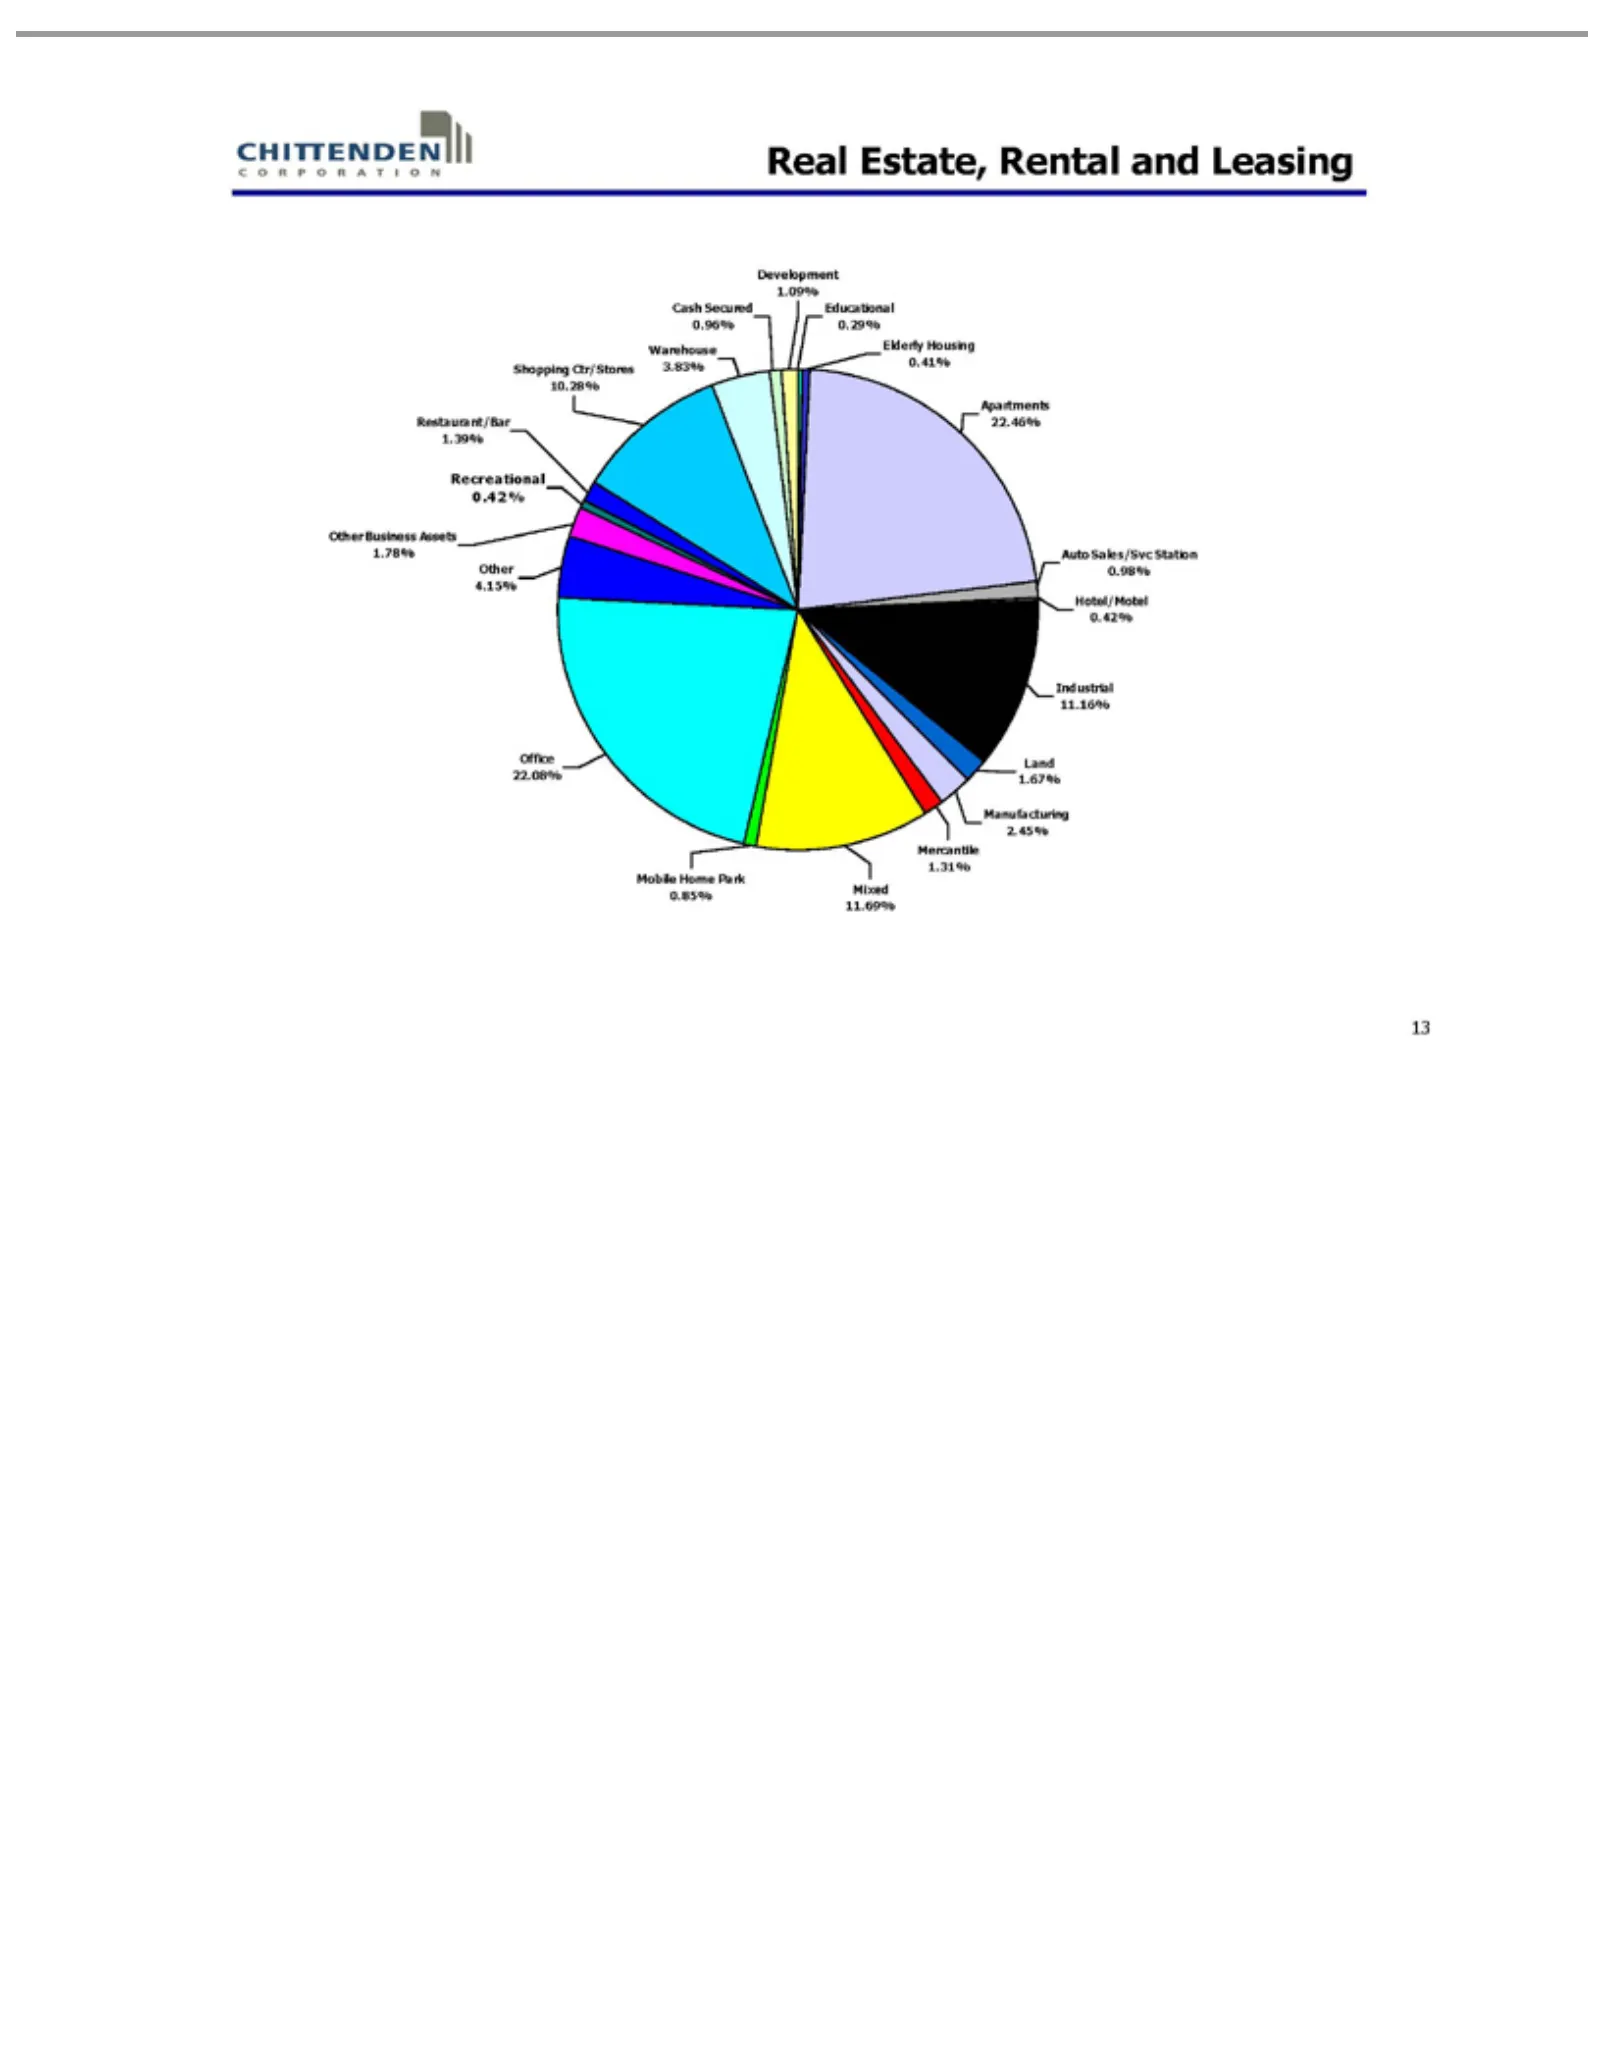
Slide 13: Commercial Real Estate Diversification
Real Estate, Development Educational Elderly Apartments Auto Hotel/Motel Industrial Land Manufacturing Mercantile Mixed Mobile Office Other Recreational Restaurant/Bar Shopping Warehouse Cash 13 Sales/Svc Secured 1.67% 4.15% Business 22.08% 11.69% Home Housing 11.16% Ctr/Stores 1.31% 3.83% 22.46% 0.
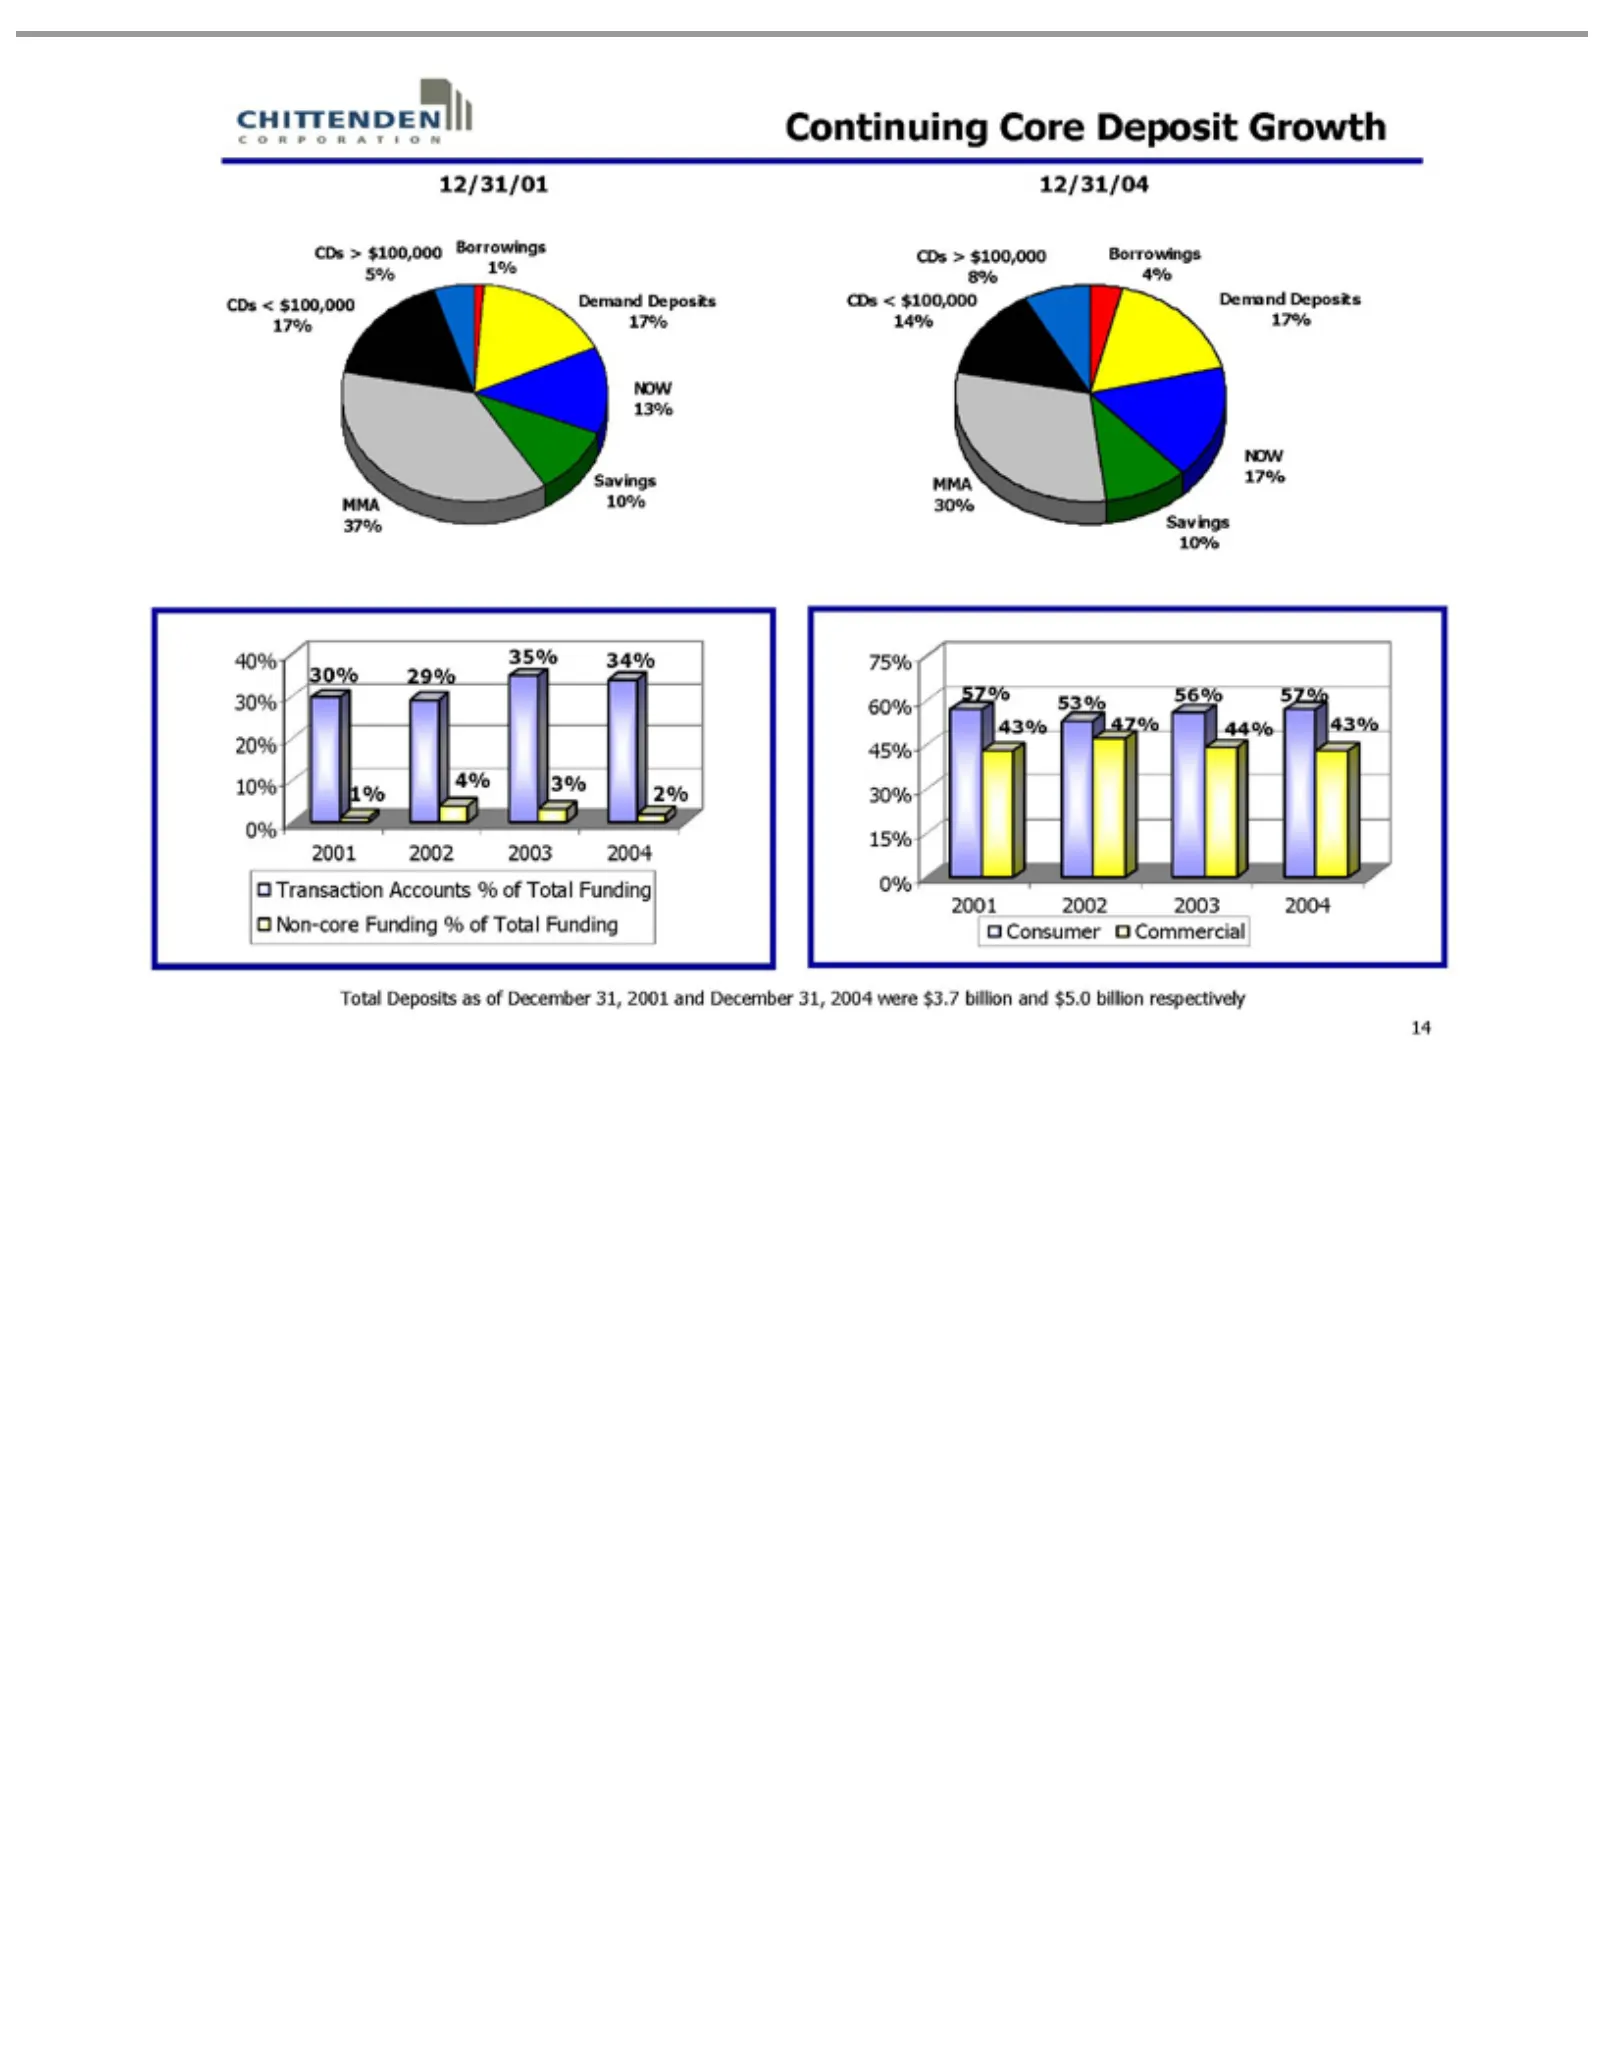
Slide 14: Continuing Core Deposit Growth
Continuing 12/31/01 Borrowings 12/31/04 Demand NOW Savings MMA CDs 40% 30% Transaction 75% 57% 2001 Total Commercial Consumer 14 < >30% 29% 60% 43% 2002 Deposits 13% 17% 37% 30% $100,000 10% Deposits 20% 35% 45% 53% 2003 Core Accounts 1%as 4% 10% 34% 30% 47% 2004 17% 5% 14% 8% Deposit of 17% Decembe
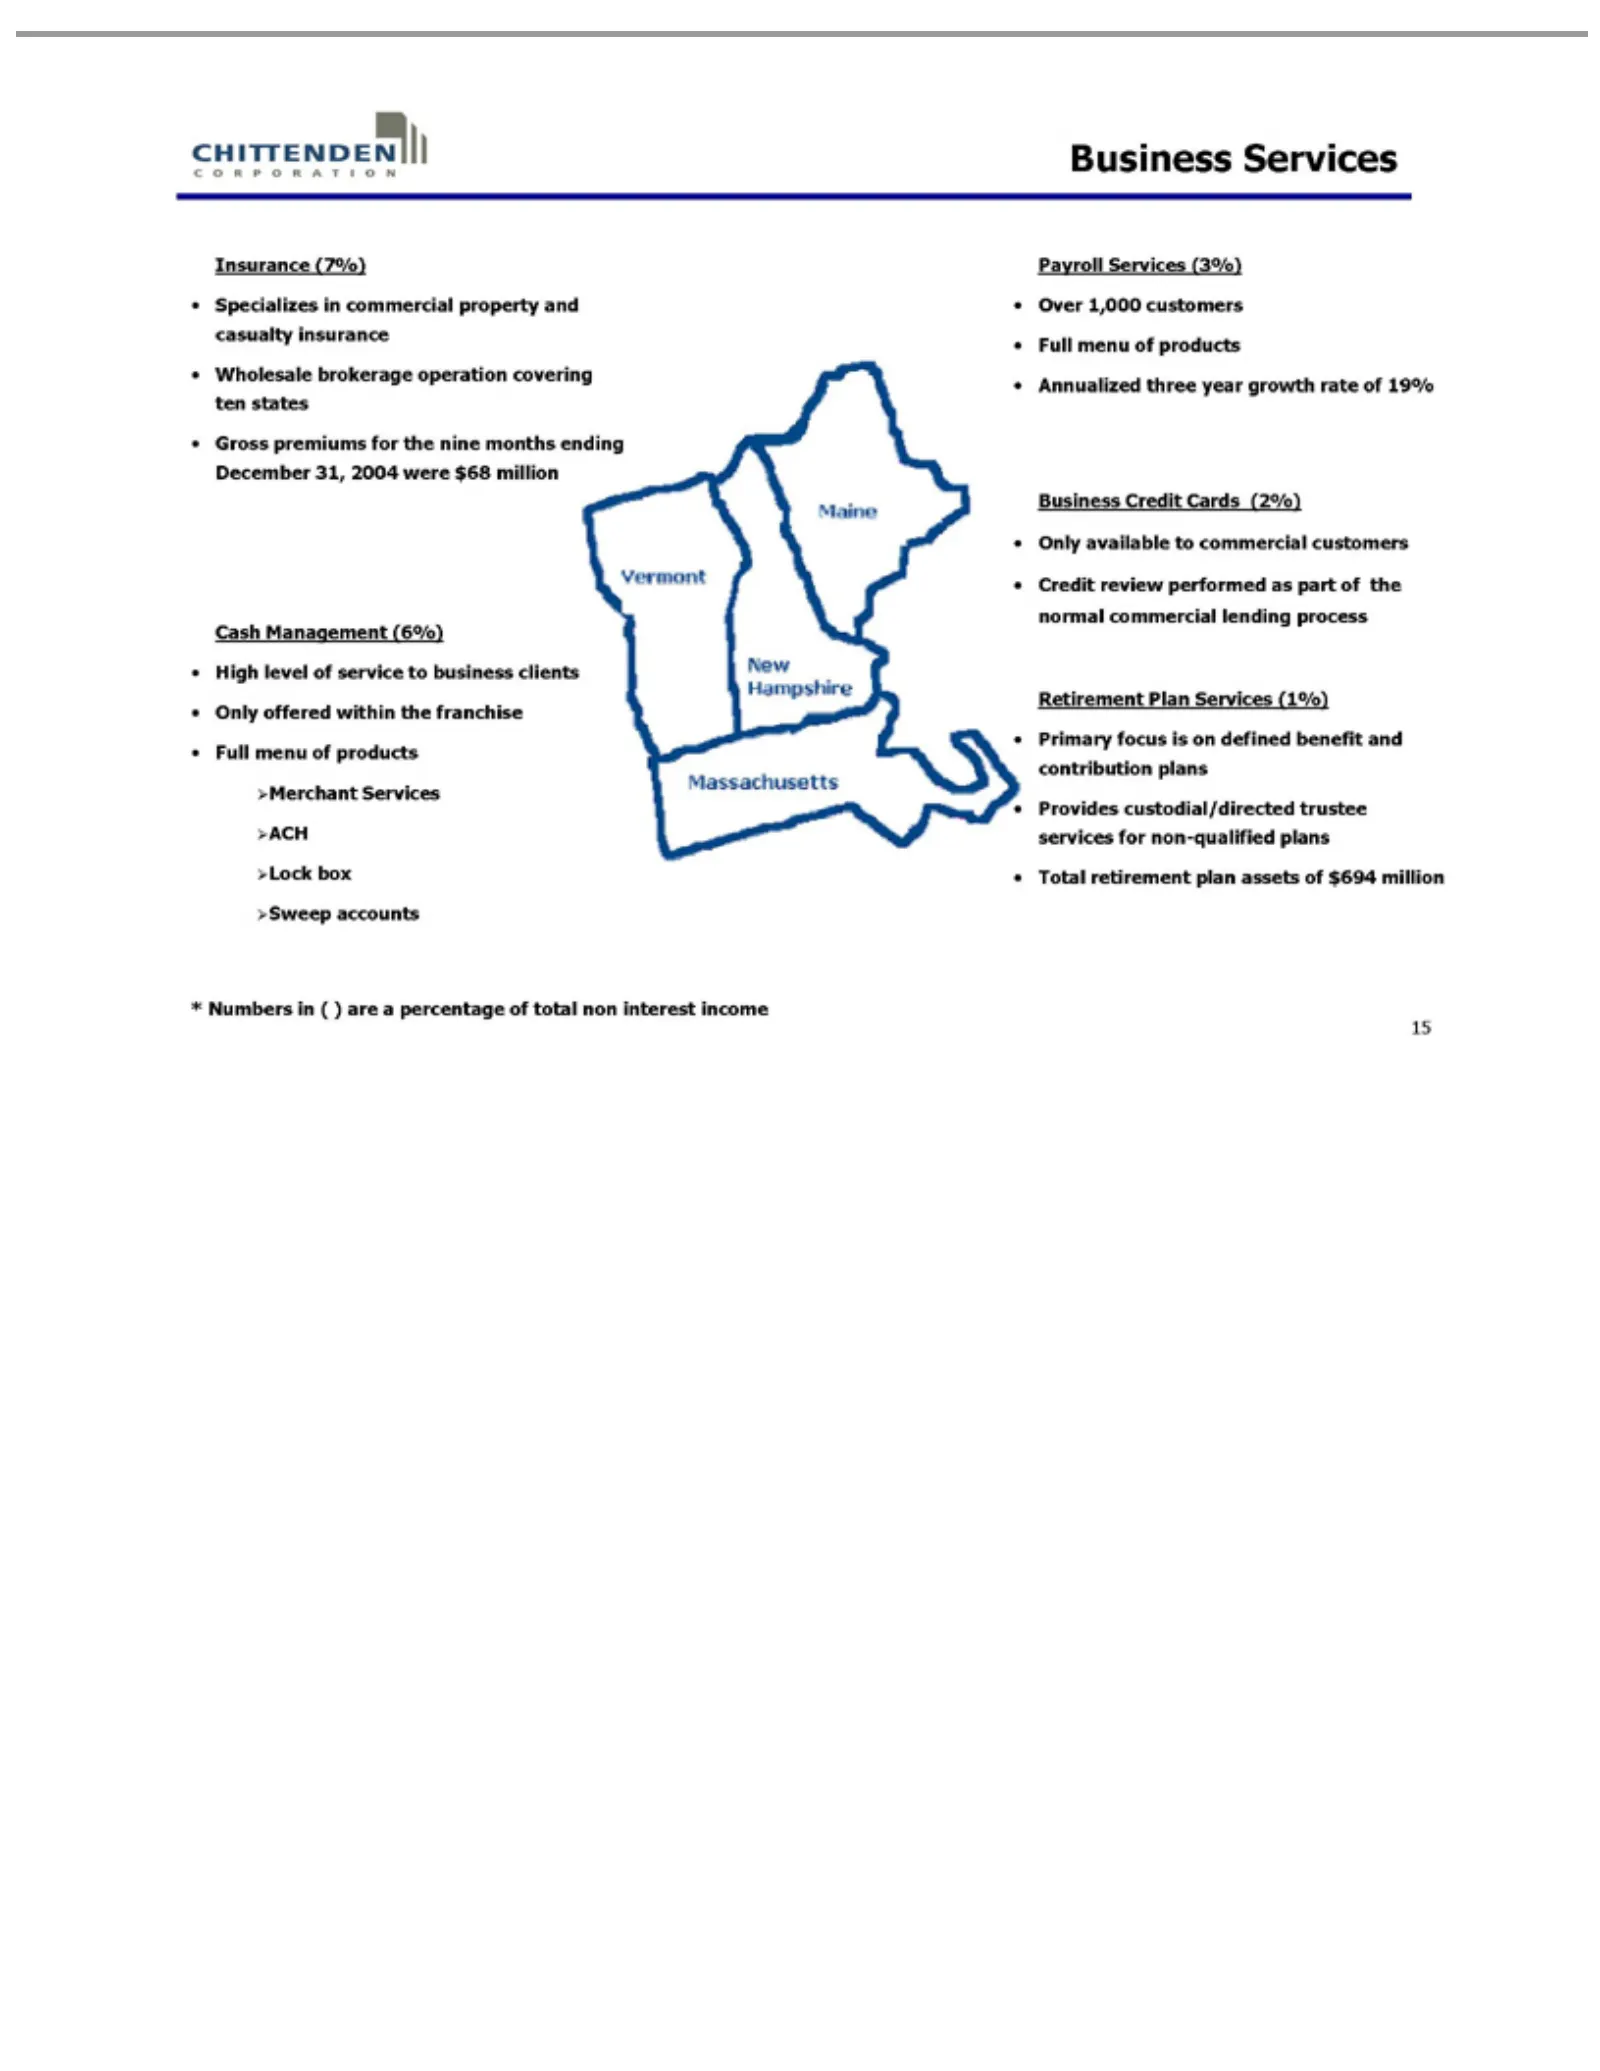
Slide 15: Insurance and Cash Management Services
Insurance Specializes Cash High Merchant Lock Payroll Annualized Business Only Credit Retirement * million 15Numbers level available Management box review Services Services Credit Sweep Services (7%) of in Plan three service (performed commercial to )Cards Services (3%) are accounts year commercial
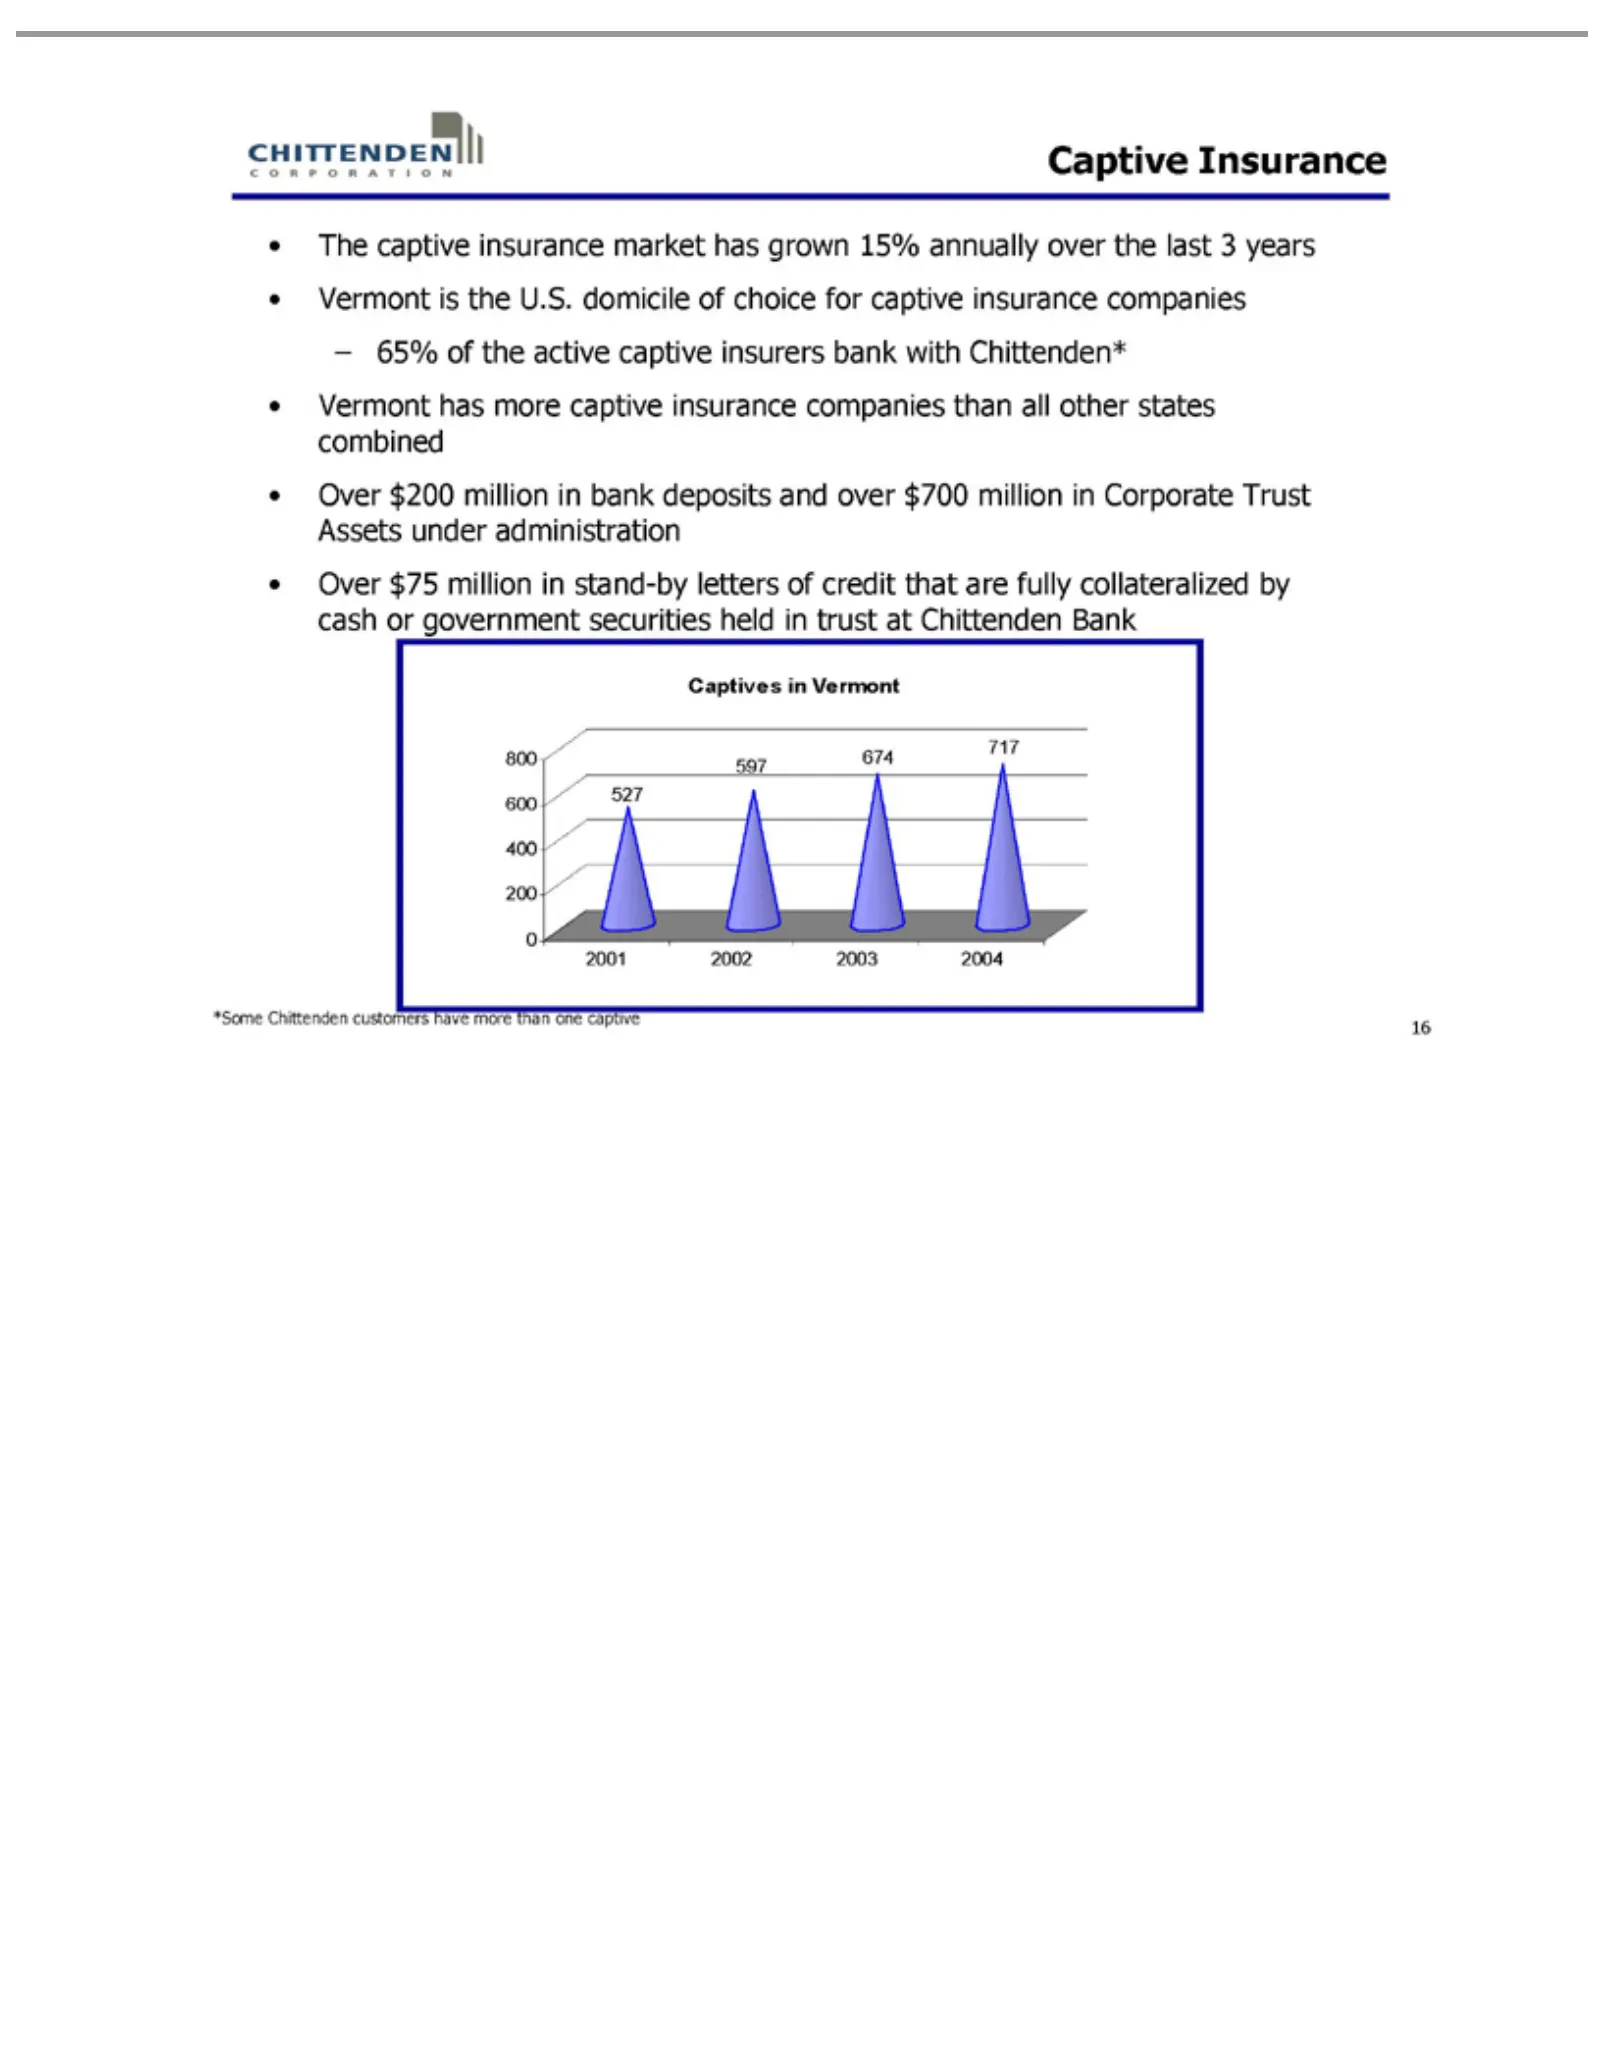
Slide 16: The Corporate Captive Insurance Leader
Captive The 65% Corporate Captives 800 527 2001 *Some 16 600 597 captive of 2002 Chittenden the Insurance 400 674 inTrust 2003 active Vermont insurance 200Assets 7172004 0captive customers market under insurers administration have has grown bank morewith than 15%Over Chittenden* one annually captive
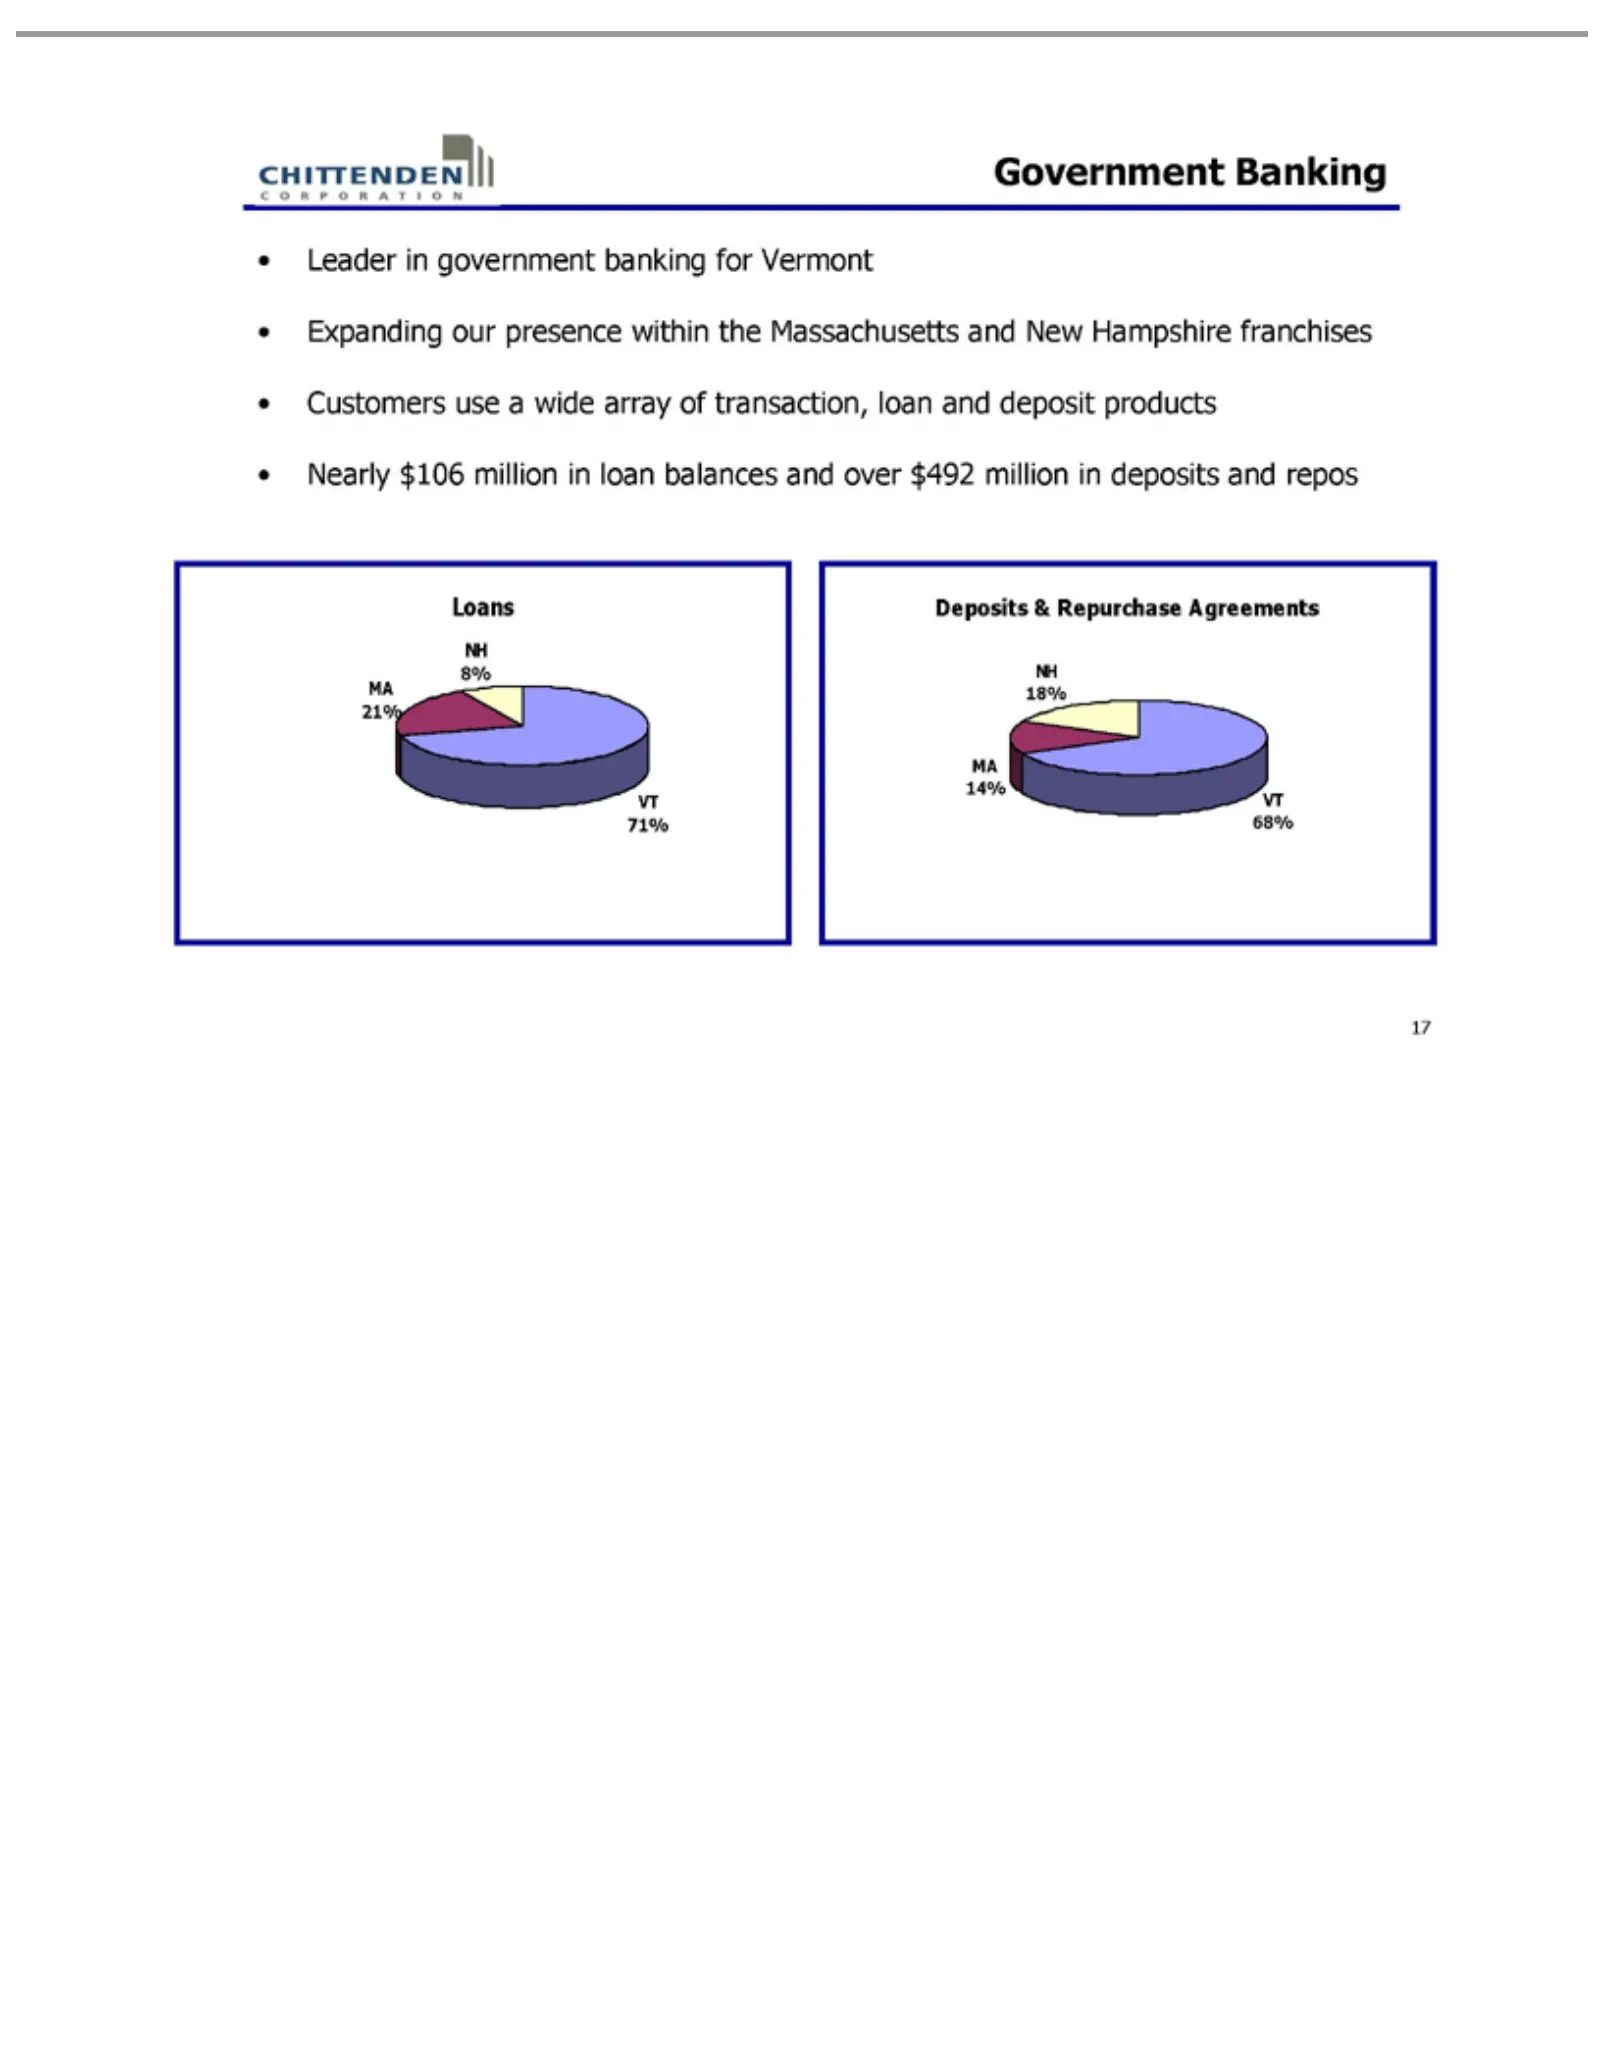
Slide 17: Government Banking: Leader and Expanding
Government Leader Expanding $492 Loans Deposits NH MA VT 17 71% 68% 8% 18% 21% 14% million in&government our Repurchase Banking inpresence deposits banking Agreements within and repos for theVermont Massachusetts and New Hampshire franchises Customers use a wide array of transaction, loan and deposi
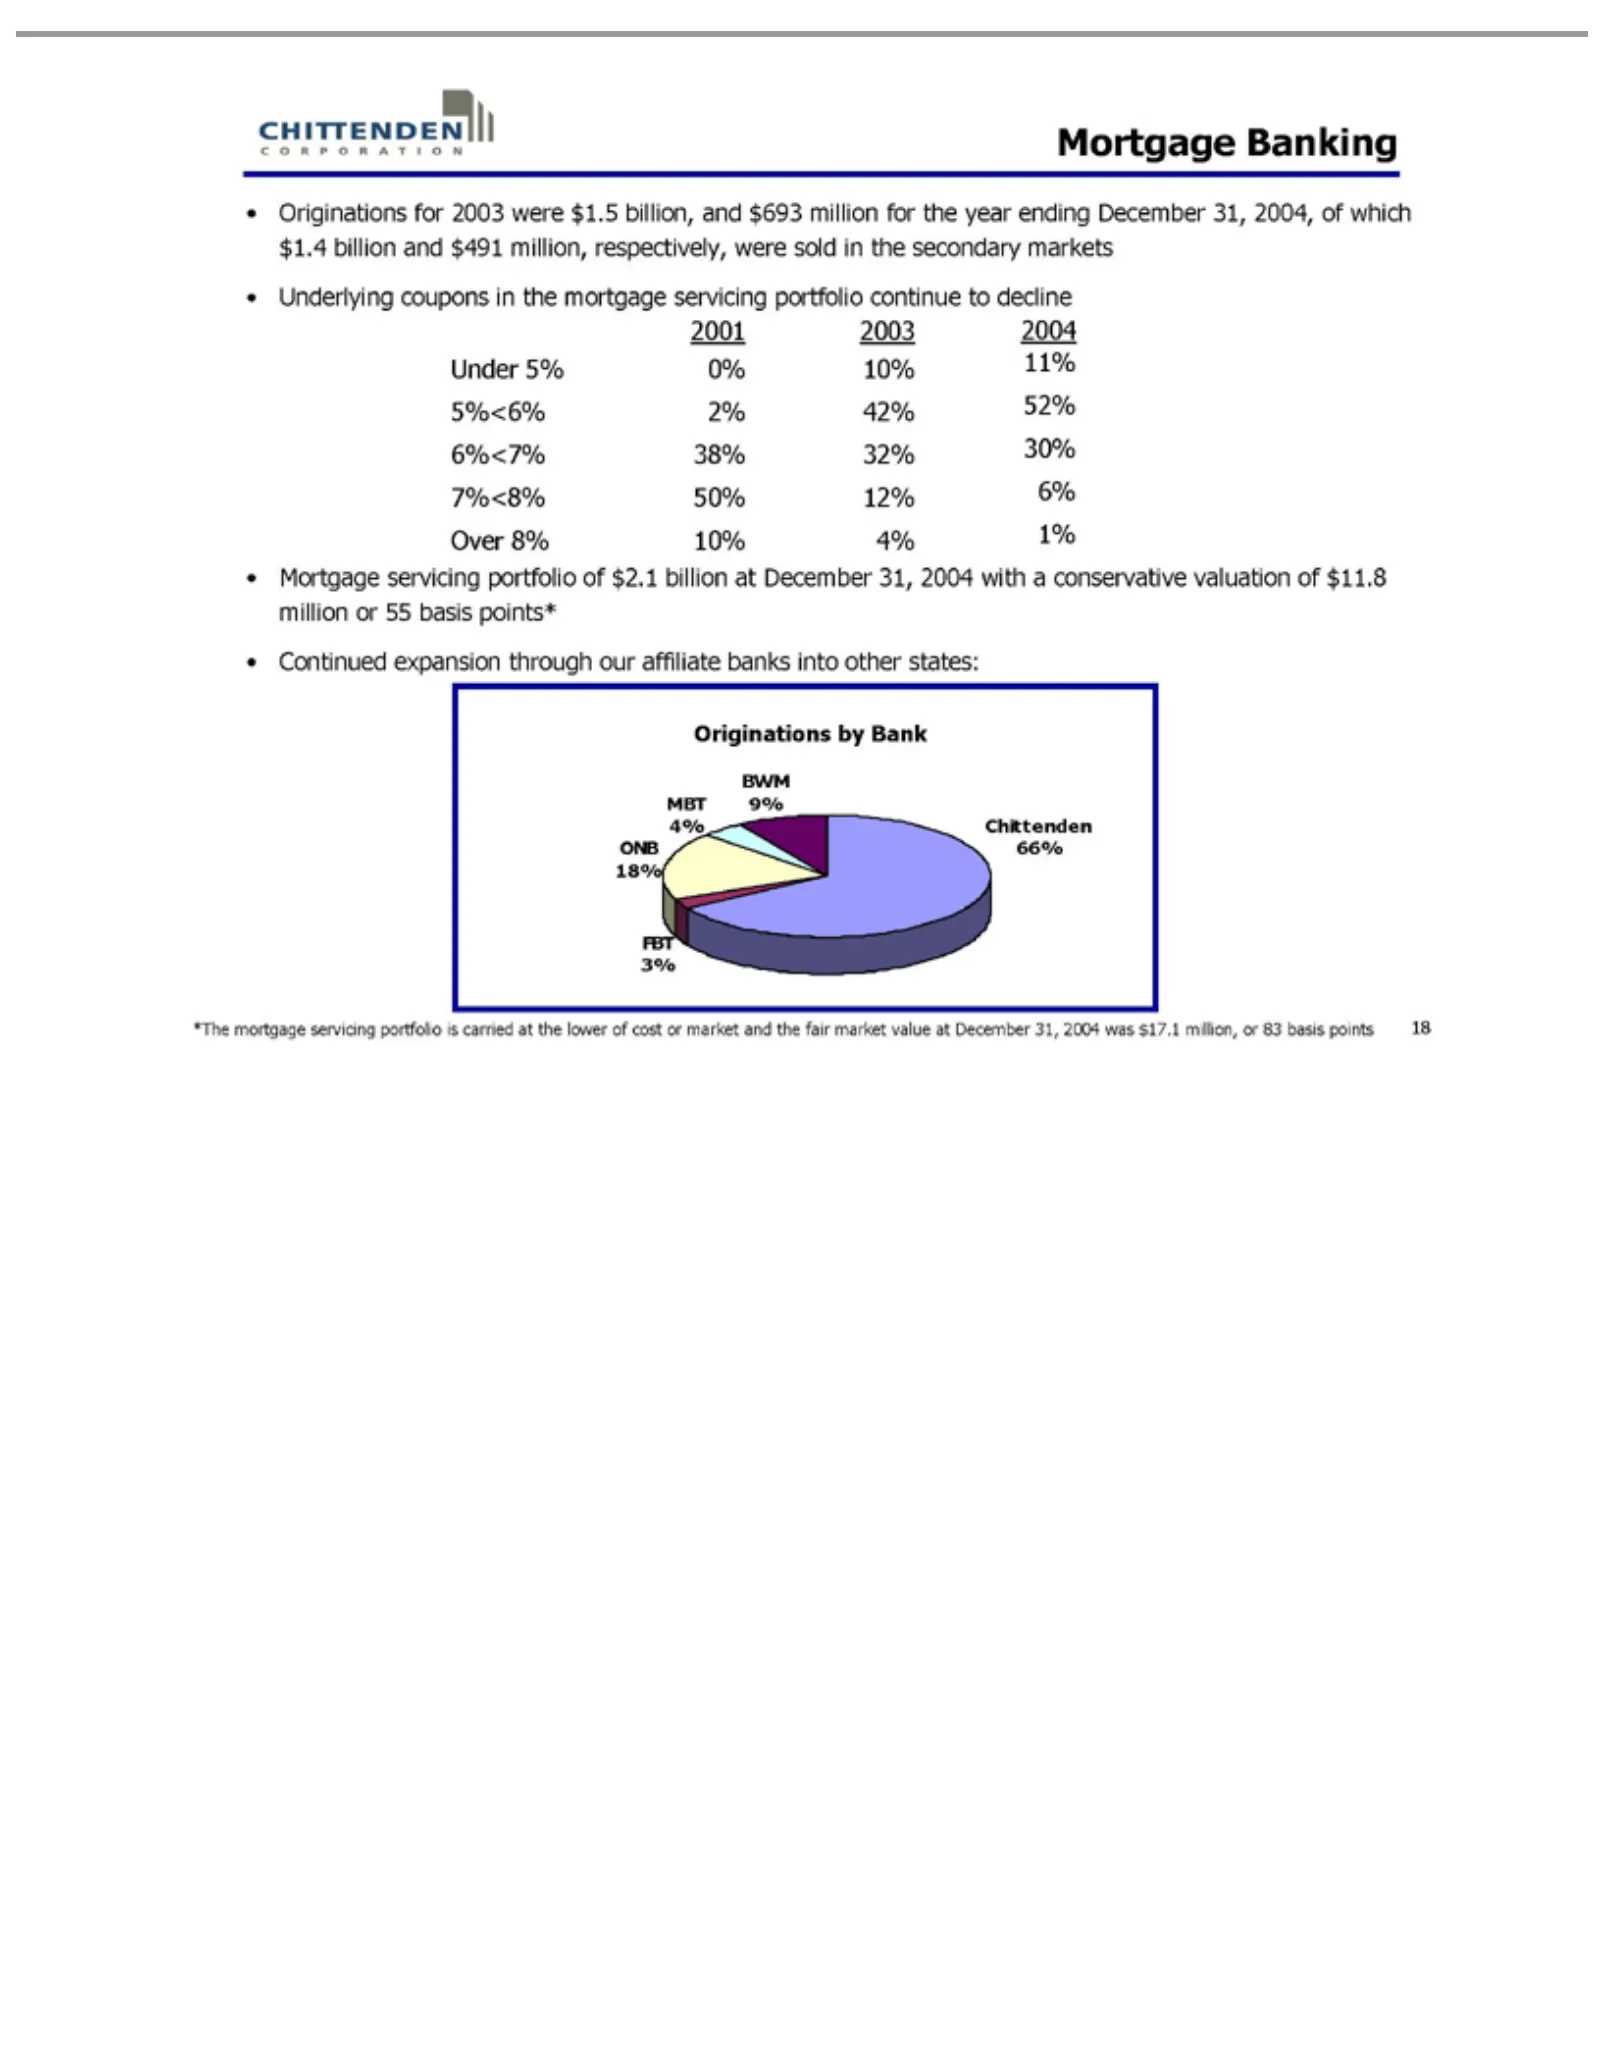
Slide 18: Mortgage Banking
coupons 2001 Under 5%<6% 6%<7% 7%<8% Over Mortgage Originations ONB MBT BWM Chittenden FBT *The 18 3% 8% 2003 mortgage 18% 4% 5% 9%2% 38% 50% in 10% Banking servicing 0% 2004 the 66% 42% for by 32% 12% 10% 4% mortgage servicing Bank 2003 52% 1% 30% 6% 11% portfolio were servicing portfolio $1.5 of $

Slide 19: Wealth Management
Wealth Management 19
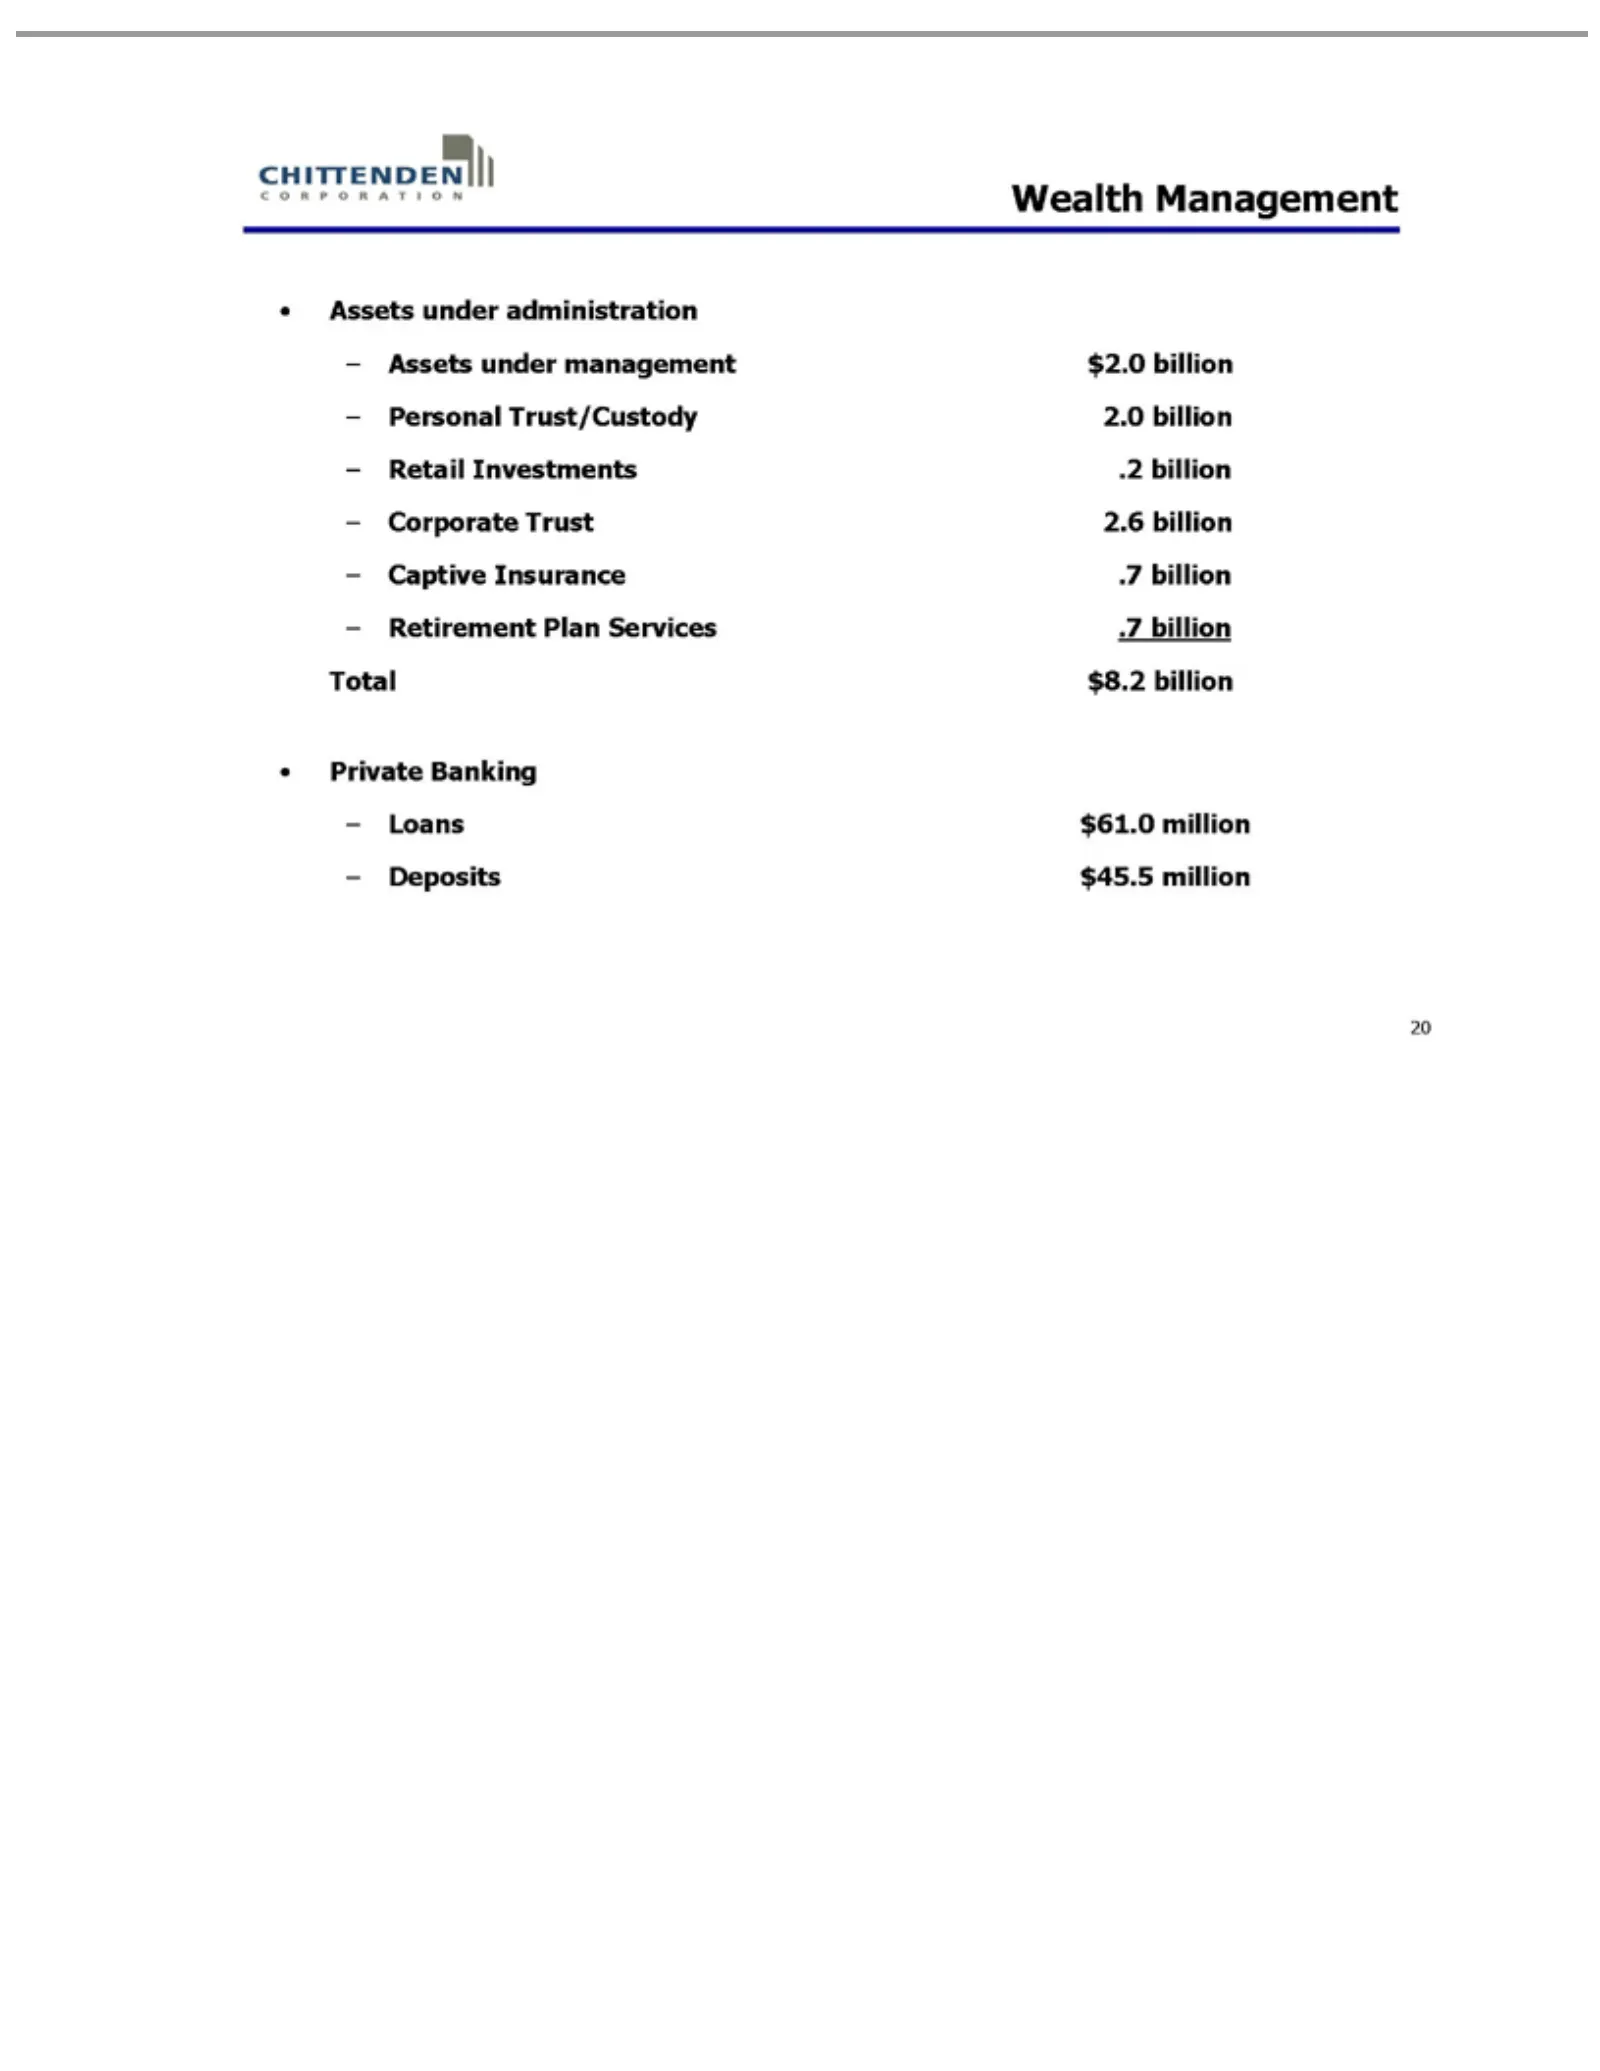
Slide 20: Wealth Management Assets
Wealthmillion Assets Private Total Loans $61.0 20 Deposits under Management Banking administration management $45.5 $2.0million billionPersonal 2.0 billion Trust/Custody .2 billion 2.6Retail billion Investments .7 billion .7Corporate billion $8.2 Trust billion Captive Insurance Retirement Plan Servi
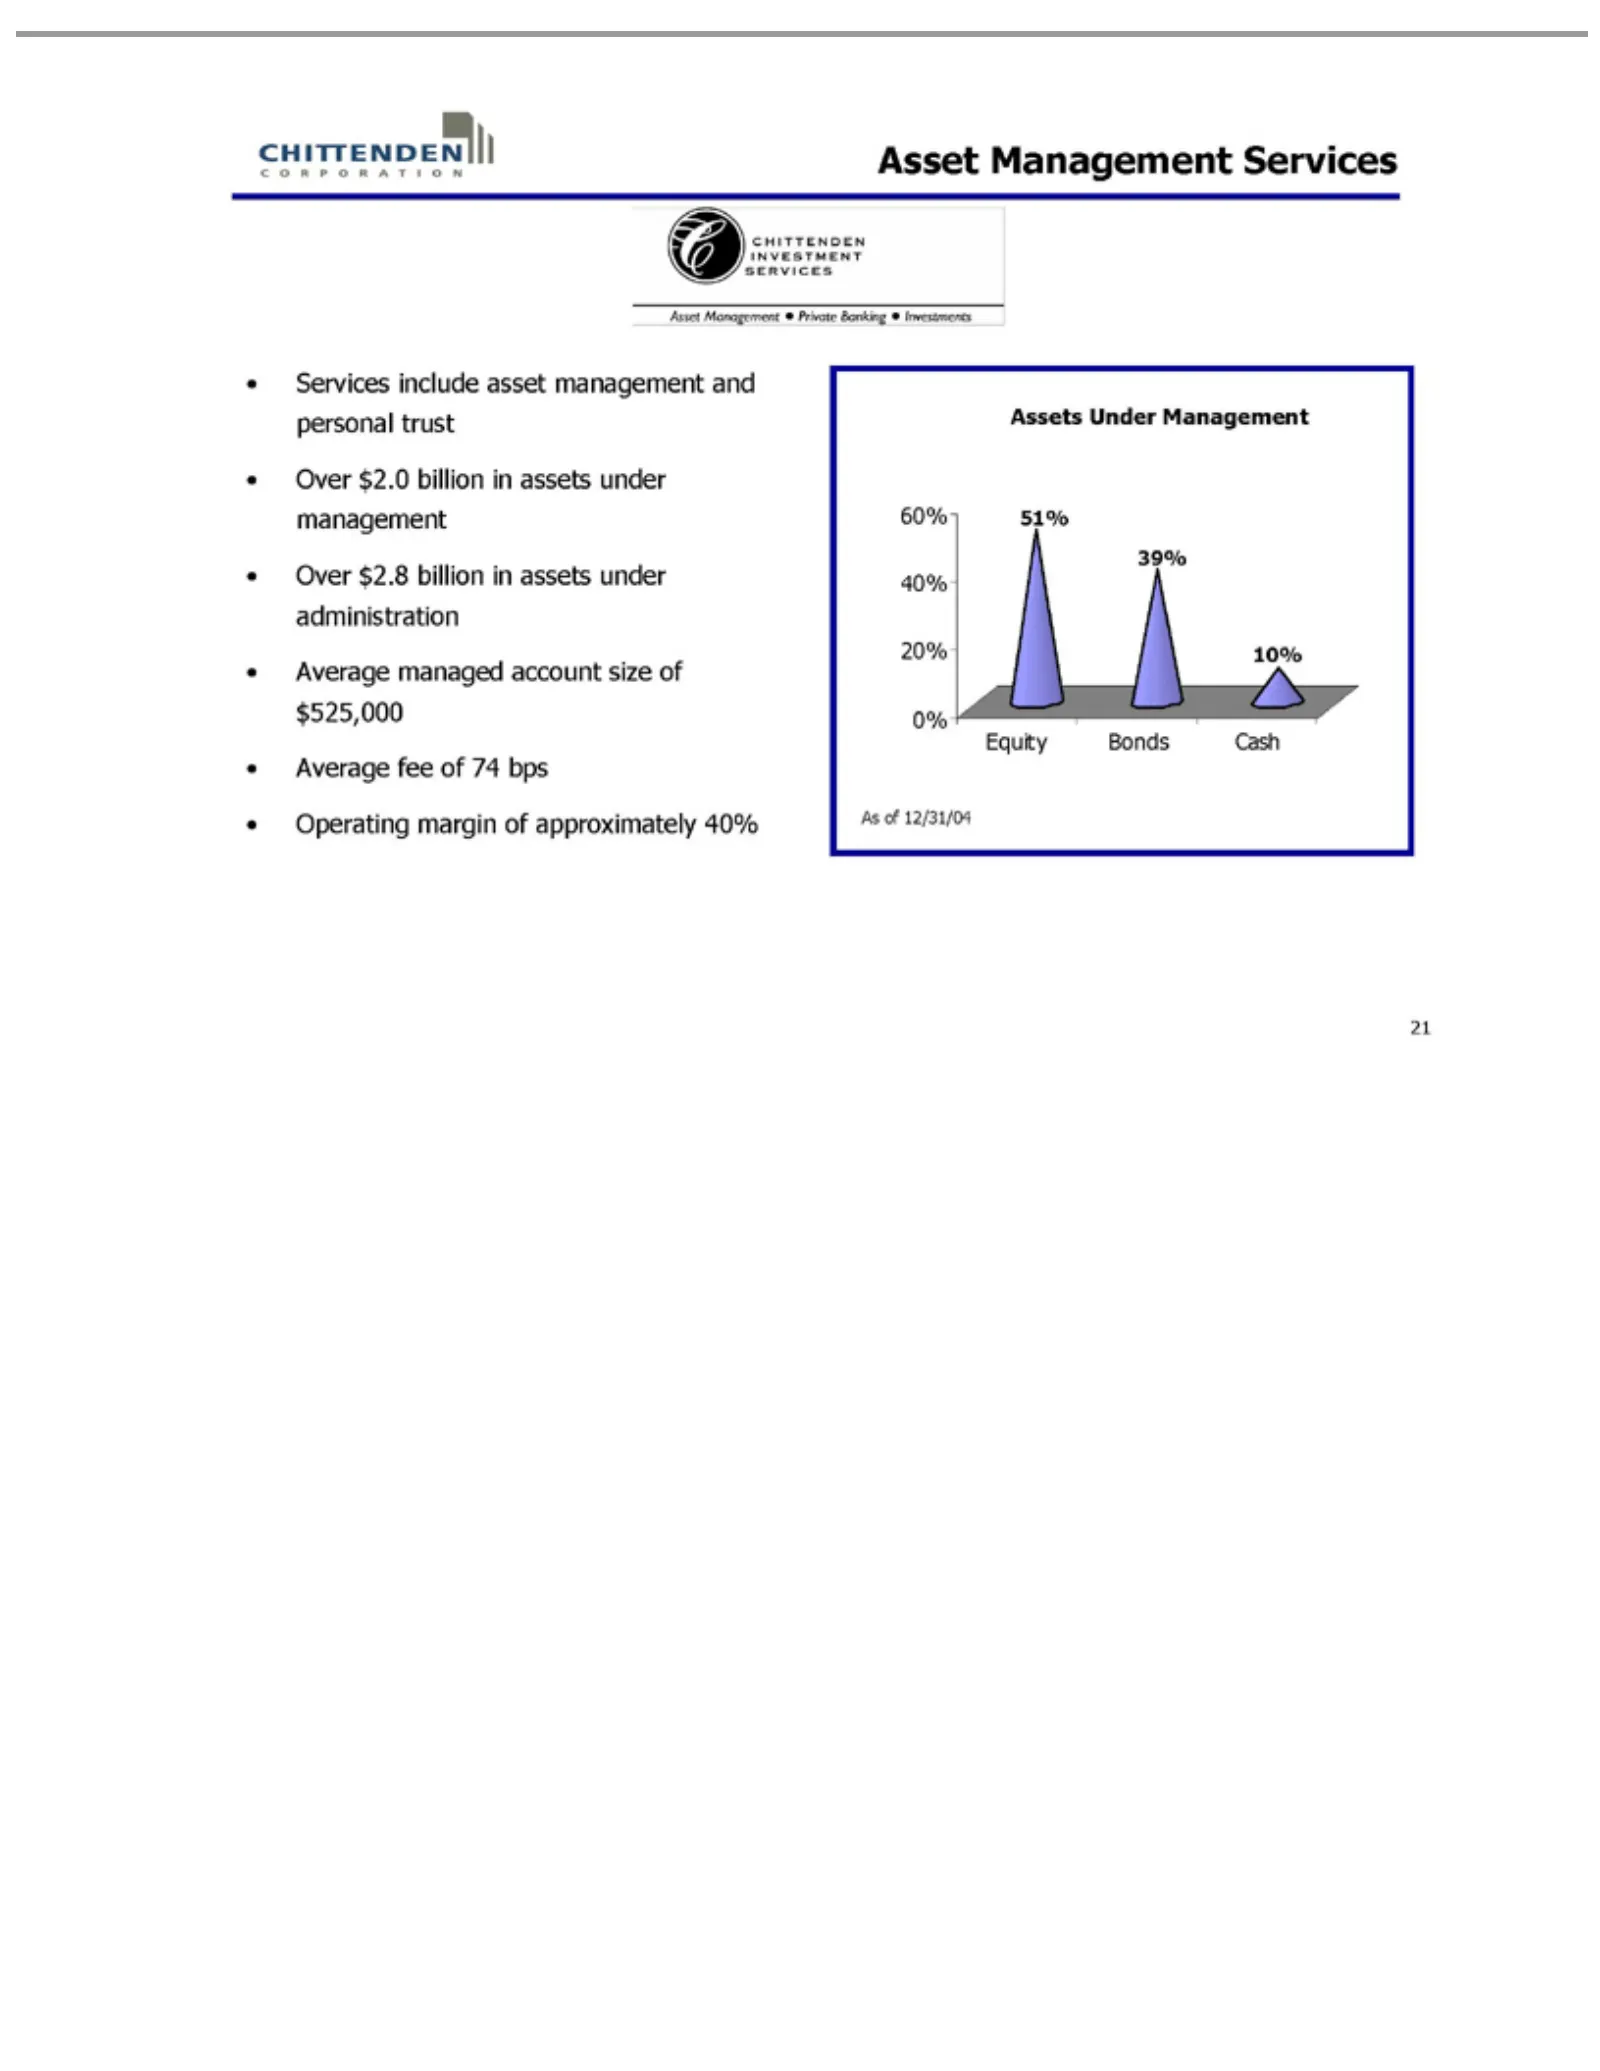
Slide 21: Asset Management Services
Asset Services Average Assets 60% 51% Equity As 21 of39% 40% 12/31/04 Management Under Bonds fee include 20% 10% ofManagement Cash 74 0% asset bps Services Operating managementmargin and personal of approximately trust Over40% $2.0 billion in assets under management Over $2.8 billion in assets under
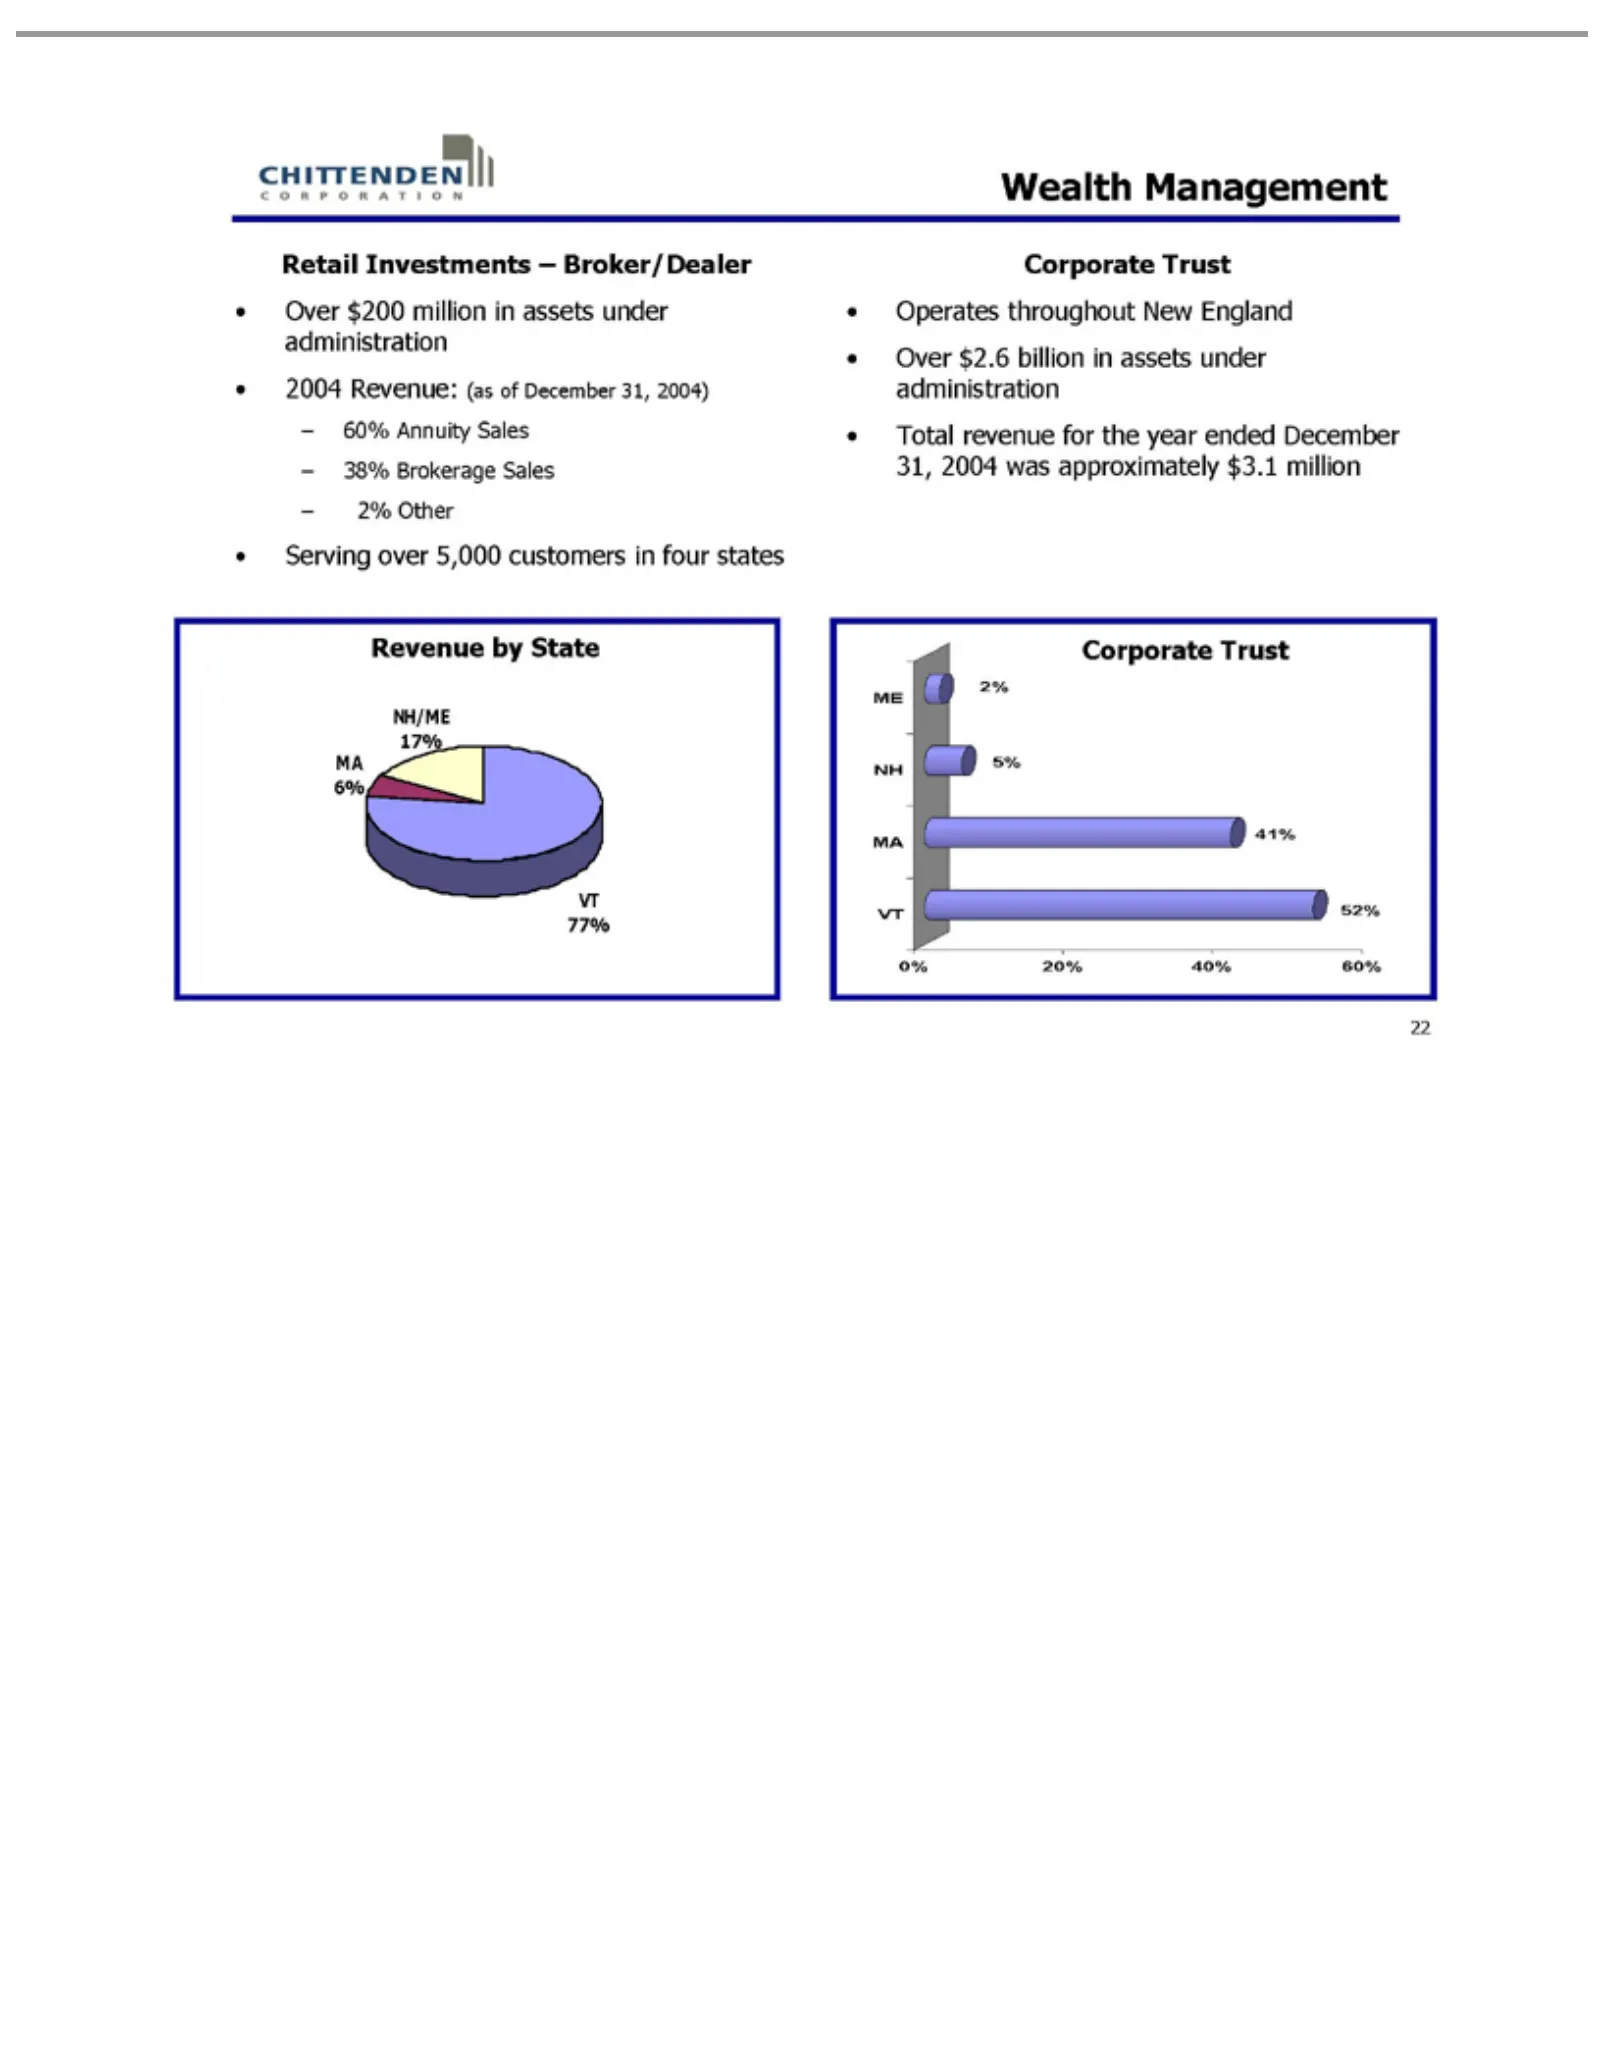
Slide 22: Wealth Retail Investments
Wealth Retail Over 2004 60% 38% Serving Operates Total Revenue MA NH/ME VT Corporate ME 2% 0% 22 77% Other 5% 20% NH 6% Annuity Brokerage $200 Revenue: revenue Investments Management 41% over MA 17% 40% by throughout Trust million State VT 52% 5,000 Sales for 60% (as Sales the in of –customers New B
Slide 23: Financial Performance
Financial Performance 23
Slide 24: Consistent Net Interest Income and Margin
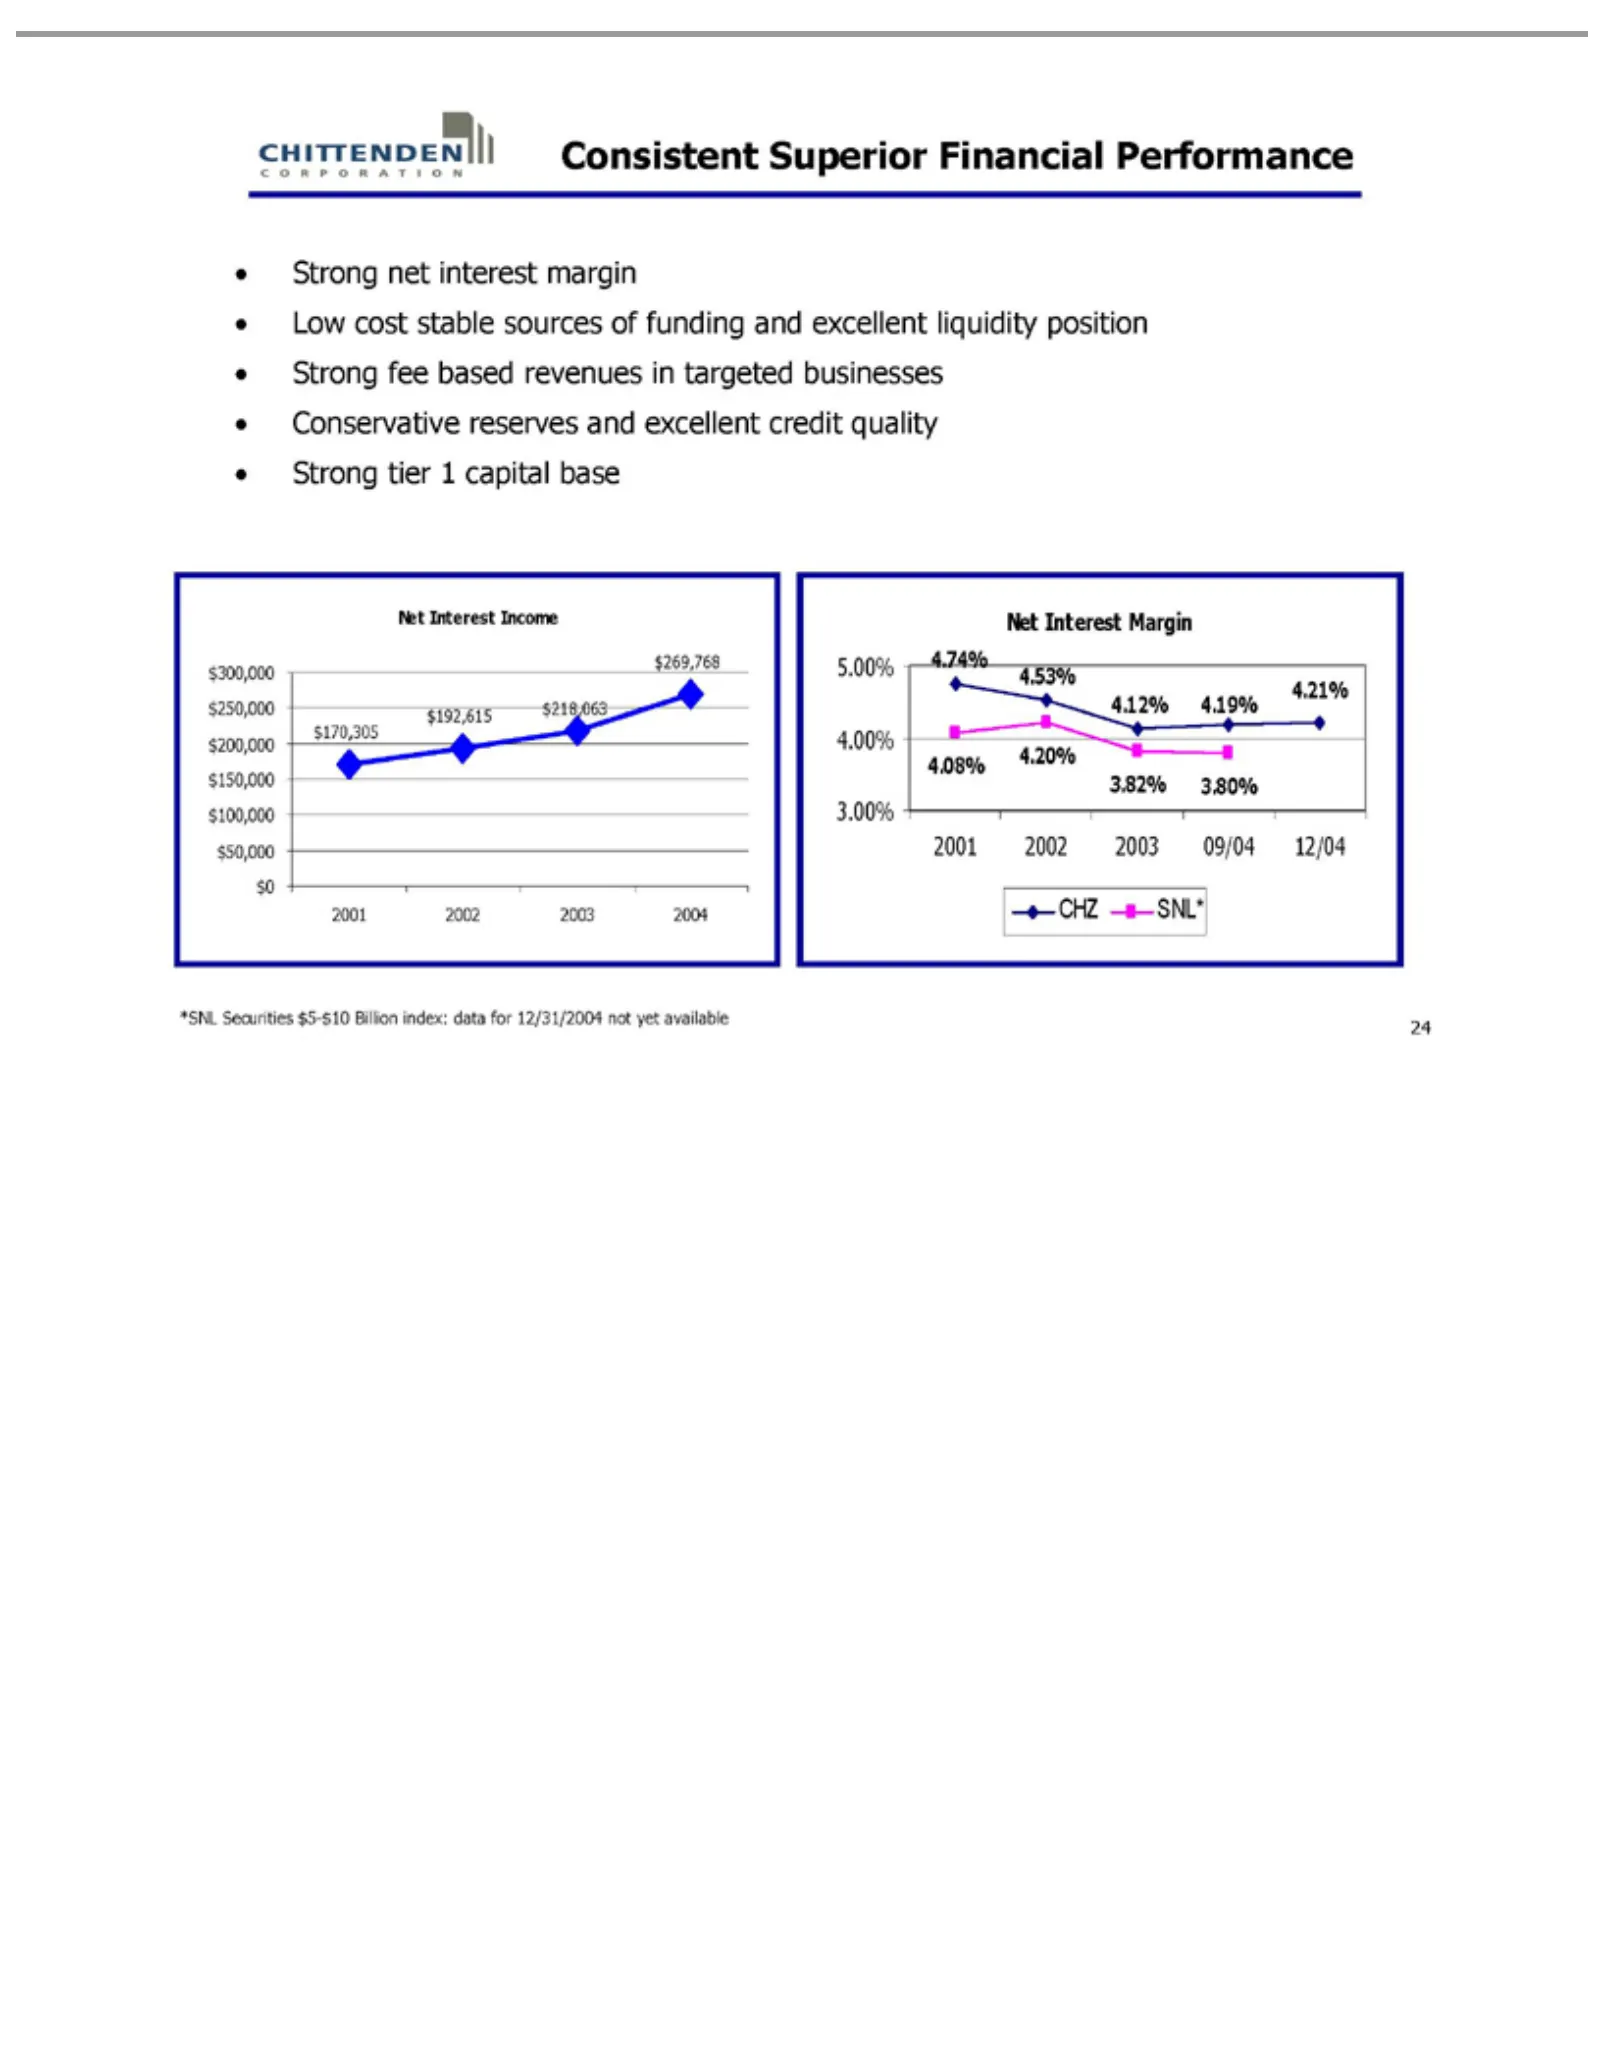
Consistent Strong Low $300,000 Net 5.00% 4.74% 2001 *SNL SNL* CHZ 24 Interest cost 2002 Securities 4.00% 4.53% netstable $250,000 interest Superior 2003 Income Margin 3.00% 4.12% sources 2004 09/04 $5-$10 margin $200,000 Financial 4.19% 12/04 of Billion funding 4.21% $150,000 Performance index: 4.08
Slide 25: Yield on Loans and Securities, Cost of Deposits and Funds
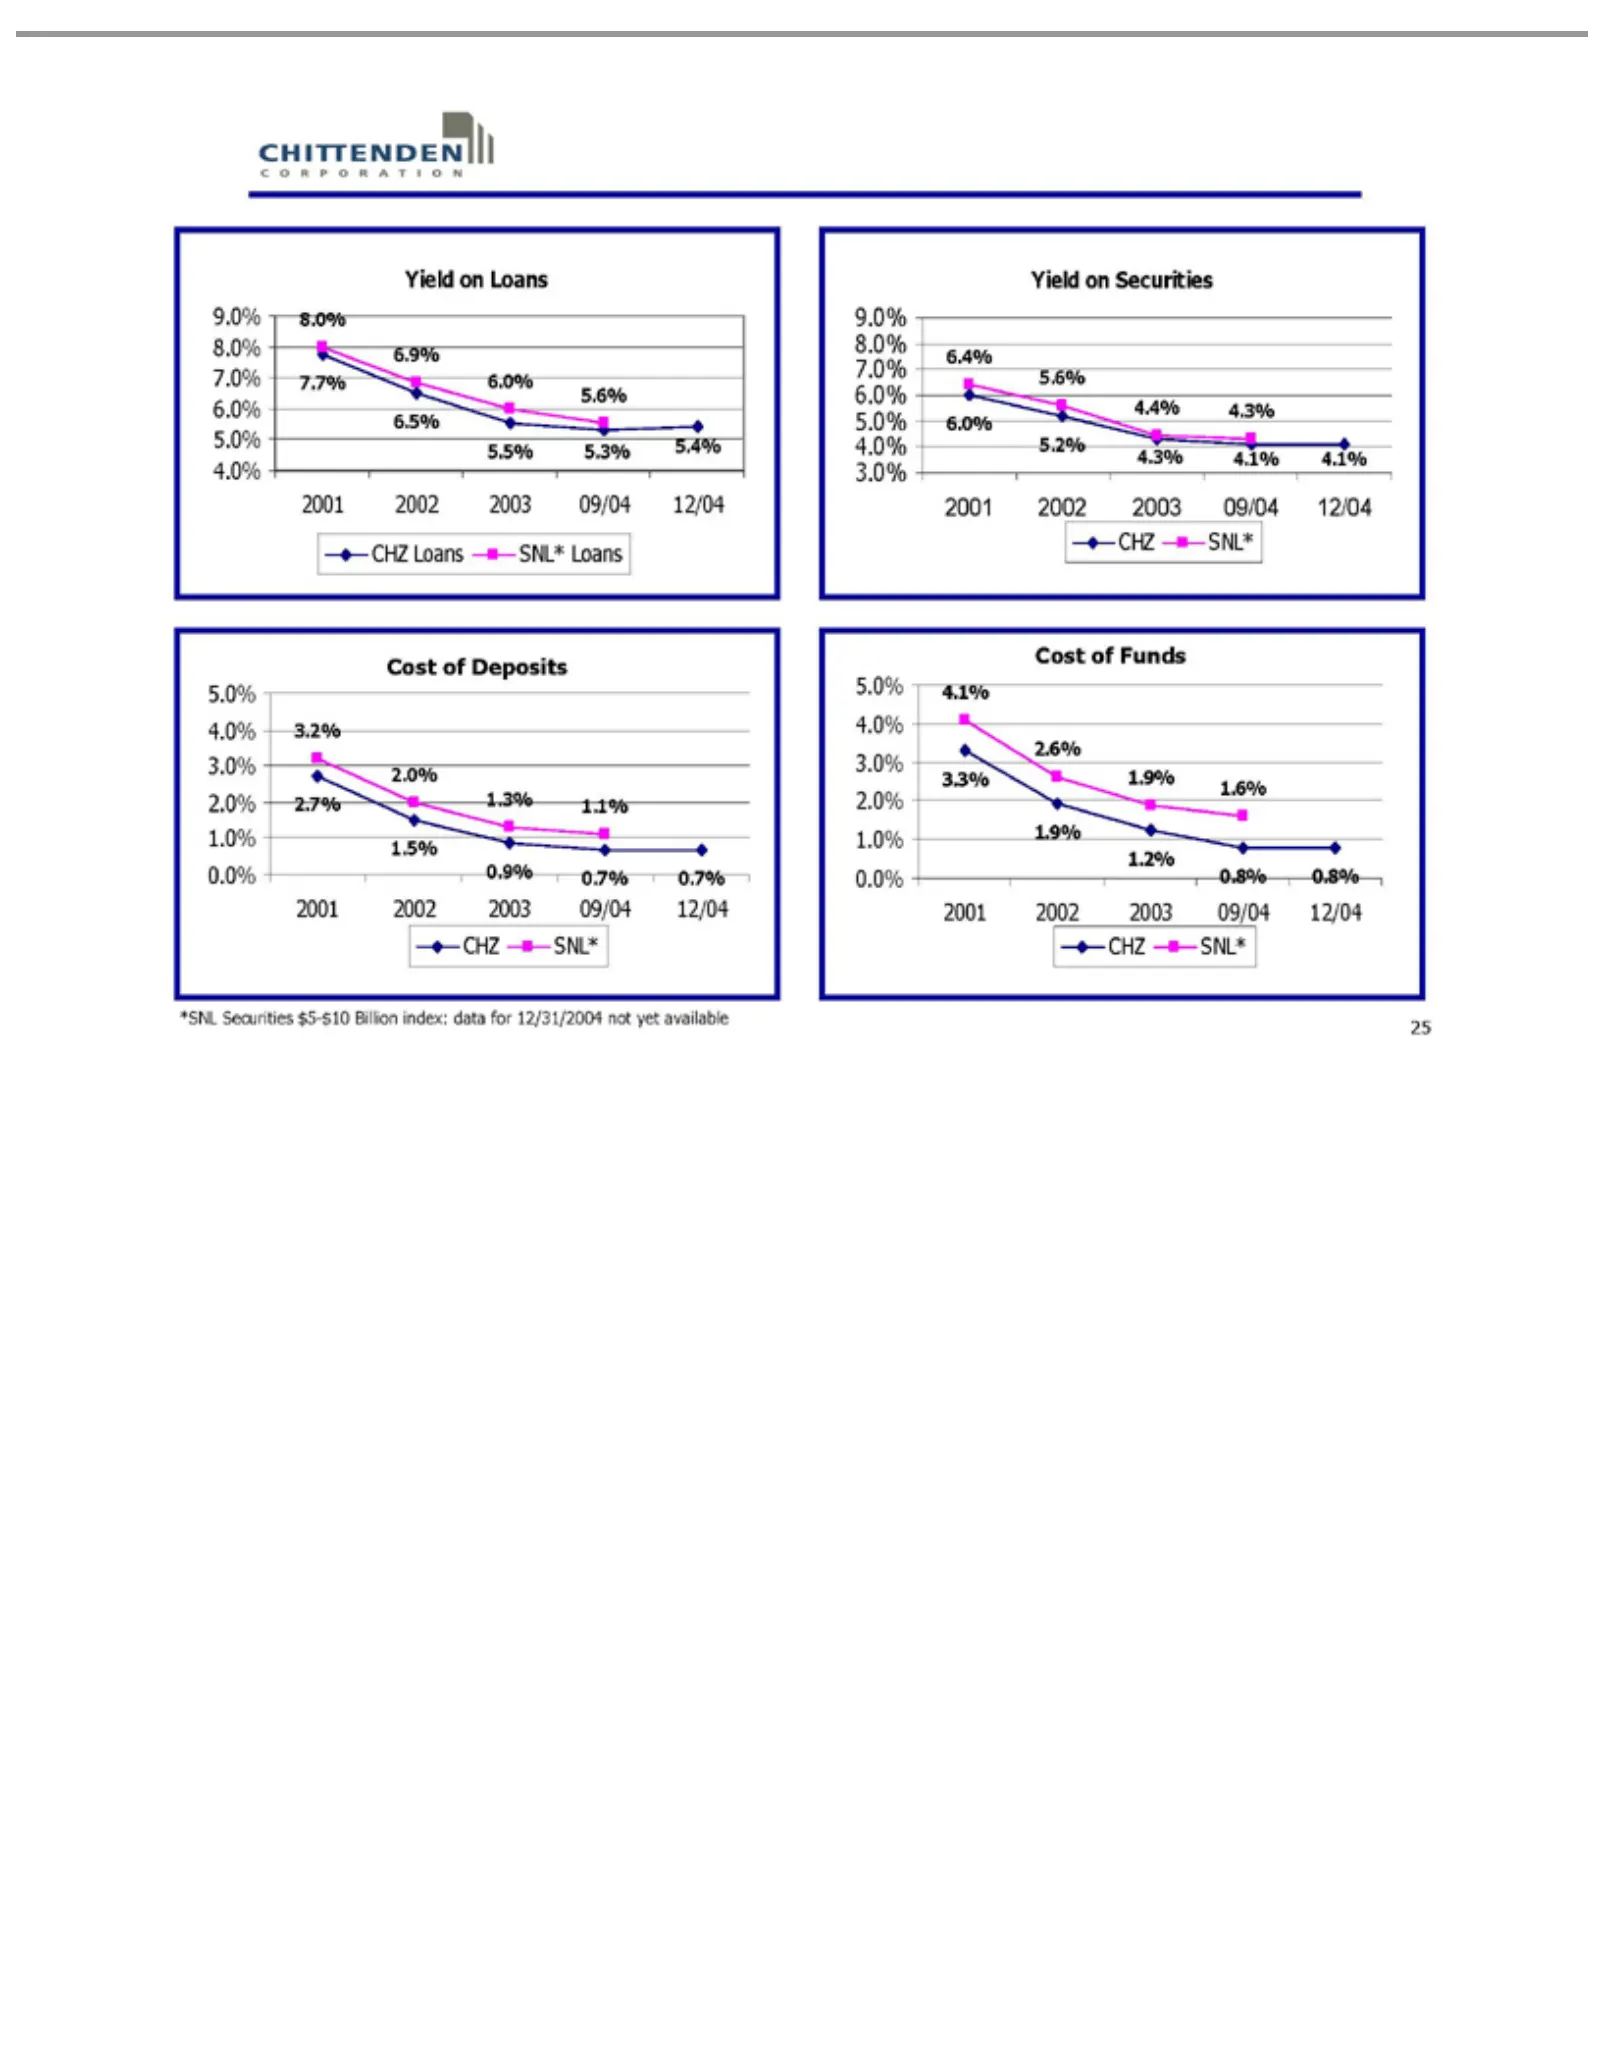
8.0%of Yield 9.0% 6.4% 3.2% Cost 5.0% 4.1% 2001 *SNL SNL* CHZ 25 Loans 2002 6.9% 8.0% 5.6% 2.0% 4.0% 2.6% on Securities Loans Deposits Funds Loans Securities 2003 6.0%09/04 7.0% 4.4% 1.3% 3.0% 1.9% $5-$10 5.6% 12/04 6.0% 4.3% 1.1% 2.0% 1.6% 7.7% 5.0% 6.0% 2.7% 1.0% 3.3% Billion 6.5% 4.0% 5.2% 1.5% 0
Slide 26: Non-Interest Income
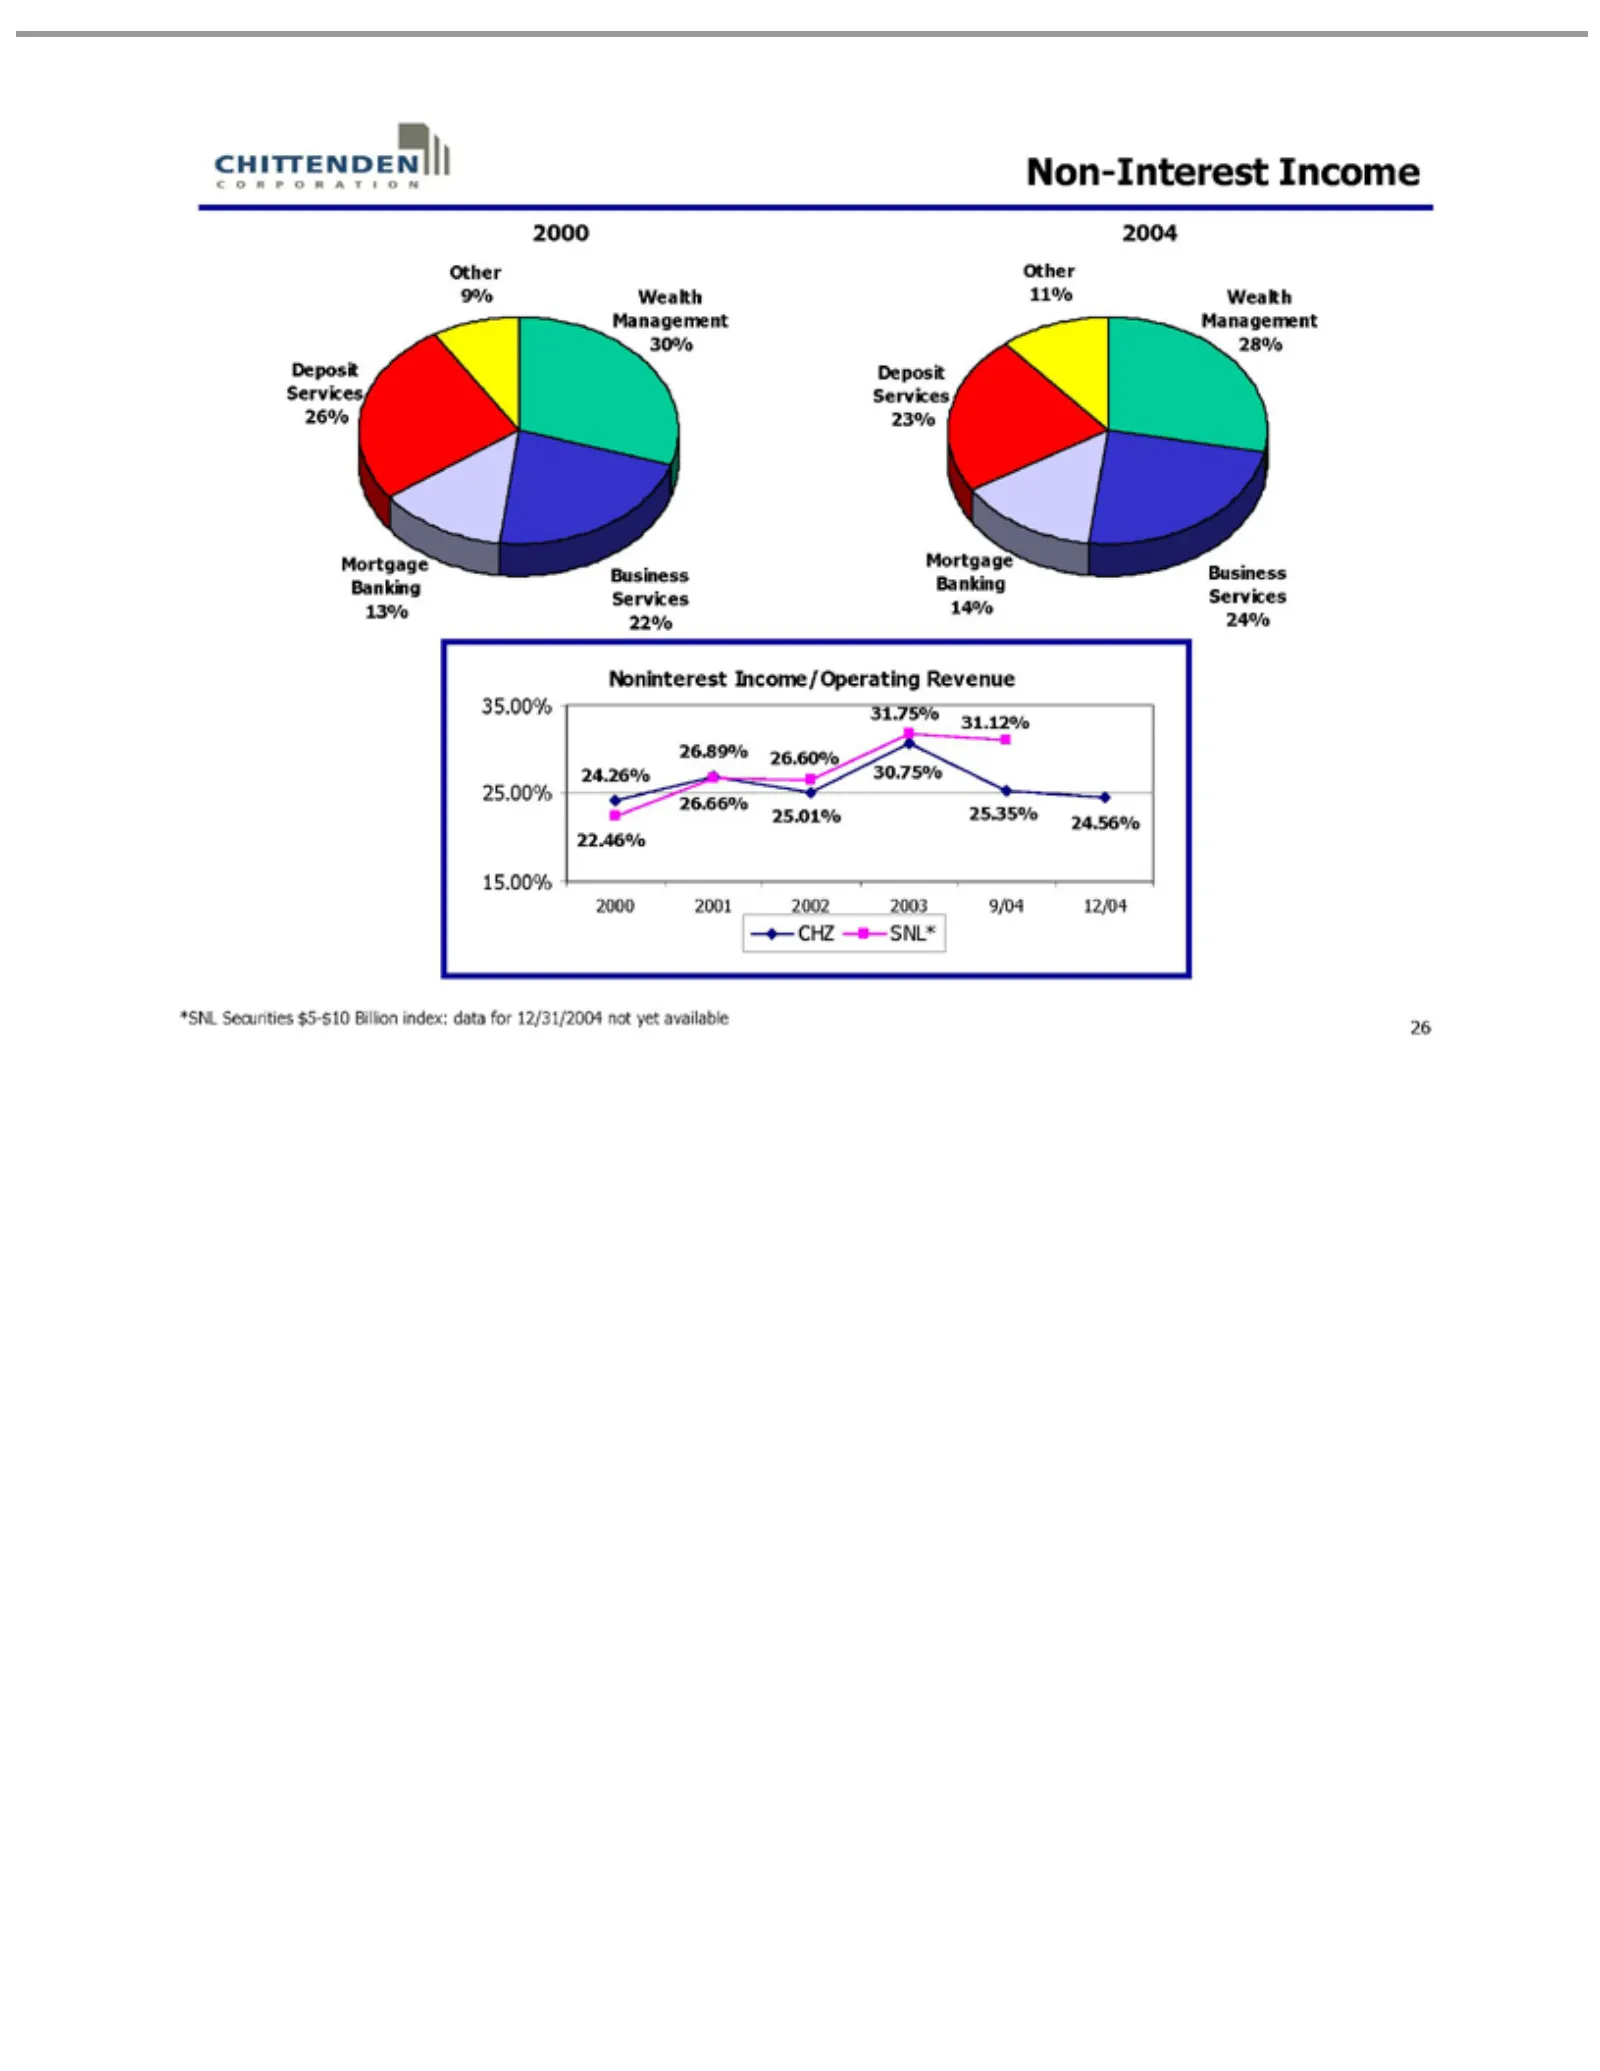
Non-Interest Other 2004 Wealth Business Mortgage Deposit Noninterest 35.00% 24.26% 2000 *SNL SNL* CHZ 26 2001 9% 11% Securities Management 25.00% 26.89% Services Services Banking 2002 Income/Operating Income 15.00% 26.60% 2003 $5-$10 26% 23% 22% 24% 13% 14% 30% 28% 9/04 Billion 31.75% 12/04 Revenue
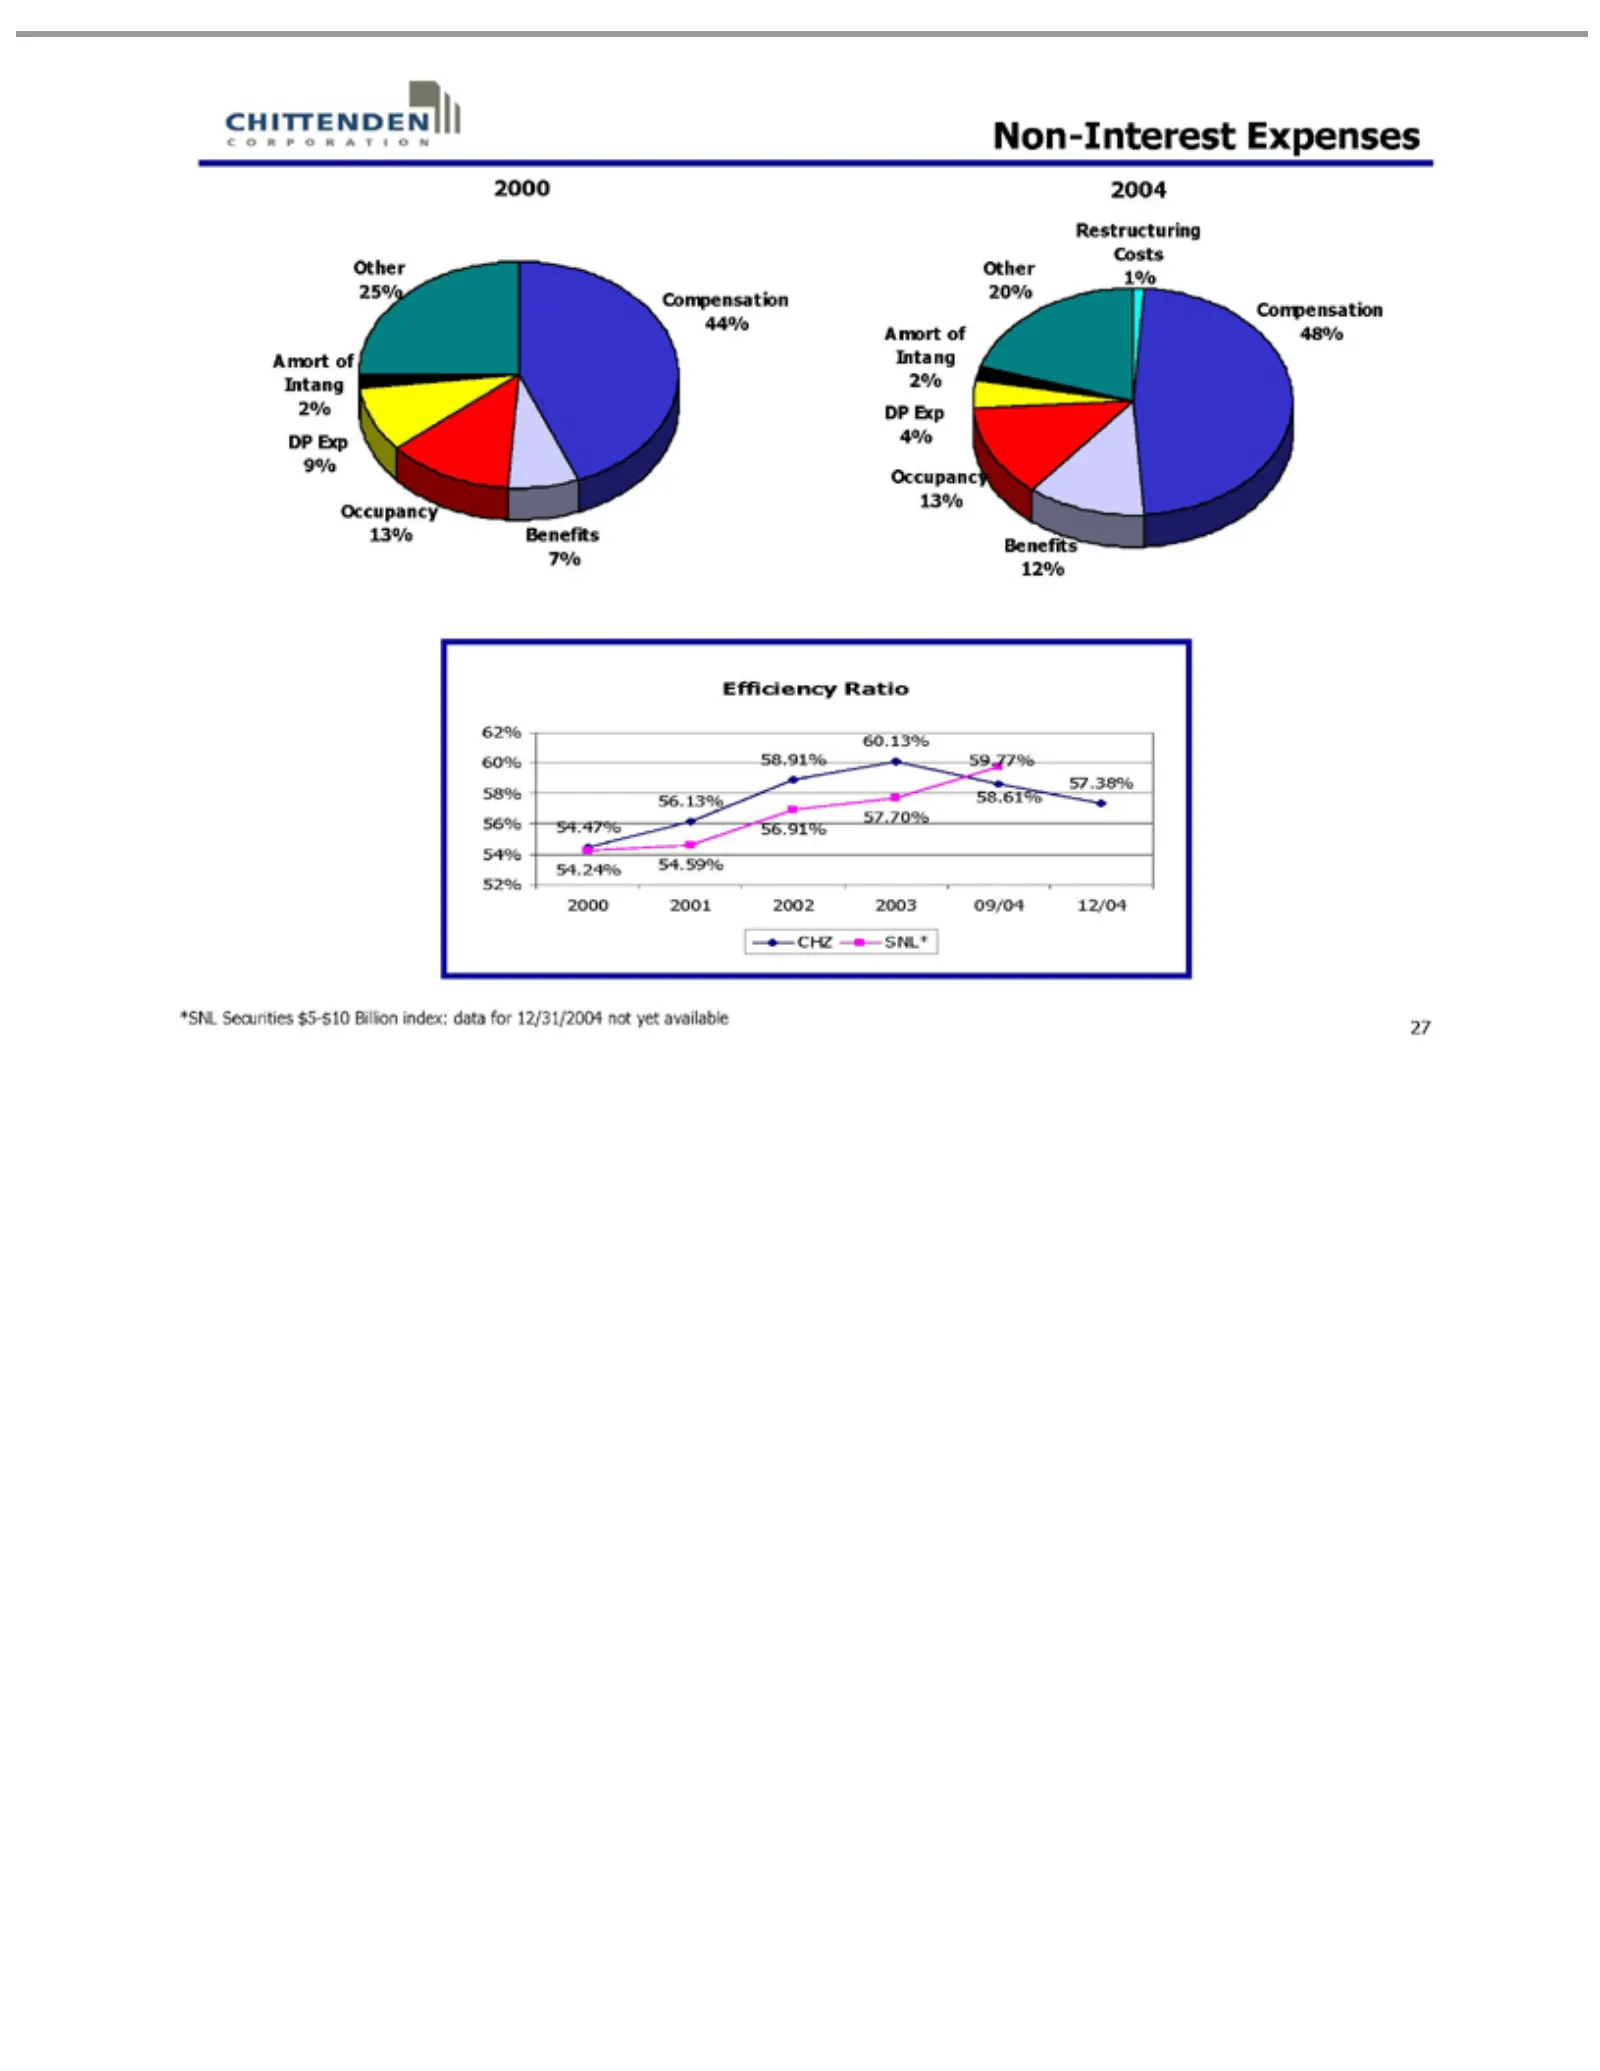
Slide 27: Non-Interest Expense and Efficiency Ratio
Non-Interest Restructuring 2004 Compensation Benefits Occupancy DP Amort Other Efficiency 62% 54.47% 2000 *SNL SNL* CHZ 27 Exp 60% 2001 25% 20% Securities of56.13% 9% 4% 7% 12% Intang 58% Ratio 2002 13% Expenses Costs 44% 48% 56% 58.91% 2% 2003 $5-$10 1% 54% 09/04 Billion 60.13% 52% 12/04 index: 59.
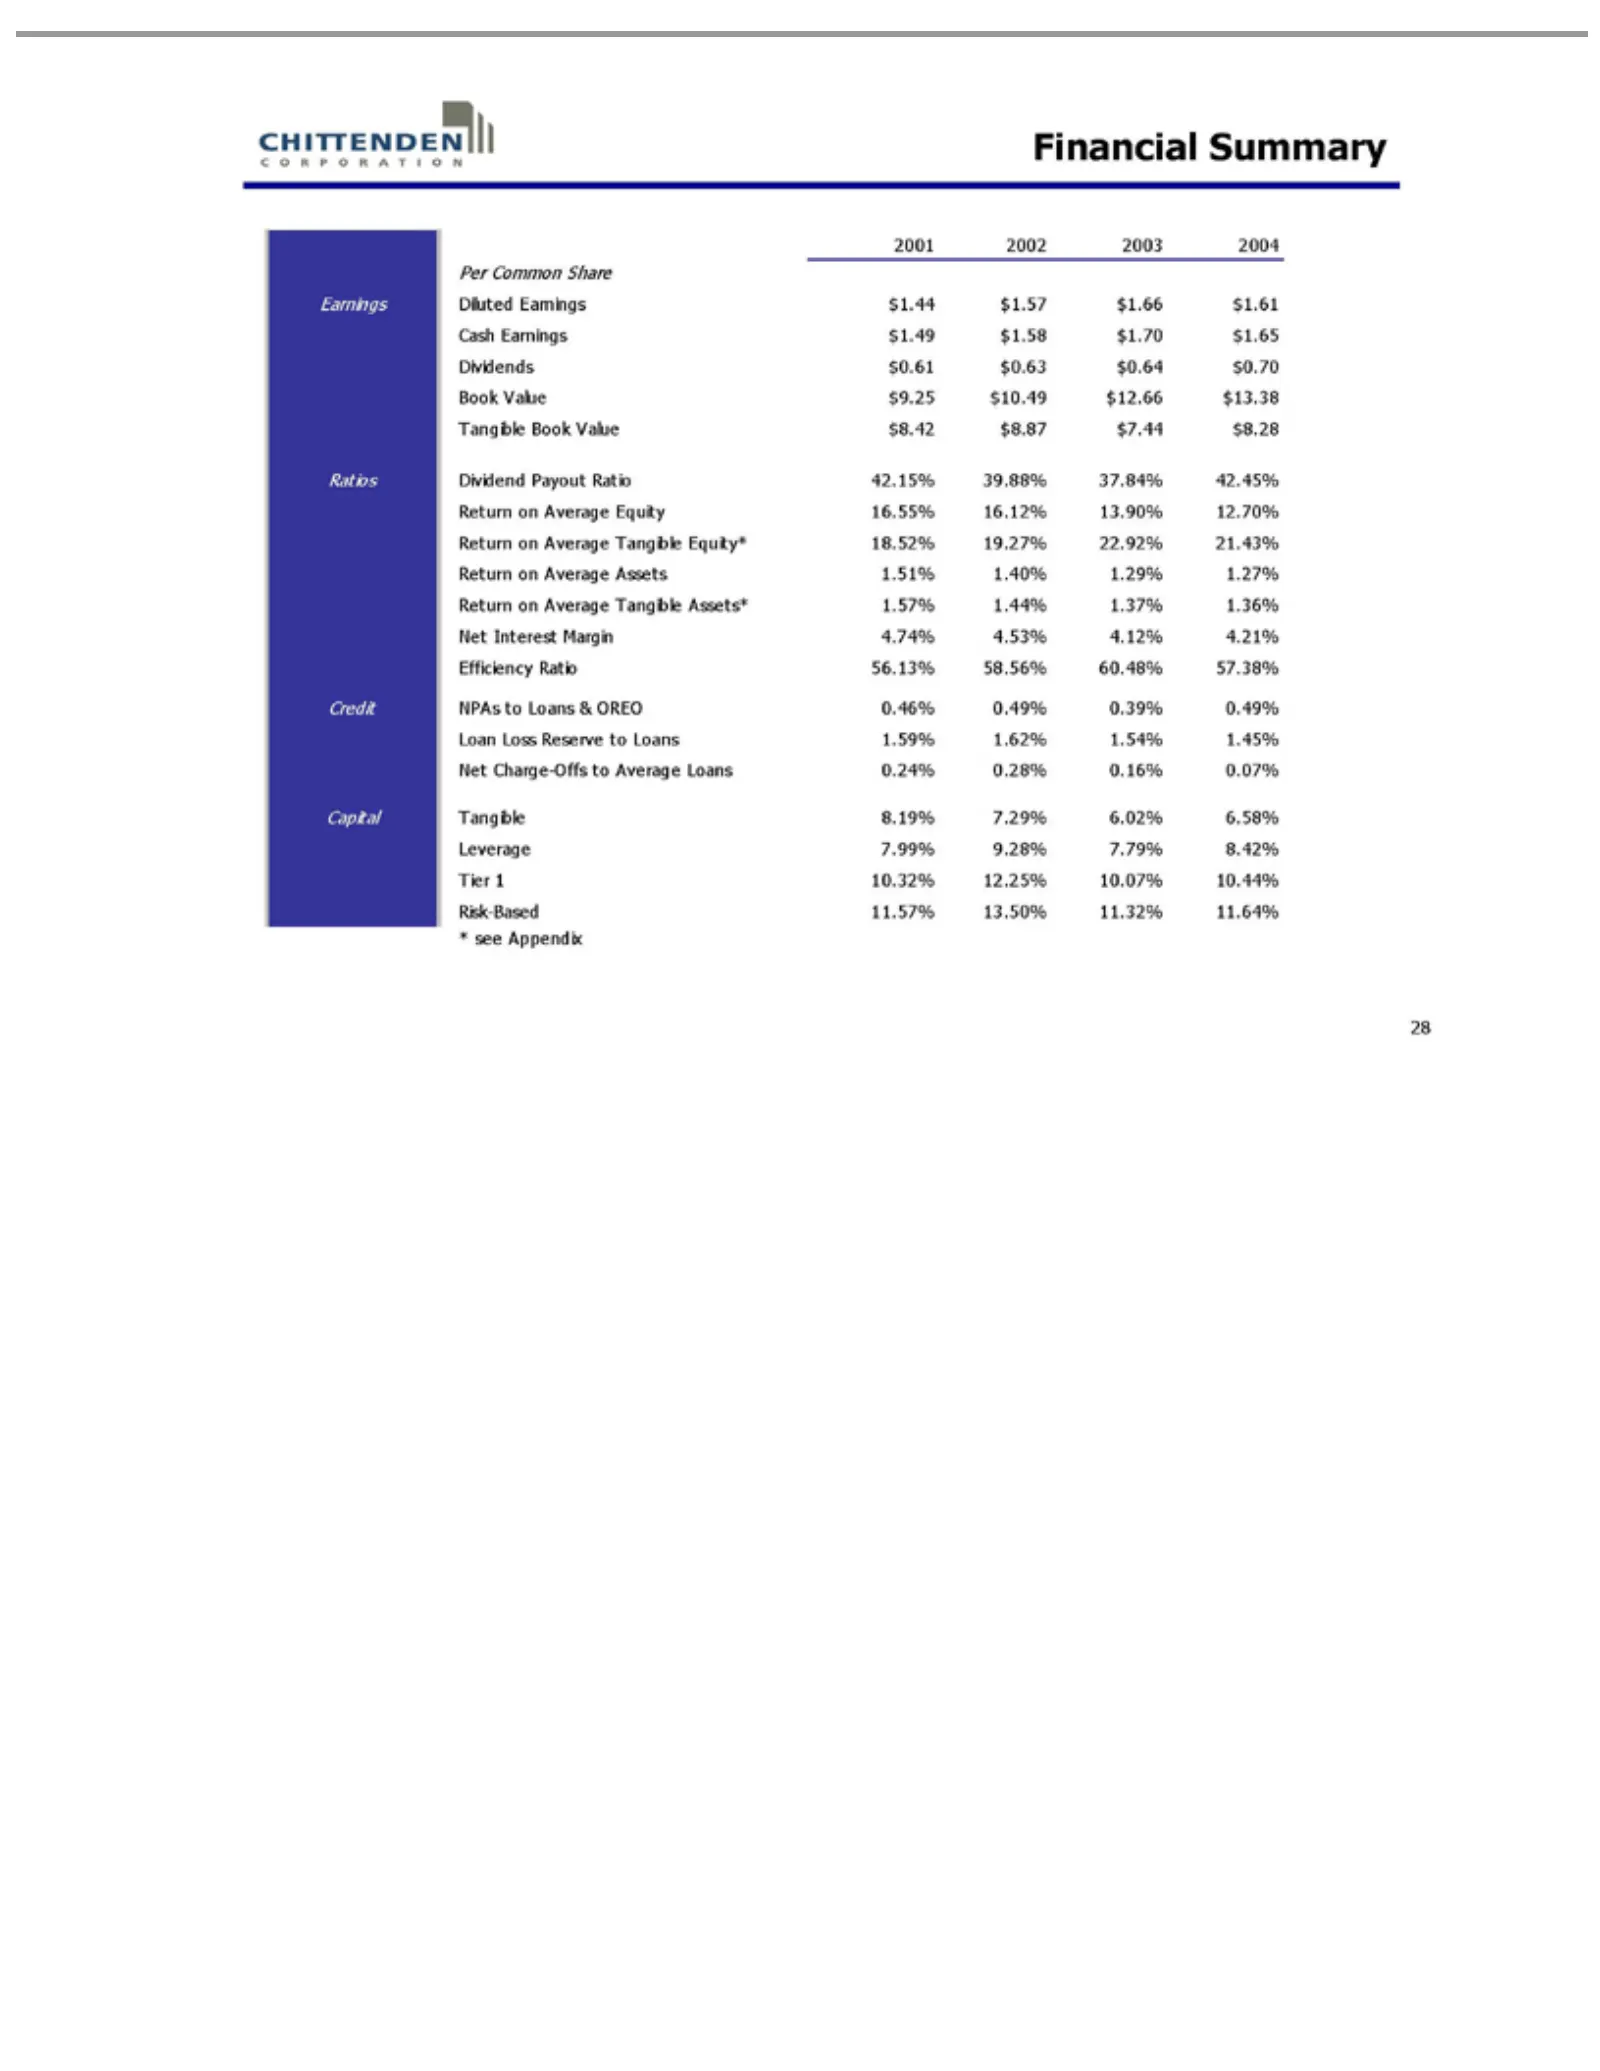
Slide 28: Financial Summary and Ratios
Financial 2001 Capital Credit Ratios Earnings Per Diluted Cash Dividends Book Dividend Return Efficiency NPAs Loan Net Tangible Leverage Tier Risk-Based * 28seeCommon Interest Charge-Offs 1Appendix 2002 Earnings Loss Value to 10.32% on Earnings Loans Book 8.19% 7.99% Summary Payout Average $0.61 Rat
Slide 29: Risk Management
Risk Management 29
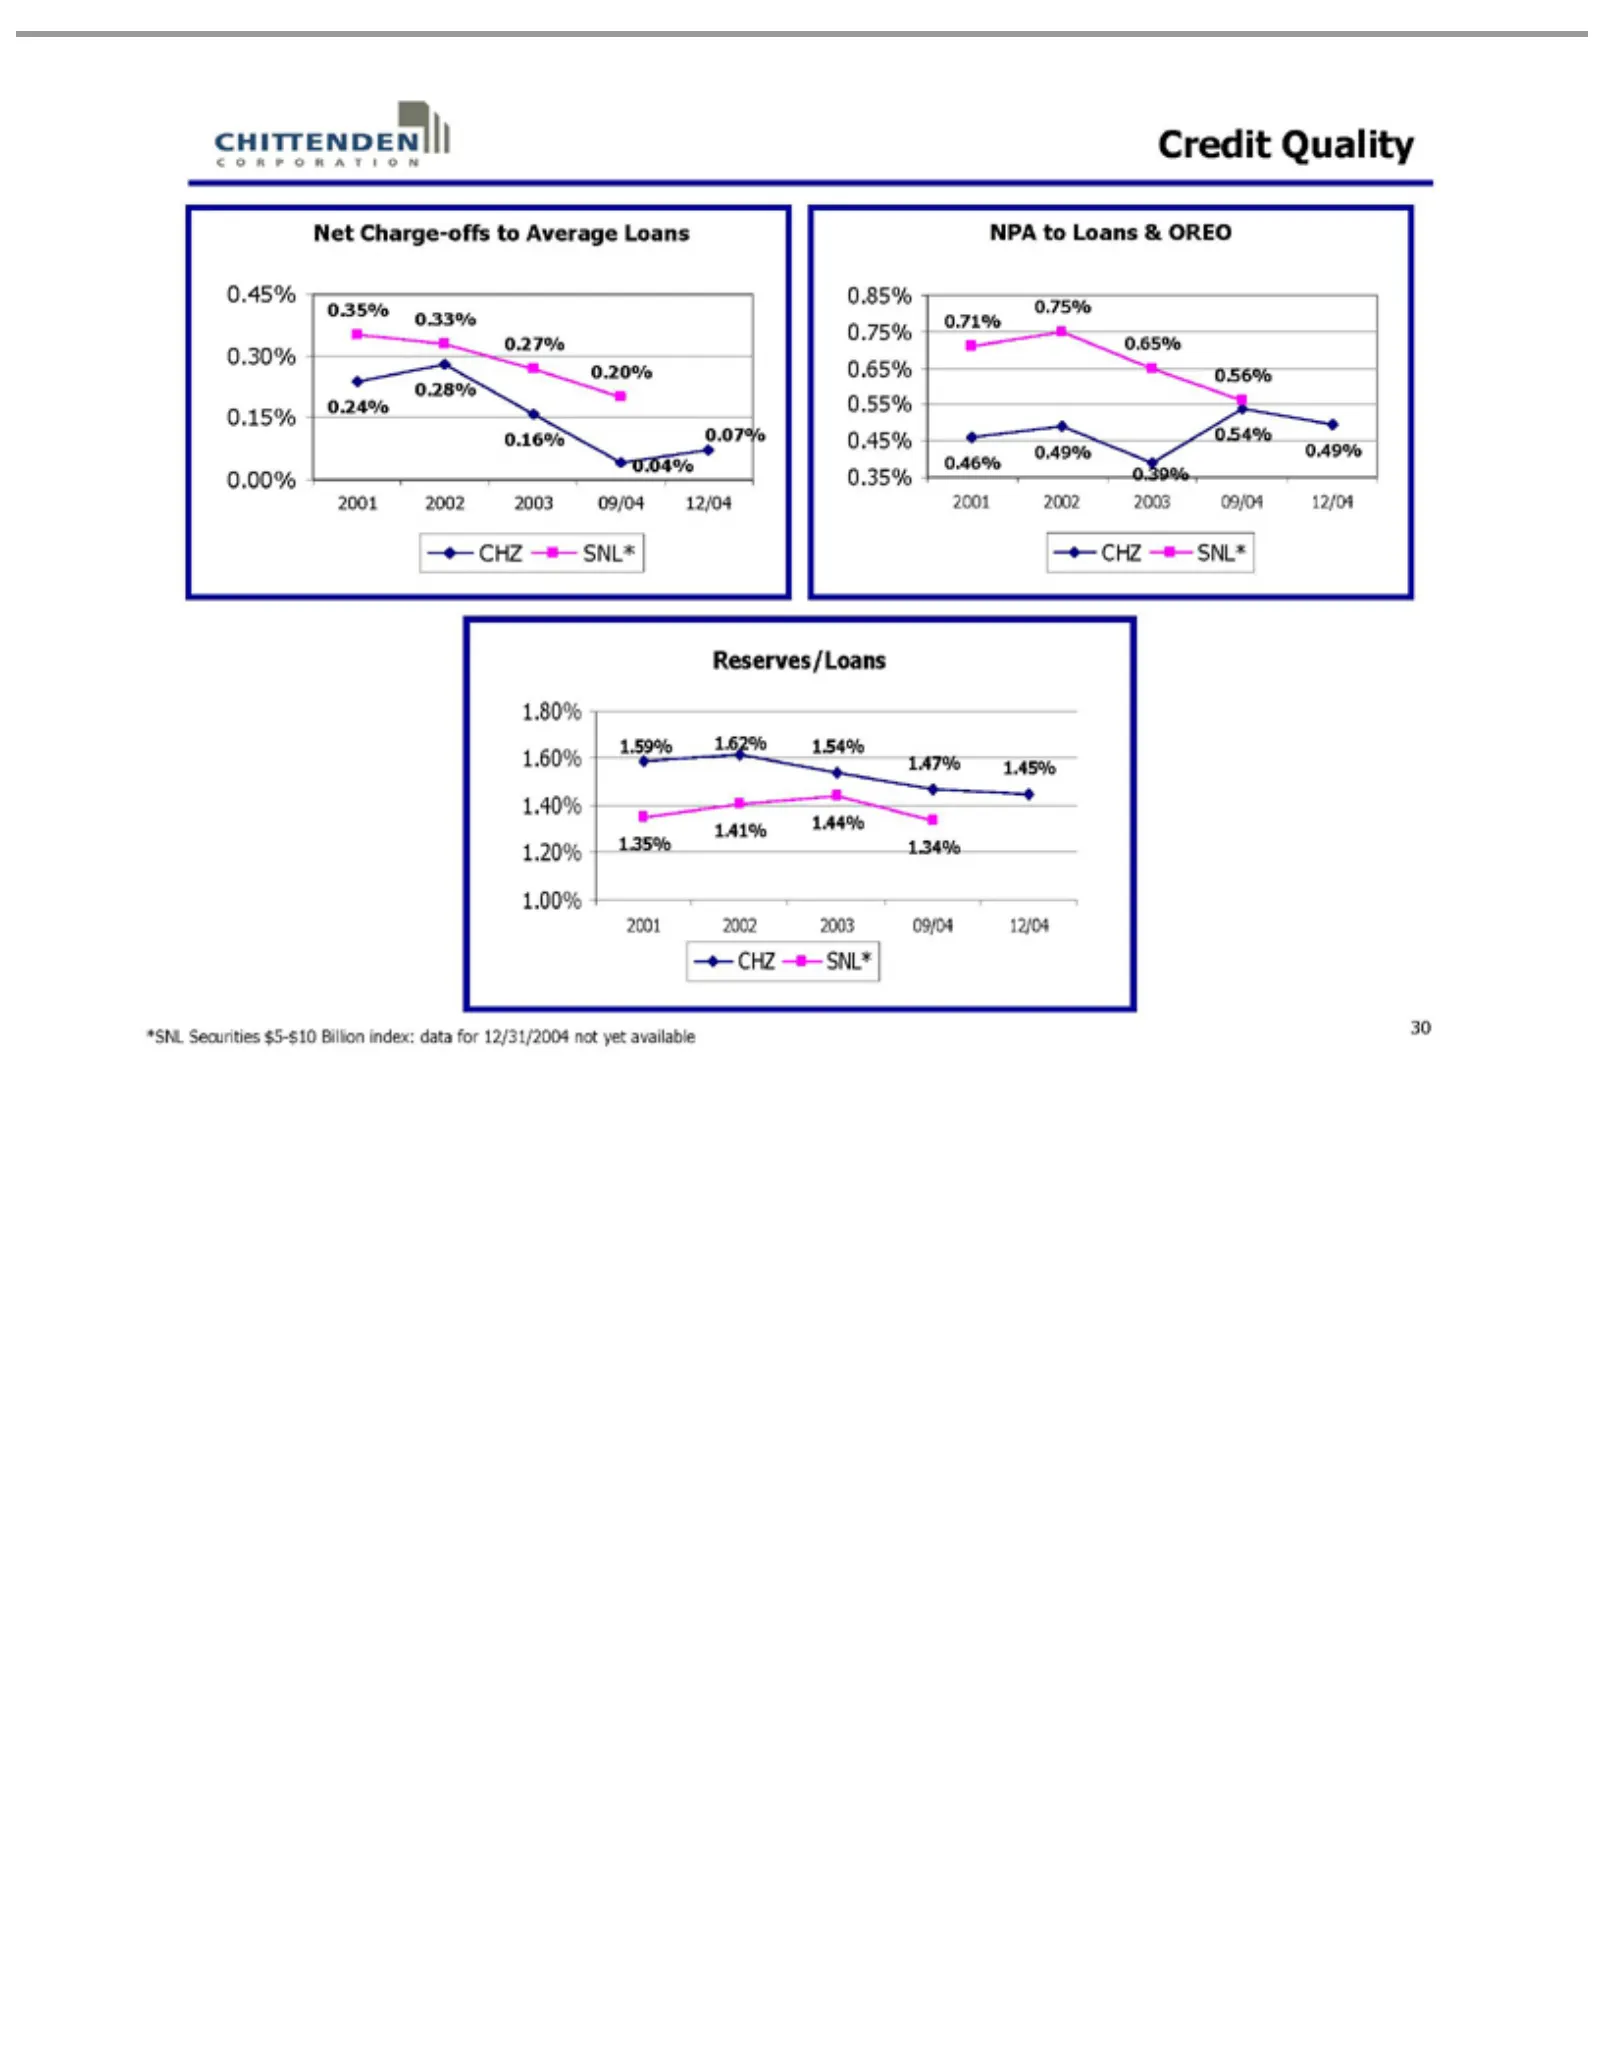
Slide 30: Credit Quality
Credit Net 0.45% 0.35% NPA 0.85% 0.71% 1.80% Reserves/Loans 1.59% 2001 *SNL SNL* CHZ 30 Charge-offs to 2002 Securities Quality 0.30% 0.33% 0.75% 1.60% 1.62% Loans 20030.15% 0.27% 0.65% 1.40% 1.54% & to 09/04 $5-$10 OREO Average 0.00% 0.20% 0.55% 0.56% 1.20% 1.47% 12/04 Billion Loans 0.07% 0.45% 0.46
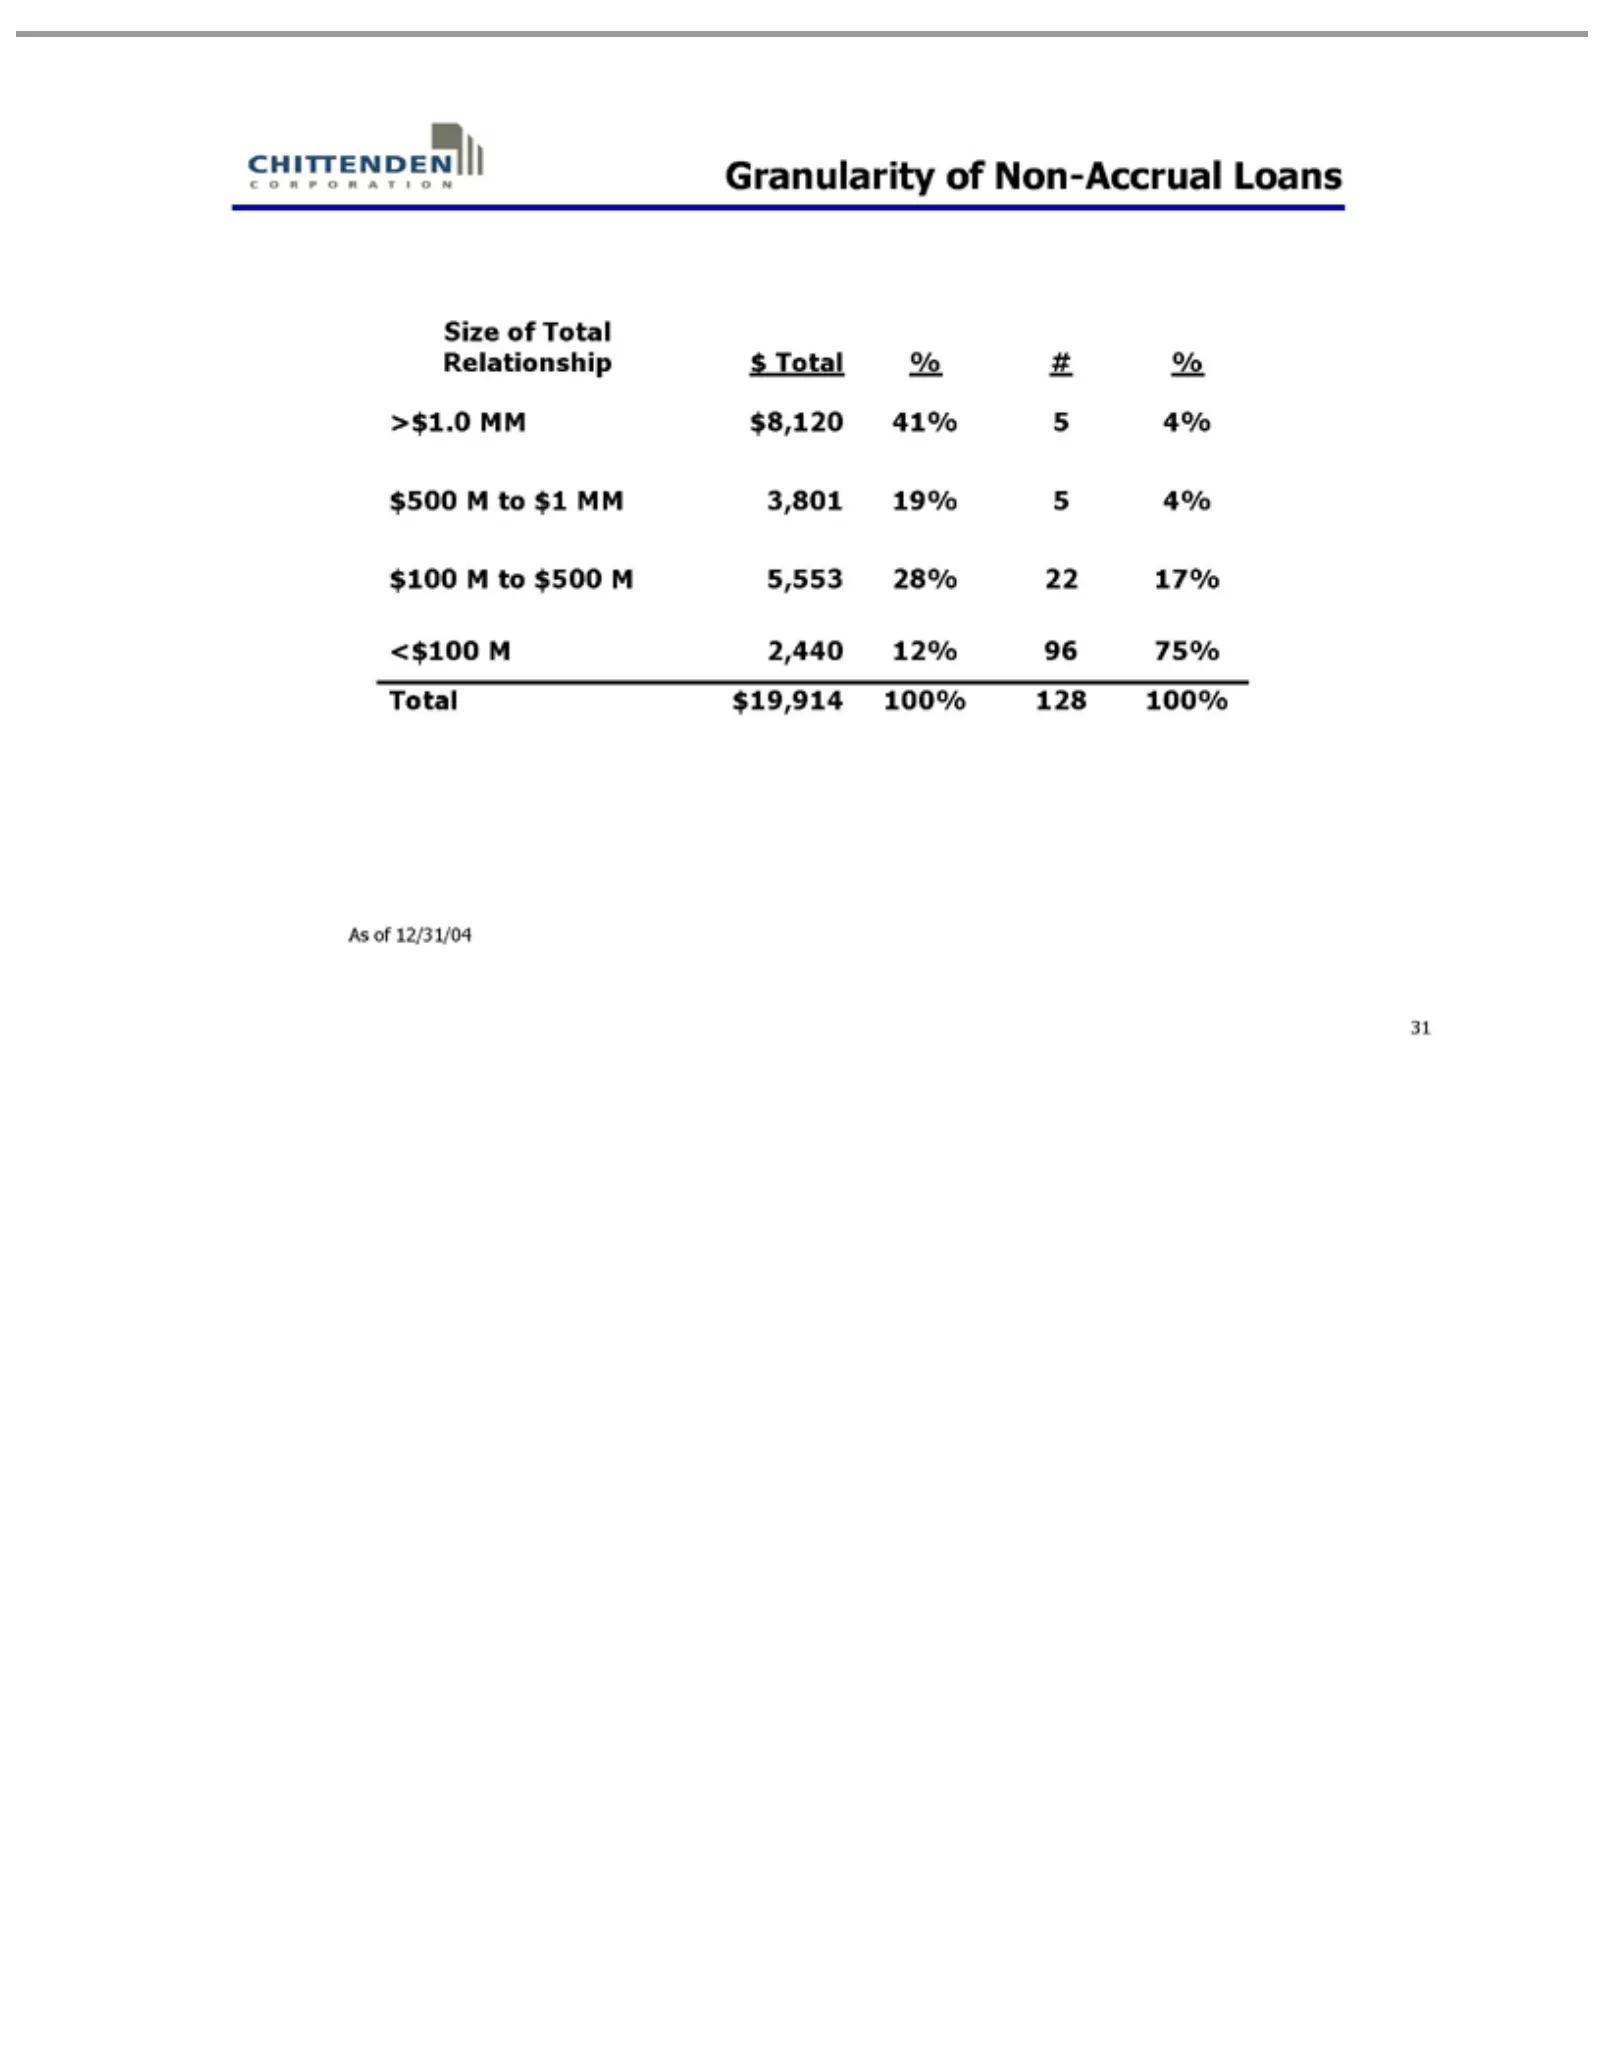
Slide 31: Loan Granularity and Relationship Size
Granularity Size Relationship >$1.0 $500 $100 <$100 Total As 31 ofof M $19,914 12/31/04 MM M Total to2,440 $1 $500 $8,120 of$MM 100% Non-Accrual Total 12% M 41% 3,801 5,553 % 128 96#575% 100% % 19% 28% 4%Loans 5224% 17%
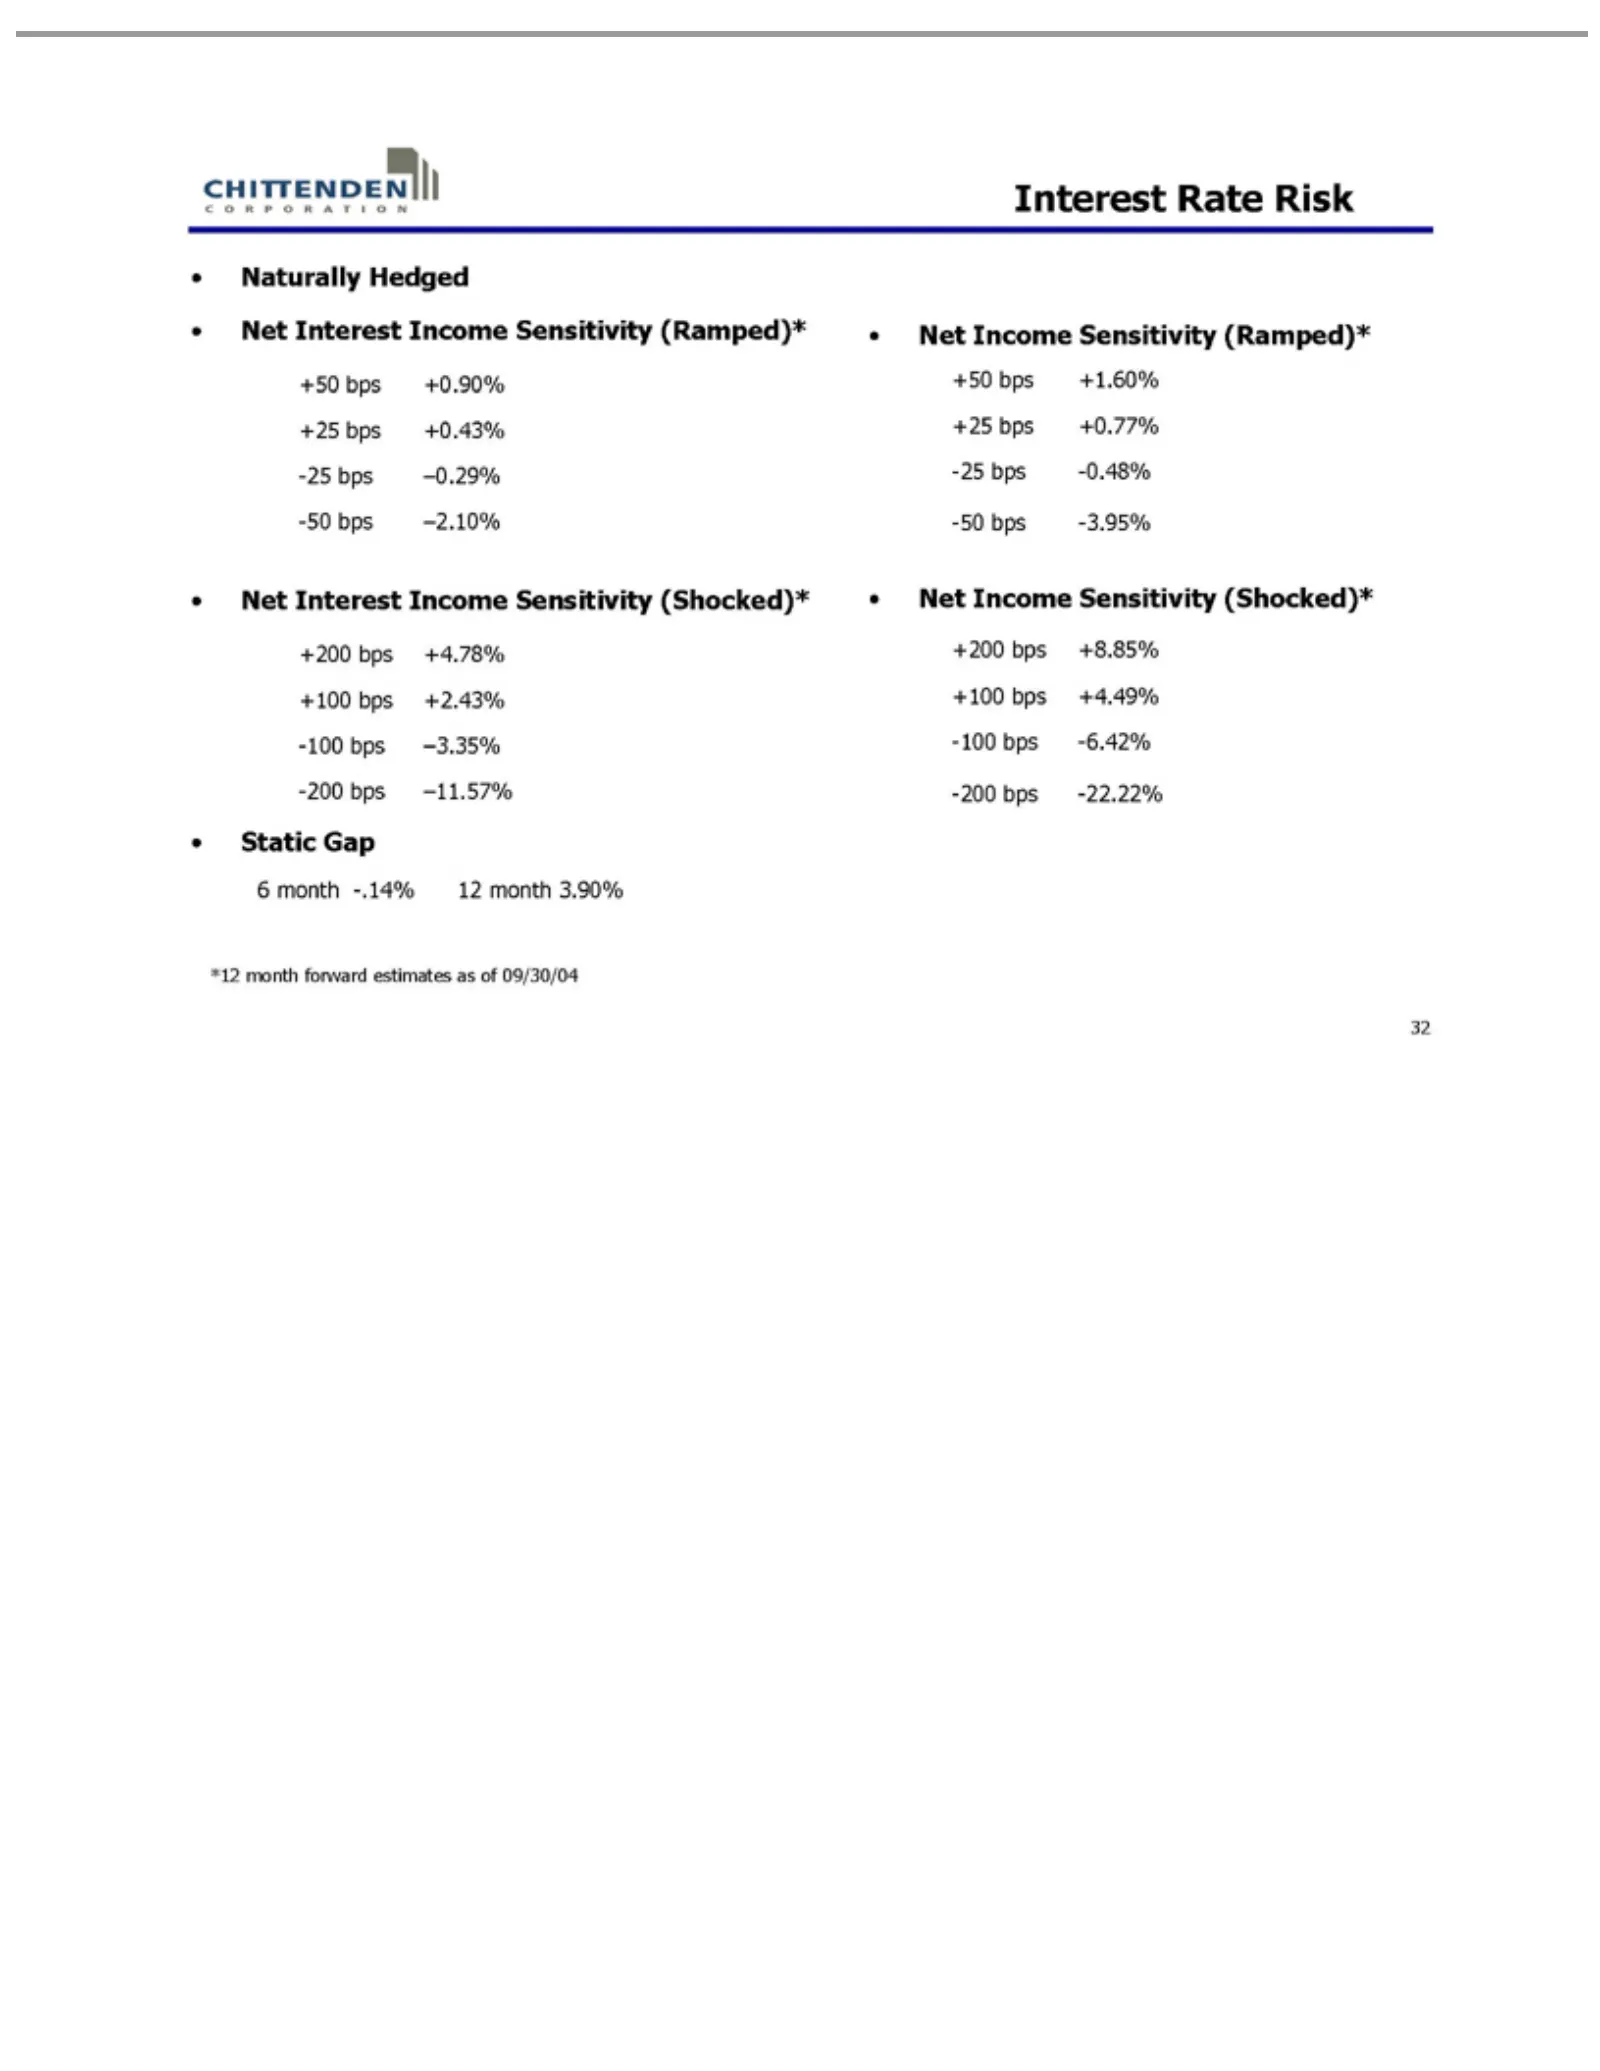
Slide 32: Interest Rate Risk and Sensitivity
Interest Naturally +0.90% +4.78% Static 6 +50 -50 +1.60% Net -3.95% +200 -200 +8.85% *12 -22.22% 32month bps Interest Income month bps bps bps Gap Rate +0.43% +2.43% +0.77% +4.49% +25 -.14% +100 Hedged forward Income Sensitivity bps Risk 12 bps –0.29% –3.35% -0.48% -6.42% -25 month -100 estimates Se

Slide 33: In Summary
In Summary 33
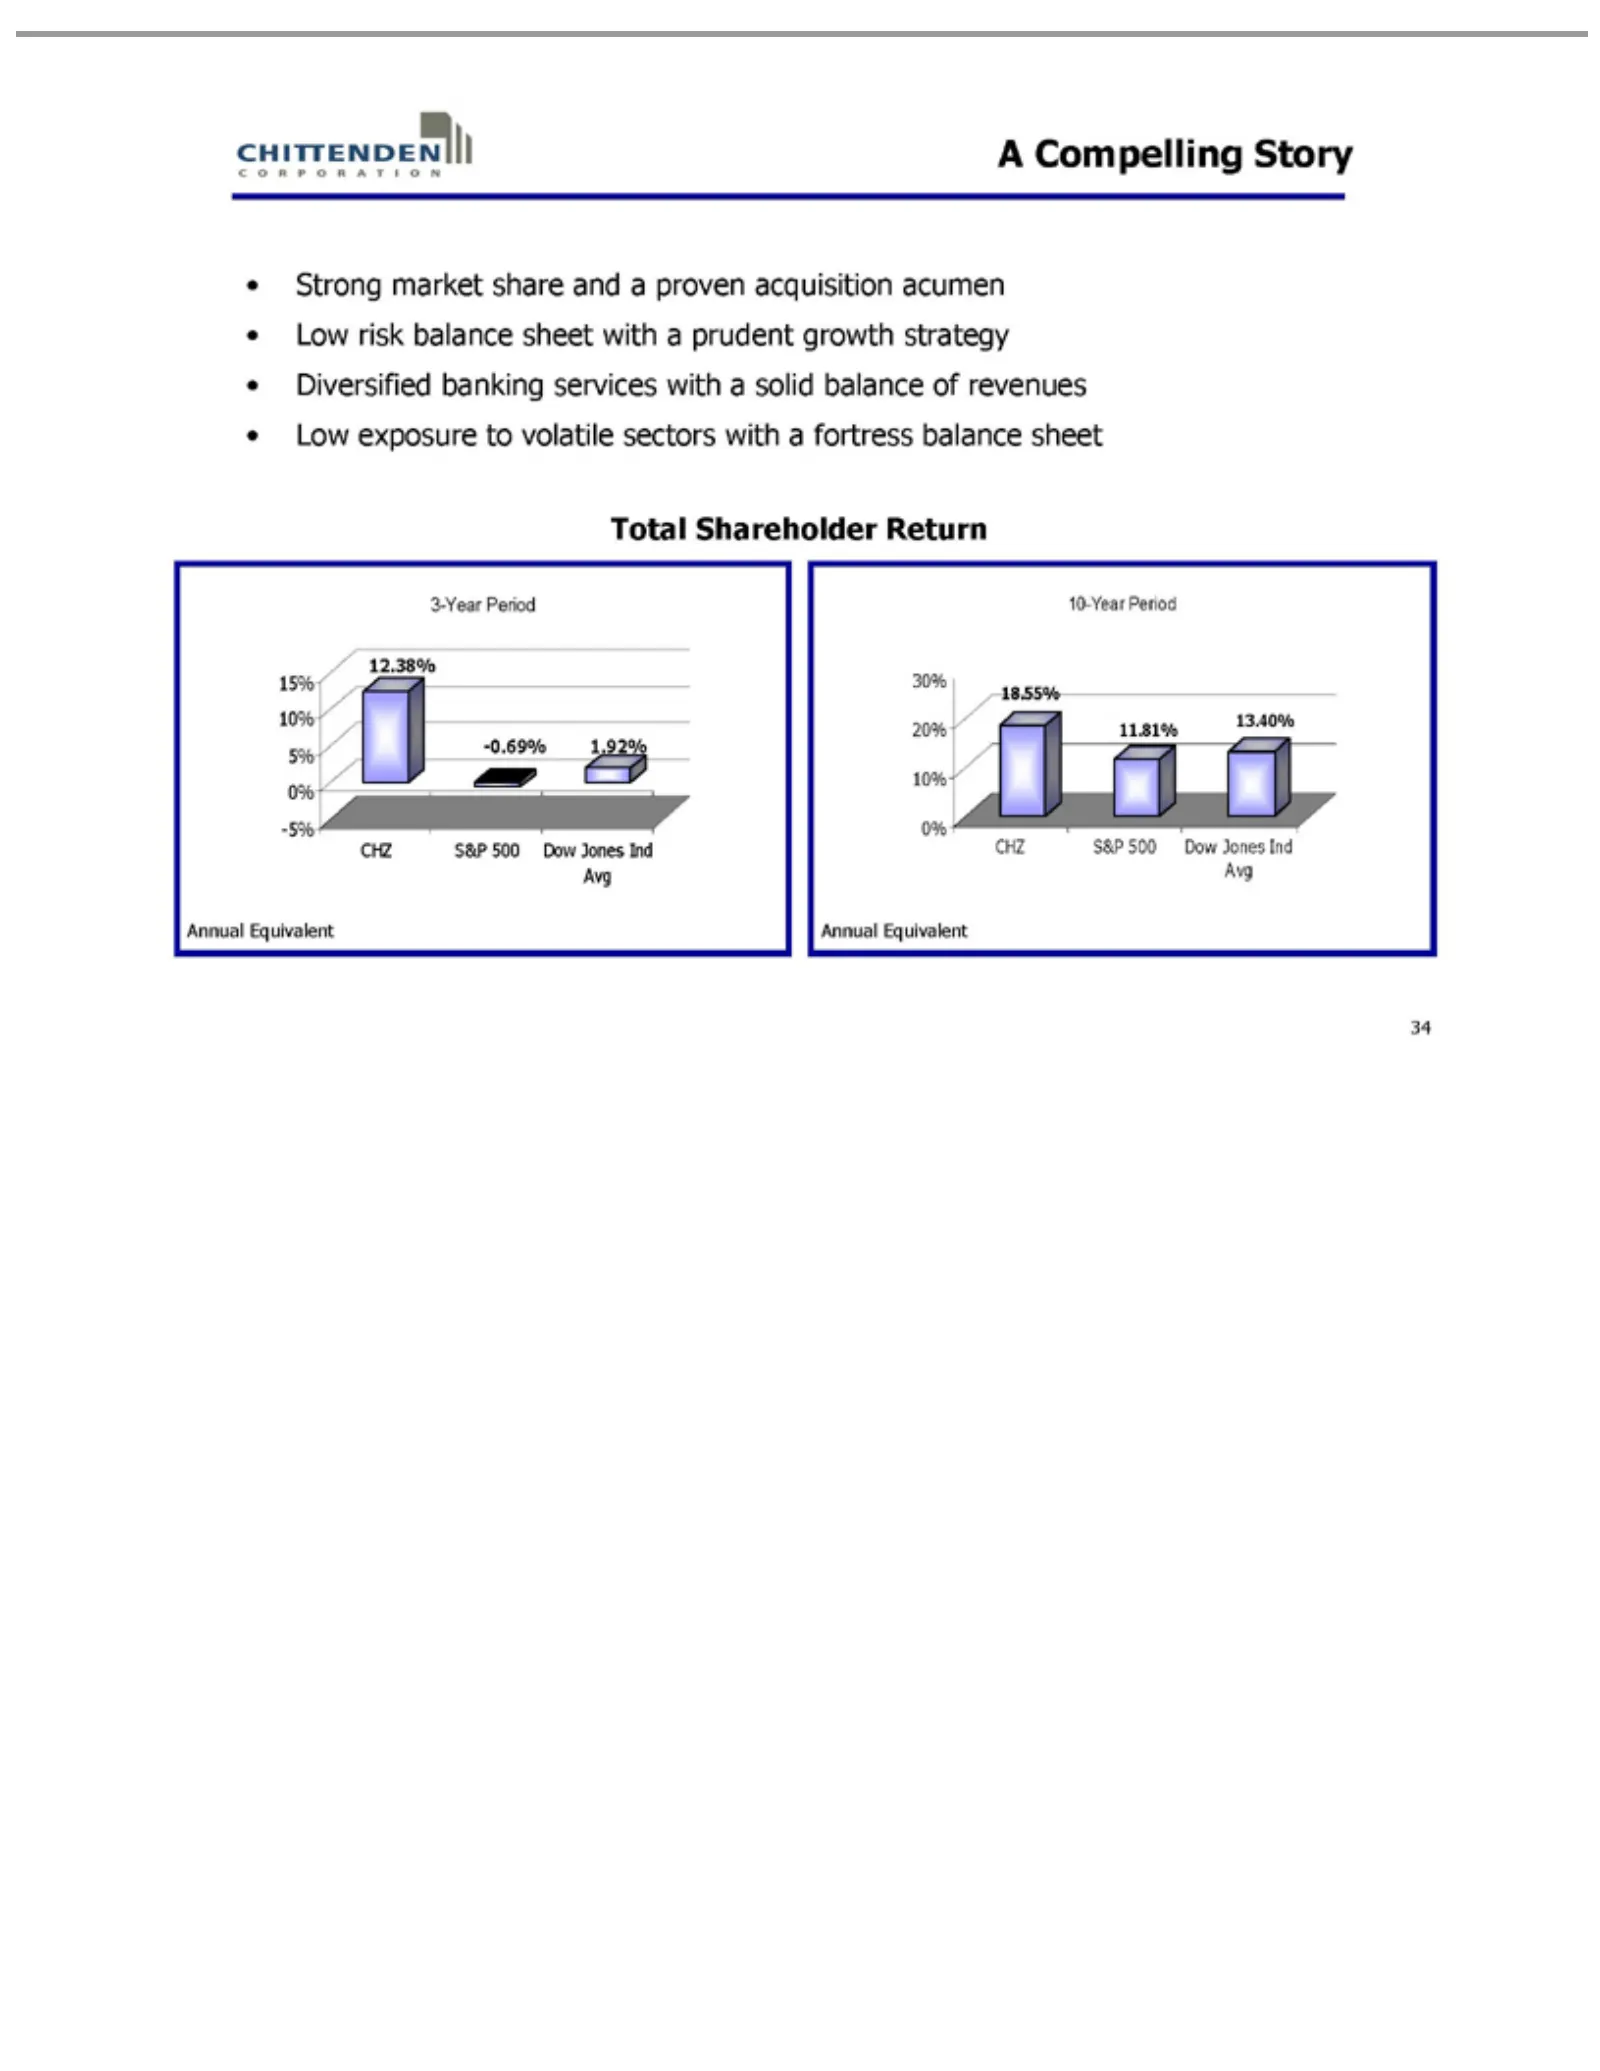
Slide 34: A Compelling Shareholder Return Story
A Compelling Strong sectors Total 3-Year 15% 1.92% -0.69% 12.38% 10-Year 30% CHZ 13.40% 11.81% 18.55% Annual 34 10% 20% S&P Shareholder market Period with Equivalent Period 5% 10% 500 a fortress 0% Story share Dow 0%-5% Return Jones and balance a proven Ind Avg sheet acquisition acumen Low risk bala

Slide 35: Visit www.chittendencorp.com
Visit presentation other This which 35 our interactive arewebsite subjectservices: for contains to aa number wide www.chittendencorp.com “forward-looking range of factors of products, and statements” uncertainties latest financial which that reports could may describe cause and many future future re
Slide 36: Appendix
36 Appendix
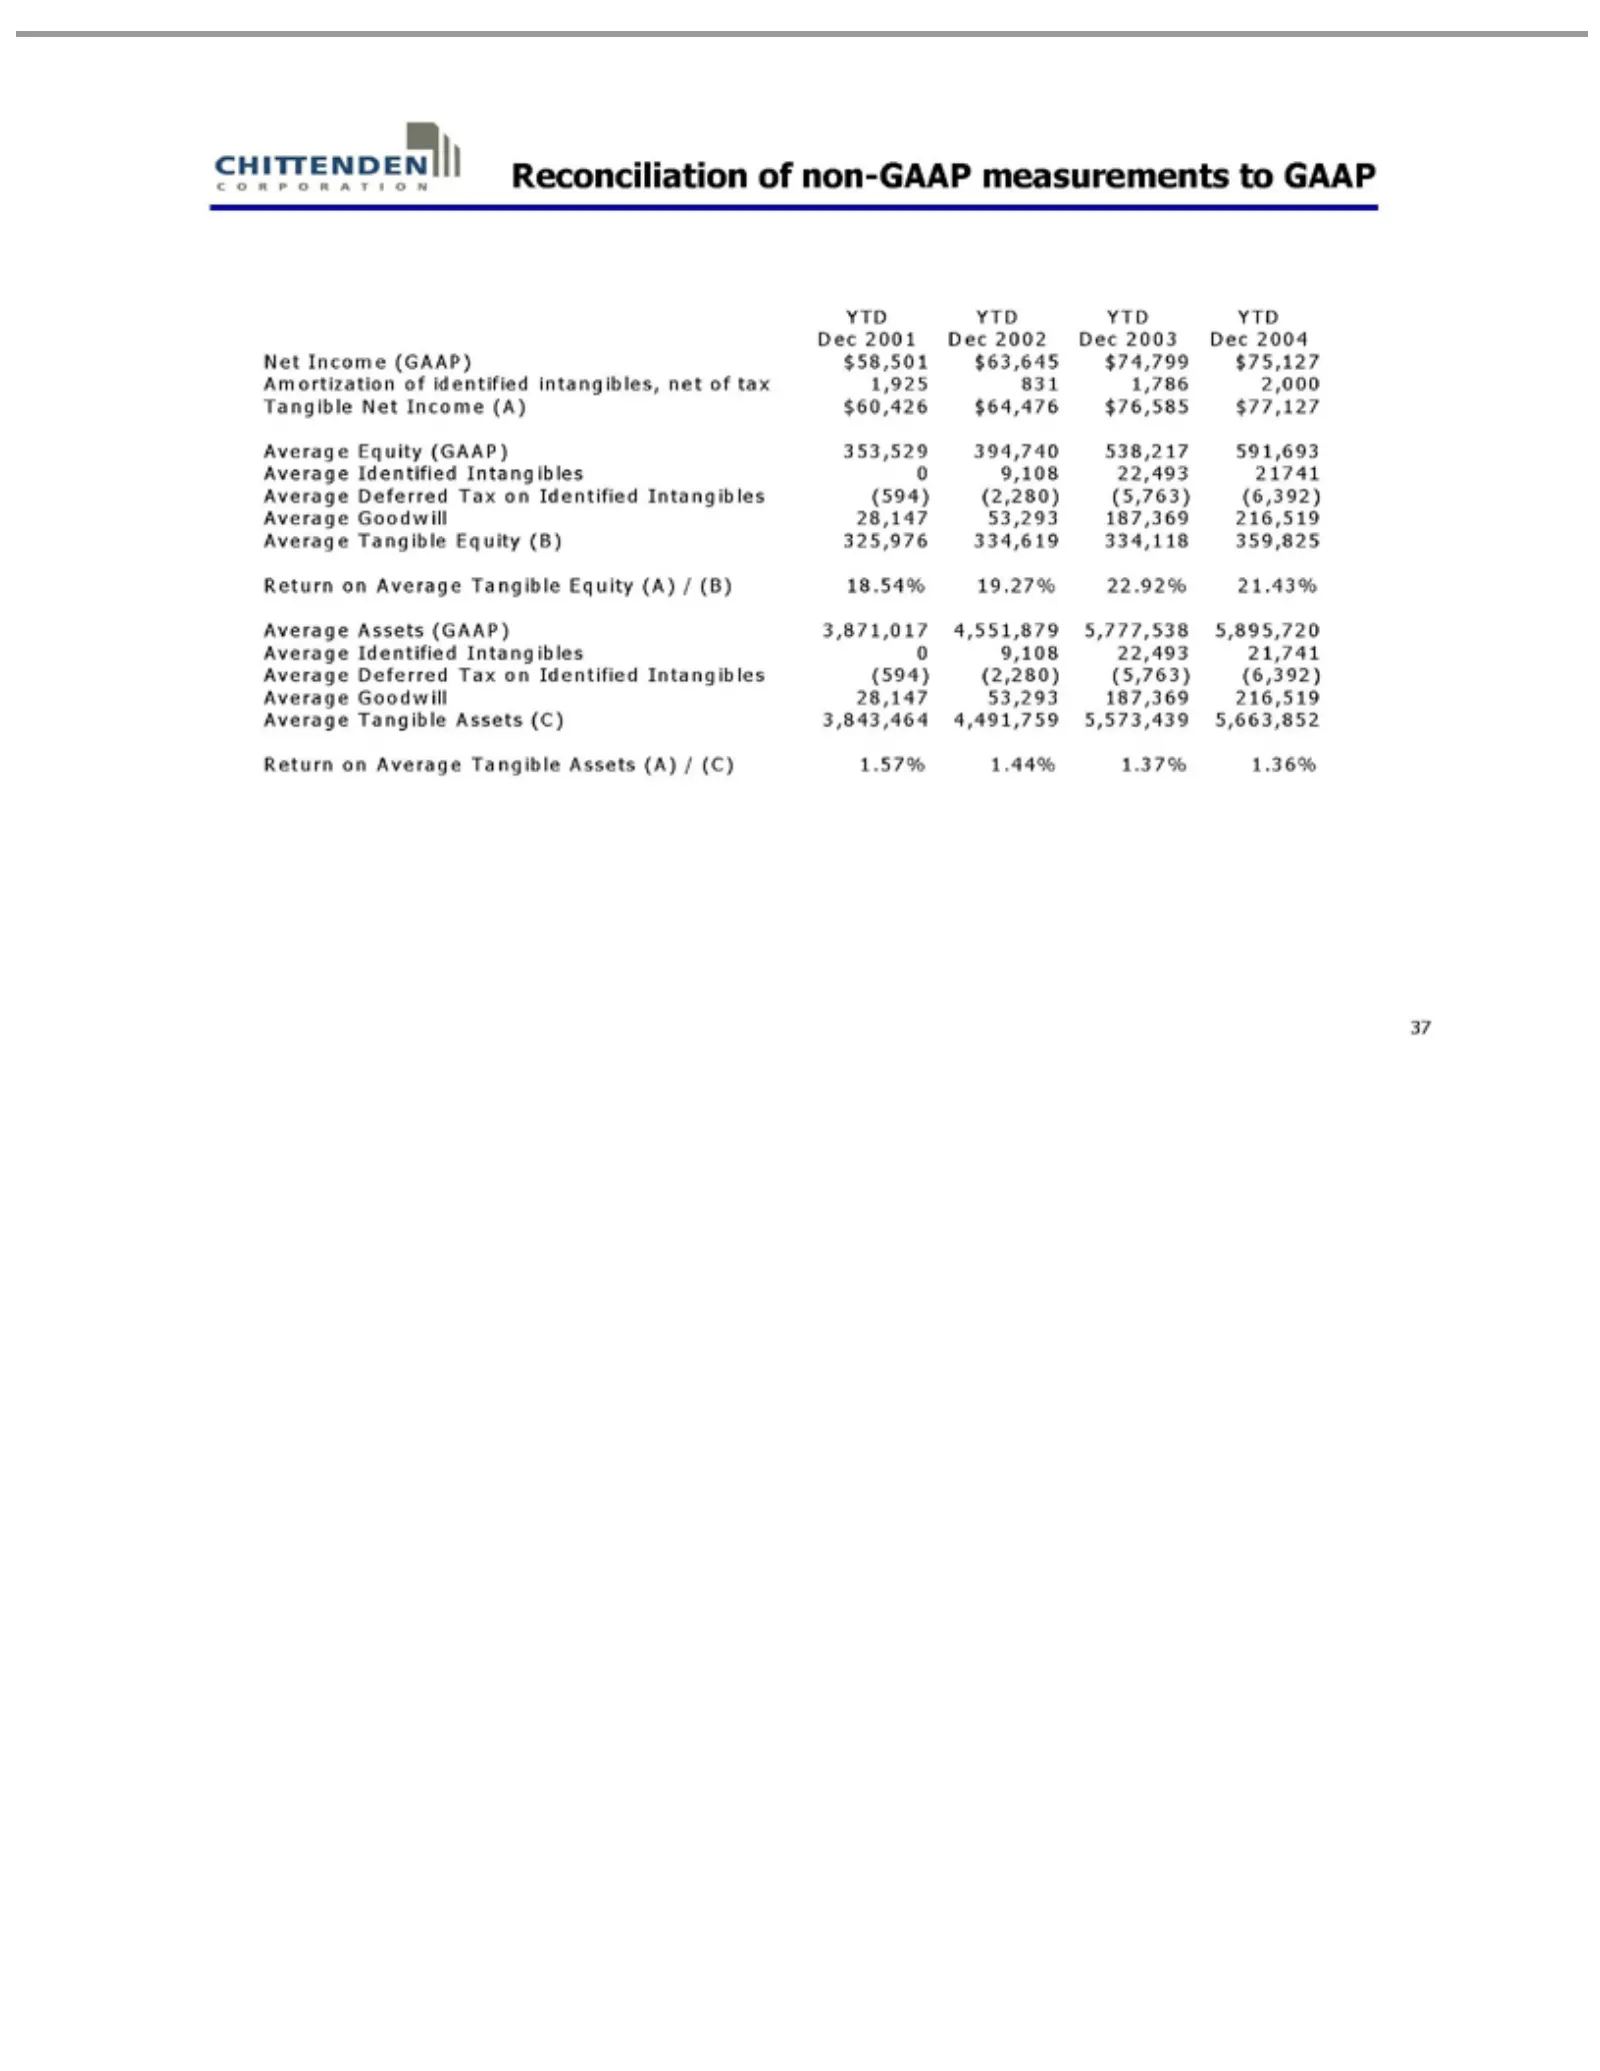
Slide 37: Reconciliation of Non-GAAP Measurements to GAAP
Reconciliation YTD Net Amortization Tangible Average Return 37 Income Dec onAssets Tangible Equity Identified Deferred Goodwill Net 2001 Average (GAAP) Income ofof (GAAP) YTD (GAAP) identified non-GAAP Assets Equity Tax 28,147 Intangibles Tangible $58,501 (A) Dec on3,871,017 (C) 353,529 (B) $60,426
Source: SEC EDGAR · 8-K filed Jan 28, 2005
More decks from Chittenden Corp
 Investor Presentation (September 2007)38 slides · Sep 7, 2007
 Merger or Acquisition (June 2007)27 slides · Jun 27, 2007
 Chittenden — Merger or Acquisition (June 2007)25 slides · Jun 27, 2007
 Merger or Acquisition (June 2007)9 slides · Jun 5, 2007
 Investor Presentation (May 2007)36 slides · May 14, 2007
 Investor Presentation (February 2007)37 slides · Feb 16, 2007