Gulfmark Offshore — 2014 Barclays CEO Energy-Power Conference
24 slides from Gulfmark Offshore's conference presentation, Sep 4, 2014
Slide 1: 2014 Barclays CEO Energy-Power Conference
2014 Barclays CEO Energy-Power = Conference GULFMARK OFFSHORE September 2014 Guifitark Offshore, Inc. NYSEGLF GULFMARK.COM
Slide 2: Forward Looking Statements
Forward Looking Statements Cautionary Statement Regarding Forward-Looking Statements Certain statements and information in this presentation may constitute “forward-looking statements” within the meaning of the Private Securities Litigation Reform Act of 1995. The words “believe,” “expect,” “anticip
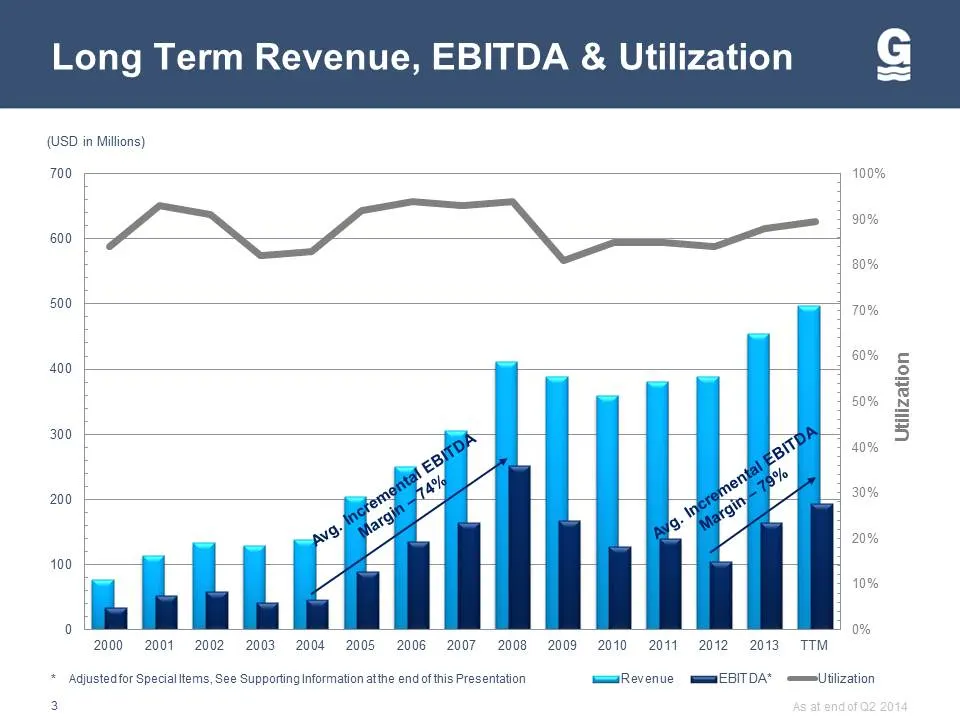
Slide 3: Long Term Revenue, EBITDA & Utilization
Long Term Revenue, EBITDA & Utilization (USD in Millions) 700 600 500 400 Utilization 300 200 400 2000 2001 2002 2003 2004 2006 2006 2007 2008 2009 2010 2011 2012 2013 TTM * Agjustedtfor Special tems, See Supporting Information atthe end of this Presentation seeaRevenue mmmEBITDAY <meUtilization 3
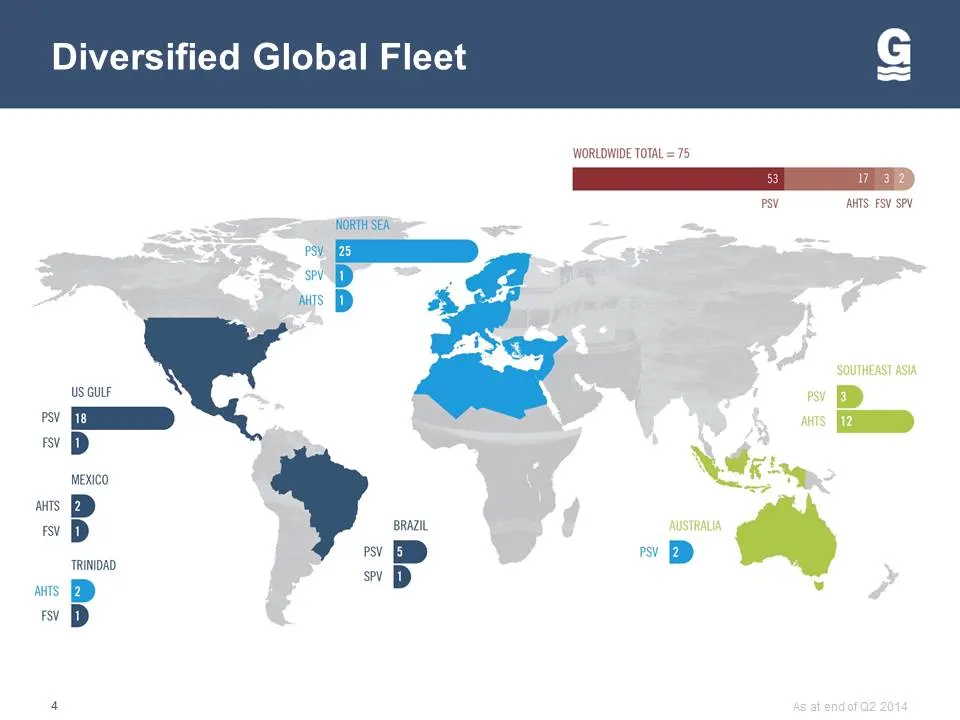
Slide 4: Diversified Global Fleet
Diversified Global Fleet ‘WORLDWIDE TOTAL = 75 Psv ANTS FSV SPV NORTH SEA wp ws D SOUTHEAST ASIA Us GULF ev > wD y t ne ba, ANTS ay P BRAZIL AUSTRALIA TRINIDAD al ed was BD . mw D
Slide 5: Fleet Growth
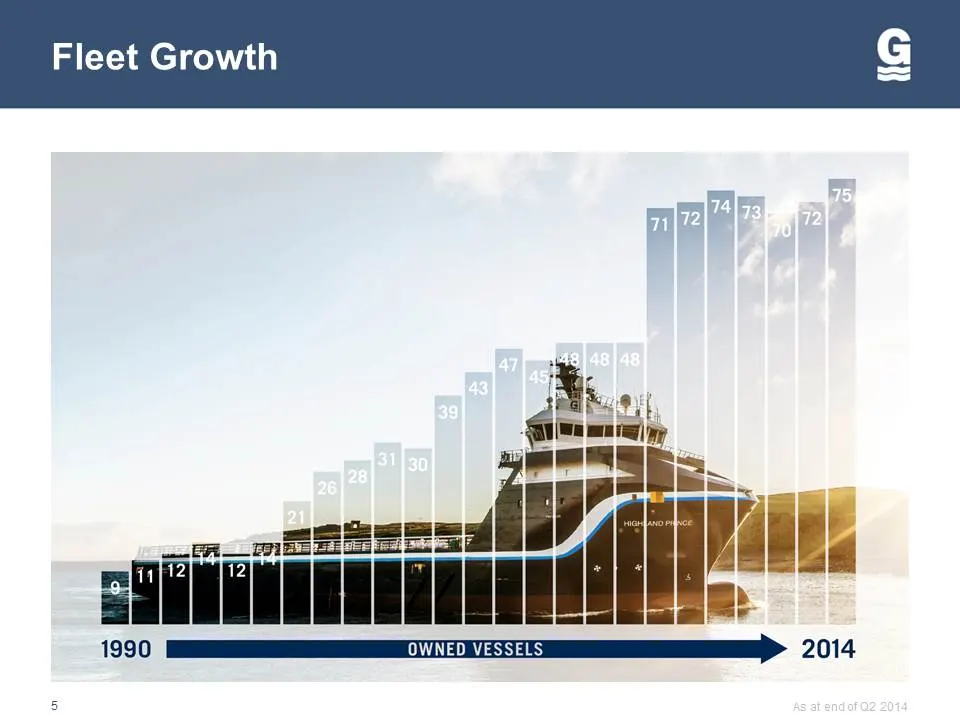
Fleet Growth Mi, (a lap ir ' =a Hy | _pmaeZes ii? 1990 ee ml 2014
Slide 6: Young & Versatile Fleet
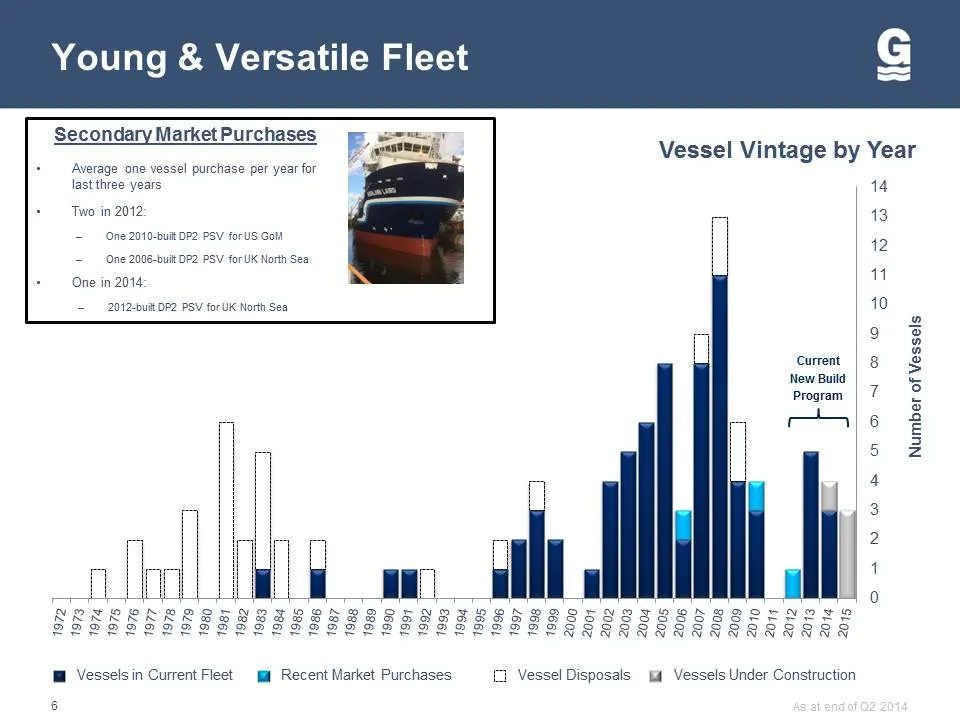
Young & Versatile Fleet Secondary Market Purchases m Vessel Vintage by Year ‘Average one vessel purchase per year for last three years 44 Two in 2012 13 = One 2010-buitDF2 PSV forUS Gott B = One 2006-buitOF2 PSV for UK North Sea One in 2014: 1 — 2012-buitDF2 PSV for UK North Sea 10 ® 9 3 current | g
Slide 7: Vessel Dispositions Demonstrate Long-Term Value
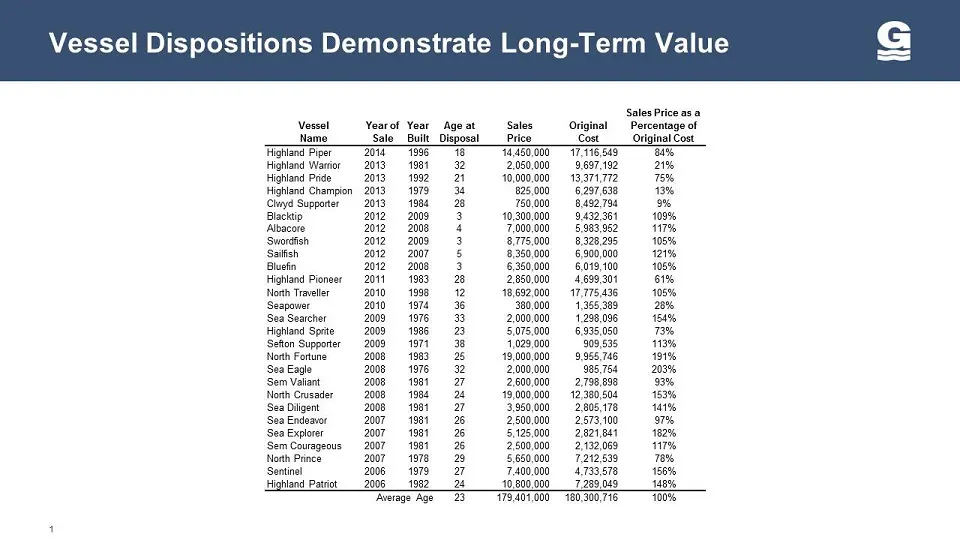
Vessel Dispositions Demonstrate Long-Term Value Sales Price as a Vessel Yearof Year Ageat Sales Percentage of Name Salo_Built_Disposal__Prico Original Cost Fighand Piper 20M 1986 —«18~S=S~«N.ABO.ODD TG HIS CNN Highland Warior 2013 1981-32 2.050.000 9.697.192 21% Highland Pride 2013 1992-21 10-000.00
Slide 8: A Changing Environment
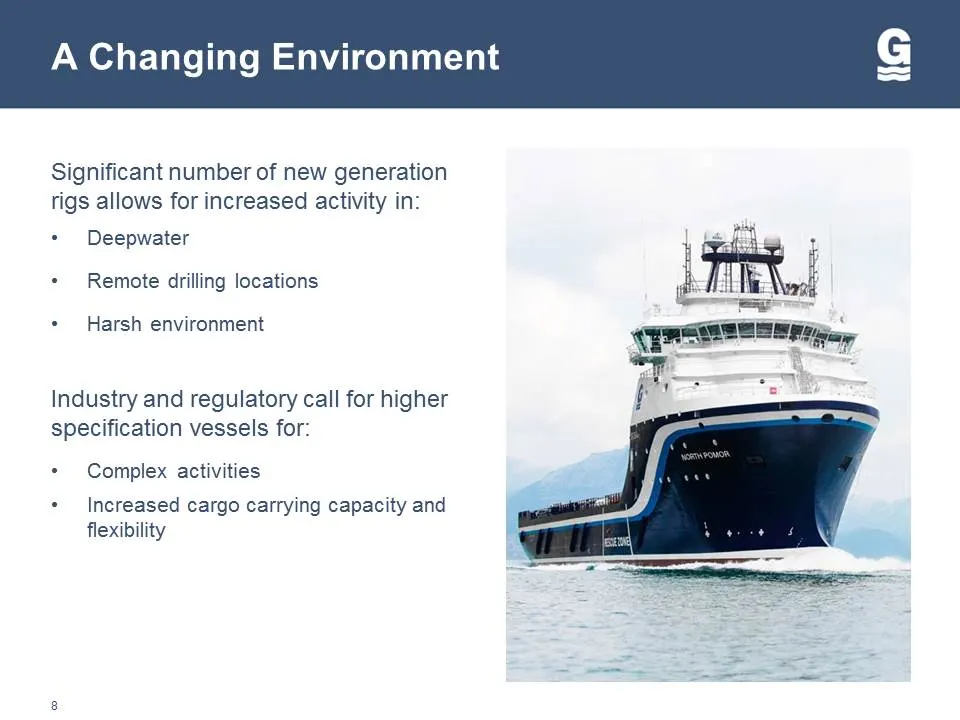
A Changing Environment Significant number of new generation rigs allows for increased activity in: + Deepwater + Remote drilling locations * Harsh environment Industry and regulatory call for higher specification vessels for: + Complex activities + Increased cargo carrying capacity and flexibility
Slide 9: The New Breed Of PSV
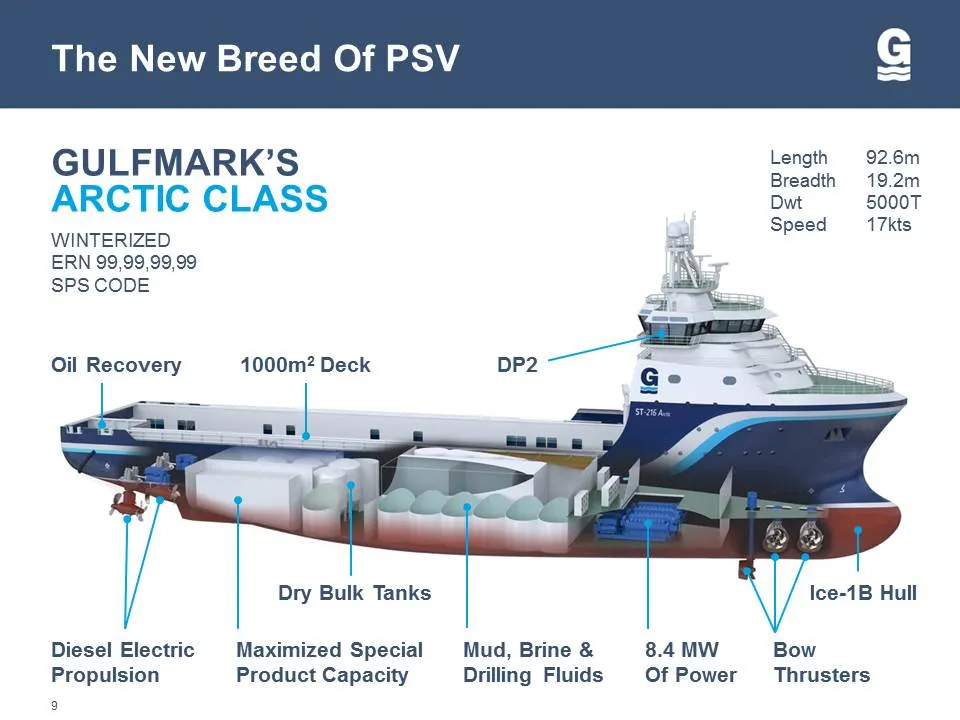
The New Breed Of PSV , Length 92.6m GULFMARK s Breadth 19.2m r , bei } Dwt 5000T Speed 17kts WINTERIZED ERN 99,99,99,99 SPS CODE Oil Recovery 1000m? Deck DP2 — Dry Bulk Tanks Ice-1B Hull Diesel Electric Maximized Special Mud, Brine & 8.4 MW Bow Propulsion Product Capacity Drilling Fluids Of Power ‘T
Slide 10: New Construction Delivery Schedule
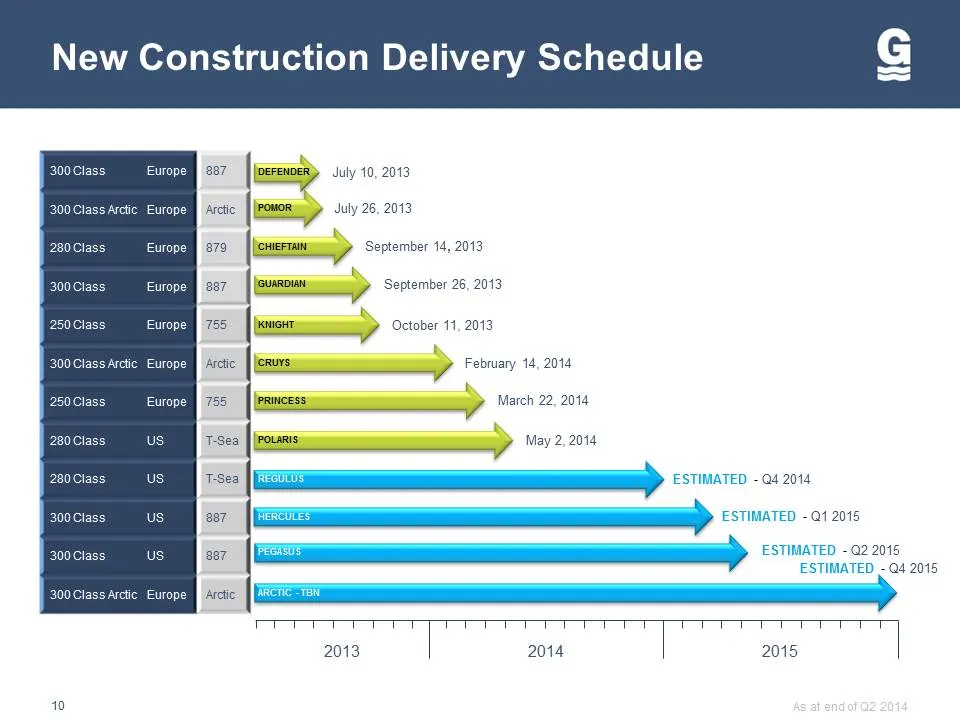
New Construction Delivery Schedule 200 cass 687 [scams July 10,2013 300Class Arctic Europe [ees [lr > wean P ociass europe fe {lcwerun > September 14, 2013 300 Cla Europe [Eyam [ous > September 26, 2013 250Cia: Europe [gam fooler > October 11, 2013 300Cla: Peter Arctic | curs gp February 14, 2014 r
Slide 11: Vessel Enhancement Schedule
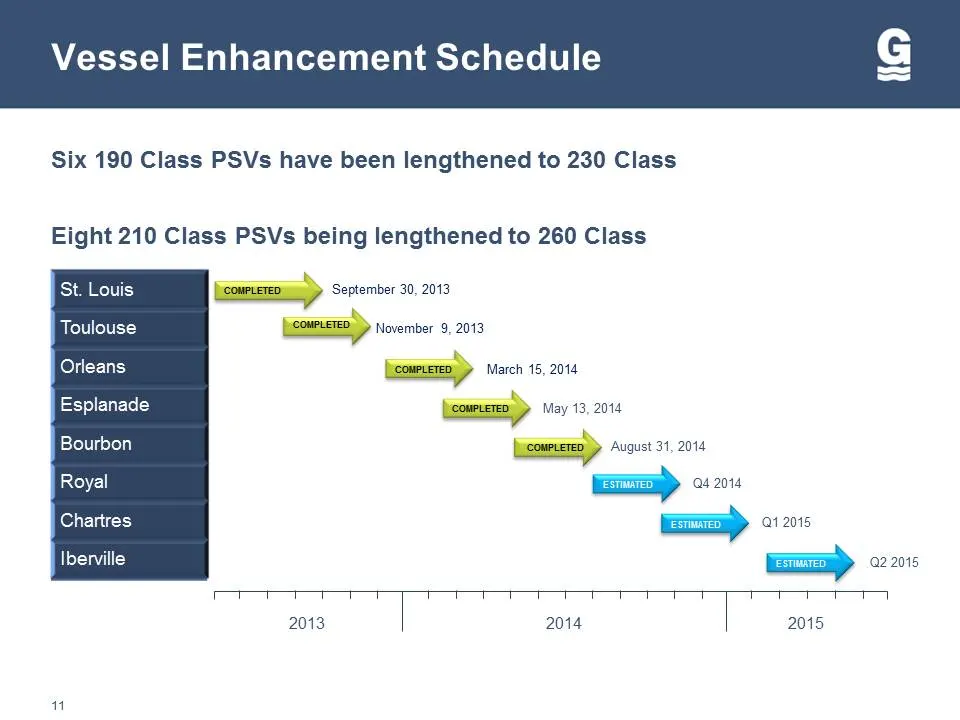
Vessel Enhancement Schedule Six 190 Class PSVs have been lengthened to 230 Class Eight 210 Class PSVs being lengthened to 260 Class St. Louis benny September 30, 2013 Toulouse Lease) rverver 9,201 Orleans (cote March 15, 2044 Esplanade May 13, 2014 Bourbon busmeno > August 31, 2014 Royal ==> a4 2014
Slide 12: Demand Drivers
DEMAND DRIVERS
Slide 13: Rig Count Growth — North Sea
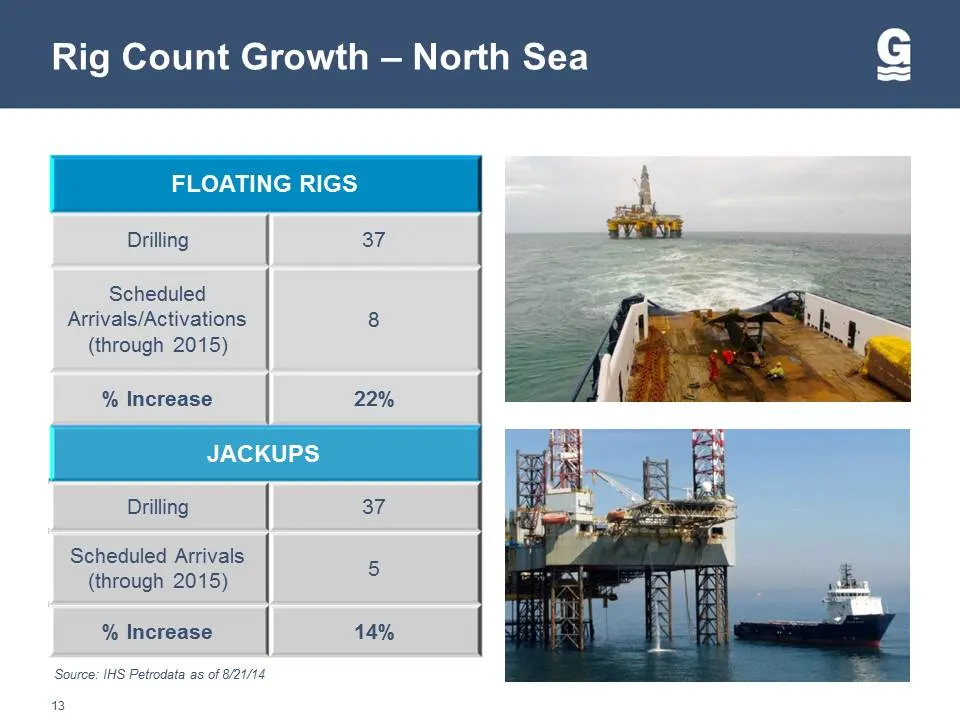
Rig Count Growth — North Sea Drilling Y/ Scheduled Arrivals/Activations 8 (through 2015) % Increase 22% Drilling ah Scheduled Arrivals 5 (through 2015) % Increase 14% Source: IHS Petrodata as of 8/21/14 2
Slide 14: Floating Rig Count Growth — U.S. GoM
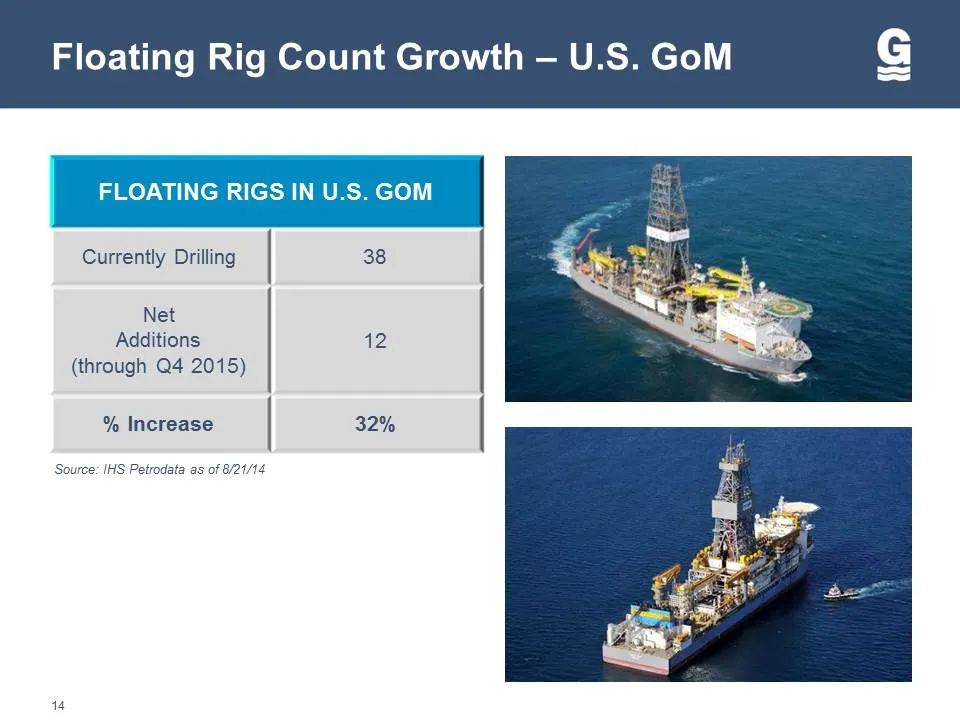
Floating Rig Count Growth — U.S. GoM Currently Drilling | 38 Net Additions 12 (through Q4 2015) % Increase | 32% Source: IHS Petrodata as of 8/21/14 14
Slide 15: Vessel To Rig Ratio — U.S. Gulf of Mexico
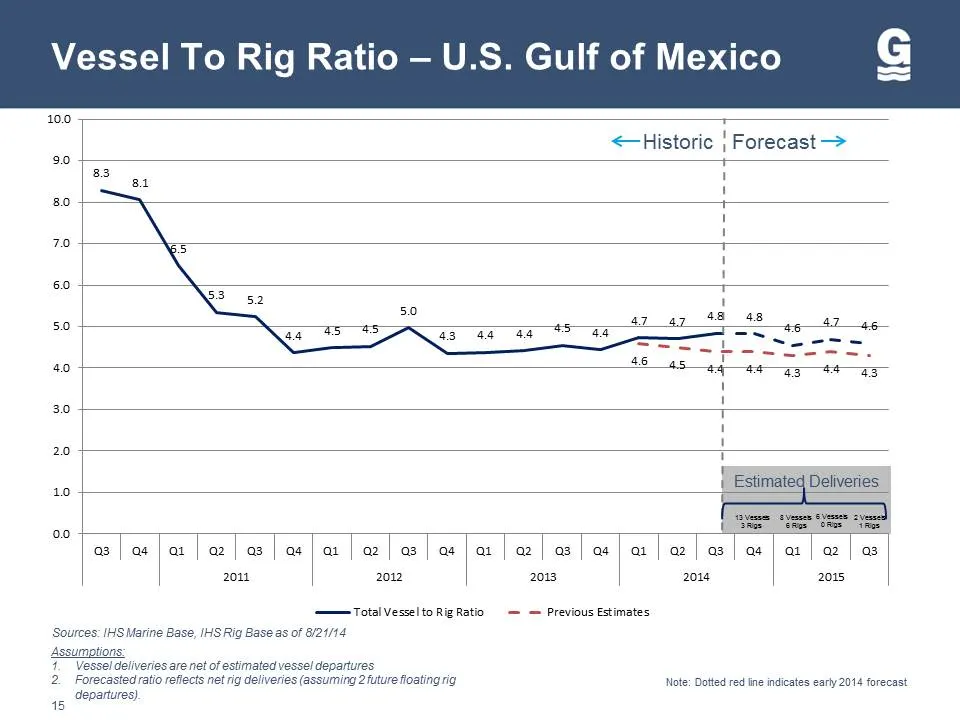
Vessel To Rig Ratio — U.S. Gulf of Mexico 100 Historic | Forecast > 90 a \ 1 a 2 so a7 ay 48 48 # aq 45% a3. 44 44 aa Se on be Soe SS. a0 * aS a3 ' \ 30 ' \ \ 20 u | 10 _Estimated Deliveries = 00 afajalalalalalalalalalalala])alala|a|a| a | a 2011 2012 2013 2018 2015 Total Vesselto Rig Ratio — — Prev
Slide 16: Vessel To Rig Ratio — North Sea
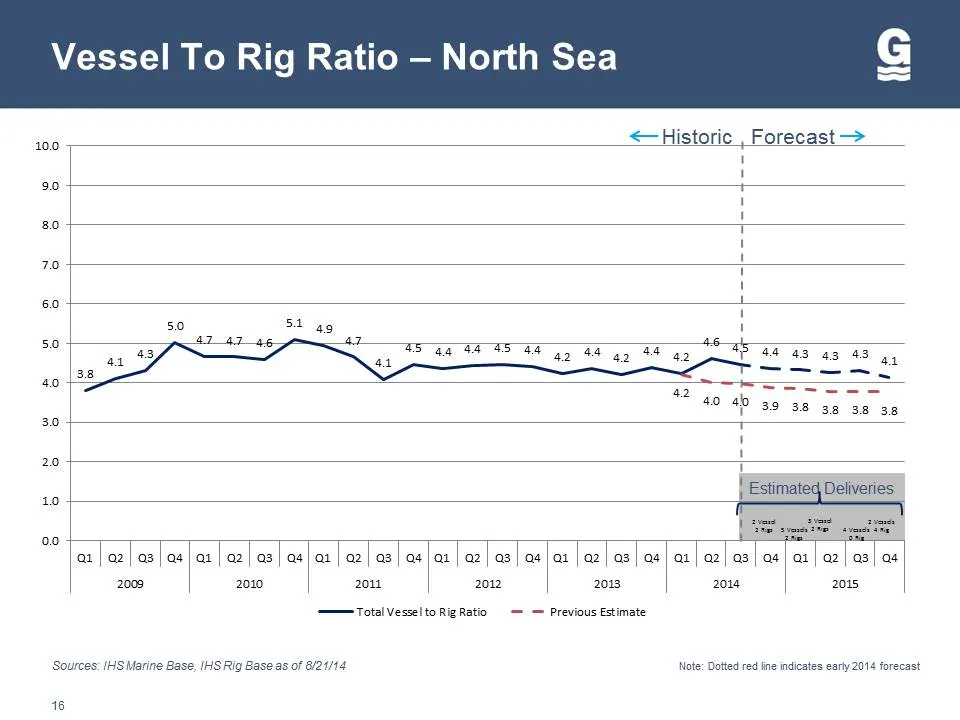
Vessel To Rig Ratio — North Sea <Historic , Forecast > 100 1 ' 90 80 70 60 5.0 51 as 50 474 4 a a ee ap aa a4 = a2 an a2 4345 43 gy 38 —--—i-% 40 = es 40 40 29 38 38 38 a8 30 i ' ' 20 i | Estimat 10 00 aa | a2|as|as] ar] az] as] as]ax | a2| as] as far | a2] as|ae ar Jaz] as] ae] ar] az] a | ae ar |

Slide 17: Financial Information
FINANCIAL INFORMATION
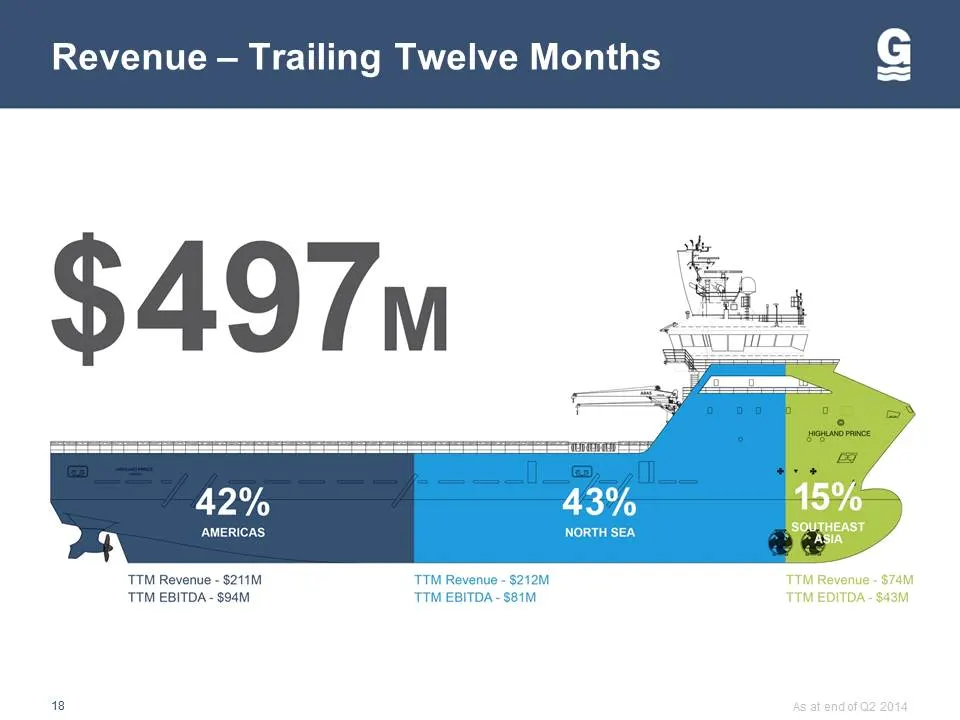
Slide 18: Revenue — Trailing Twelve Months
Revenue — Trailing Twelve Months : ? SOUTHEAST AMERICAS N * Se ASAE ‘TTM Revenue - $211M ‘TTM EBITDA -$94M TTM Revenue - $74M TTM EDITDA- $43M 48
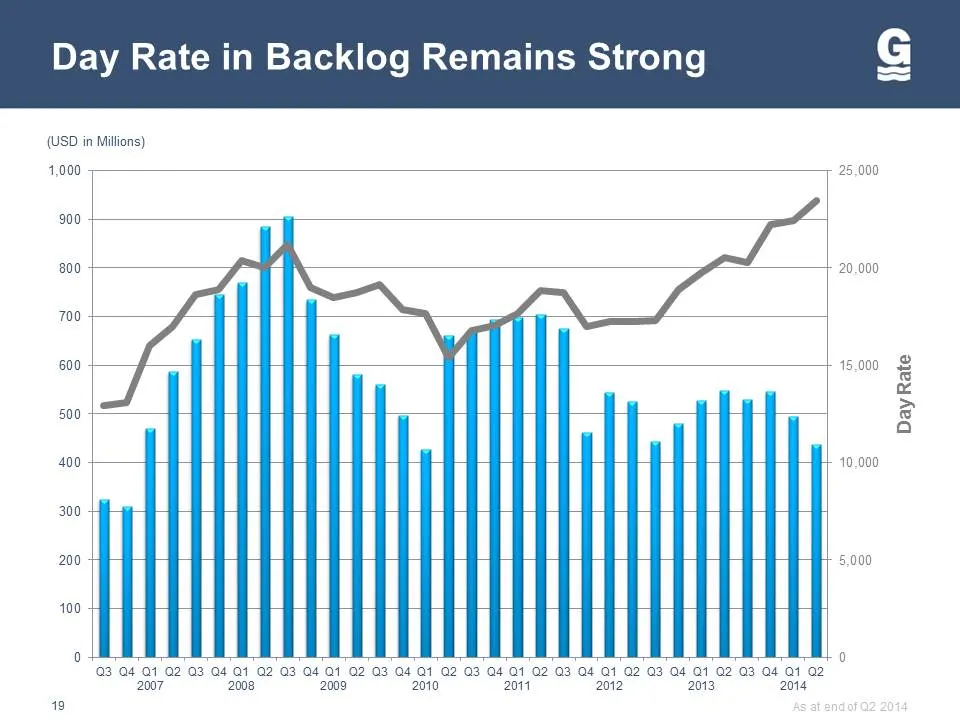
Slide 19: Day Rate in Backlog Remains Strong
Day Rate in Backlog Remains Strong (USD in Milfions) 1,000 25,000 900 - 800 20,000 700 caaar 600 + eee HHH 15,00 2 r c i « | 500 BEEEEE HHH i: ze P : | a 2b SHA HHH Hf 10.000 300 alaieinia miata H | 200 BEEEEa HHH fy 5,000 100 BEEEEE BEE 0 0 3 Q4 Q1 02 3 G4 Q1 Q2 G3 A4 .Q1 2 03 G4 O1 Q2 03 O4 OT G2
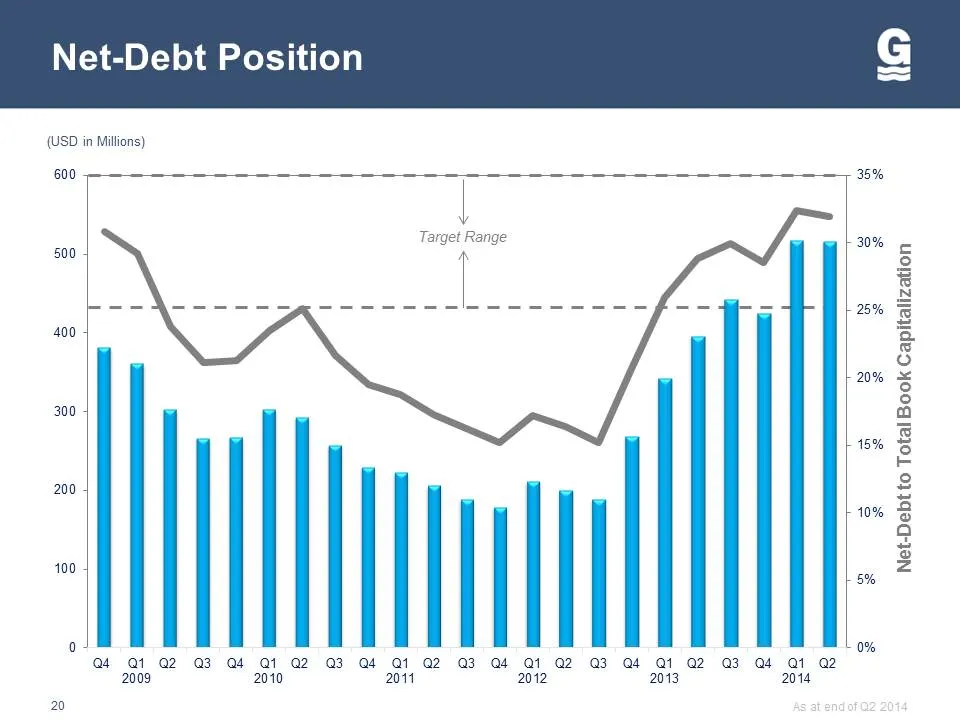
Slide 20: Net-Debt Position
Net-Debt Position (USD in Millions) 600 | 35% Target Range 20% 500 § & x ie S 2% Ss 400 = o oo % SS 20% = [-} 300 a ee 6% 5 fad 2 200 = ar} 10% B 9 3 100 = 5% oii : eB Ei Q4 Q1 @2 Q3 G4 G1 G2 G3 G4 Qi G2 Q3 G4 1 @2 G3 Qt a1 a2 G3 a a @ 2009 2010 2011 2012 2013 2014 20
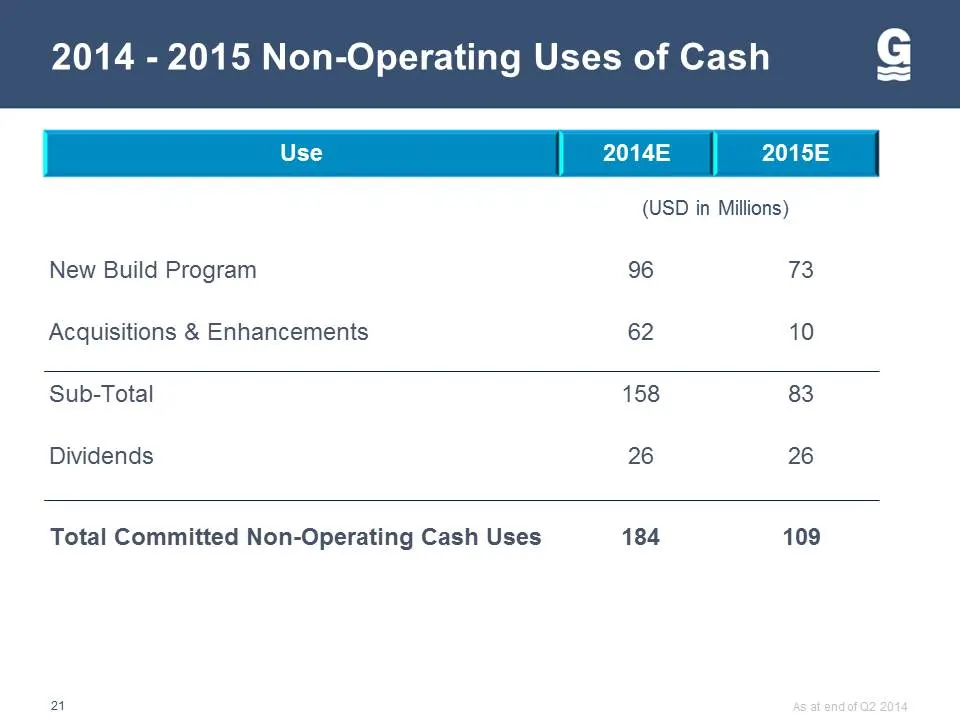
Slide 21: 2014 - 2015 Non-Operating Uses of Cash
2014 - 2015 Non-Operating Uses of Cash Use 2014E 2015E (USD in Millions) New Build Program 96 =) Acquisitions & Enhancements 62 10 Sub-Total 158 83 Dividends 26 26 Total Committed Non-Operating Cash Uses 184 109 2
Slide 22: Future Growth
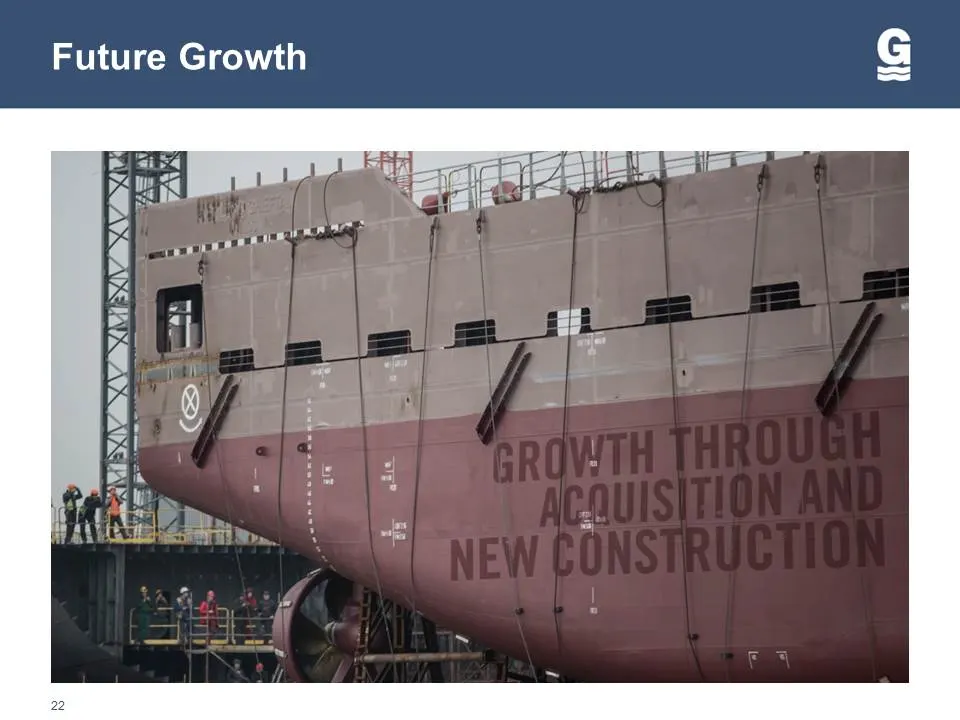
Future Growth FIX AX ANIIXK AX AML
Slide 23: Reconciliation Of Adjusted EBITDA
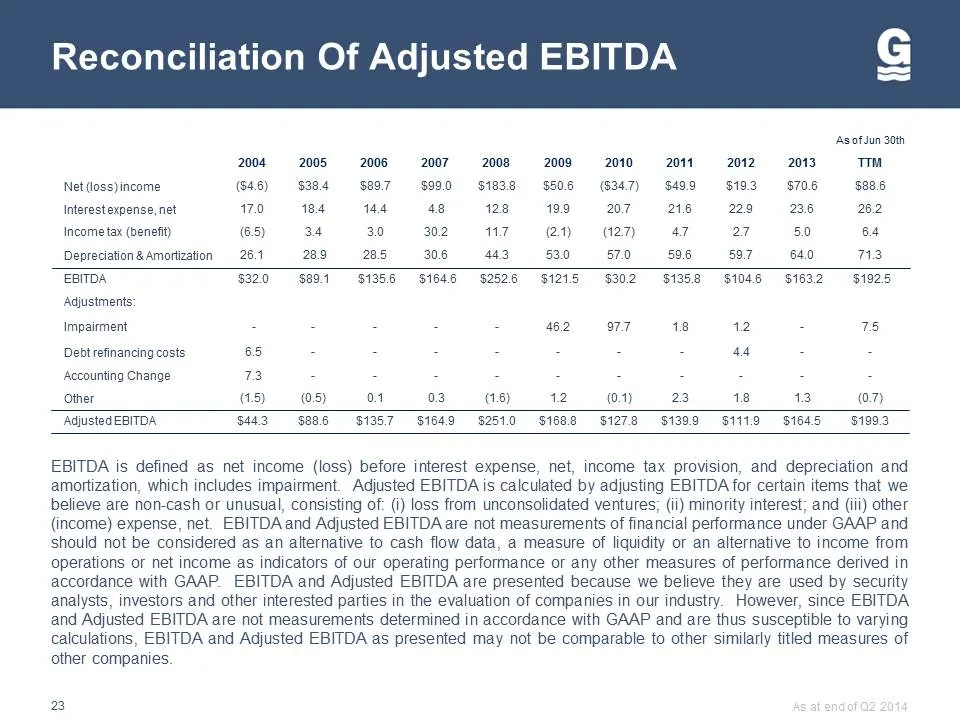
Reconciliation Of Adjusted EBITDA AsofJun 30th 2004 ©2005-2008. «= 2007,-««2008-«S 2008S 2010S 2011S 20122013 ™ Net loss)income ($46) 8384 $897 = $990 $1838 S508 (S347) $499 19.3 S708 = 8B Interest expense, net 700 184144 48 128 ©6199 «07 2886 26.2 Income tax (benefit) 65) 34 30 302 11721) (127) 47
Slide 24: GulfMark
GULEMARK GULFMARK.COM
Source: SEC EDGAR · 8-K filed Sep 4, 2014
More decks from Gulfmark Offshore Inc
 Merger or Acquisition (July 2018)11 slides · Jul 16, 2018
 Merger or Acquisition (July 2018)15 slides · Jul 16, 2018
 Investor Presentation (March 2018)22 slides · Mar 6, 2018
 Debt Investor Presentation (October 2017)16 slides · Oct 2, 2017
 Debt Investor Presentation (May 2017)41 slides · May 18, 2017
 Debt Investor Presentation (November 2016)28 slides · Nov 28, 2016