Hardinge — Houlihan Lokey 7th Annual Global Industrials Conference 2012
33 slides from Hardinge's conference presentation, May 9, 2012
Slide 1: Houlihan Lokey 7th Annual Global Industrials Conference
Houlihan Lokey 7th Annual Global Industrials Conference May 10, 2012 NASDAQ: HDNG www.hardinge.com Edward J. Gaio Vice President and Chief Financial Officer Richard L. Simons Chairman, President and Chief Executive Officer
Slide 2: Safe Harbor Statement
Safe Harbor Statement This presentation may contain forward-looking statements (within the meaning of Section 27A of the Securities Act of 1933, as amended and Section 21E of the Securities Exchange Act of 1934, as amended). Any such statements are based upon management’s current expectations that i
Slide 3: Leading Global Machine Tool Manufacturer
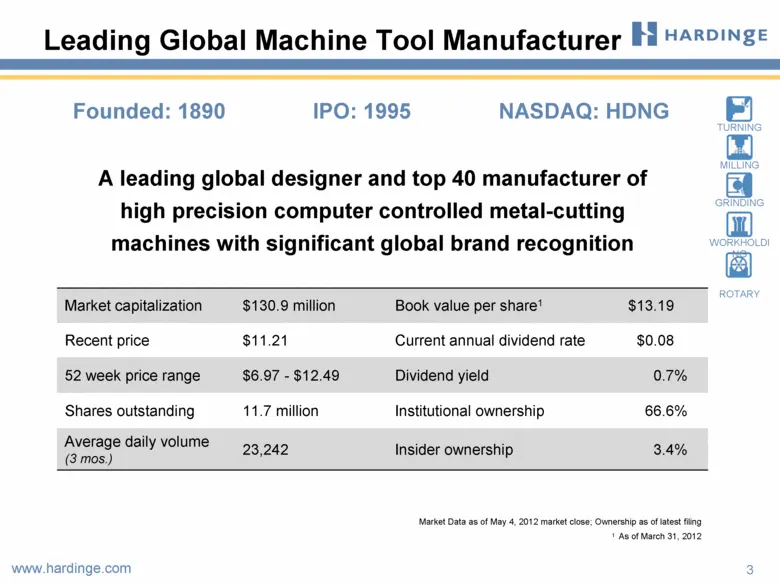
Leading Global Machine Tool Manufacturer A leading global designer and top 40 manufacturer of high precision computer controlled metal-cutting machines with significant global brand recognition 3 Market capitalization $130.9 million Book value per share1 $13.19 Recent price $11.21 Current annual div
Slide 4: Global Expansion Strategy
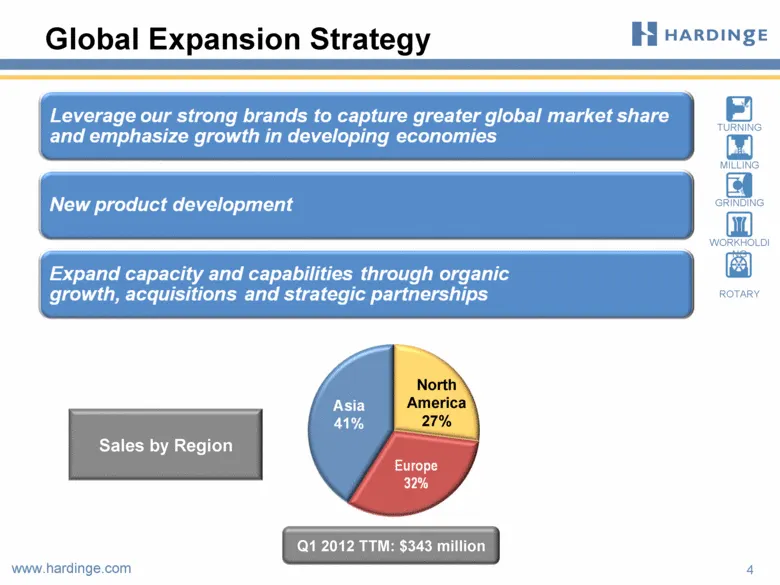
Global Expansion Strategy 4 Q1 2012 TTM: $343 million North America 27% Sales by Region Asia 23%
Slide 5: Global Premier Brands
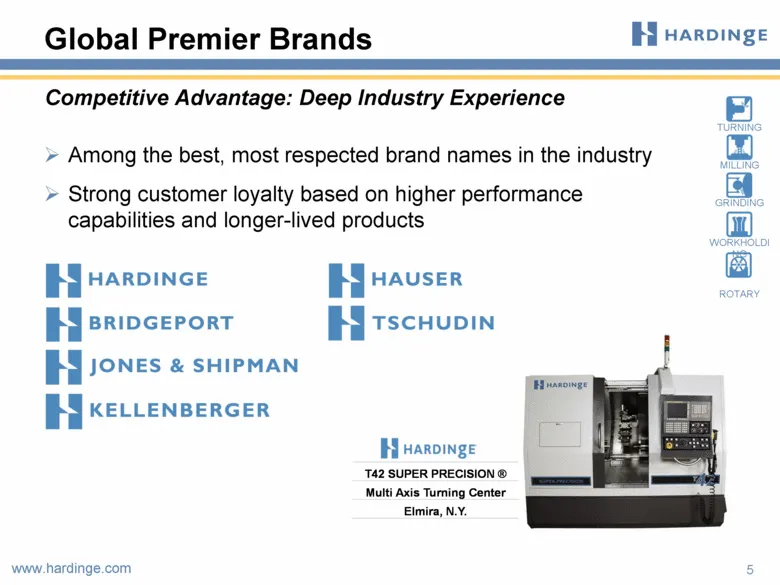
Global Premier Brands Among the best, most respected brand names in the industry Strong customer loyalty based on higher performance capabilities and longer-lived products 5 Competitive Advantage: Deep Industry Experience T42 SUPER PRECISION ® Multi Axis Turning Center Elmira, N.Y.
Slide 6: Significant Spare Parts and Accessories Support
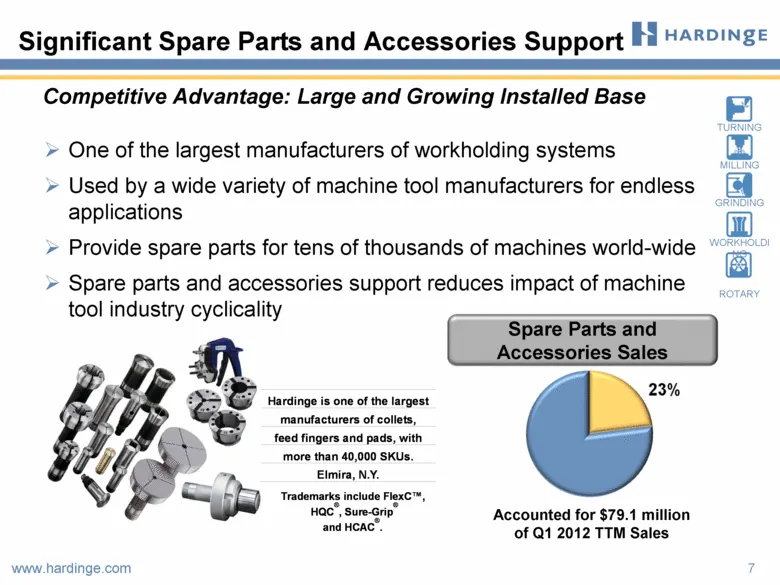
Significant Spare Parts and Accessories Support 7 Competitive Advantage: Large and Growing Installed Base Spare Parts and Accessories Sales One of the largest manufacturers of workholding systems Used by a wide variety of machine tool manufacturers for endless applications Provide spare parts for te
Slide 7: Achieving Manufacturing Excellence in all industries
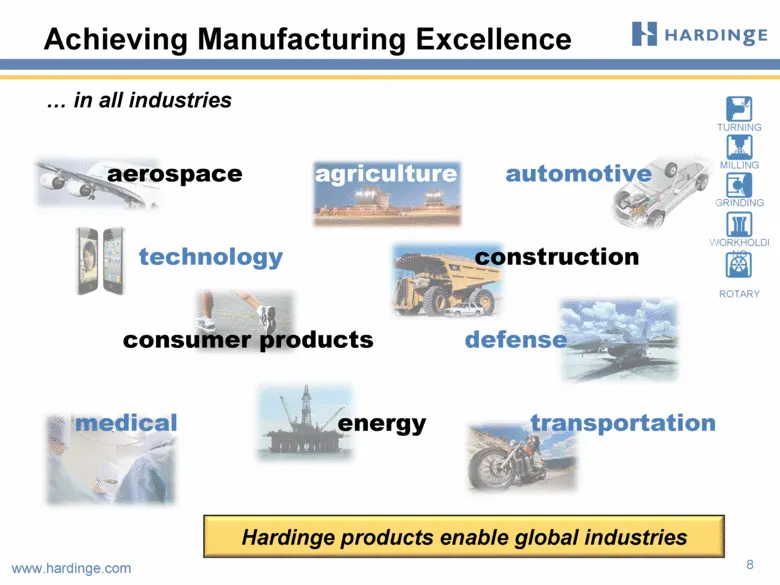
Achieving Manufacturing Excellence 8 in all industries aerospace agriculture automotive technology construction consumer products defense medical energy transportation Hardinge products enable global industries
Slide 8: Diversified End Markets of Machined Products
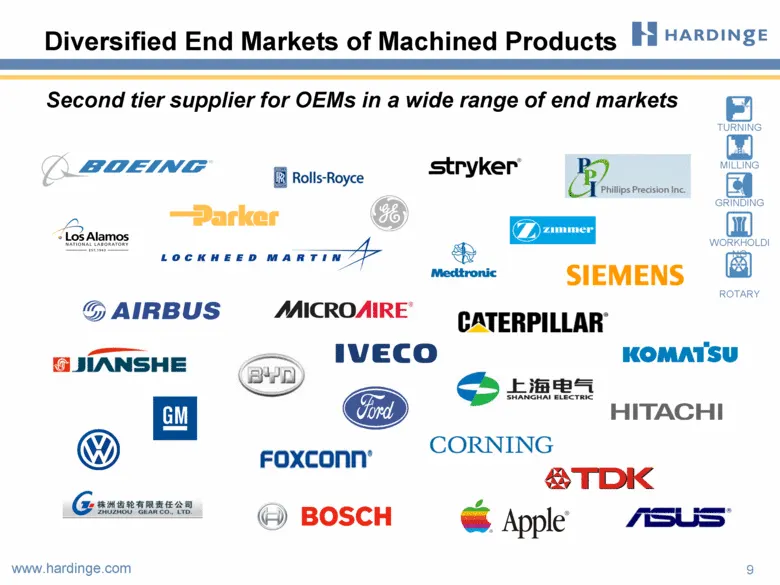
Diversified End Markets of Machined Products 9 Second tier supplier for OEMs in a wide range of end markets
Slide 9: Competition
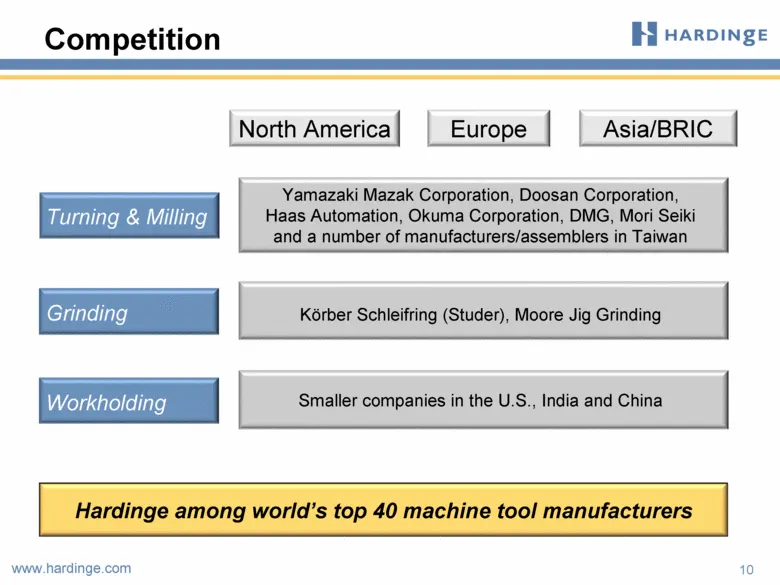
Competition 10 Turning & Milling Grinding Workholding North America Europe Asia/BRIC Yamazaki Mazak Corporation, Doosan Corporation, Haas Automation, Okuma Corporation, DMG, Mori Seiki and a number of manufacturers/assemblers in Taiwan Körber Schleifring (Studer), Moore Jig Grinding Smaller companie
Slide 10: Oxford Economics Machine Tool Forecast
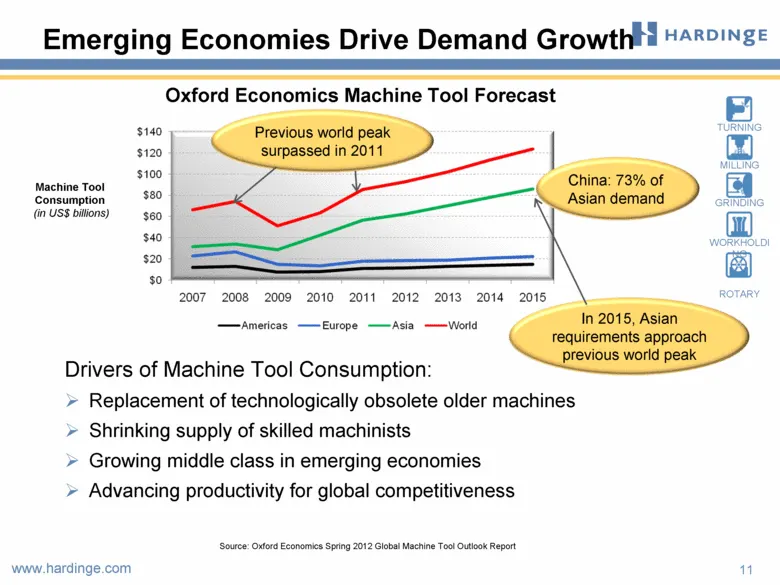
Oxford Economics Machine Tool Forecast Source: Oxford Economics Spring 2012 Global Machine Tool Outlook Report 11 Emerging Economies Drive Demand Growth Machine Tool Consumption (in US$ billions) Drivers of Machine Tool Consumption: Replacement of technologically obsolete older machines Shrinking su
Slide 11: Escalating Machine Tool Needs
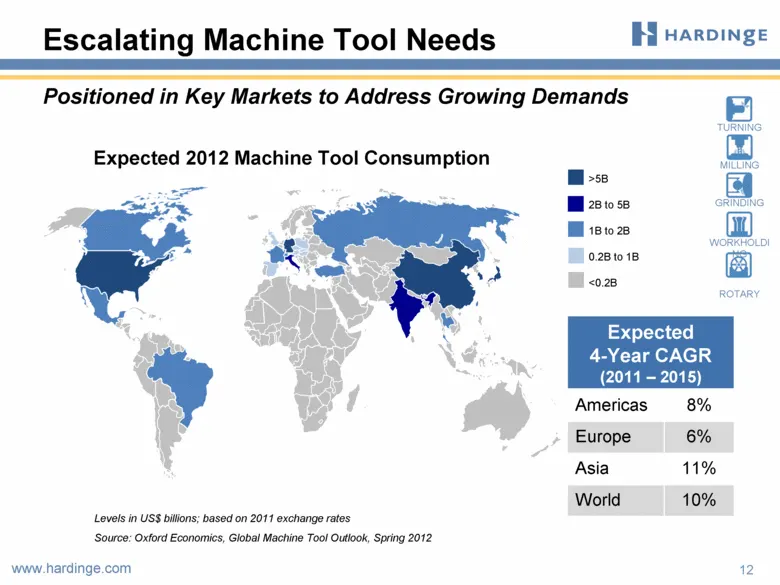
12 Escalating Machine Tool Needs Positioned in Key Markets to Address Growing Demands Levels in US$ billions; based on 2011 exchange rates Source: Oxford Economics, Global Machine Tool Outlook, Spring 2012 >5B 2B to 5B 1B to 2B 0.2B to 1B <0.2B Expected 2012 Machine Tool Consumption Expected 4-Year
Slide 12: Rationalized Channels to Market
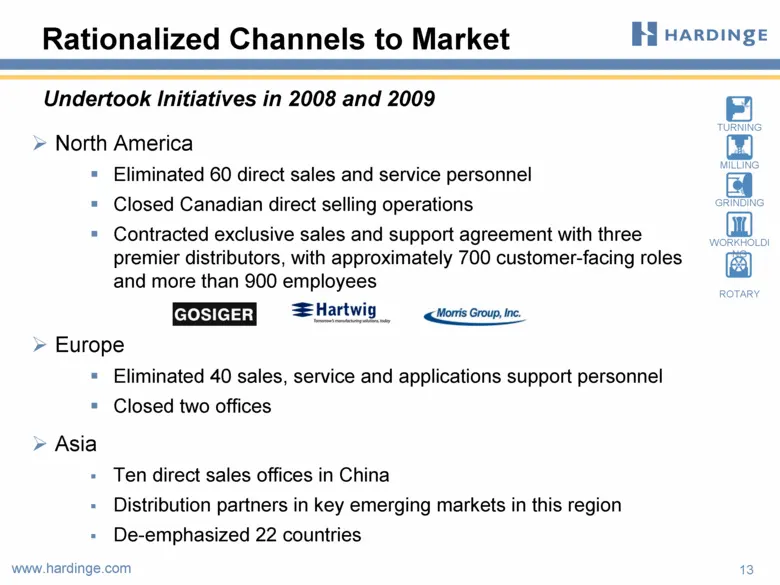
Rationalized Channels to Market North America Eliminated 60 direct sales and service personnel Closed Canadian direct selling operations Contracted exclusive sales and support agreement with three premier distributors, with approximately 700 customer-facing roles and more than 900 employees Europe E
Slide 13: Reduced Cost Structure
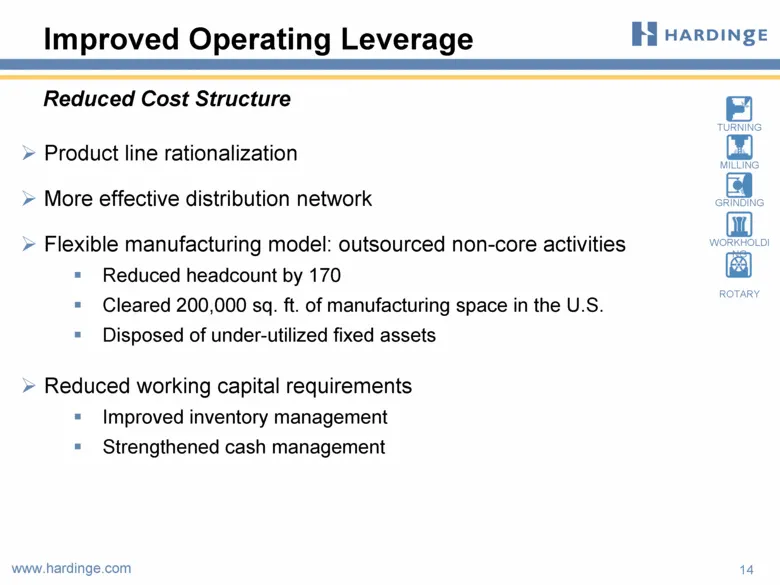
Product line rationalization More effective distribution network Flexible manufacturing model: outsourced non-core activities Reduced headcount by 170 Cleared 200,000 sq. ft. of manufacturing space in the U.S. Disposed of under-utilized fixed assets Reduced working capital requirements Improved inve
Slide 14: Financials
FINANCIALS NASDAQ: HDNG www.hardinge.com
Slide 15: Rebounding with Recovery
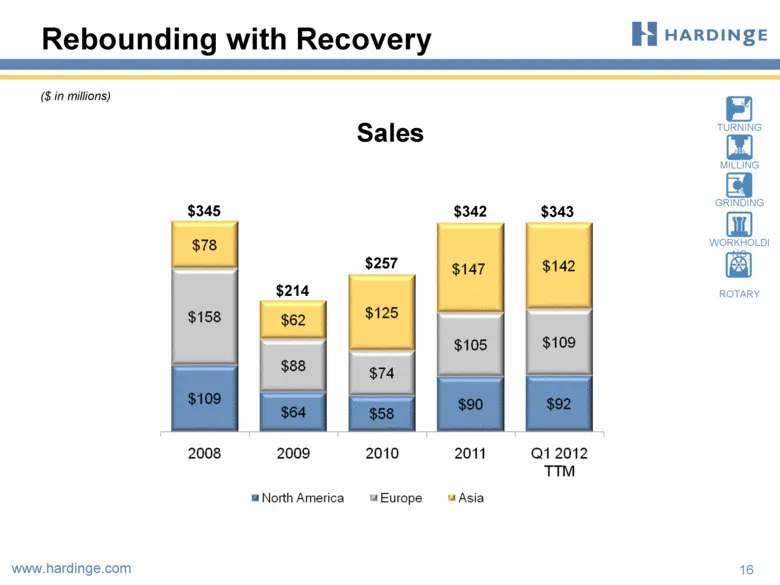
Rebounding with Recovery 16 $214 $345 $257 $342 Sales ($ in millions) $343
Slide 16: Sales & Gross Margin
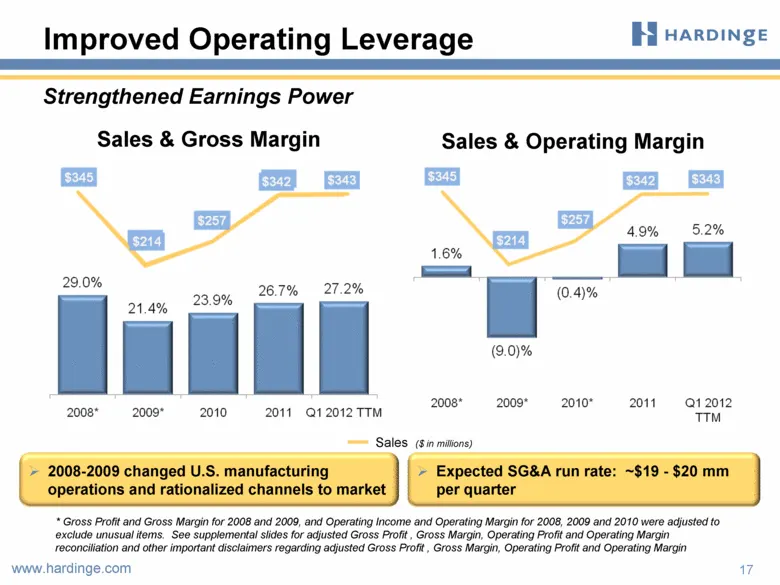
Sales & Gross Margin Improved Operating Leverage 17 Sales & Operating Margin 2008-2009 changed U.S. manufacturing operations and rationalized channels to market Expected SG&A run rate: ~$19 - $20 mm per quarter Sales ($ in millions) Strengthened Earnings Power * Gross Profit and Gross Margin for 200
Slide 17: Margins Vary with Product & Customer Mix
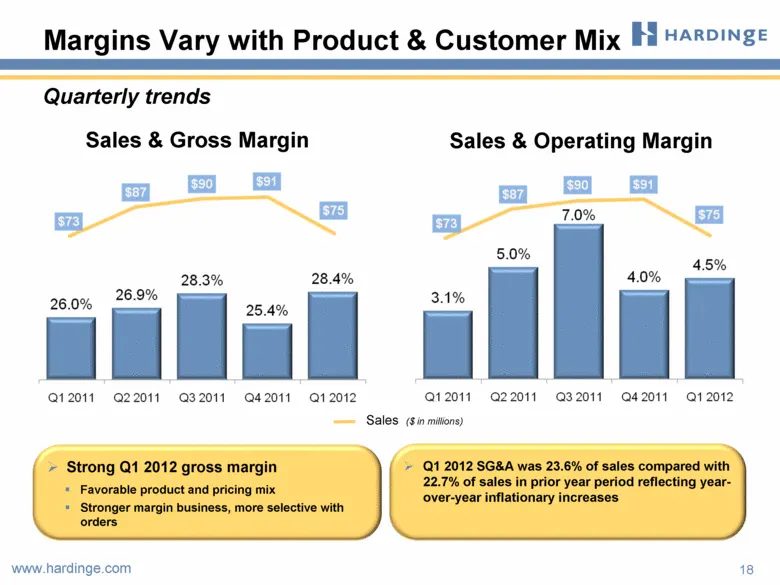
Margins Vary with Product & Customer Mix 18 Quarterly trends Sales ($ in millions) Sales & Gross Margin Sales & Operating Margin Q1 2012 SG&A was 23.6% of sales compared with 22.7% of sales in prior year period reflecting year-over-year inflationary increases Strong Q1 2012 gross margin Favorable pr
Slide 18: Emphasis on Productivity and Cash
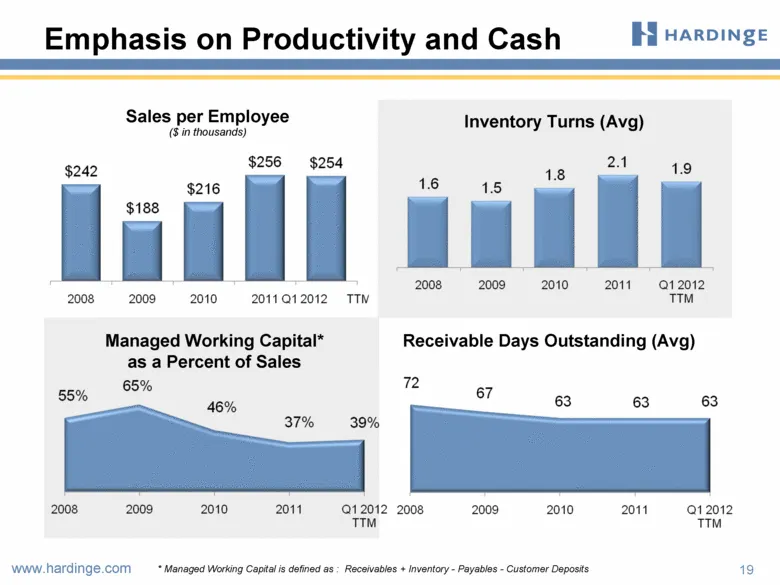
Emphasis on Productivity and Cash Sales per Employee ($ in thousands) Inventory Turns (Avg) Managed Working Capital* as a Percent of Sales Receivable Days Outstanding (Avg) 19 * Managed Working Capital is defined as : Receivables + Inventory - Payables - Customer Deposits
Slide 19: Driving Cash Generation
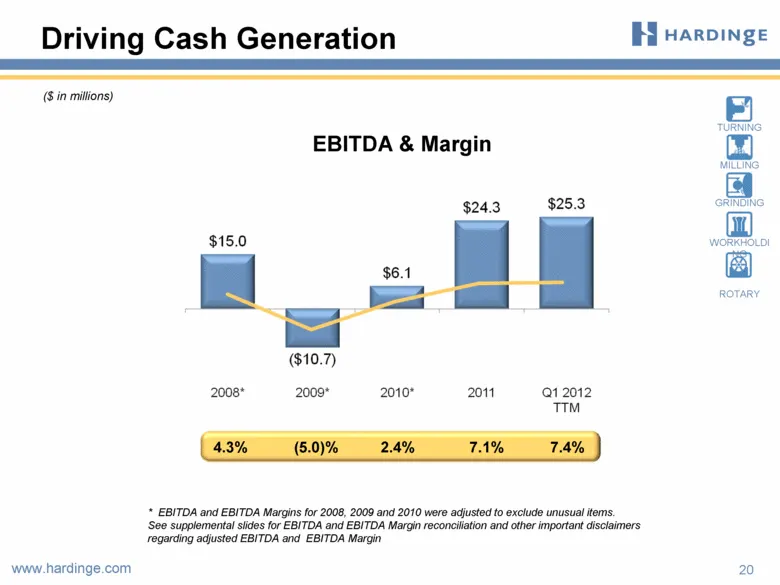
Driving Cash Generation * EBITDA and EBITDA Margins for 2008, 2009 and 2010 were adjusted to exclude unusual items. See supplemental slides for EBITDA and EBITDA Margin reconciliation and other important disclaimers regarding adjusted EBITDA and EBITDA Margin 20 EBITDA & Margin 4.3% (5.0)% 2.4% 7.1%
Slide 20: Growing Earnings Power
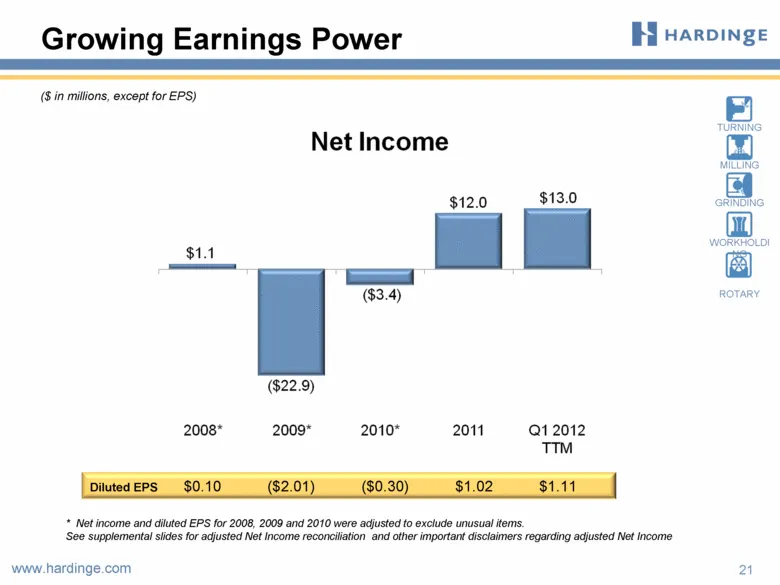
Growing Earnings Power 21 Diluted EPS $0.10 ($2.01) ($0.30) $1.02 $1.11 * Net income and diluted EPS for 2008, 2009 and 2010 were adjusted to exclude unusual items. See supplemental slides for adjusted Net Income reconciliation and other important disclaimers regarding adjusted Net Income ($ in mill
Slide 21: Financial Strength
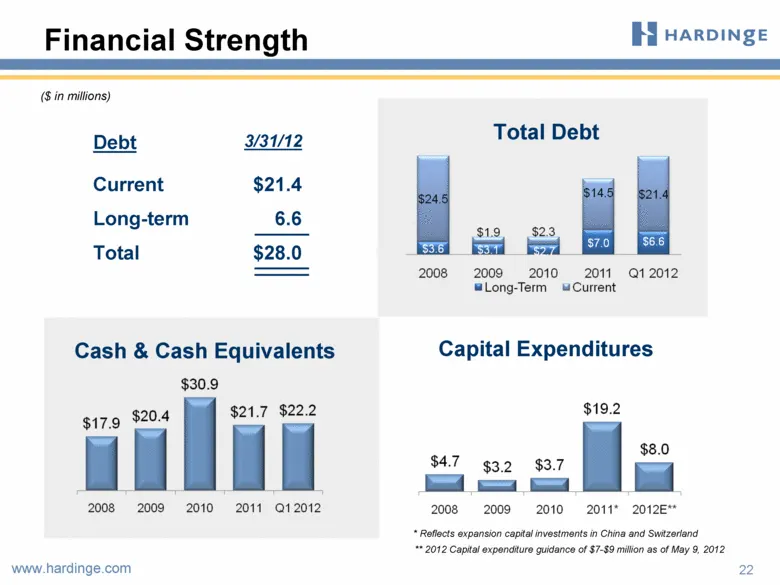
22 Financial Strength Debt 3/31/12 Current $21.4 Long-term 6.6 Total $28.0 Total Debt ($ in millions) * Reflects expansion capital investments in China and Switzerland Cash & Cash Equivalents Capital Expenditures ** 2012 Capital expenditure guidance of $7-$9 million as of May 9, 2012
Slide 22: Driving Long-Term Value: A better business model
DRIVING LONG-TERM VALUE: A better business model NASDAQ: HDNG www.hardinge.com
Slide 23: Driving Long-Term Value
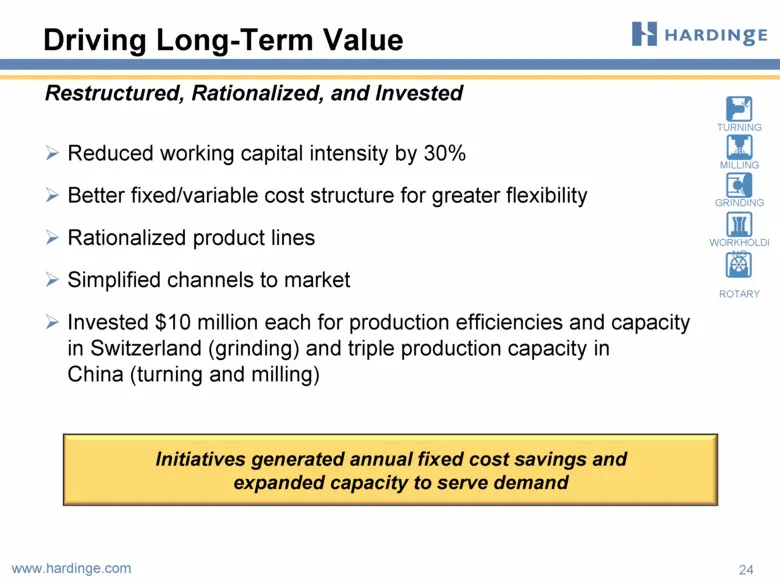
Driving Long-Term Value 24 Initiatives generated annual fixed cost savings and expanded capacity to serve demand Restructured, Rationalized, and Invested Reduced working capital intensity by 30% Better fixed/variable cost structure for greater flexibility Rationalized product lines Simplified channe
Slide 24: Strong Order Expansion
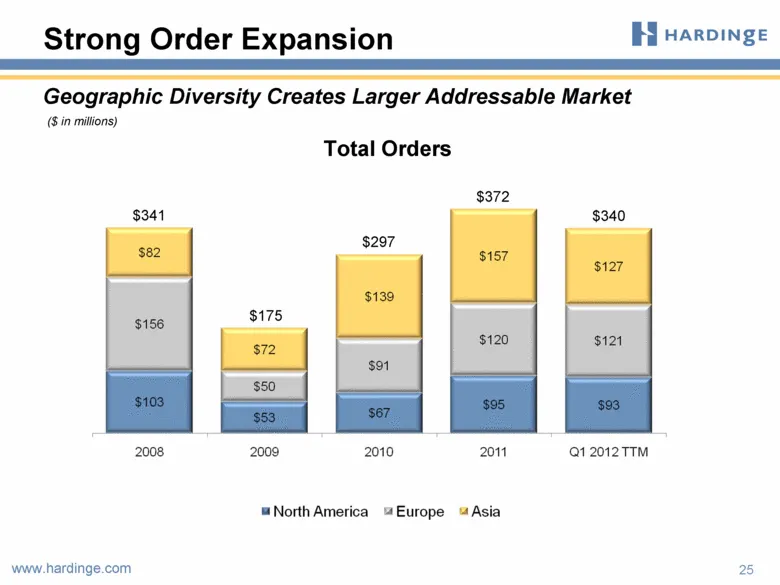
Strong Order Expansion 25 $175 $341 $297 $372 Total Orders ($ in millions) $340 Geographic Diversity Creates Larger Addressable Market
Slide 25: Moving Forward
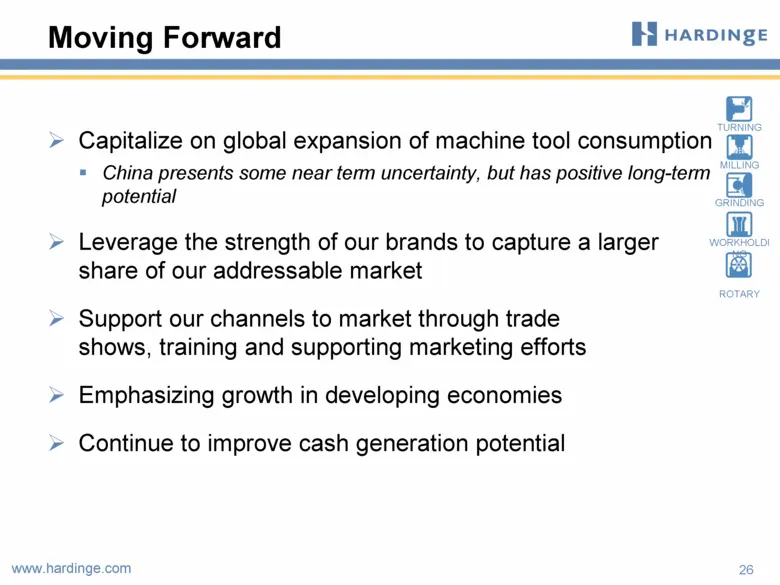
26 Moving Forward Capitalize on global expansion of machine tool consumption China presents some near term uncertainty, but has positive long-term potential Leverage the strength of our brands to capture a larger share of our addressable market Support our channels to market through trade shows, tra
Slide 26: Long-term Goals
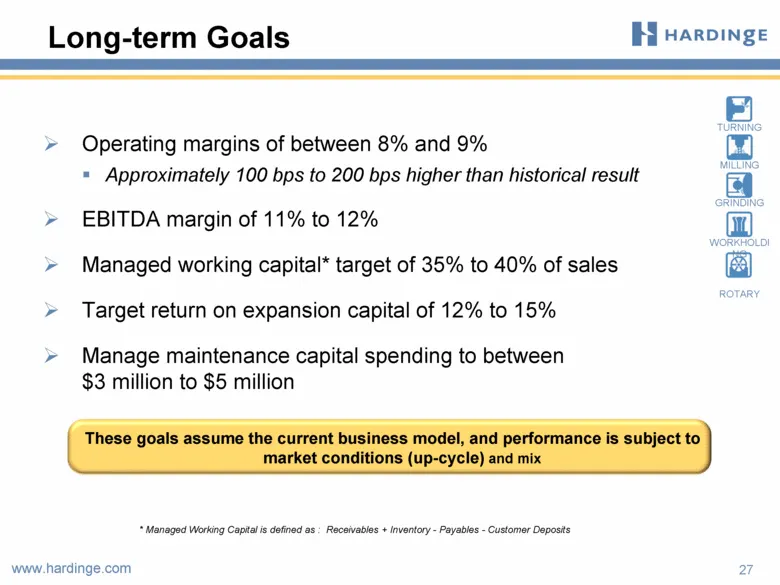
27 Long-term Goals Operating margins of between 8% and 9% Approximately 100 bps to 200 bps higher than historical result EBITDA margin of 11% to 12% Managed working capital* target of 35% to 40% of sales Target return on expansion capital of 12% to 15% Manage maintenance capital spending to between
Slide 27: Capitalize on Machine Tool Industry Expansion
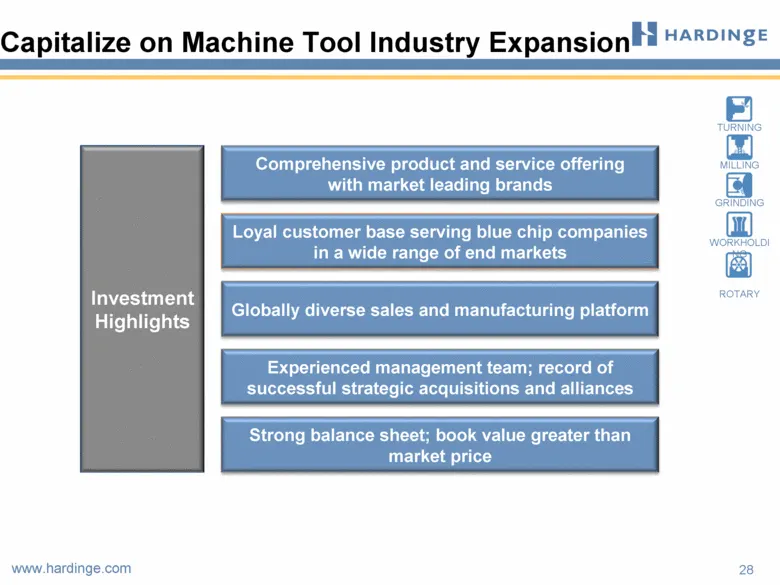
Capitalize on Machine Tool Industry Expansion Investment Highlights Comprehensive product and service offering with market leading brands Globally diverse sales and manufacturing platform Experienced management team; record of successful strategic acquisitions and alliances Loyal customer base servi
Slide 28: Houlihan Lokey 7th Annual Global Industrials Conference
NASDAQ: HDNG www.hardinge.com Houlihan Lokey 7th Annual Global Industrials Conference May 10, 2012 Edward J. Gaio Vice President and Chief Financial Officer Richard L. Simons Chairman, President and Chief Executive Officer
Slide 29: Supplemental Slides
NASDAQ: HDNG SUPPLEMENTAL SLIDES www.hardinge.com
Slide 30: Highly Experienced Management Team
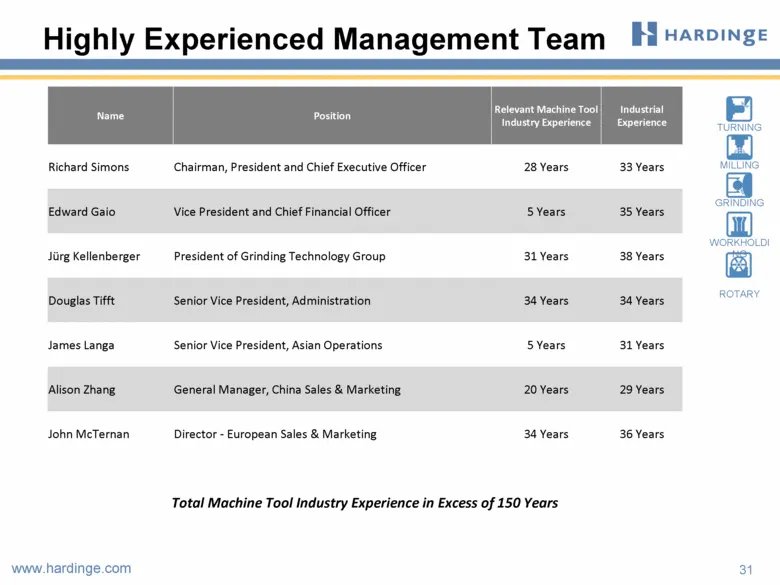
Highly Experienced Management Team 31 Name Position Relevant Machine Tool Industry Experience Industrial Experience Richard Simons Chairman, President and Chief Executive Officer 28 Years 33 Years Edward Gaio Vice President and Chief Financial Officer 5 Years 35 Years Jürg Kellenberger President of
Slide 31: Expanded Footprint Efforts
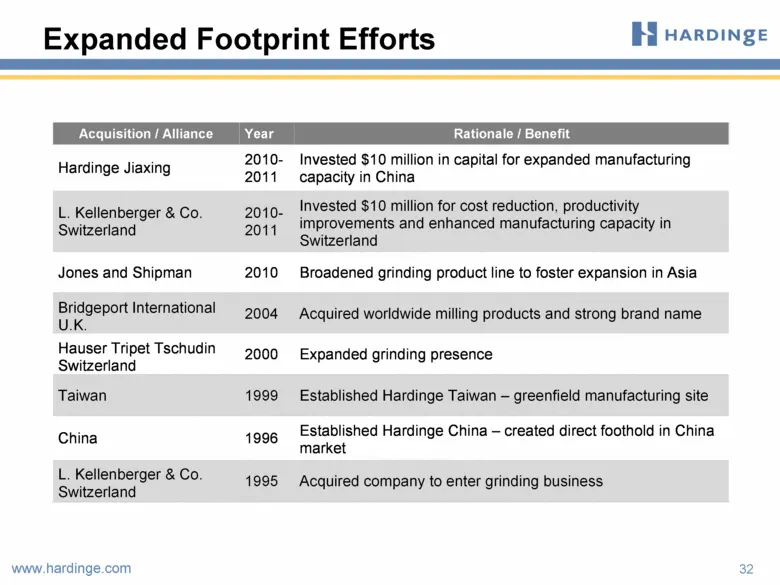
Expanded Footprint Efforts 32 Acquisition / Alliance Year Rationale / Benefit Hardinge Jiaxing 2010-2011 Invested $10 million in capital for expanded manufacturing capacity in China L. Kellenberger & Co. Switzerland 2010-2011 Invested $10 million for cost reduction, productivity improvements and enh
Slide 32: Annual Adjusted Gross Profit Reconciliation
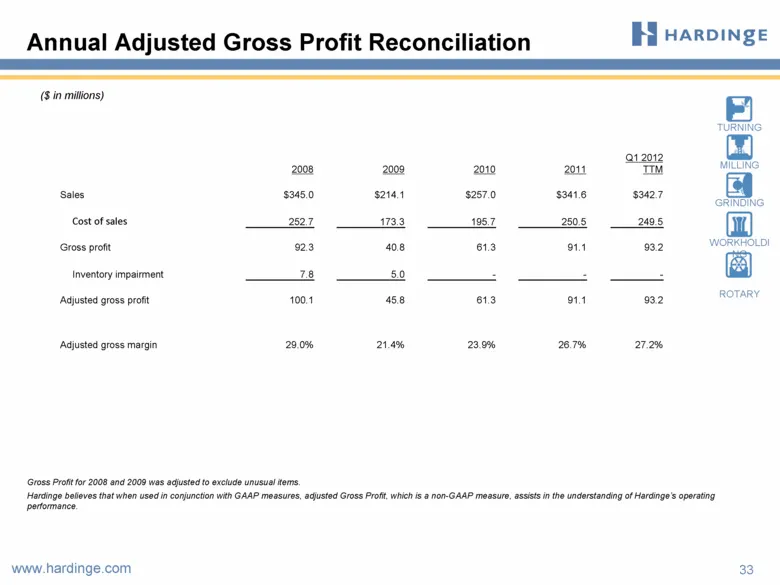
Annual Adjusted Gross Profit Reconciliation 33 ($ in millions) Gross Profit for 2008 and 2009 was adjusted to exclude unusual items. Hardinge believes that when used in conjunction with GAAP measures, adjusted Gross Profit, which is a non-GAAP measure, assists in the understanding of Hardinge’s oper
Slide 33: Annual Adjusted Net Income / EBITDA Reconciliation
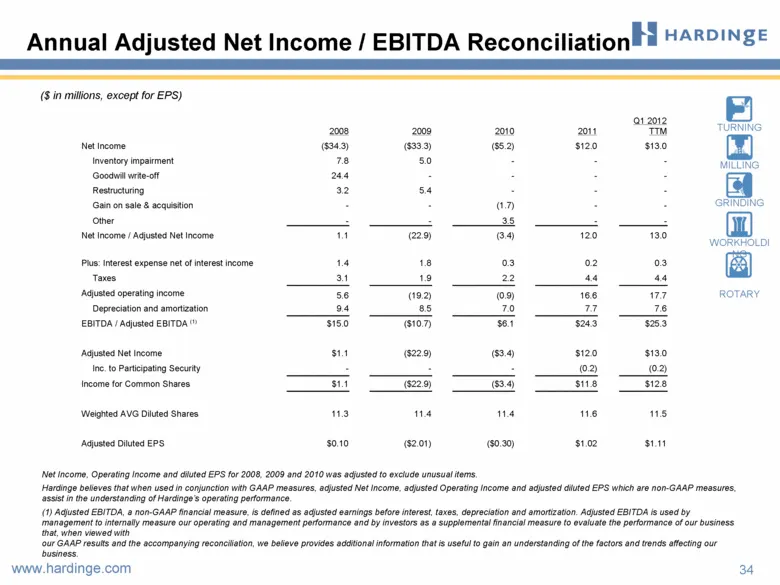
Annual Adjusted Net Income / EBITDA Reconciliation 34 ($ in millions, except for EPS) Net Income, Operating Income and diluted EPS for 2008, 2009 and 2010 was adjusted to exclude unusual items. Hardinge believes that when used in conjunction with GAAP measures, adjusted Net Income, adjusted Operatin
Source: SEC EDGAR · 8-K filed May 9, 2012
More decks from Hardinge Inc
 Q3 2017 Earnings Presentation21 slides · Nov 9, 2017
 Q2 2017 Earnings Presentation19 slides · Aug 3, 2017
 Q1 2017 Earnings Presentation17 slides · May 5, 2017
 Q4 2016 Earnings Presentation17 slides · Feb 9, 2017
 Q3 2016 Earnings Presentation18 slides · Nov 2, 2016
 Q2 2016 Earnings Presentation19 slides · Aug 5, 2016