Santander Consumer USA Holdings Inc
Santander Consumer USA — Investor Day (November 2015)
48 slides from Santander Consumer USA's investor day presentation, Nov 19, 2015
Slide 1: 2015 Analyst and Investor Day
11.19.2015 SANTANDER CONSUMER USA HOLDINGS INC. 2015 Analyst and Investor Day Exhibit 99.1
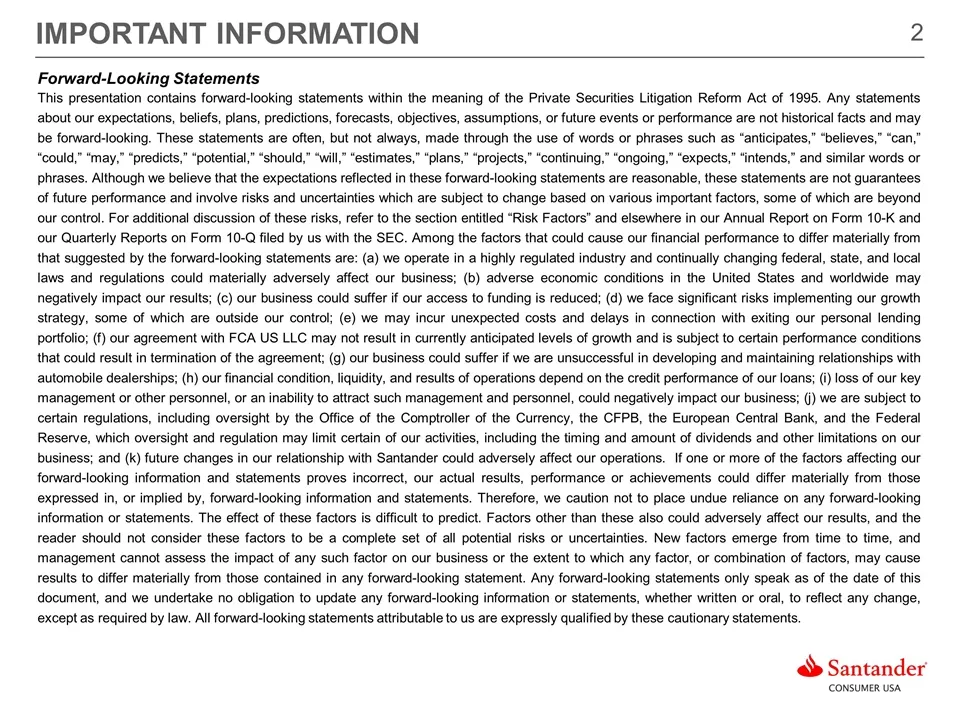
Slide 2: Important Information
IMPORTANT INFORMATION Forward-Looking Statements This presentation contains forward-looking statements within the meaning of the Private Securities Litigation Reform Act of 1995. Any statements about our expectations, beliefs, plans, predictions, forecasts, objectives, assumptions, or future events
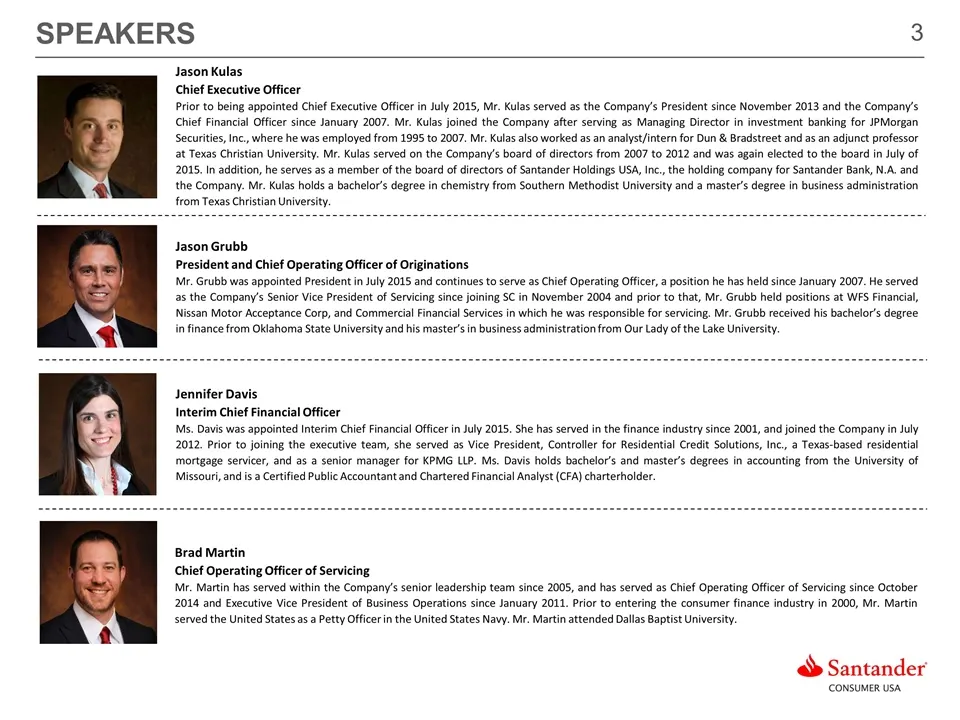
Slide 3: Speakers
SPEAKERS Jason Kulas Chief Executive Officer Prior to being appointed Chief Executive Officer in July 2015, Mr. Kulas served as the Company’s President since November 2013 and the Company’s Chief Financial Officer since January 2007. Mr. Kulas joined the Company after serving as Managing Director in
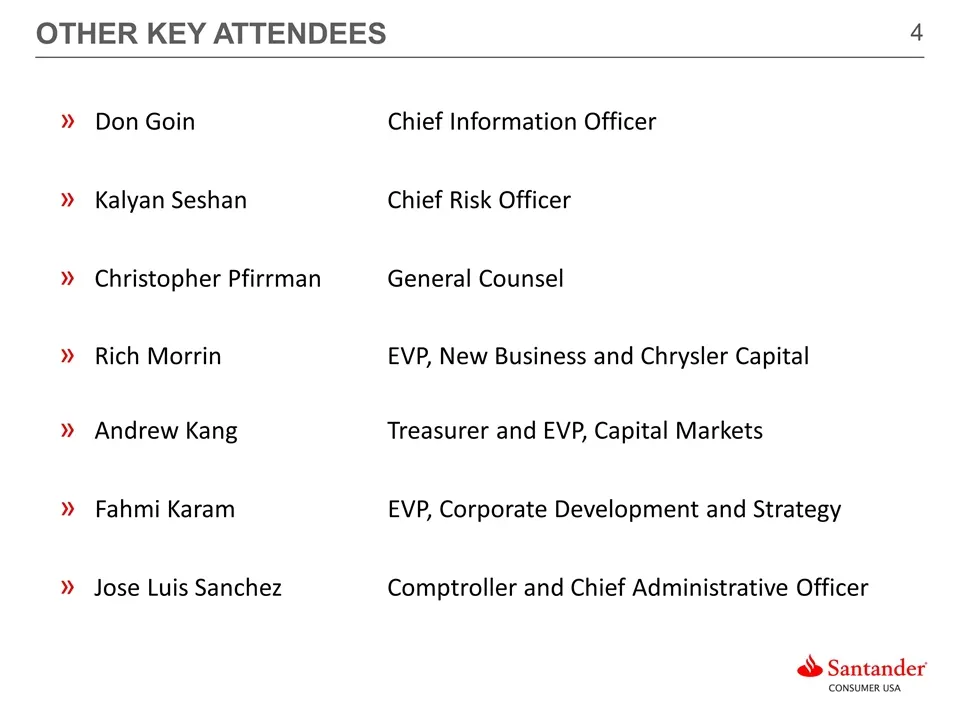
Slide 4: Other Key Attendees
OTHER KEY ATTENDEES Don GoinChief Information Officer Kalyan SeshanChief Risk Officer Christopher PfirrmanGeneral Counsel Rich MorrinEVP, New Business and Chrysler Capital Andrew KangTreasurer and EVP, Capital Markets Fahmi KaramEVP, Corporate Development and Strategy Jose Luis SanchezComptroller an
Slide 5: Agenda
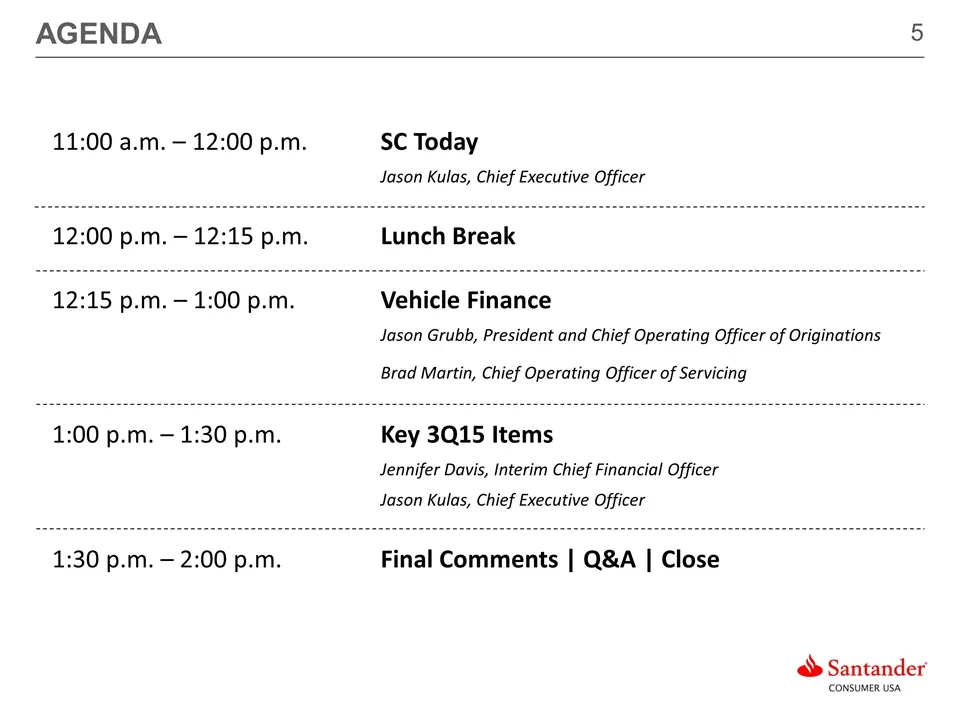
AGENDA 11:00 a.m. – 12:00 p.m.SC Today Jason Kulas, Chief Executive Officer 12:00 p.m. – 12:15 p.m.Lunch Break 12:15 p.m. – 1:00 p.m.Vehicle Finance Jason Grubb, President and Chief Operating Officer of Originations Brad Martin, Chief Operating Officer of Servicing 1:00 p.m. – 1:30 p.m. Key 3Q15 Ite

Slide 6: SC Today
SC TODAY Jason Kulas, Chief Executive Officer
Slide 7: What Differentiates SC
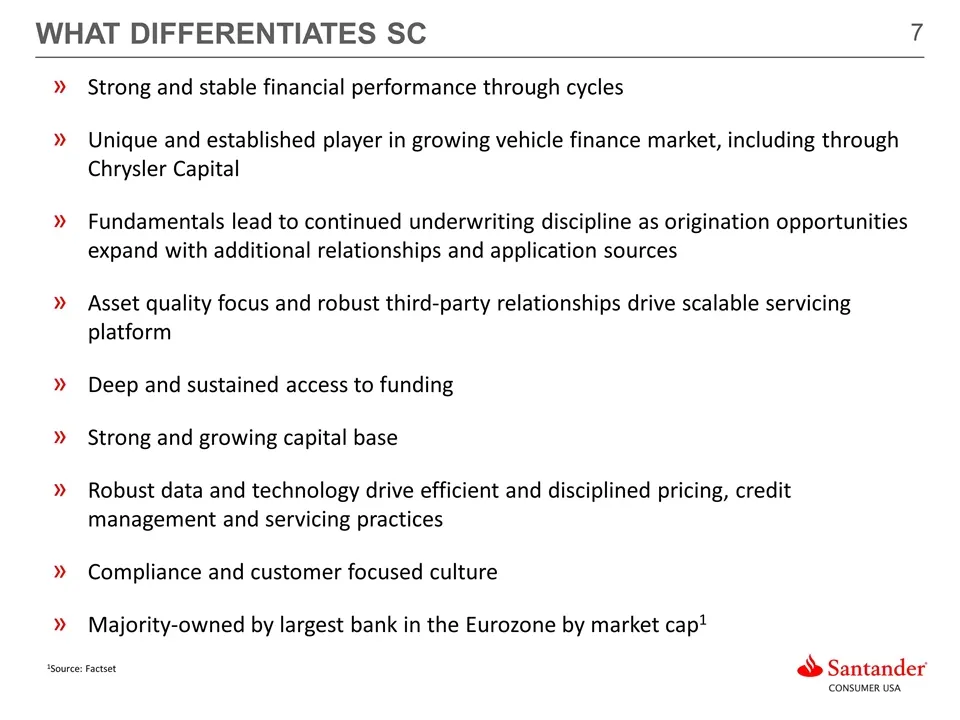
WHAT DIFFERENTIATES SC Strong and stable financial performance through cycles Unique and established player in growing vehicle finance market, including through Chrysler Capital Fundamentals lead to continued underwriting discipline as origination opportunities expand with additional relationships a
Slide 8: Strong Financial Performance
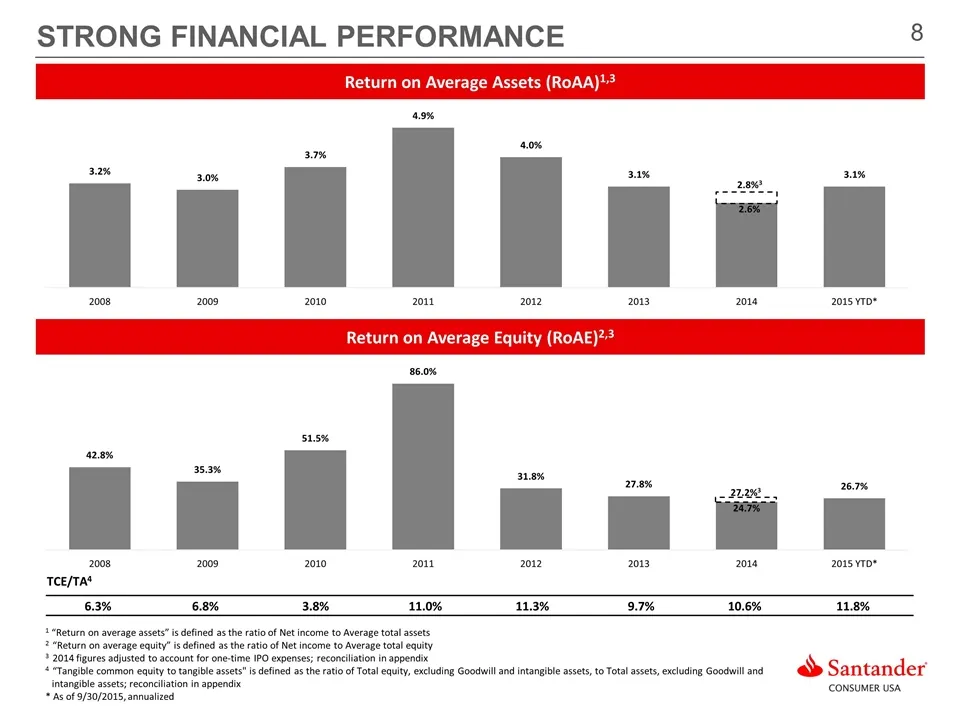
STRONG FINANCIAL PERFORMANCE 1 “Return on average assets” is defined as the ratio of Net income to Average total assets 2 “Return on average equity” is defined as the ratio of Net income to Average total equity 3 2014 figures adjusted to account for one-time IPO expenses; reconciliation in appendix
Slide 9: Focused Business Model
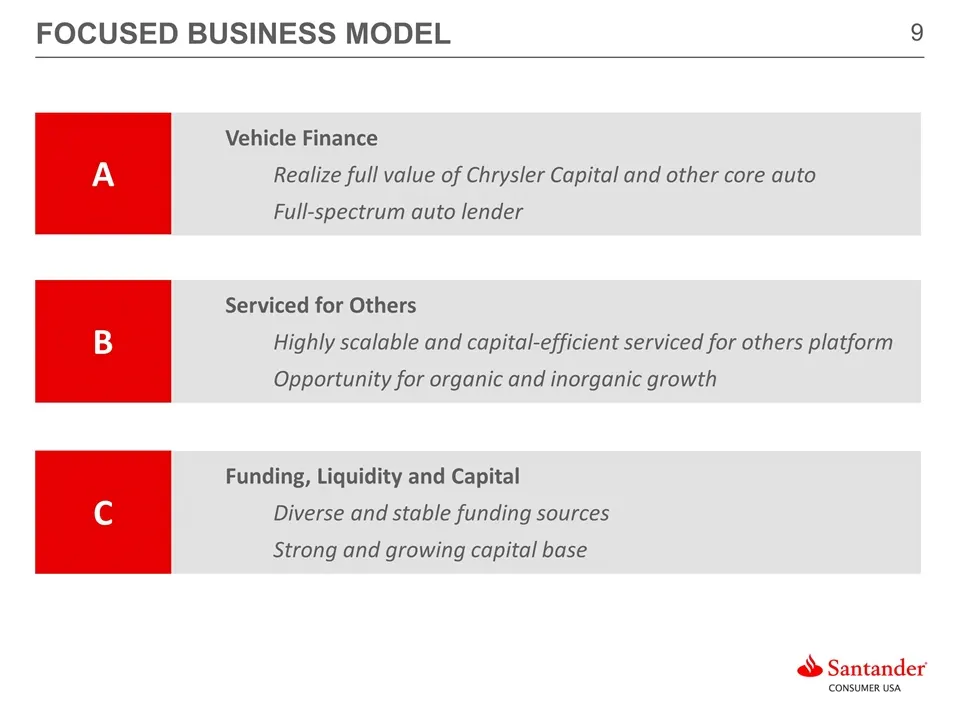
FOCUSED BUSINESS MODEL Vehicle Finance Realize full value of Chrysler Capital and other core auto Full-spectrum auto lender A Serviced for Others Highly scalable and capital-efficient serviced for others platform Opportunity for organic and inorganic growth B Funding, Liquidity and Capital Diverse a
Slide 10: Abundant origination opportunities
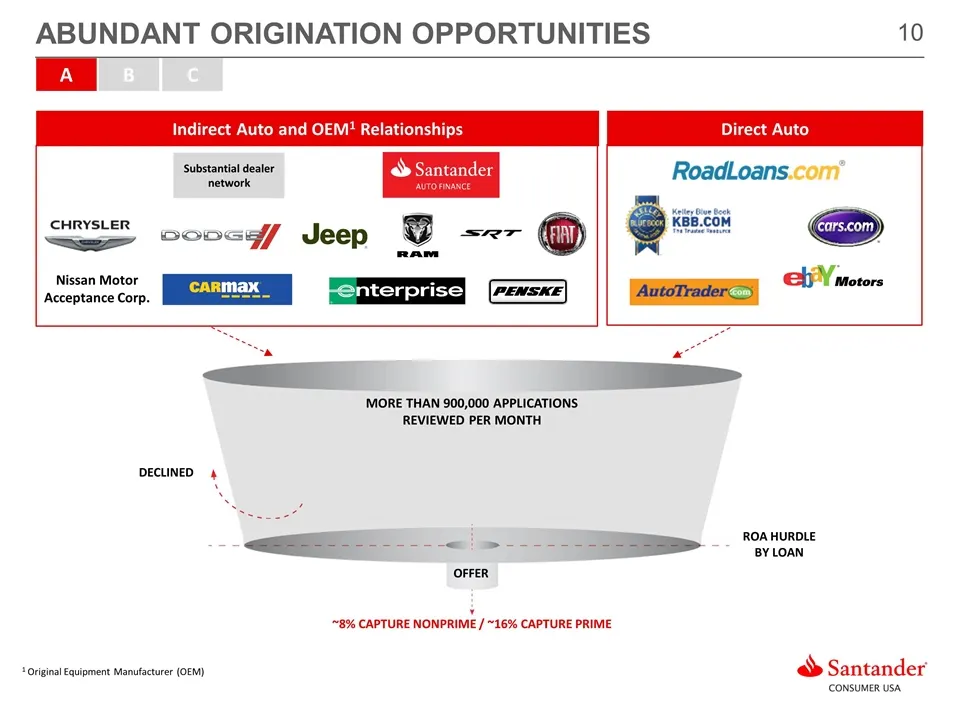
Abundant origination opportunities ~8% capture nonprime / ~16% capture prime More than 900,000 applications reviewed per month ROA HURDLE BY LOAN DECLINED OFFER Substantial dealer network 1 Original Equipment Manufacturer (OEM) Direct Auto Indirect Auto and OEM1 Relationships Nissan Motor Acceptance
Slide 11: Strong Auto Origination Growth
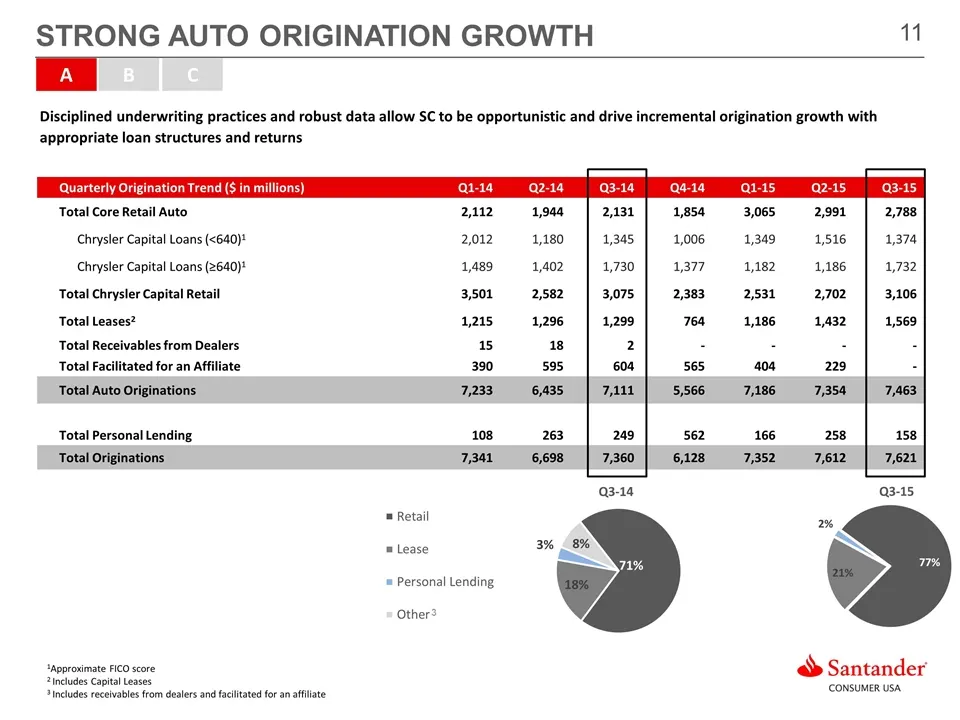
STRONG AUTO ORIGINATION GROWTH Quarterly Origination Trend ($ in millions) Q1-14 Q2-14 Q3-14 Q4-14 Q1-15 Q2-15 Q3-15 Total Core Retail Auto 2,112 1,944 2,131 1,854 3,065 2,991 2,788 Chrysler Capital Loans (<640)1 2,012 1,180 1,345 1,006 1,349 1,516 1,374 Chrysler Capital Loans (≥640)1 1,489 1,402 1,
Slide 12: Strategic approach to portfolio optimization
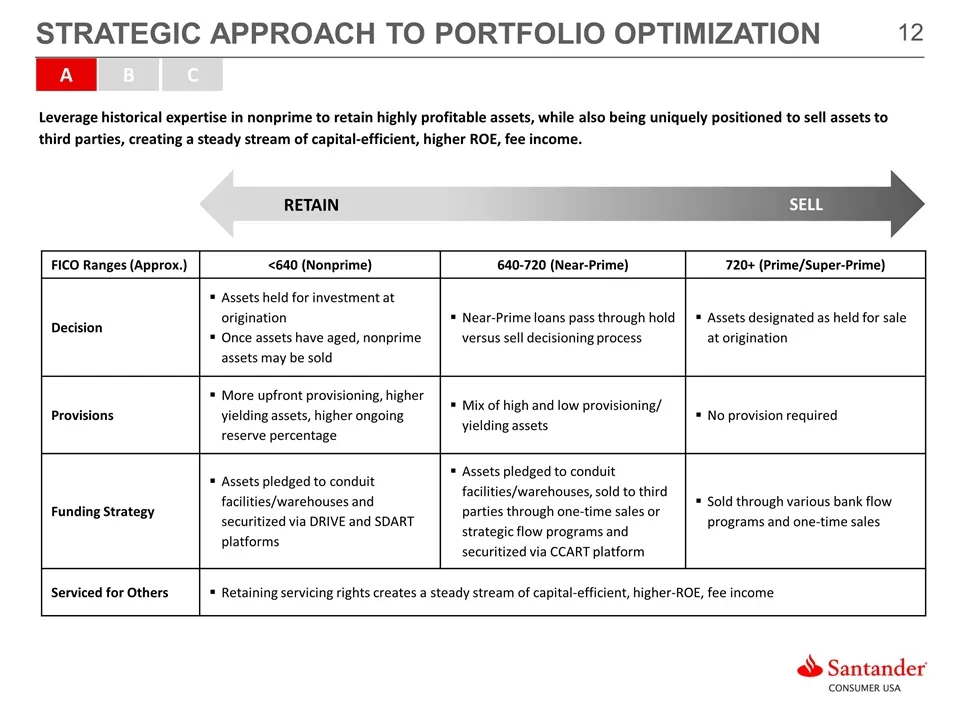
STRATEGIC approach to portfolio optimization SELL FICO Ranges (Approx.) <640 (Nonprime) 640-720 (Near-Prime) 720+ (Prime/Super-Prime) Decision Assets held for investment at origination Once assets have aged, nonprime assets may be sold Near-Prime loans pass through hold versus sell decisioning proce
Slide 13: Growth in Serviced for Others Platform
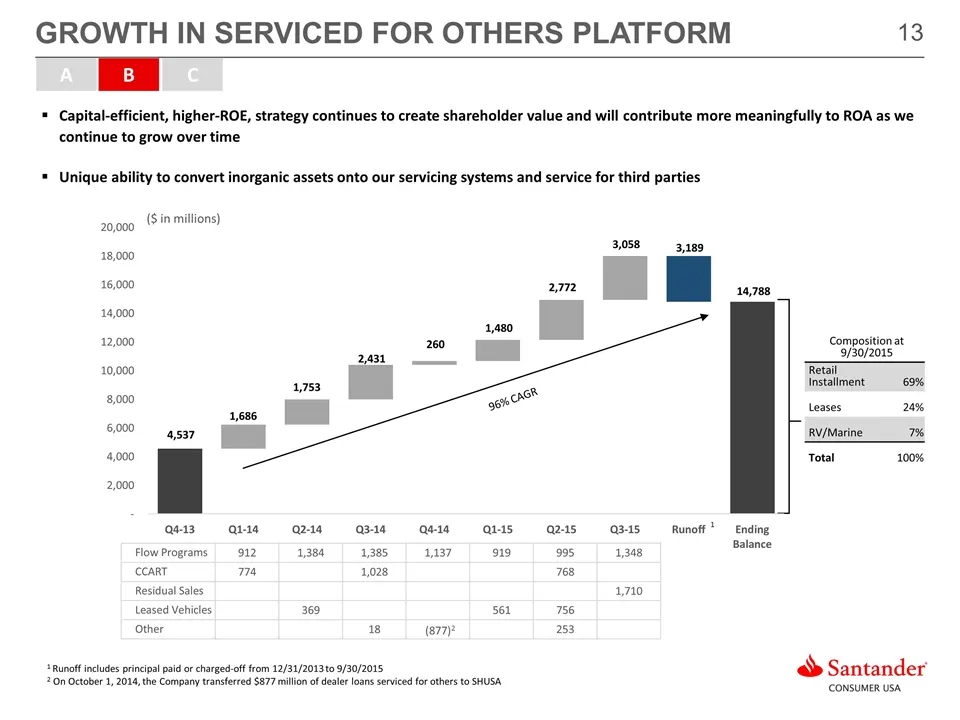
(877)2 Capital-efficient, higher-ROE, strategy continues to create shareholder value and will contribute more meaningfully to ROA as we continue to grow over time Unique ability to convert inorganic assets onto our servicing systems and service for third parties GROWTH IN SERVICED FOR OTHERS PLATFOR
Slide 14: Trends in Investment Gains
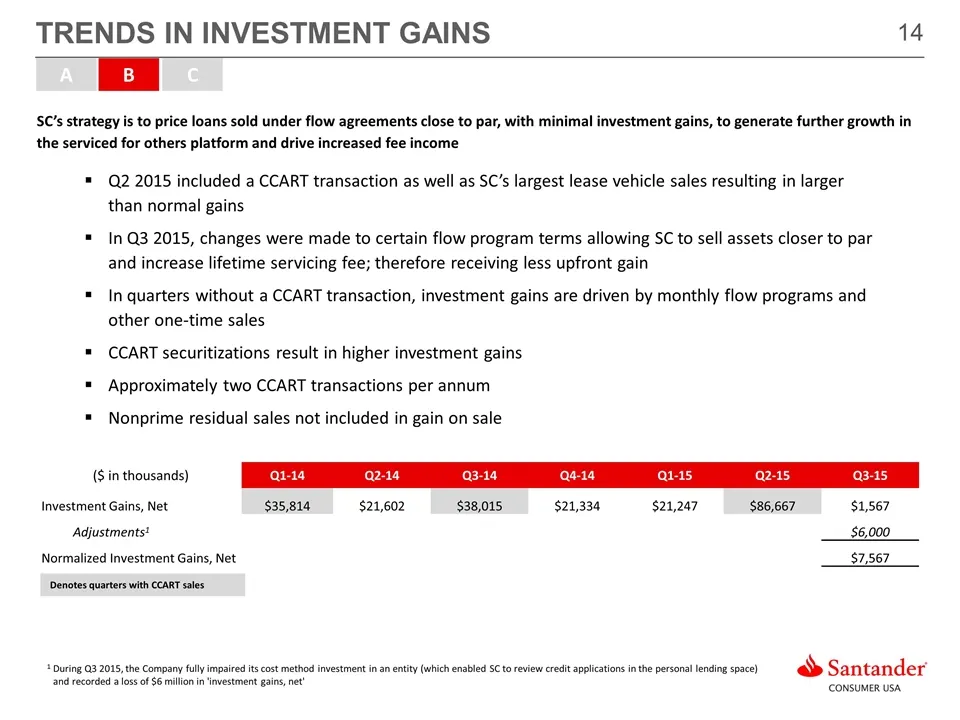
TRENDS IN INVESTMENT GAINS ($ in thousands) Q1-14 Q2-14 Q3-14 Q4-14 Q1-15 Q2-15 Q3-15 Investment Gains, Net $35,814 $21,602 $38,015 $21,334 $21,247 $86,667 $1,567 Adjustments1 $6,000 Normalized Investment Gains, Net $7,567 Denotes quarters with CCART sales Q2 2015 included a CCART transaction as wel
Slide 15: Expansion of Servicing Capabilities
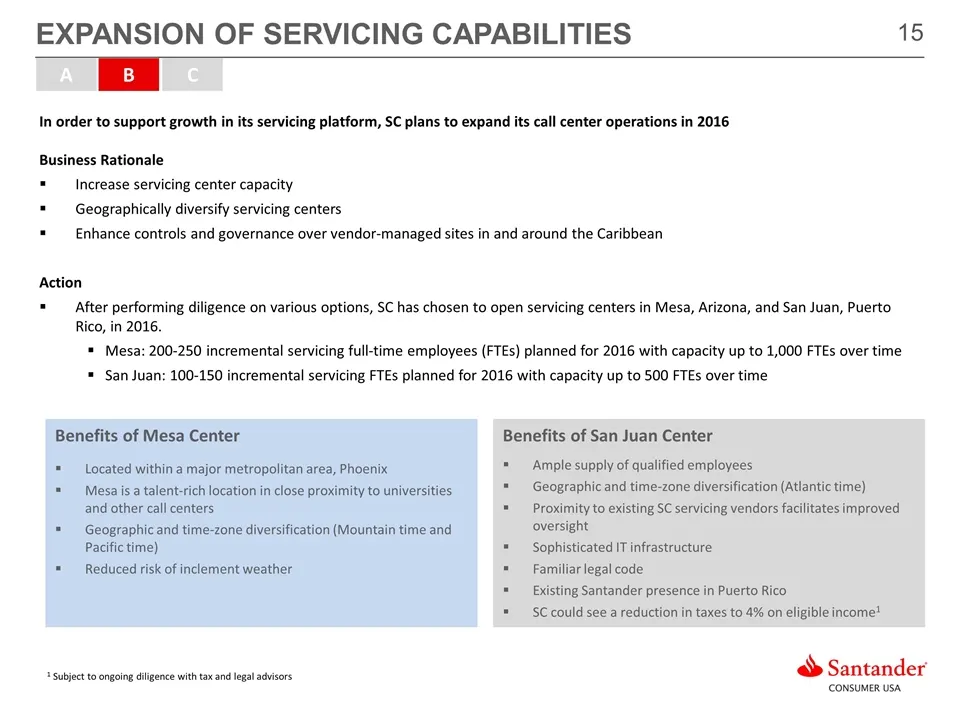
EXPANSION OF SERVICING CAPABILITIES In order to support growth in its servicing platform, SC plans to expand its call center operations in 2016 Business Rationale Increase servicing center capacity Geographically diversify servicing centers Enhance controls and governance over vendor-managed sites i
Slide 16: Consistent Capital Generation
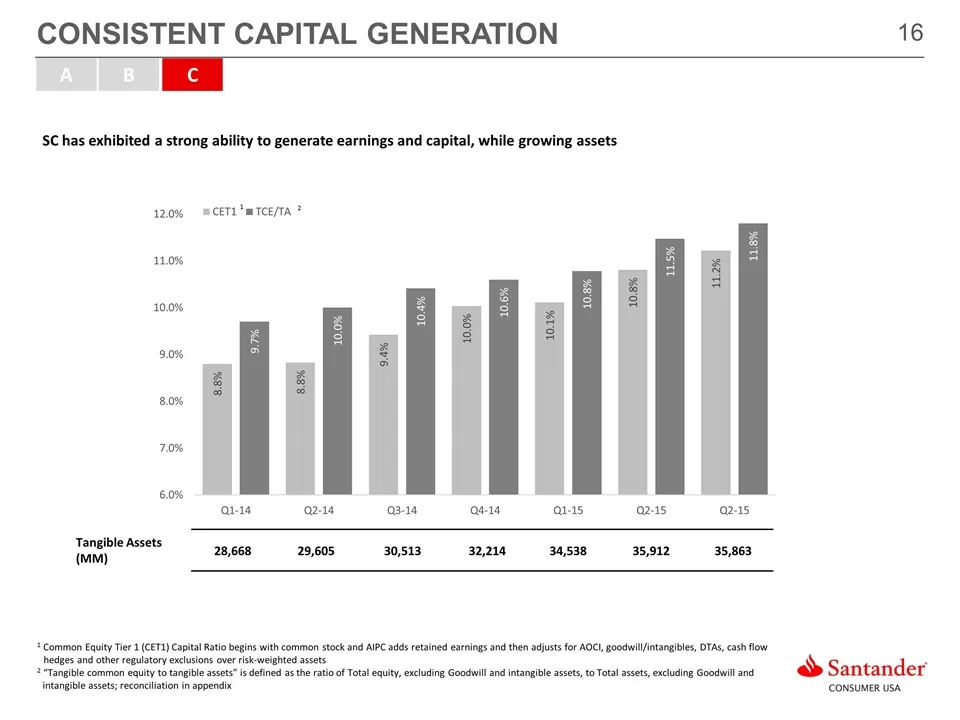
CONSISTENT CAPITAL GENERATION SC has exhibited a strong ability to generate earnings and capital, while growing assets A B C 1 Common Equity Tier 1 (CET1) Capital Ratio begins with common stock and AIPC adds retained earnings and then adjusts for AOCI, goodwill/intangibles, DTAs, cash flow hedges an
Slide 17: Deeper and more diversified funding
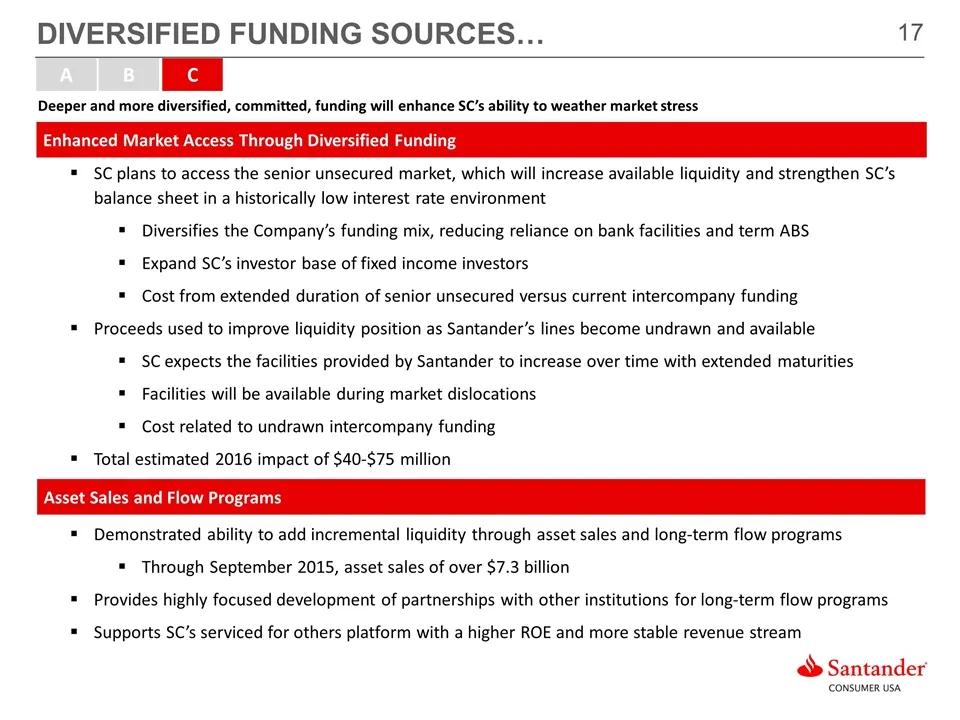
Deeper and more diversified, committed, funding will enhance SC’s ability to weather market stress A B C SC plans to access the senior unsecured market, which will increase available liquidity and strengthen SC’s balance sheet in a historically low interest rate environment Diversifies the Company’s
Slide 18: Diverse Funding Sources
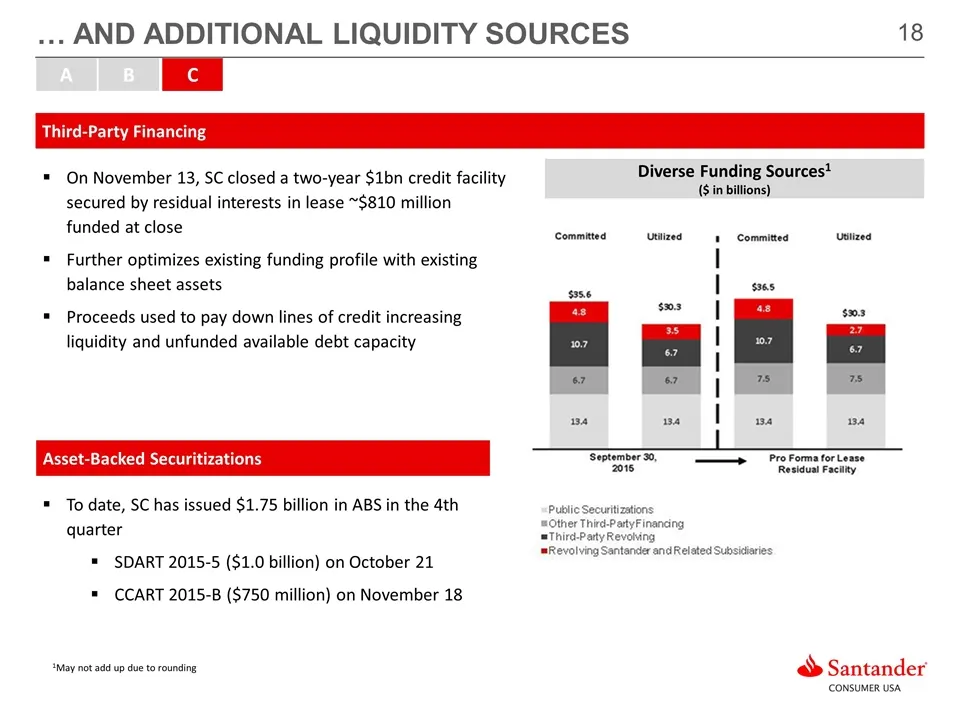
1May not add up due to rounding A B C Third-Party Financing Diverse Funding Sources1 ($ in billions) On November 13, SC closed a two-year $1bn credit facility secured by residual interests in lease ~$810 million funded at close Further optimizes existing funding profile with existing balance sheet a
Slide 19: Multiple Levers for Growth
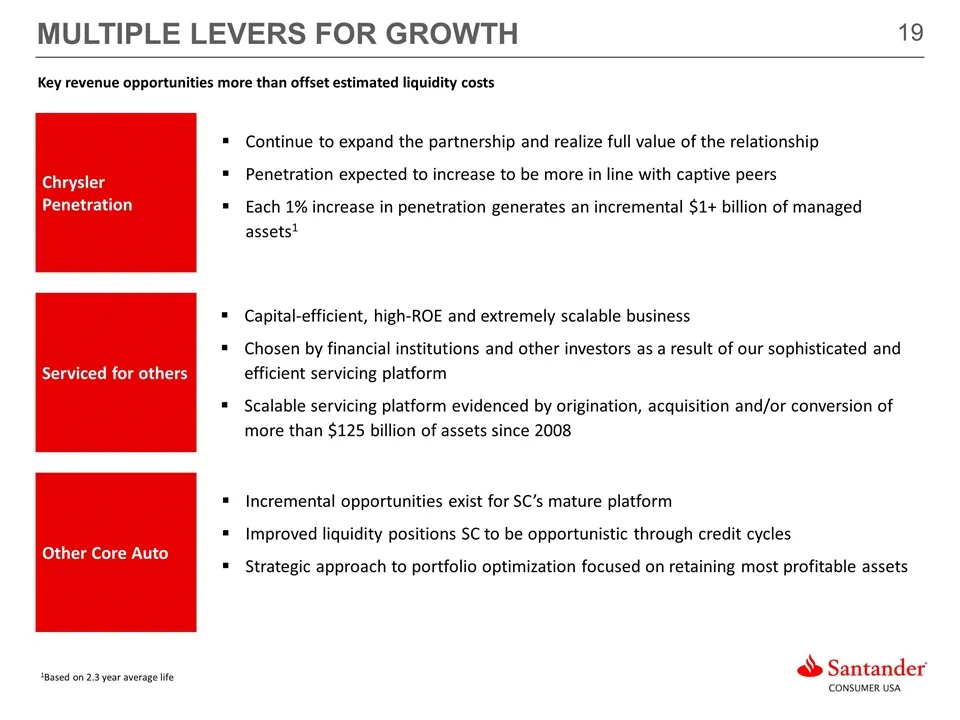
MULTIPLE LEVERS FOR GROWTH Chrysler Penetration Continue to expand the partnership and realize full value of the relationship Penetration expected to increase to be more in line with captive peers Each 1% increase in penetration generates an incremental $1+ billion of managed assets1 Serviced for ot
Slide 20: Proven Execution
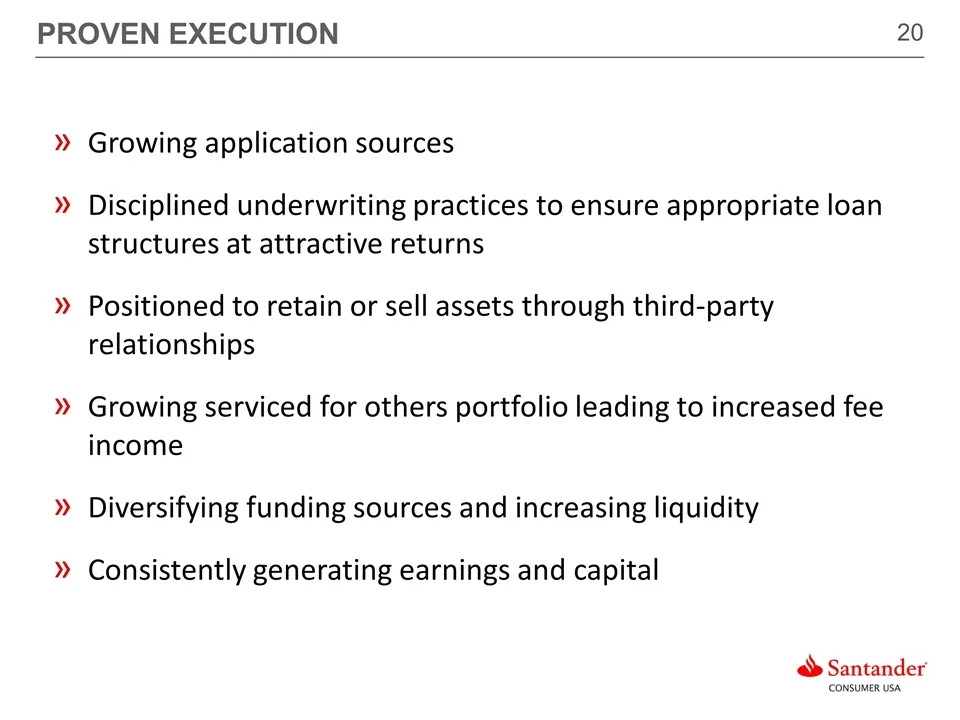
PROVEN EXECUTION Growing application sources Disciplined underwriting practices to ensure appropriate loan structures at attractive returns Positioned to retain or sell assets through third-party relationships Growing serviced for others portfolio leading to increased fee income Diversifying funding
Slide 21: Vehicle Finance – Industry, Originations & Credit
VEHICLE FINANCE – INDUSTRY, ORIGINATIONS & CREDIT Jason Grubb, President & Chief Operating Officer of Originations
Slide 22: Industry, Originations and Credit
INDUSTRY, ORIGINATIONS AND CREDIT Robust Market Opportunity A Competition B Consistent Performance C
Slide 23: State of the Automotive Finance Market
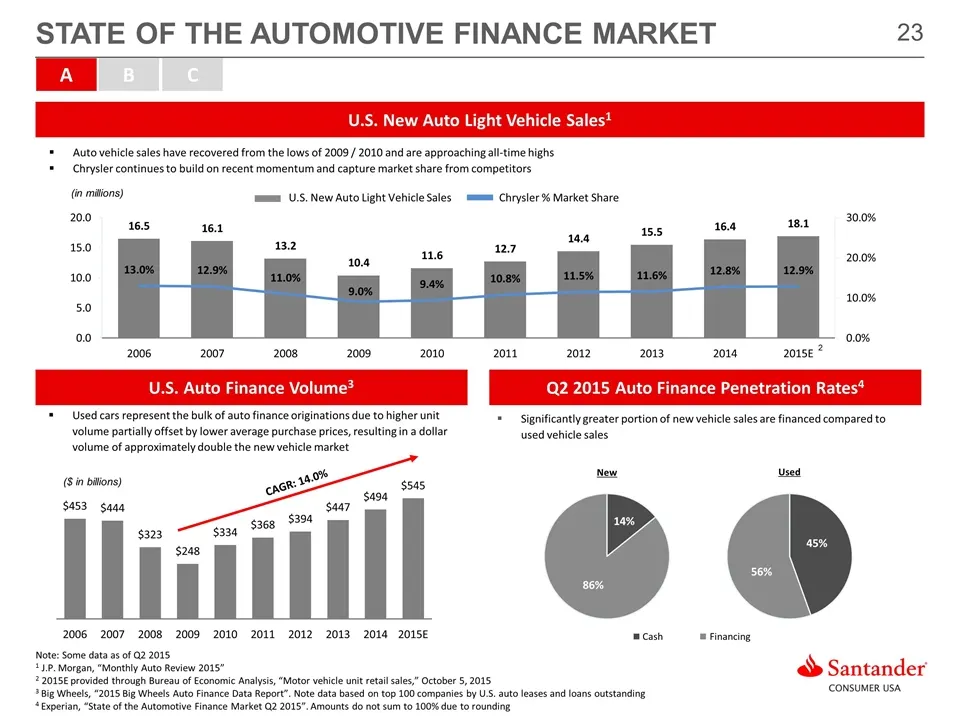
STATE OF THE AUTOMOTIVE FINANCE MARKET Used cars represent the bulk of auto finance originations due to higher unit volume partially offset by lower average purchase prices, resulting in a dollar volume of approximately double the new vehicle market Significantly greater portion of new vehicle sales
Slide 24: Industry credit mix consistent
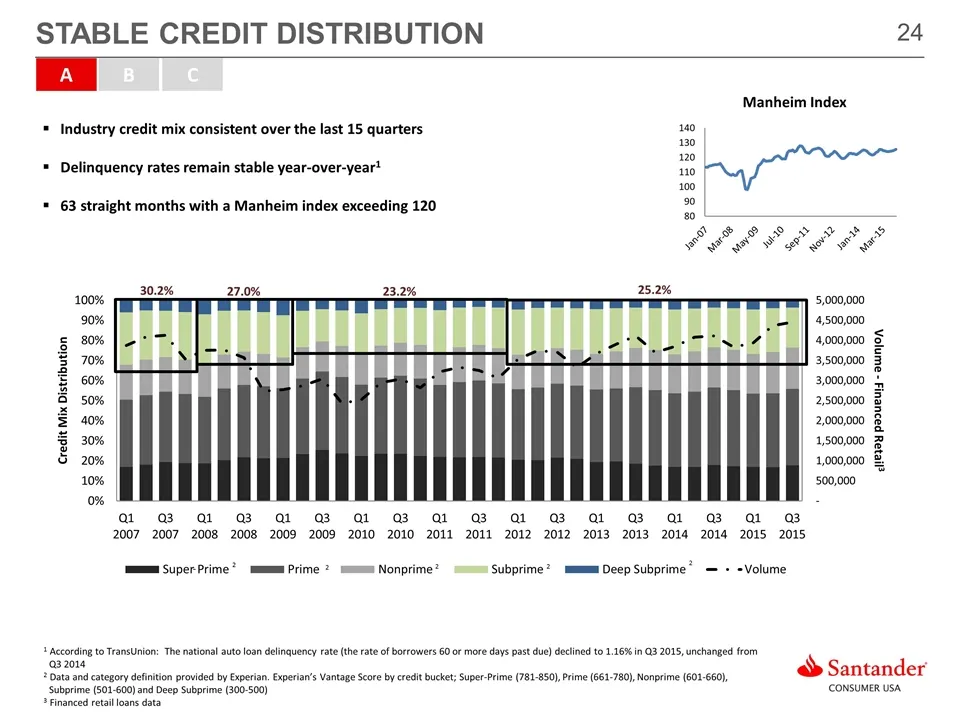
Industry credit mix consistent over the last 15 quarters Delinquency rates remain stable year-over-year1 63 straight months with a Manheim index exceeding 120 Stable credit distribution A B C 1 According to TransUnion: The national auto loan delinquency rate (the rate of borrowers 60 or more days pa
Slide 25: Lease and Retail Market Share & Rankings
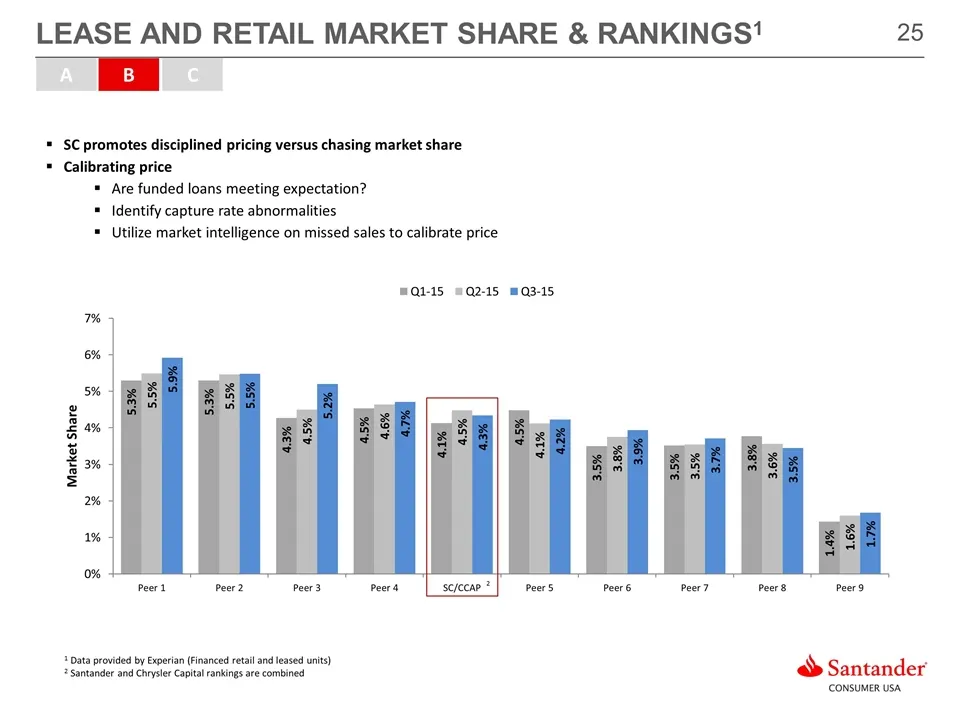
Lease and retail Market Share & Rankings1 A B C SC promotes disciplined pricing versus chasing market share Calibrating price Are funded loans meeting expectation? Identify capture rate abnormalities Utilize market intelligence on missed sales to calibrate price 1 Data provided by Experian (Financed
Slide 26: Originations Profile by Year
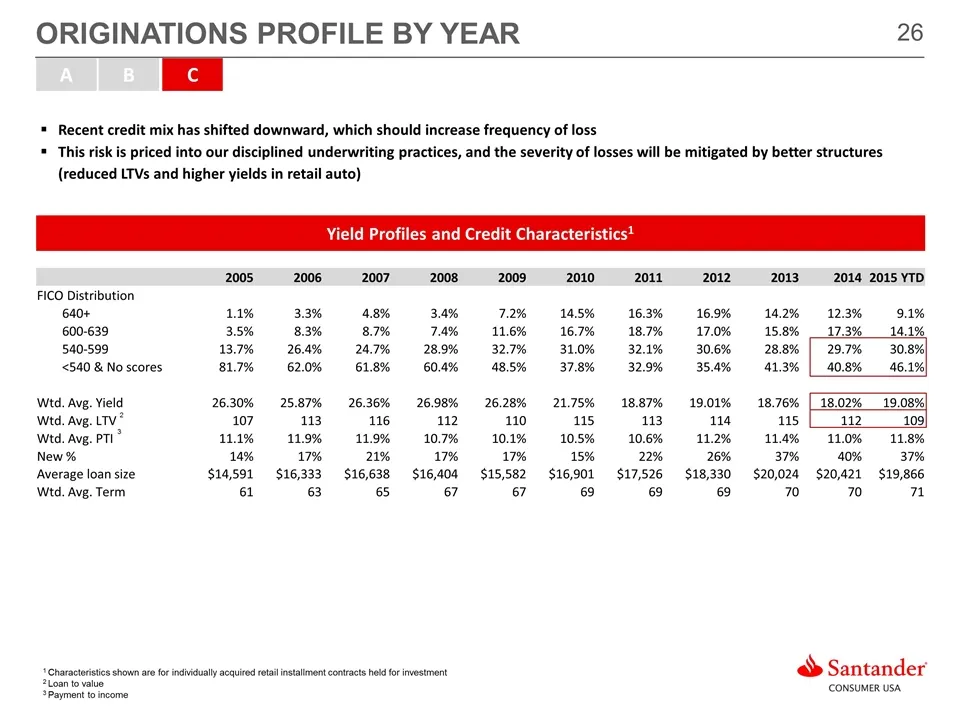
2005 2006 2007 2008 2009 2010 2011 2012 2013 2014 2015 YTD FICO Distribution 640+ 1.1% 3.3% 4.8% 3.4% 7.2% 14.5% 16.3% 16.9% 14.2% 12.3% 9.1% 600-639 3.5% 8.3% 8.7% 7.4% 11.6% 16.7% 18.7% 17.0% 15.8% 17.3% 14.1% 540-599 13.7% 26.4% 24.7% 28.9% 32.7% 31.0% 32.1% 30.6% 28.8% 29.7% 30.8% <540 & No scor
Slide 27: Unit Economics by Origination Year
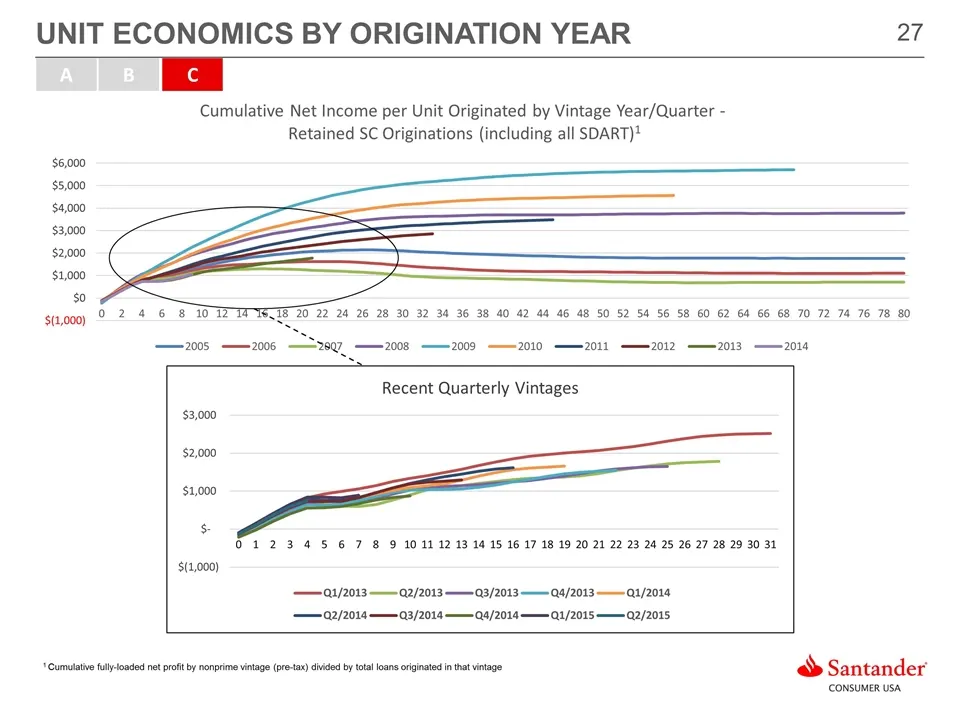
UNIT ECONOMICS BY ORIGINATION YEAR 1 Cumulative fully-loaded net profit by nonprime vintage (pre-tax) divided by total loans originated in that vintage A B C
Slide 28: Vehicle Finance – Servicing
VEHICLE FINANCE – SERVICING Brad Martin, Chief Operating Officer of Servicing
Slide 29: Modifications and TDRs
MODIFICATIONS AND TDRs Servicing Expertise A Modification Strategy and Performance B TDRs C
Slide 30: Industry-Leader in Loan Servicing
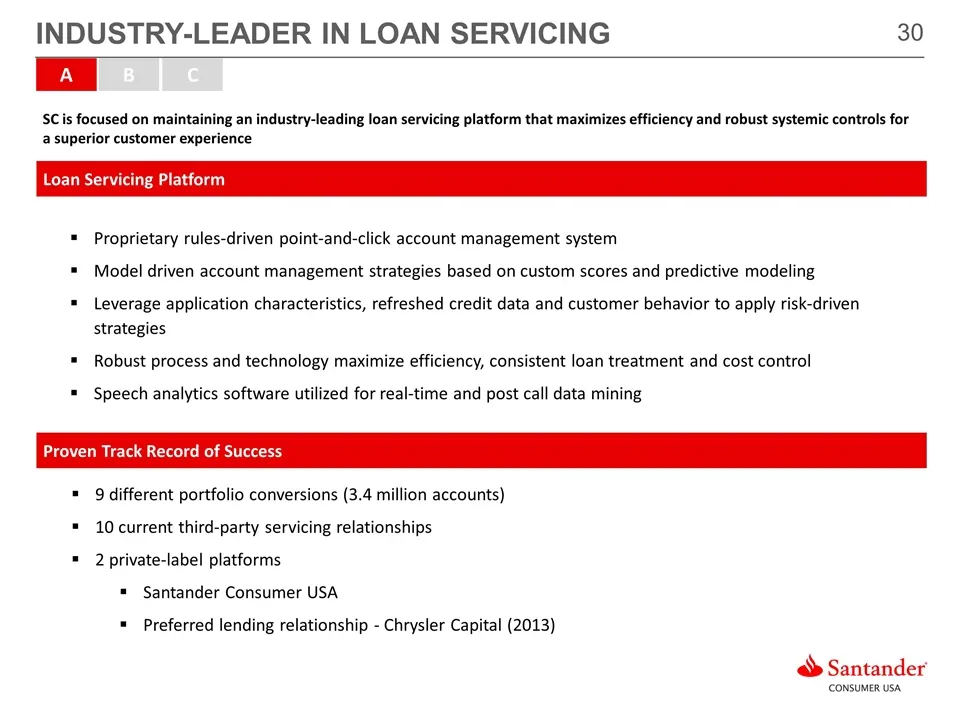
INDUSTRY-LEADER IN LOAN SERVICING A B C SC is focused on maintaining an industry-leading loan servicing platform that maximizes efficiency and robust systemic controls for a superior customer experience Proprietary rules-driven point-and-click account management system Model driven account managemen
Slide 31: Common Modification Types and TDR Criteria
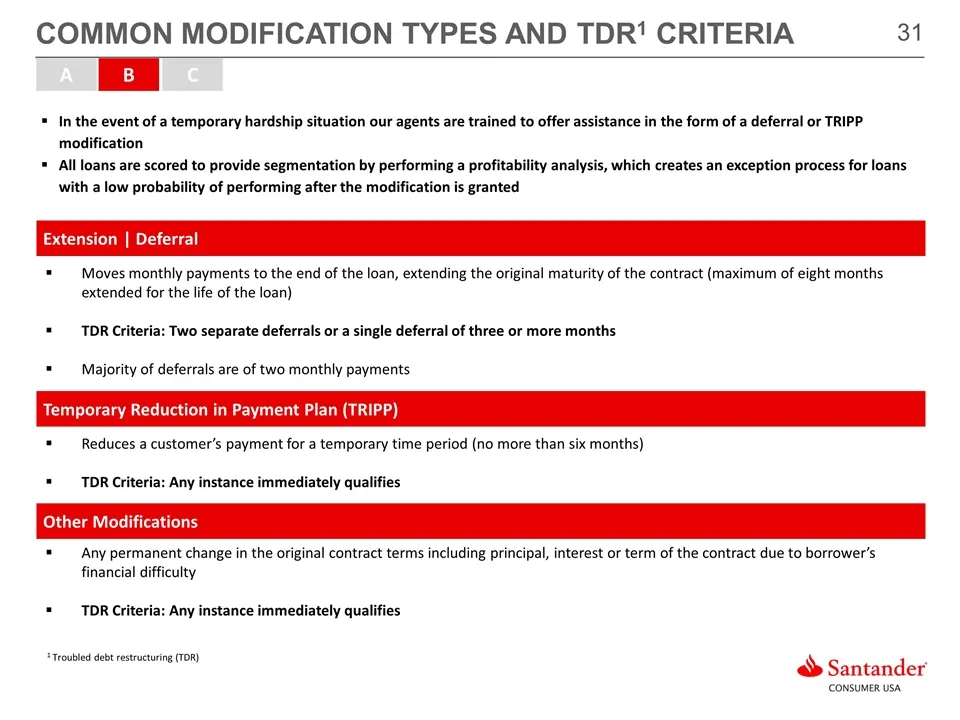
COMMON MODIFICATION TYPES AND TDR1 CRITERIA Moves monthly payments to the end of the loan, extending the original maturity of the contract (maximum of eight months extended for the life of the loan) TDR Criteria: Two separate deferrals or a single deferral of three or more months Majority of deferra
Slide 32: Disciplined Application of Modification Tools
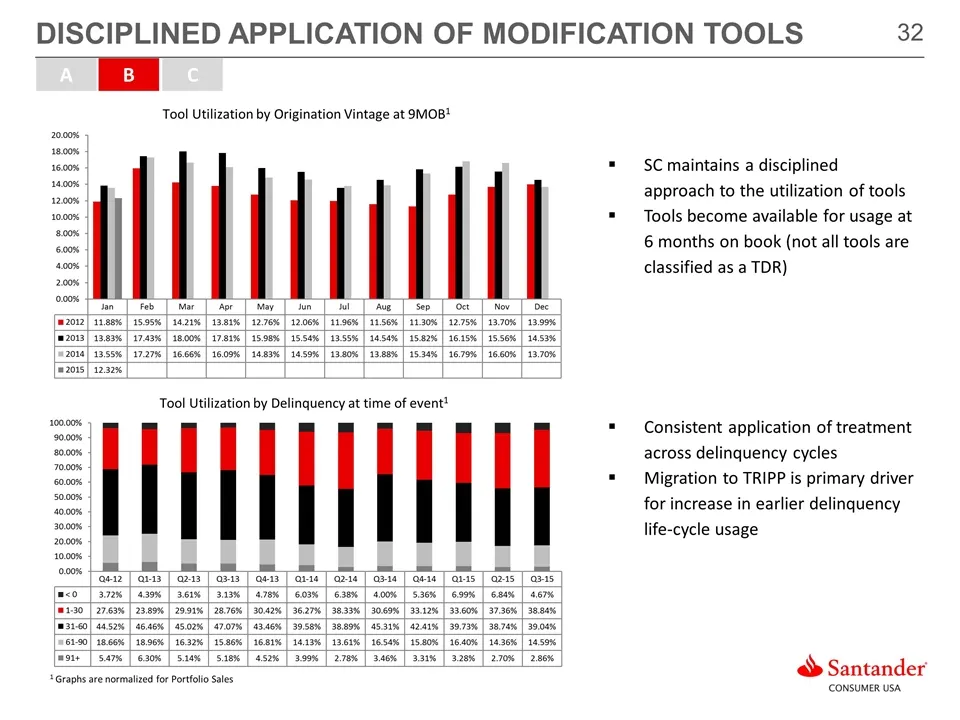
DISCIPLINED APPLICATION OF MODIFICATION TOOLS 1 Graphs are normalized for Portfolio Sales SC maintains a disciplined approach to the utilization of tools Tools become available for usage at 6 months on book (not all tools are classified as a TDR) Consistent application of treatment across delinquenc
Slide 33: TDR Distribution Trends
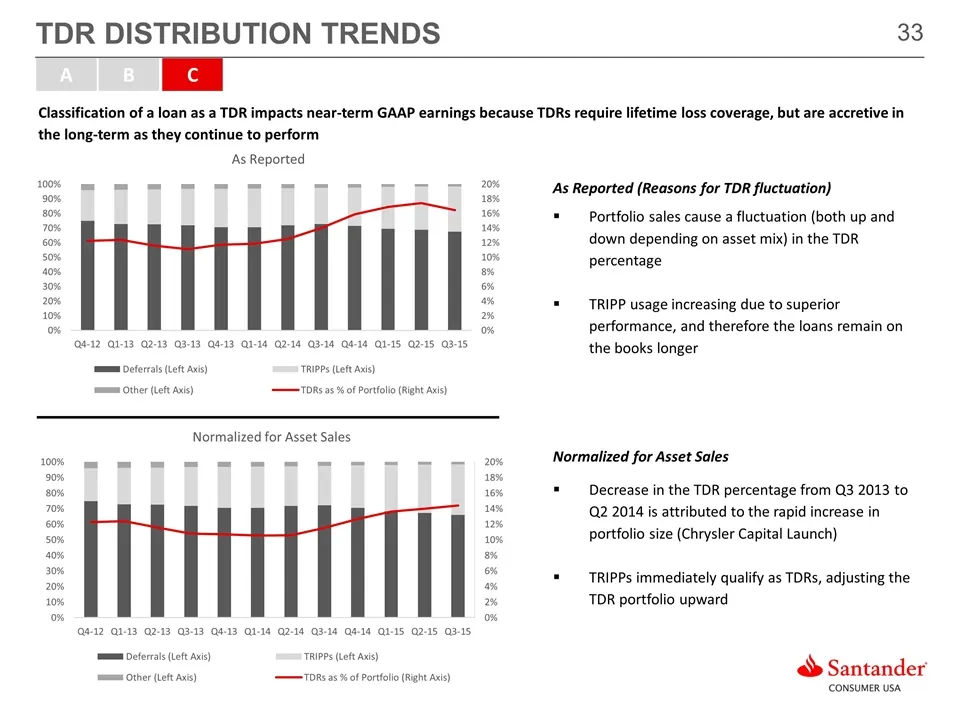
TDR DISTRIBUTION TRENDS As Reported (Reasons for TDR fluctuation) Portfolio sales cause a fluctuation (both up and down depending on asset mix) in the TDR percentage TRIPP usage increasing due to superior performance, and therefore the loans remain on the books longer Normalized for Asset Sales Decr
Slide 34: Modification Performance Within TDR Vintages
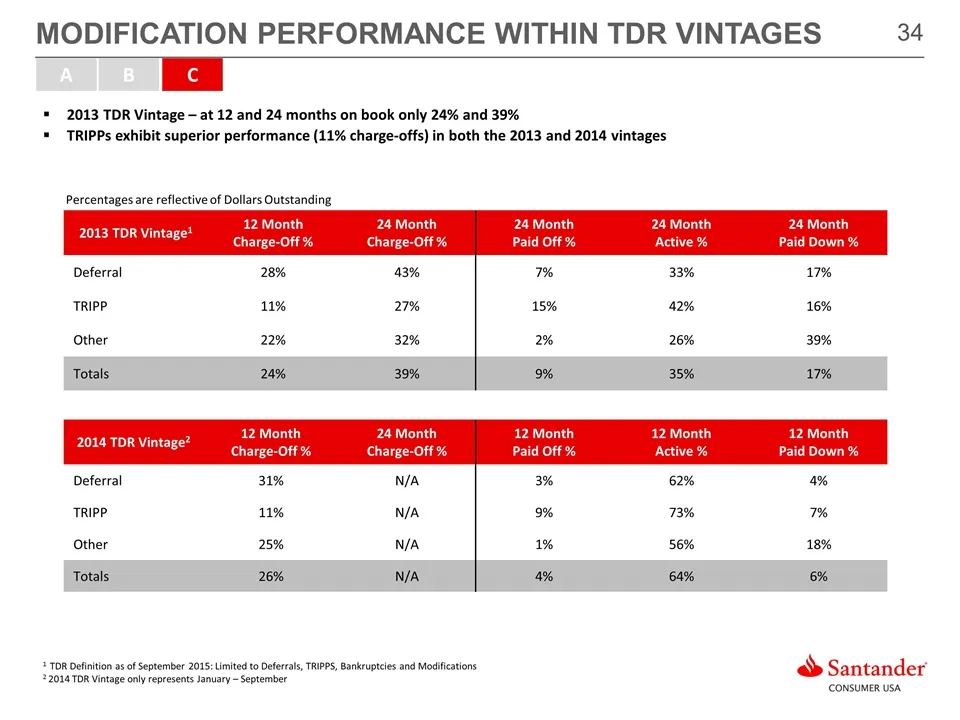
MODIFICATION PERFORMANCE WITHIN TDR VINTAGES 2013 TDR Vintage – at 12 and 24 months on book only 24% and 39% TRIPPs exhibit superior performance (11% charge-offs) in both the 2013 and 2014 vintages 1 TDR Definition as of September 2015: Limited to Deferrals, TRIPPS, Bankruptcies and Modifications 2
Slide 35: Q3 2015 Overview
Q3 2015 OVERVIEW Jennifer Davis, Interim Chief Financial Officer Jason Kulas, Chief Executive Officer
Slide 36: Q3 2015: Highlights
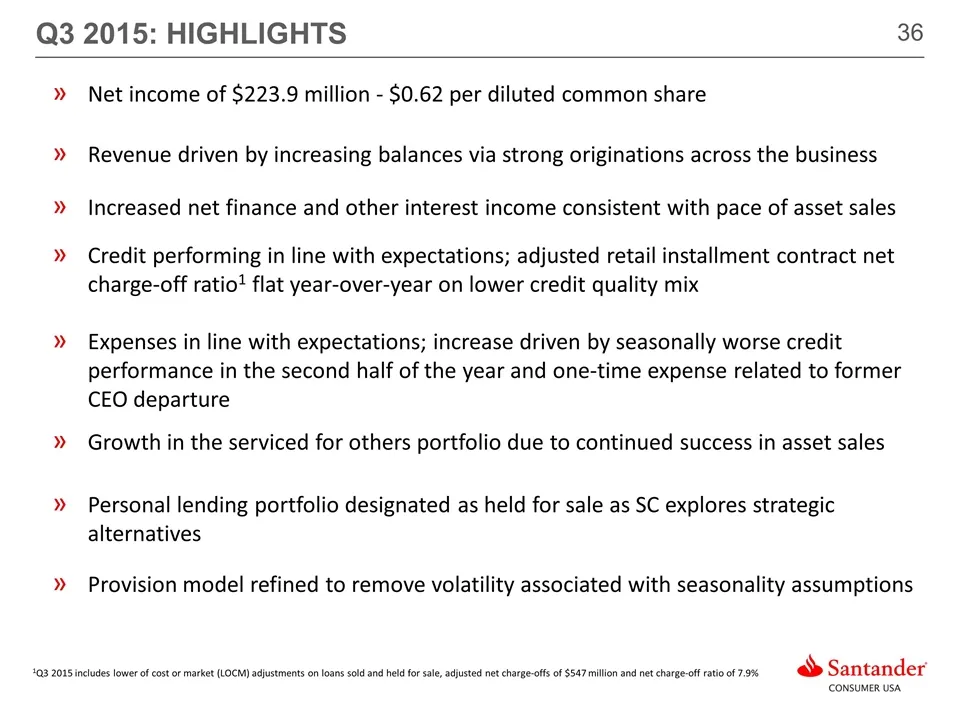
Q3 2015: HIGHLIGHTS Net income of $223.9 million - $0.62 per diluted common share Credit performing in line with expectations; adjusted retail installment contract net charge-off ratio1 flat year-over-year on lower credit quality mix Provision model refined to remove volatility associated with seaso
Slide 37: Notable Impacts to Q3 2015
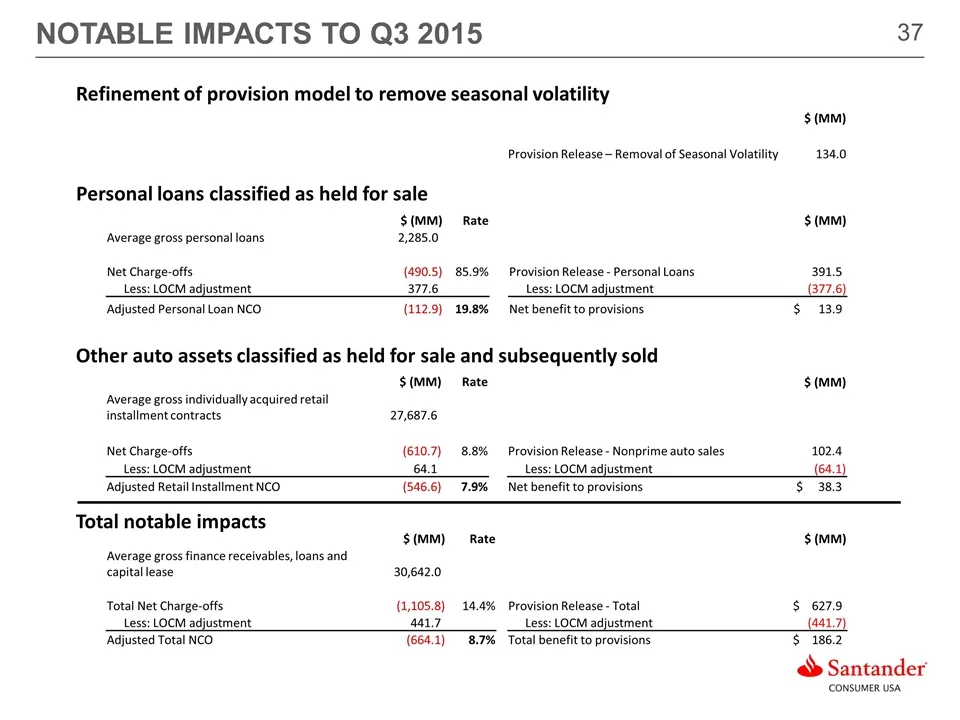
NOTABLE IMPACTS TO Q3 2015 Personal loans classified as held for sale Other auto assets classified as held for sale and subsequently sold Refinement of provision model to remove seasonal volatility $ (MM) Rate $ (MM) Average gross personal loans 2,285.0) Net Charge-offs (490.5) 85.9% Provision Relea
Slide 38: Refined Provision Model
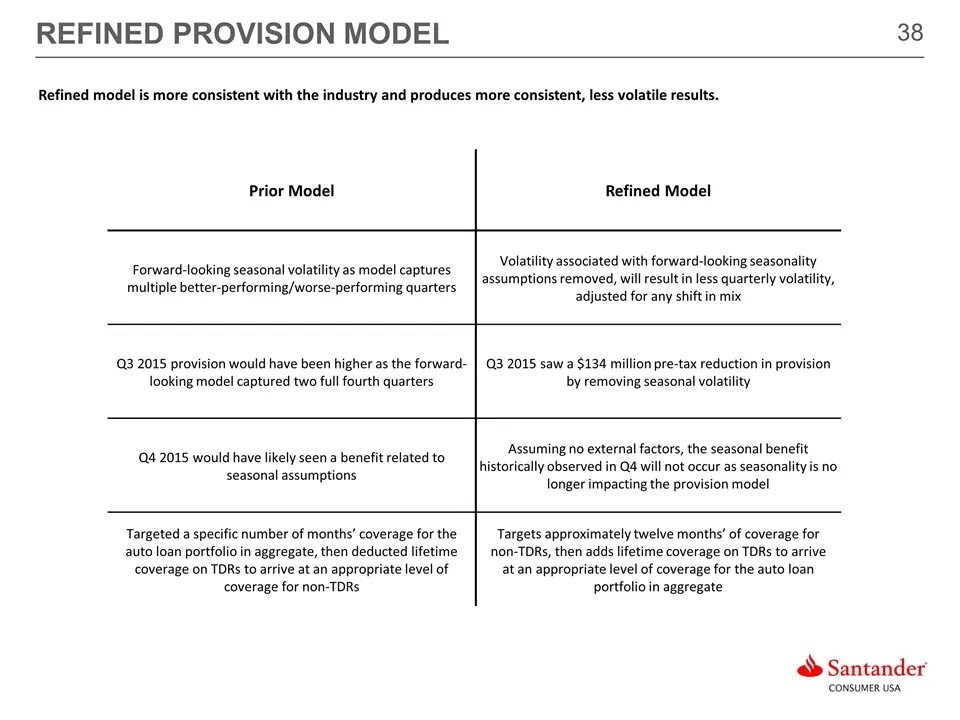
REFINED PROVISION MODEL Prior Model Refined Model Forward-looking seasonal volatility as model captures multiple better-performing/worse-performing quarters Volatility associated with forward-looking seasonality assumptions removed, will result in less quarterly volatility, adjusted for any shift in
Slide 39: Pro-Forma Auto Provision Trend
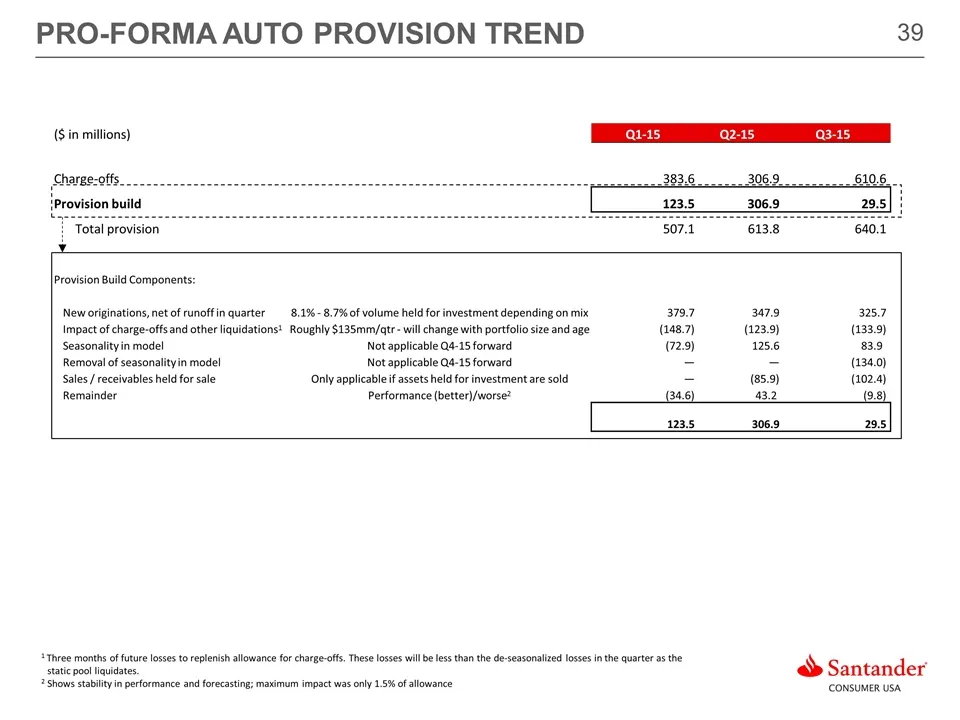
PRO-FORMA AUTO PROVISION TREND ($ in millions) Q1-15 Q2-15 Q3-15 Charge-offs 383.6 306.9 610.6 Provision build 123.5 306.9 29.5 Total provision 507.1 613.8 640.1 Provision Build Components: New originations, net of runoff in quarter 8.1% - 8.7% of volume held for investment depending on mix 379.7 34
Slide 40: Personal Lending
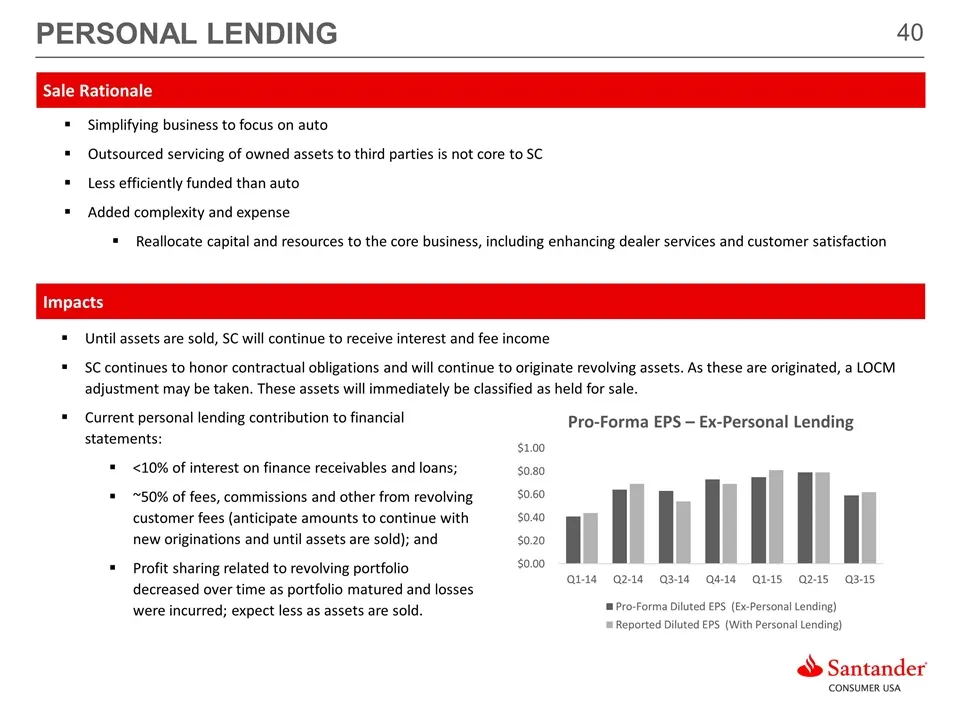
PERSONAL LENDING Until assets are sold, SC will continue to receive interest and fee income SC continues to honor contractual obligations and will continue to originate revolving assets. As these are originated, a LOCM adjustment may be taken. These assets will immediately be classified as held for
Slide 41: Q3 Earnings Bridge (After-Tax)
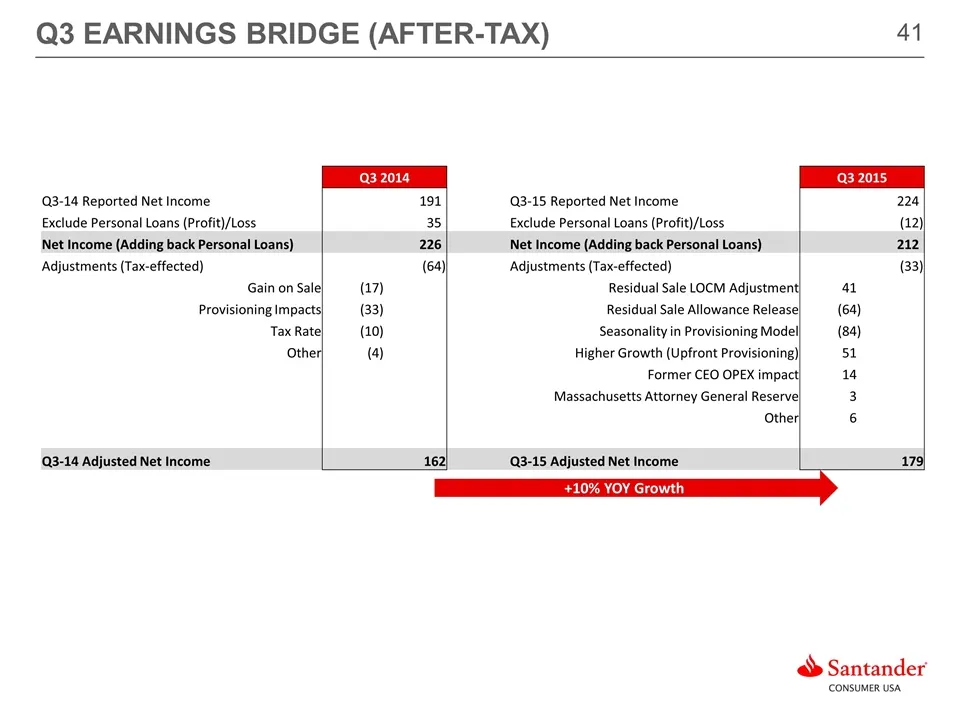
Q3 EARNINGS BRIDGE (AFTER-TAX) Q3 2014 Q3 2015 Q3-14 Reported Net Income 191) Q3-15 Reported Net Income 224) Exclude Personal Loans (Profit)/Loss 35) Exclude Personal Loans (Profit)/Loss (12) Net Income (Adding back Personal Loans) 226) Net Income (Adding back Personal Loans) 212) Adjustments (Tax-e
Slide 42: Outlook
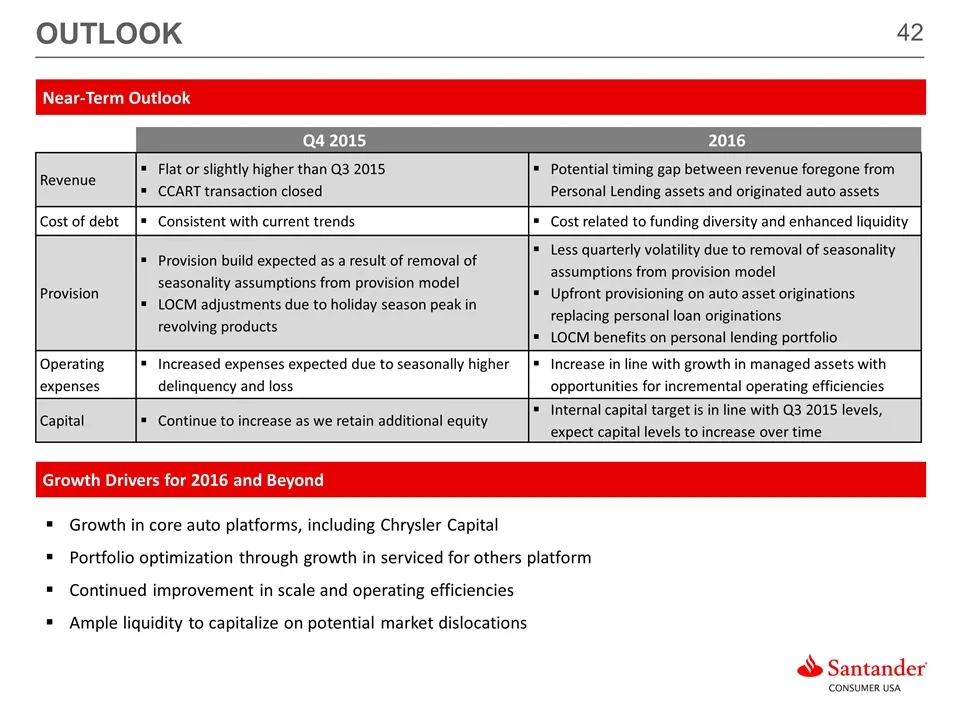
OUTLOOK Q4 2015 2016 Revenue Flat or slightly higher than Q3 2015 CCART transaction closed Potential timing gap between revenue foregone from Personal Lending assets and originated auto assets Cost of debt Consistent with current trends Cost related to funding diversity and enhanced liquidity Provis
Slide 43: What Differentiates SC
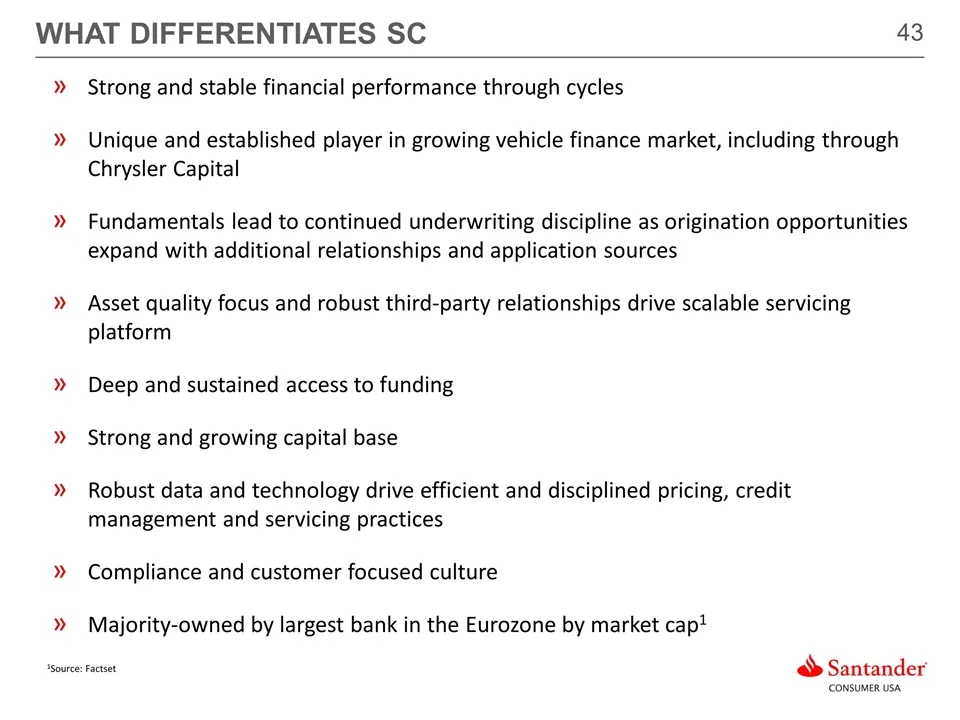
WHAT DIFFERENTIATES SC Strong and stable financial performance through cycles Unique and established player in growing vehicle finance market, including through Chrysler Capital Fundamentals lead to continued underwriting discipline as origination opportunities expand with additional relationships a

Slide 44: Appendix
APPENDIX & Santander CONSUMER USA
Slide 45: Impact of Provision for Credit Losses on EPS
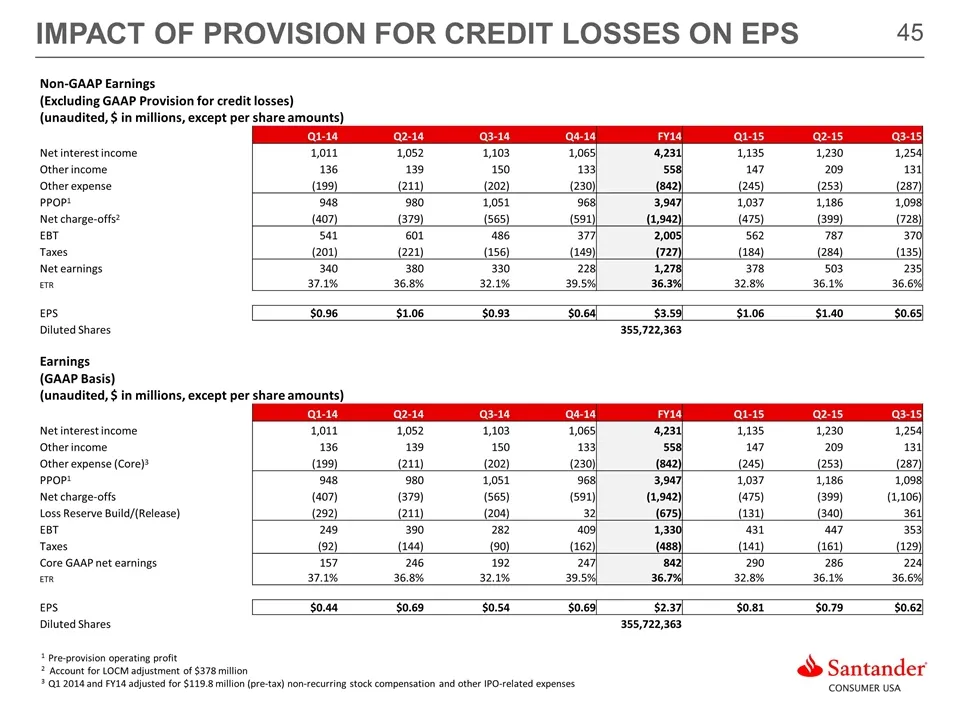
IMPACT OF PROVISION FOR CREDIT LOSSES ON EPS Non-GAAP Earnings (Excluding GAAP Provision for credit losses) (unaudited, $ in millions, except per share amounts) Q1-14 Q2-14 Q3-14 Q4-14 FY14 Q1-15 Q2-15 Q3-15 Net interest income 1,011 1,052 1,103 1,065 4,231 1,135 1,230 1,254 Other income 136 139 150
Slide 46: Historical Financials Excluding Personal Lending
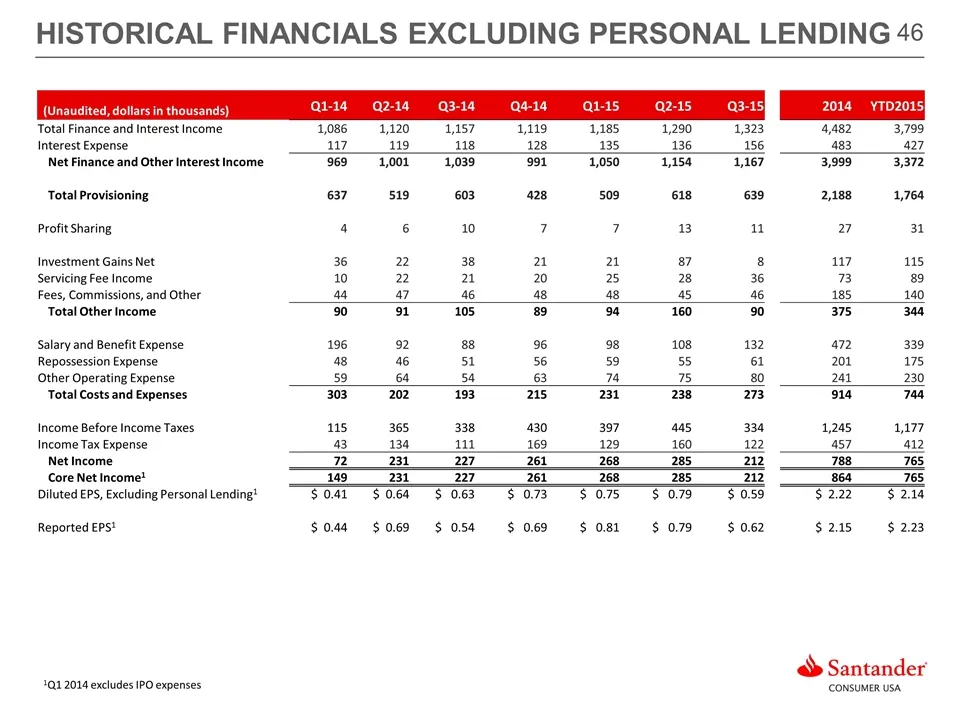
HISTORICAL FINANCIALS EXCLUDING PERSONAL LENDING (Unaudited, dollars in thousands) Q1-14 Q2-14 Q3-14 Q4-14 Q1-15 Q2-15 Q3-15 2014 YTD2015 Total Finance and Interest Income 1,086 1,120 1,157 1,119 1,185 1,290 1,323 4,482 3,799 Interest Expense 117 119 118 128 135 136 156 483 427 Net Finance and Other
Slide 47: Reconciliation of Non-GAAP Measures
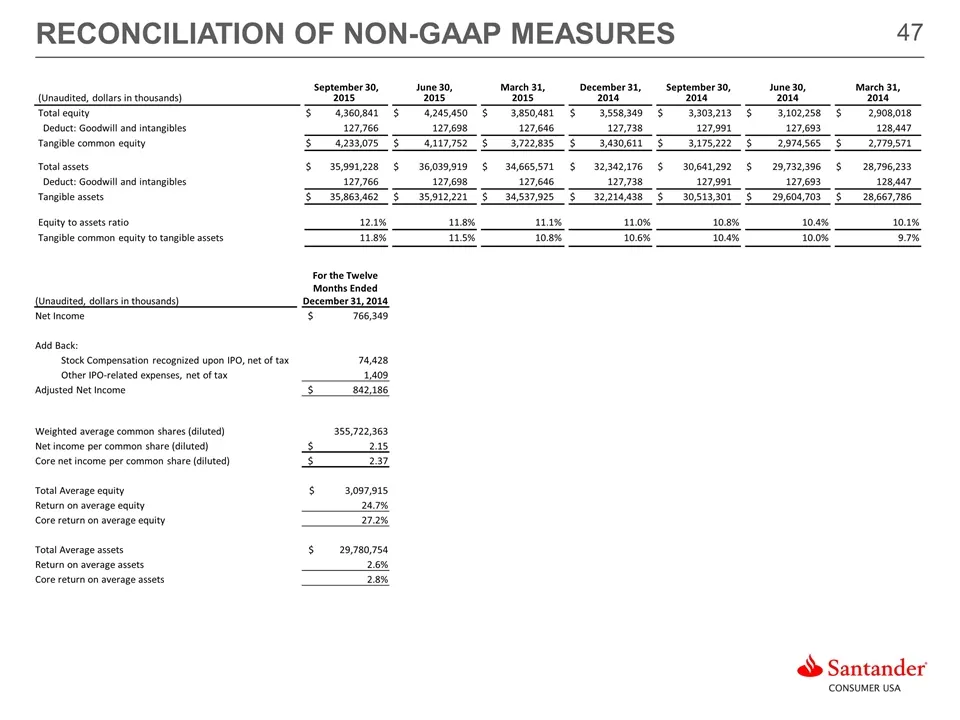
RECONCILIATION OF NON-GAAP MEASURES (Unaudited, dollars in thousands) September 30, 2015 September 30, 2015 June 30, 2015 June 30, 2015 March 31, 2015 March 31, 2015 December 31, 2014 December 31, 2014 September 30, 2014 September 30, 2014 Total equity $ 4,360,841 $ 4,245,450 $ 3,850,481 $ 3,558,349

Slide 48: ® Santander
® Santander CONSUMER USA & Santander CONSUMER U
Source: SEC EDGAR · 8-K filed Nov 19, 2015
More decks from Santander Consumer USA Holdings Inc
 Q3 2021 Earnings Presentation24 slides · Oct 27, 2021
 Q2 2021 Earnings Presentation24 slides · Jul 28, 2021
 Q1 2021 Earnings Presentation24 slides · Apr 28, 2021
 FY2020 Earnings Presentation28 slides · Feb 3, 2021
 Q3 2020 Earnings Presentation25 slides · Oct 28, 2020
 Q2 2020 Earnings Presentation26 slides · Jul 29, 2020