Alpha Natural Resources — Foundation Coal Holdings — Goldman Sachs Alternative Energy Conference 2006
27 slides from Alpha Natural Resources's conference presentation, May 1, 2006
Slide 1: Foundation Coal Holdings, Inc.
Fc [LISTED] NYSE FOUNDATION COAL HOLDINGS, INC.

Slide 2

Slide 3

Slide 4: Goldman Sachs Alternative Energy Conference, New York, May 2, 2006
Goldman Sachs Alternative Energy Conference New York, NY May 2, 2006 Exhibit 99.2

Slide 5: Forward-Looking Statements and Reconciliation of Non-GAAP Measures
FORWARD-LOOKING STATEMENTS AND RECONCILIATION OF NON-GAAP MEASURES Statements in this presentation which are not statements of historical fact are “forward-looking statements” within the “safe harbor” provision of the Private Securities Litigation Reform Act of 1995. These forward-looking statements

Slide 6: Why Invest in FCL?
WHY INVEST IN FCL? • Major diversified producer with presence in key U.S. supply regions • High capacity, large scale operations • Positioned for significant revenue growth • Attractive internal and external growth prospects • Industry leading margins driven by low cost structure • Strong earnings a

Slide 7: Successful Business Strategy
SUCCESSFUL BUSINESS STRATEGY • Maintain commitment to operational excellence as a low-cost producer • Continue to focus on excellence in safety and environmental stewardship • Continue to manage risk through regional, operational, and market diversity • Prudently expand production and reserve base •
Slide 8: Performance Highlights
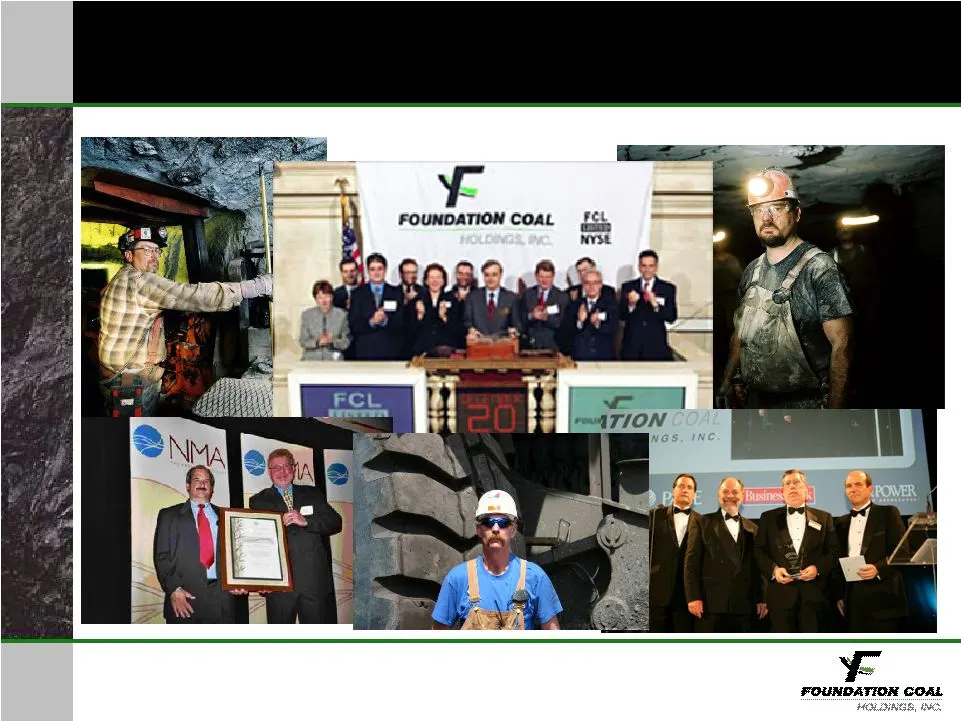
PERFORMANCE HIGHLIGHTS
Slide 9: Track Record of Performance
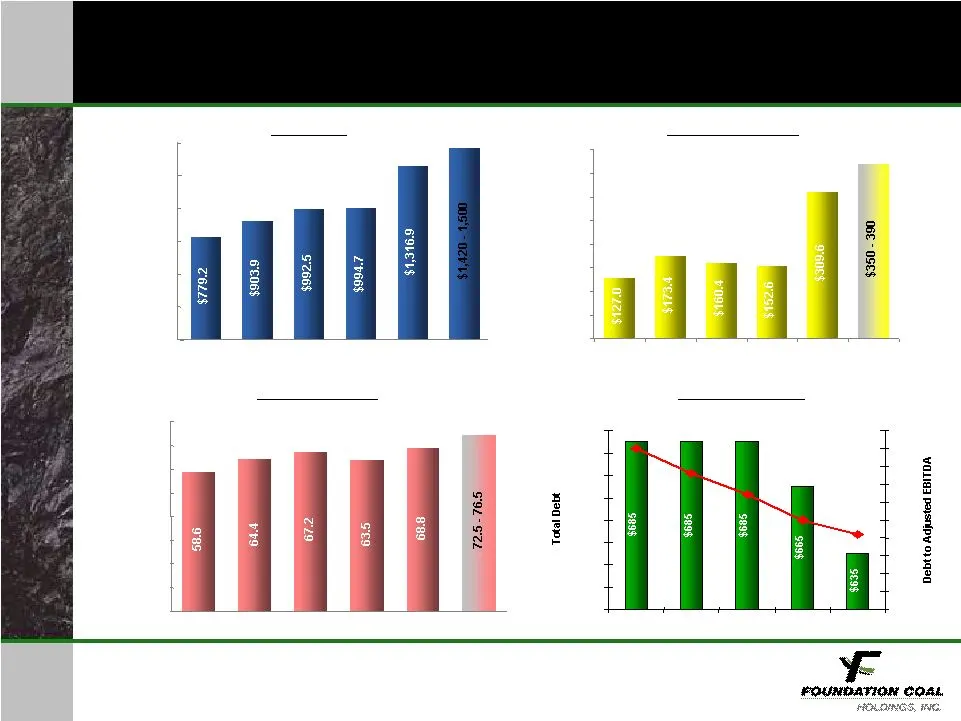
TRACK RECORD OF PERFORMANCE Notes: In millions 2001 – 04 data on pro forma basis 2005 data reflect results for successor company 2006 data per 2/8/06 guidance Revenues Revenues Adjusted EBITDA Adjusted EBITDA Coal Shipments Coal Shipments Debt Repayment Debt Repayment 1,000 1,250 1,500 4.5 3.8 3.2 2
Slide 10: Strong Positive Free Cash Flow
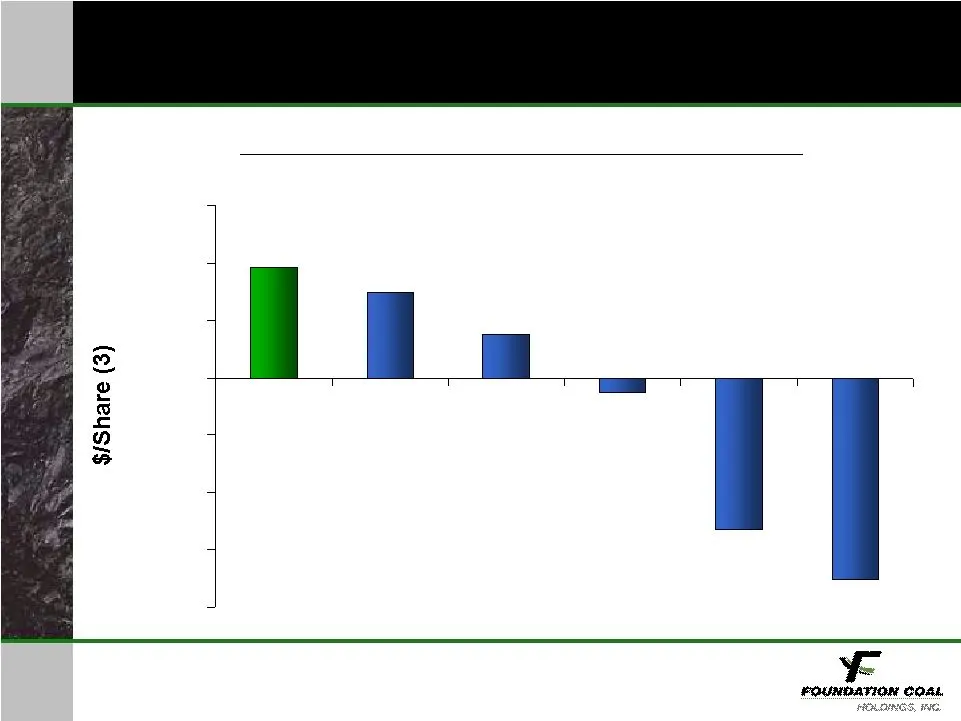
STRONG POSITIVE FREE CASH FLOW -$2.00 -$1.50 -$1.00 -$0.50 $0.00 $0.50 $1.00 $1.50 FCL A B C (2) D E Notes: (1) Represents cash flow from operating activities less purchases of property, plant & equipment, including amounts paid under coal leases (bonus bids, minimum royalties) and excludes amounts
Slide 11: Industry-Leading Margins
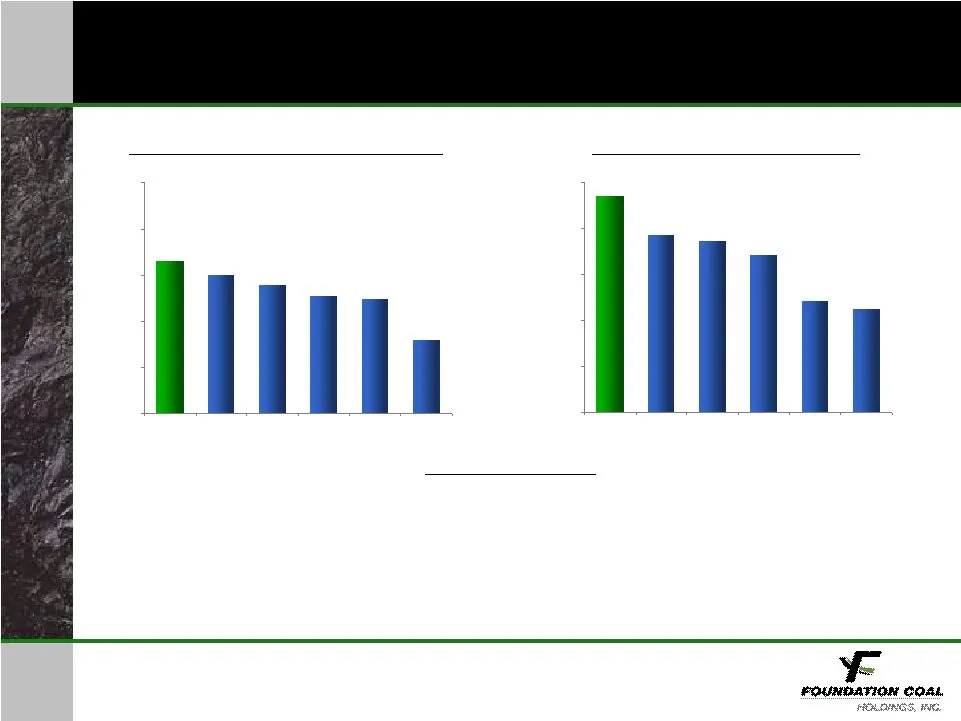
INDUSTRY-LEADING MARGINS 2002-04 Adjusted EBITDA Margin (1) 8.0% 16.6% 12.4% 12.7% 13.9% 15.0% FCL A E C D B • Large, diversified producer • Safe, low-cost, highly productive operations • Effective use of technology (3-Year Average) Source: Public company filings and press releases; EBITDA adjusted
Slide 12: Foundation Coal Holdings
FOUNDATION GOAL HOLDINGS, IE.
Slide 13
Slide 14
Slide 15
Slide 16
Slide 17: Energy Industry Overview
ENERGY INDUSTRY OVERVIEW
Slide 18: Coal Prices Still at or Near Historic Highs
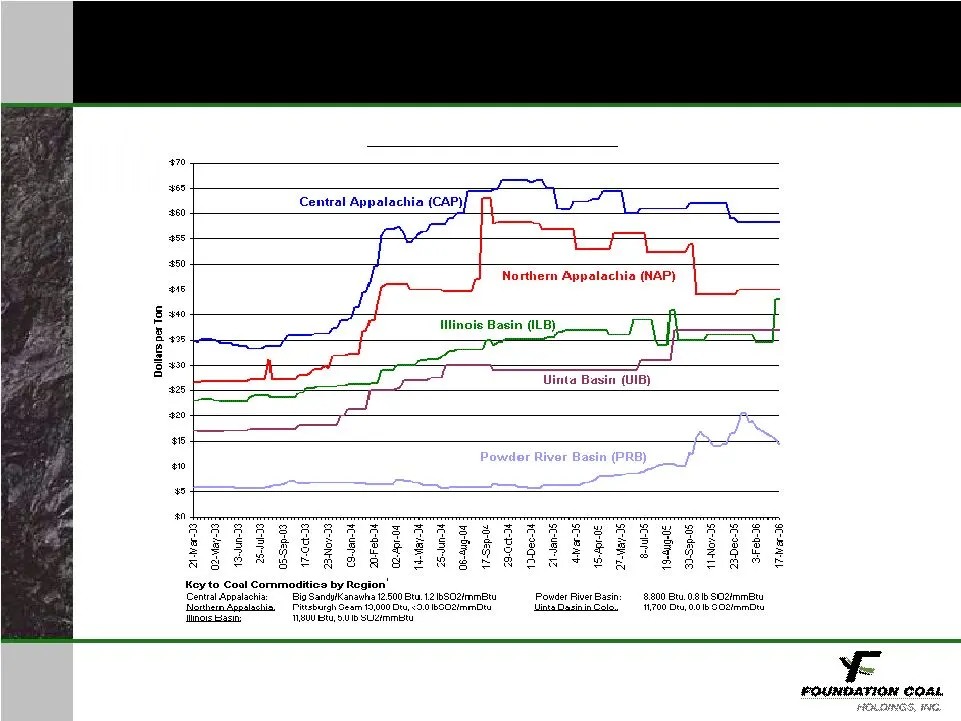
COAL PRICES STILL AT OR NEAR HISTORIC HIGHS Source: Energy Information Administration, with permission from Platts Average Weekly Spot Prices Average Weekly Spot Prices
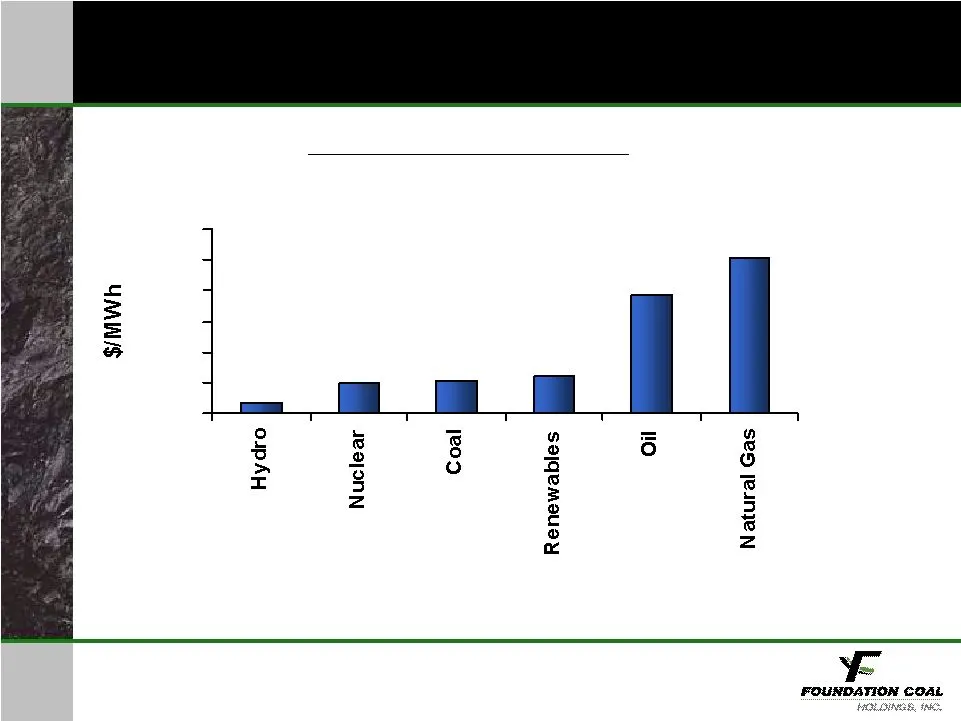
Slide 19: Coal Is Still the Most Competitive Fossil Fuel for Baseload Generation
COAL IS STILL THE MOST COMPETITIVE FOSSIL FUEL FOR BASELOAD GENERATION $101.63 $76.83 $25.01 $20.57 $20.21 $7.43 Power Production Cost Comparison Power Production Cost Comparison Sources: Global Energy Advisors, via FERC Form 1 and EIA Form 906 through November 2005, based on average fuel costs for
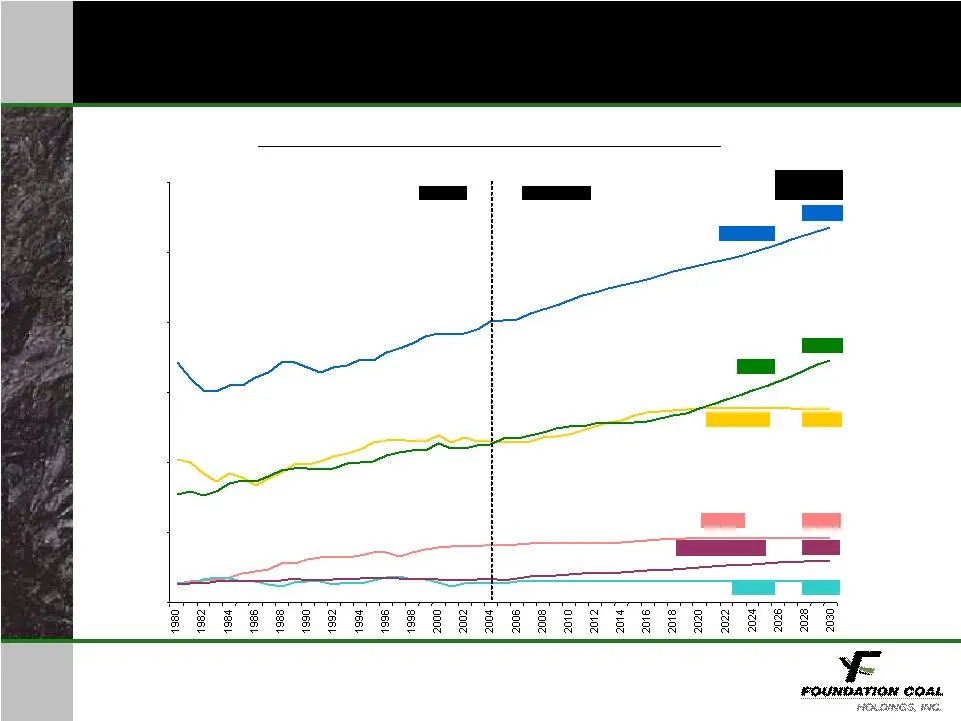
Slide 20: Strong Positive Long-Term Demand Fundamentals
STRONG POSITIVE LONG-TERM DEMAND FUNDAMENTALS Petroleum Natural Gas Coal Nuclear Renewable/Other Hydro Actual Projected +1.1% CAGR (2004 -30) +0.7% +1.7% +0.4% +2.2% +0.4% U.S. Energy Consumption by Fuel (Quadrillion Btus) Source: Energy Information Administration, Annual Energy Outlook
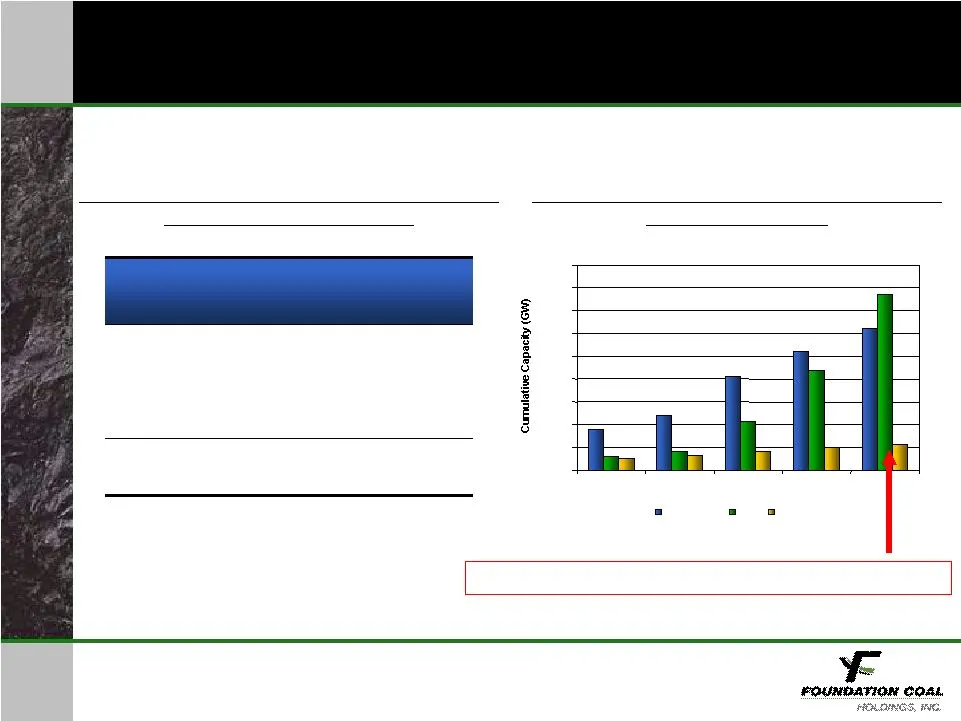
Slide 21: Future Demand Growth Through Increased Capacity Utilization and New Coal Plants
FUTURE DEMAND GROWTH THROUGH INCREASED CAPACITY UTILIZATION AND NEW COAL PLANTS Coal Consumption (MM Tons) Capacity Utilization Rate (%) Long-Term Growth Through New Coal-Based Generating Capacity Notes: * Assumes 10,000 Btu/kwh heat rate, 11,500 Btu/lb. coal ** Assumes 9,500 Btu/kwh heat rate, 11,5
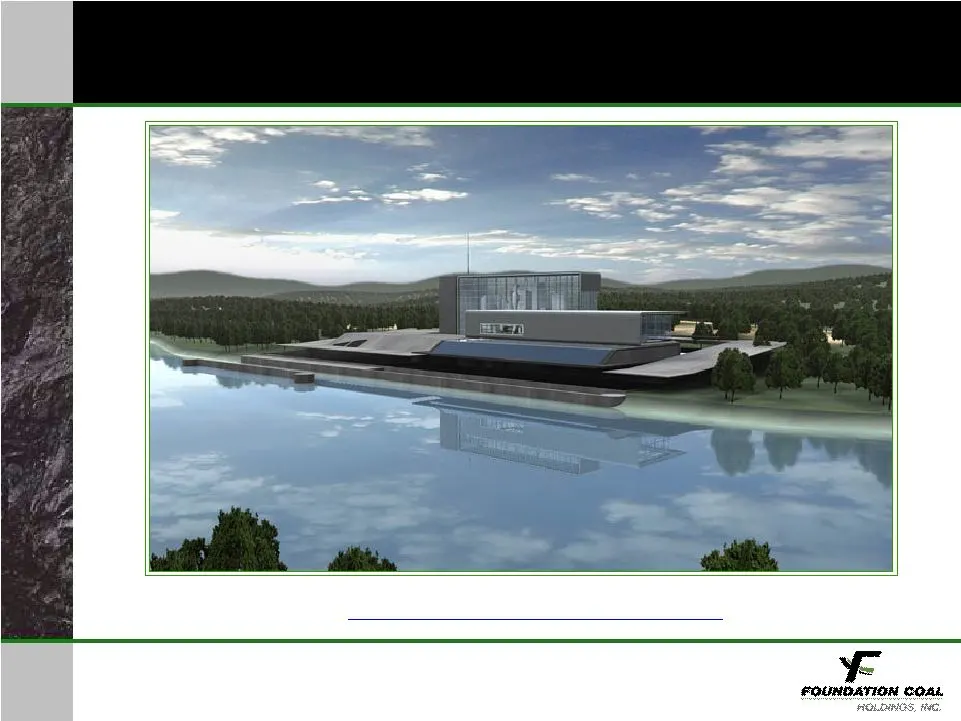
Slide 22: FutureGen Project
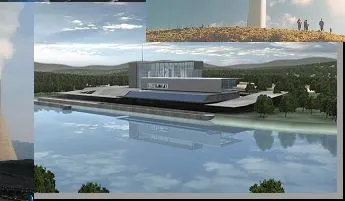
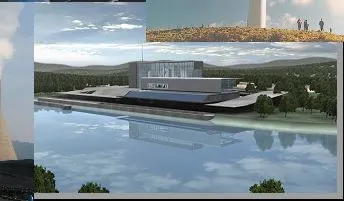
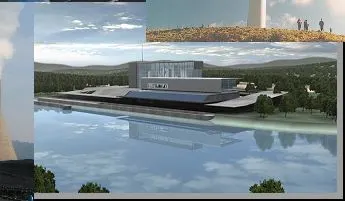
FutureGEN PROJECT www.futuregenalliance.org
Slide 23: Key Features
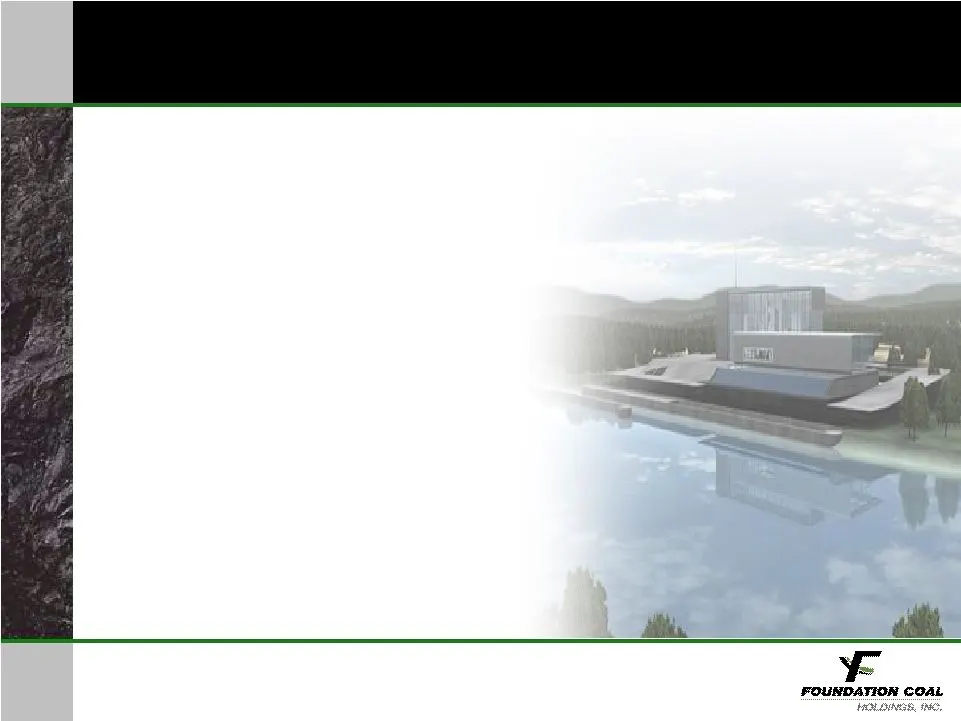
KEY FEATURES • Commercial-scale 275-MWe Plant • 1 million tons/year CO • captured and sequestered • Co-production of H2 and electricity • “Living laboratory” to test and validate cutting-edge technologies • Public-private partnership • Stakeholder involvement • International participation

Slide 24: Value Proposition
VALUE PROPOSITION • Supports a technology-based climate change strategy – Mitigates the financial risks of climate change – Developing countries will not shut their plants but they will copy ours • Validates the cost and performance of an integrated near zero-emission coal-fueled power plant – Advan

Slide 25: Pushing the Technology Envelope
PUSHING THE TECHNOLOGY ENVELOPE • Establish the technical, economic, and environmental viability of “zero-emission” coal plants by 2015; thus, creating the option for multiple commercial deployments by 2020. • Industry to validate DOE suggested goals: – Sequester >90% CO with potential for ~100% – >
Slide 26: Timeline Summary
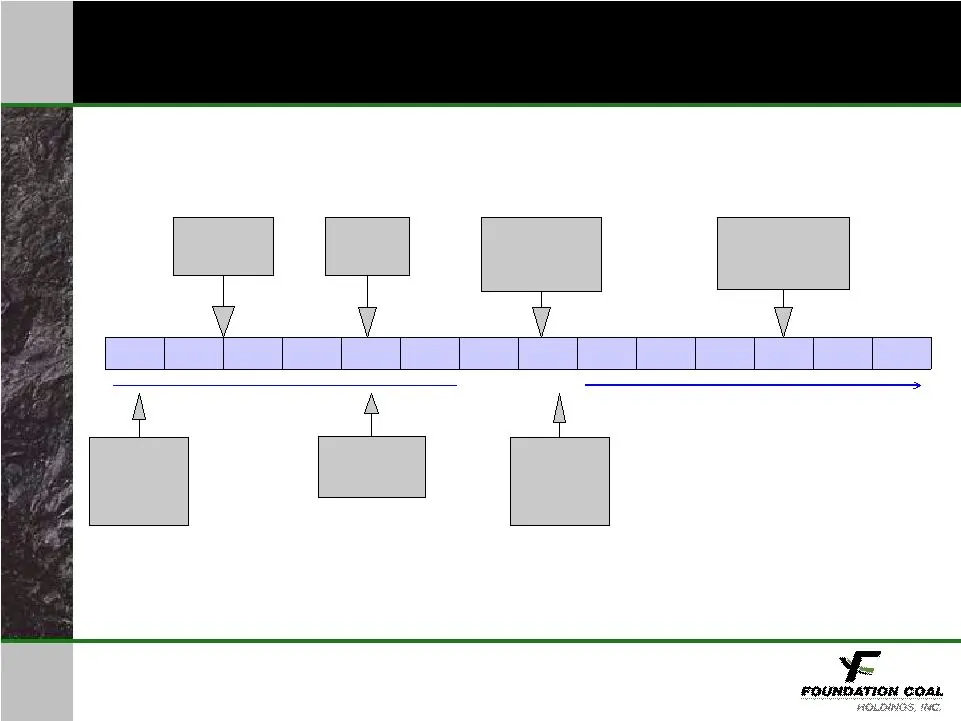
TIMELINE SUMMARY Plant Start-Up & Testing Final Design Preliminary Design October Full Scale Plant Operations Facility Construction Site Monitoring Post Initial Operations 2016 - DOE Projection NEPA PROCESS 2006/Yr end
Slide 27: Foundation Coal Holdings, Inc.
a FOUNDATION COAL HOLDINGS, INC.
Source: SEC EDGAR · 8-K filed May 1, 2006
More decks from Alpha Natural Resources Inc
 J.P. Morgan Global High Yield & Leveraged Finance Conference (February 2015)36 slides · Feb 23, 2015
 Barclays CEO Energy-Power Conference 201435 slides · Sep 2, 2014
 2014 BMO 23rd Global Metals and Mining Conference; Sterne Agee 2014 Boston Executive Summi33 slides · Jun 17, 2014
 2014 BMO 23rd Global Metals and Mining Conference / Brean Capital 2014 Global Resources &30 slides · May 28, 2014
 2014 BMO 23rd Global Metals and Mining Conference30 slides · Feb 24, 2014
 Tuohy Brothers' 4th Annual Energy Conference (August 2013)26 slides · Aug 5, 2013