Endurance Specialty Holdings Ltd
Endurance Specialty — Investor Presentation (June 2009)
36 slides from Endurance Specialty's investor presentation, Jun 16, 2009

Slide 1: Investor Presentation
Investor Presentation ee Endurance
Slide 2: Forward looking statements & regulation G disclaimer
2 Forward looking statements & regulation G disclaimer Safe Harbor for Forward Looking Statements Some of the statements in this presentation include forward-looking statements which reflect our current views with respect to future events and financial performance. Such statements include forward-lo
Slide 3: Investor value proposition
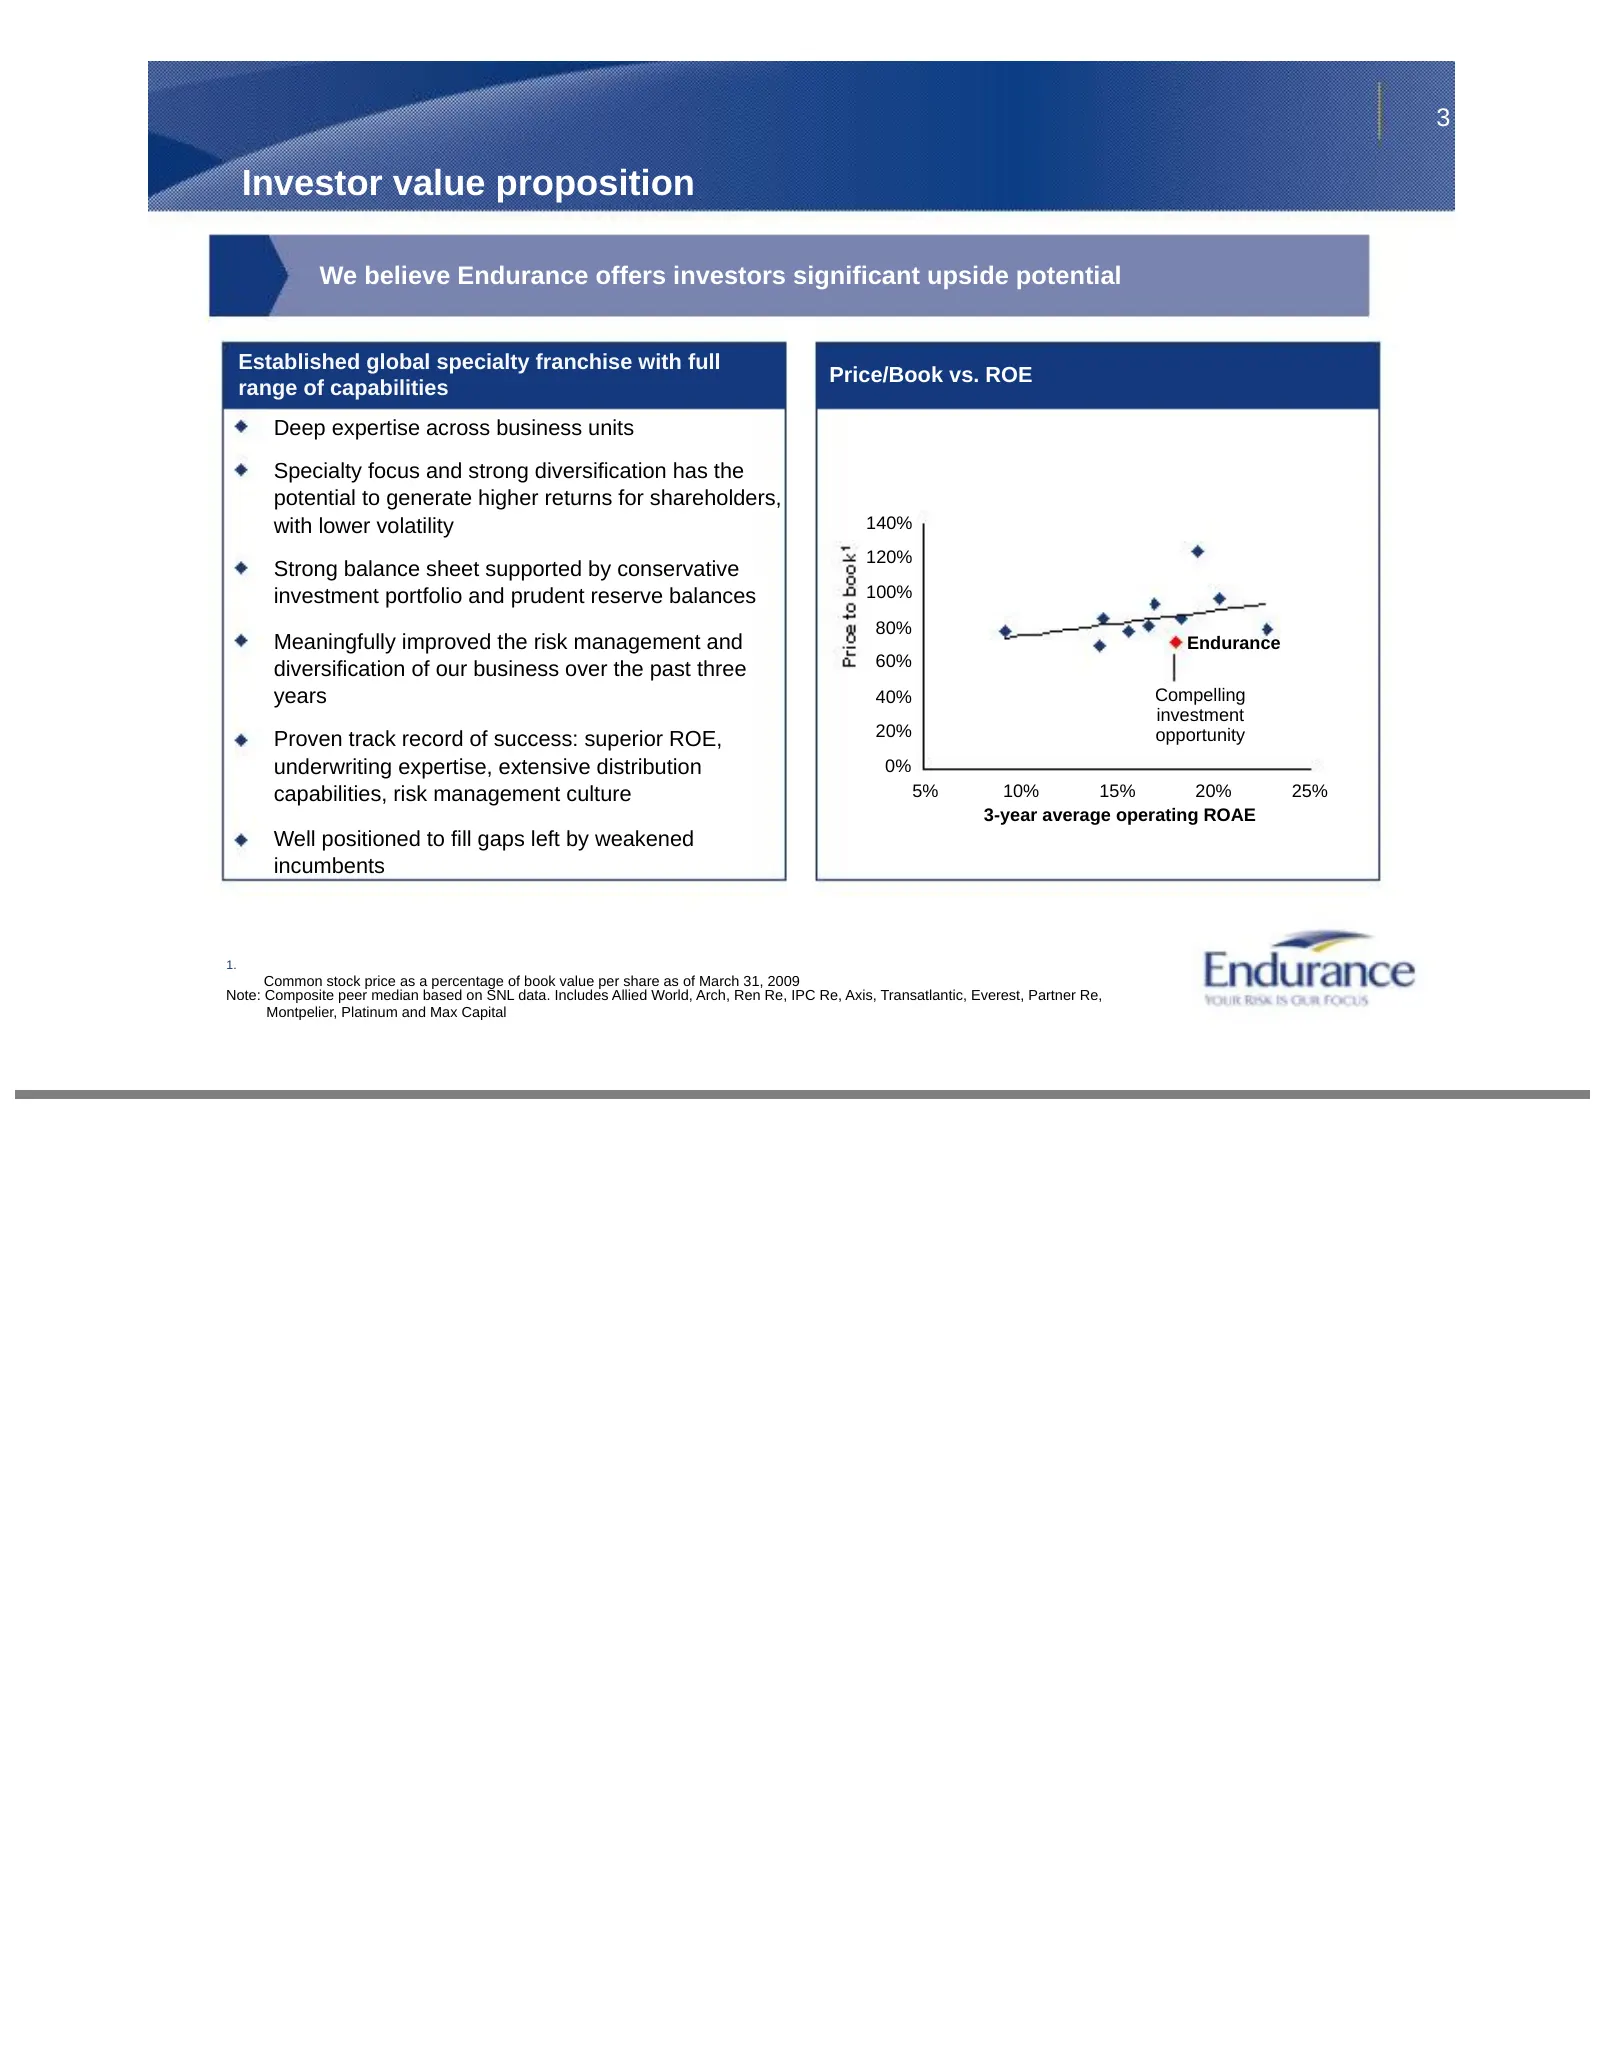
3 Investor value proposition We believe Endurance offers investors significant upside potential Established global specialty franchise with full Price/Book vs. ROE range of capabilities Deep expertise across business units Specialty focus and strong diversification has the potential to generate high
Slide 4: Introduction to Endurance Specialty Holdings
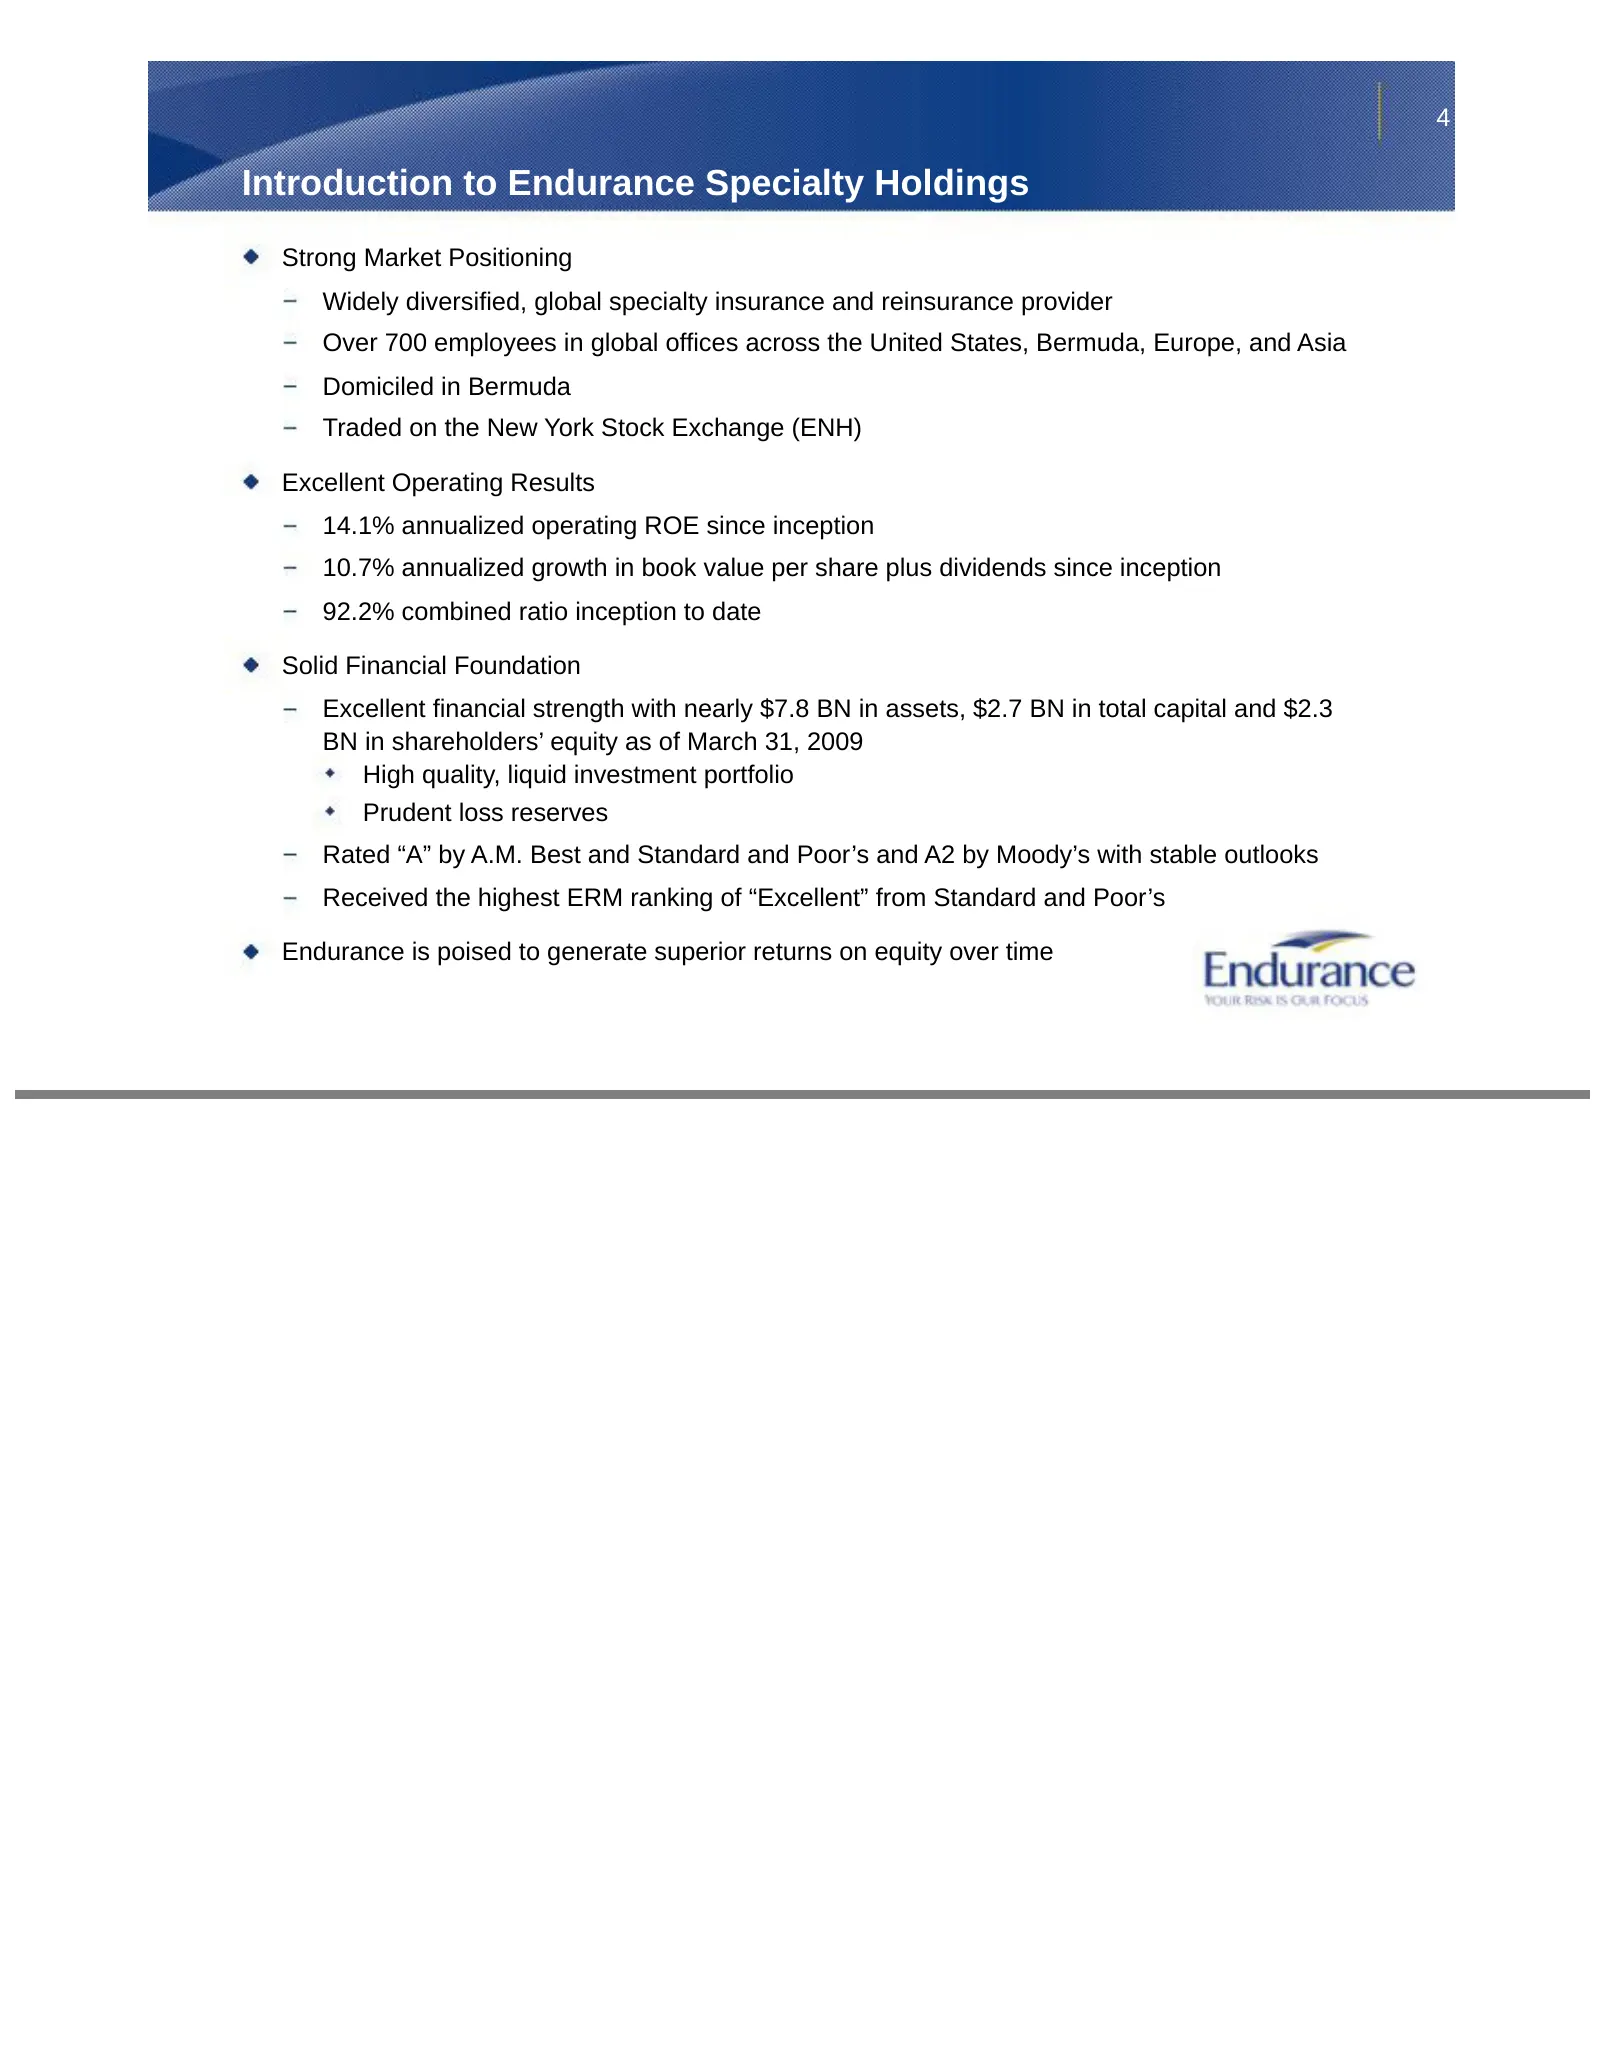
4 Introduction to Endurance Specialty Holdings Strong Market Positioning Widely diversified, global specialty insurance and reinsurance provider Over 700 employees in global offices across the United States, Bermuda, Europe, and Asia Domiciled in Bermuda Traded on the New York Stock Exchange (ENH) E
Slide 5: Our strategy is focused on delivering superior results for shareholders
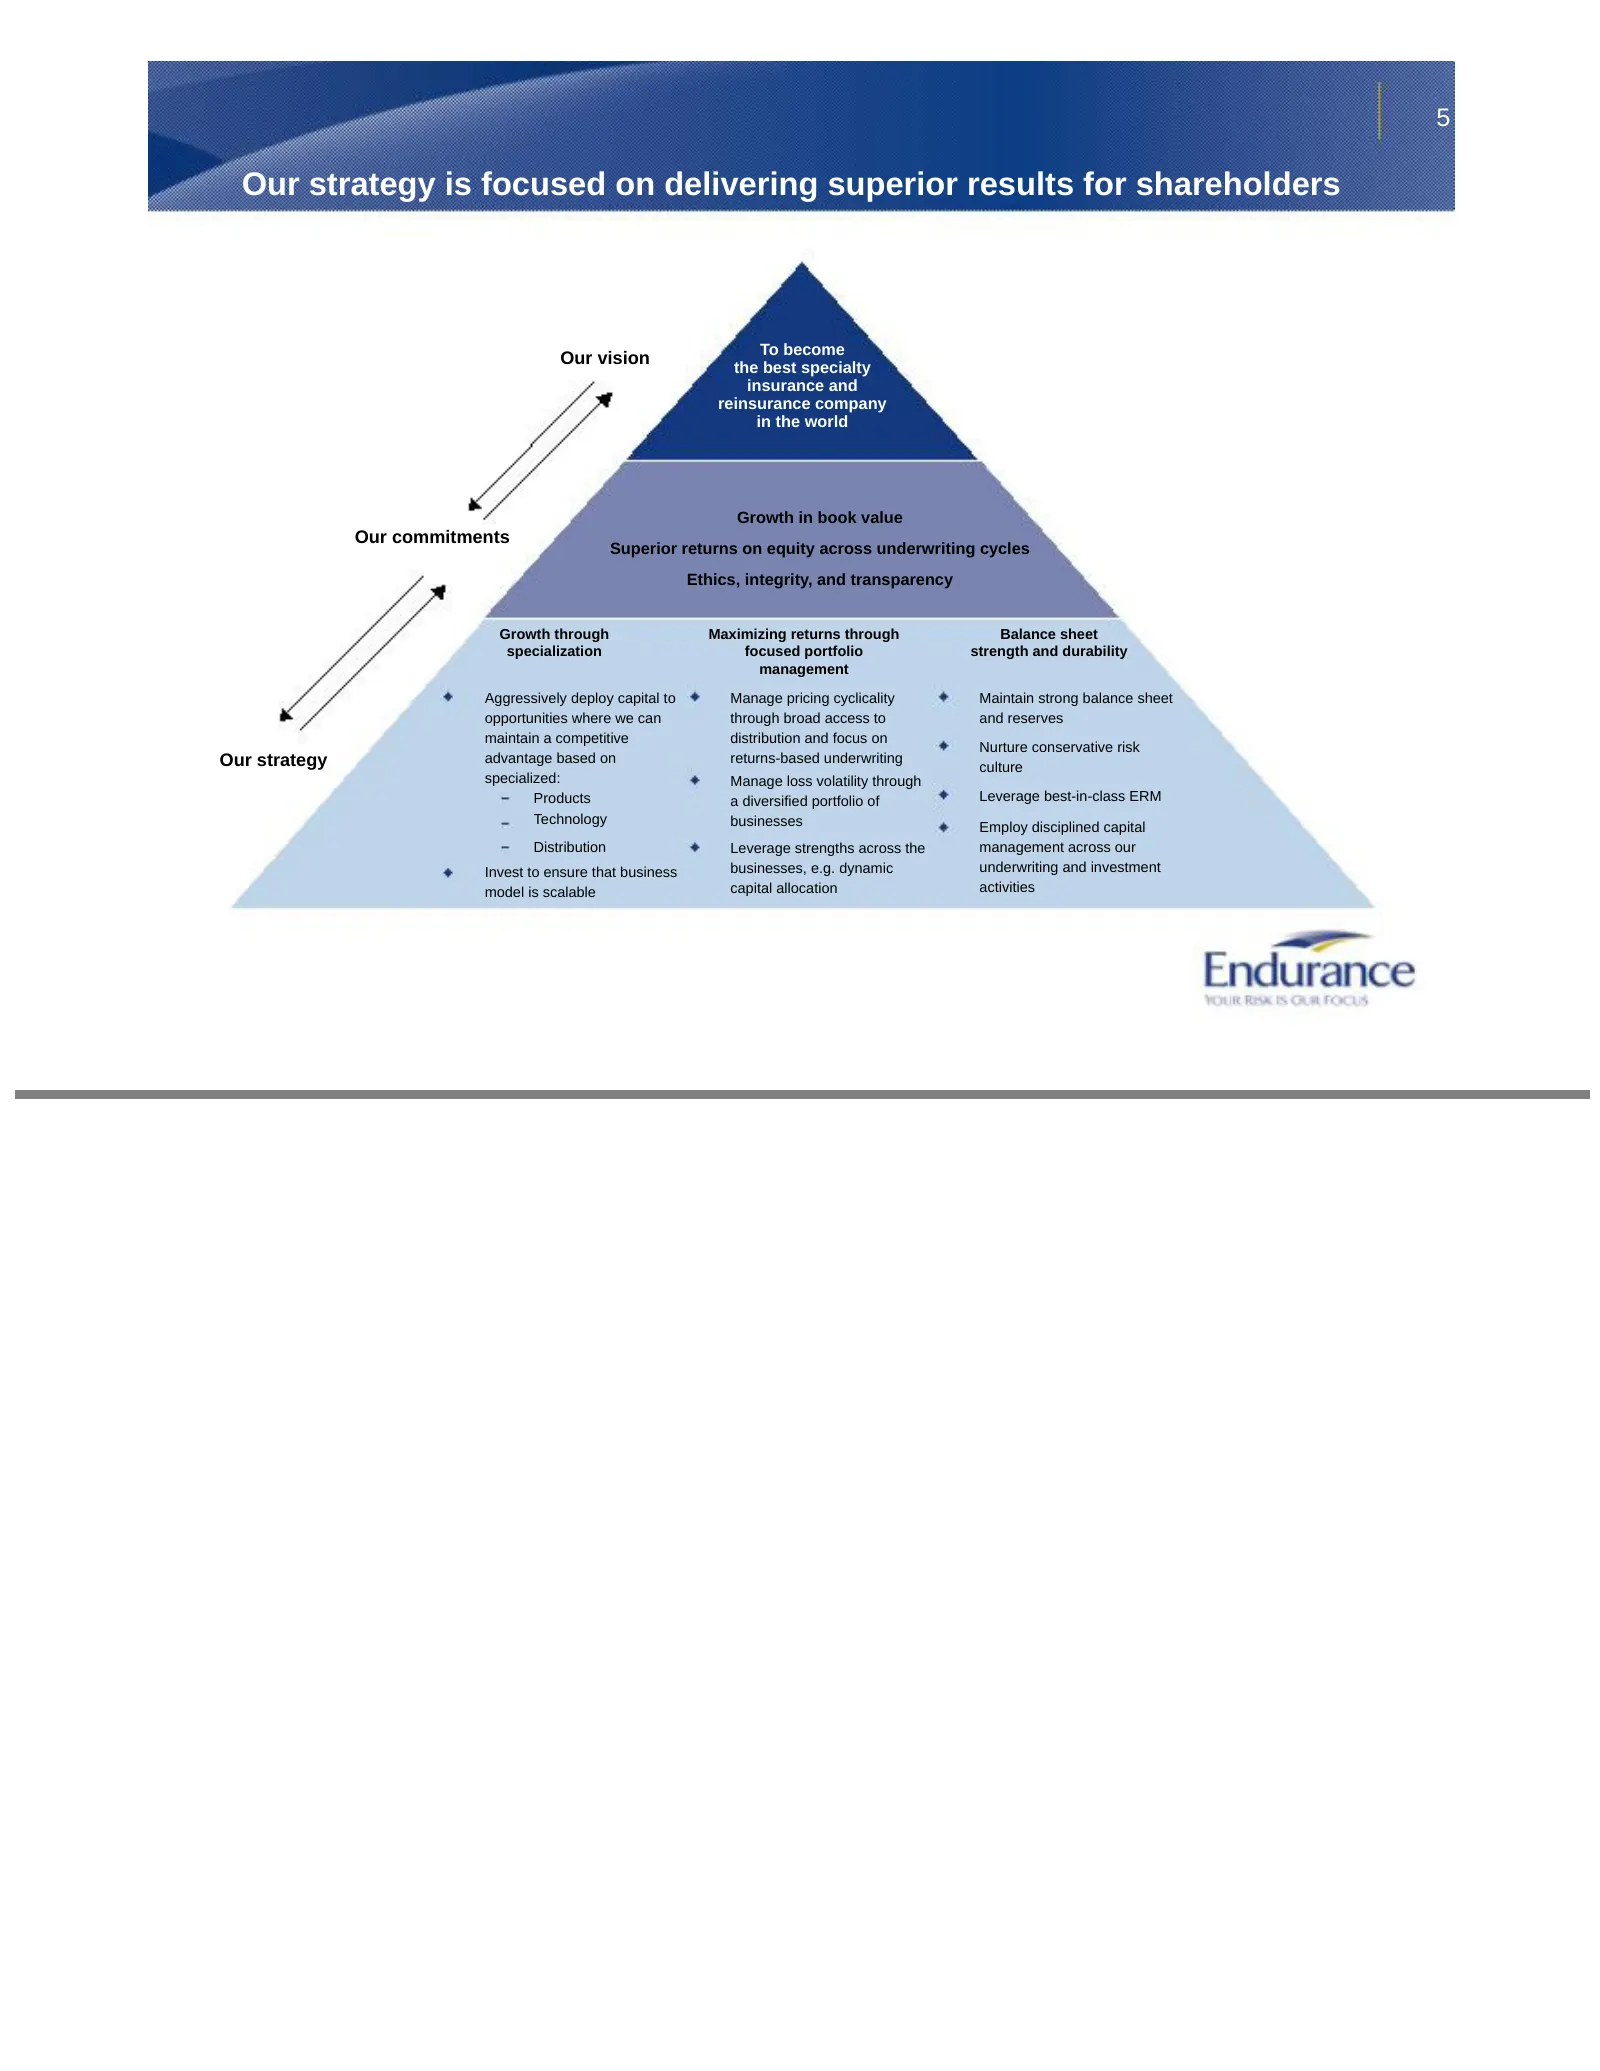
5 Our strategy is focused on delivering superior results for shareholders To become Our vision the best specialty insurance and reinsurance company in the world Growth in book value Our commitments Superior returns on equity across underwriting cycles Ethics, integrity, and transparency Growth throu
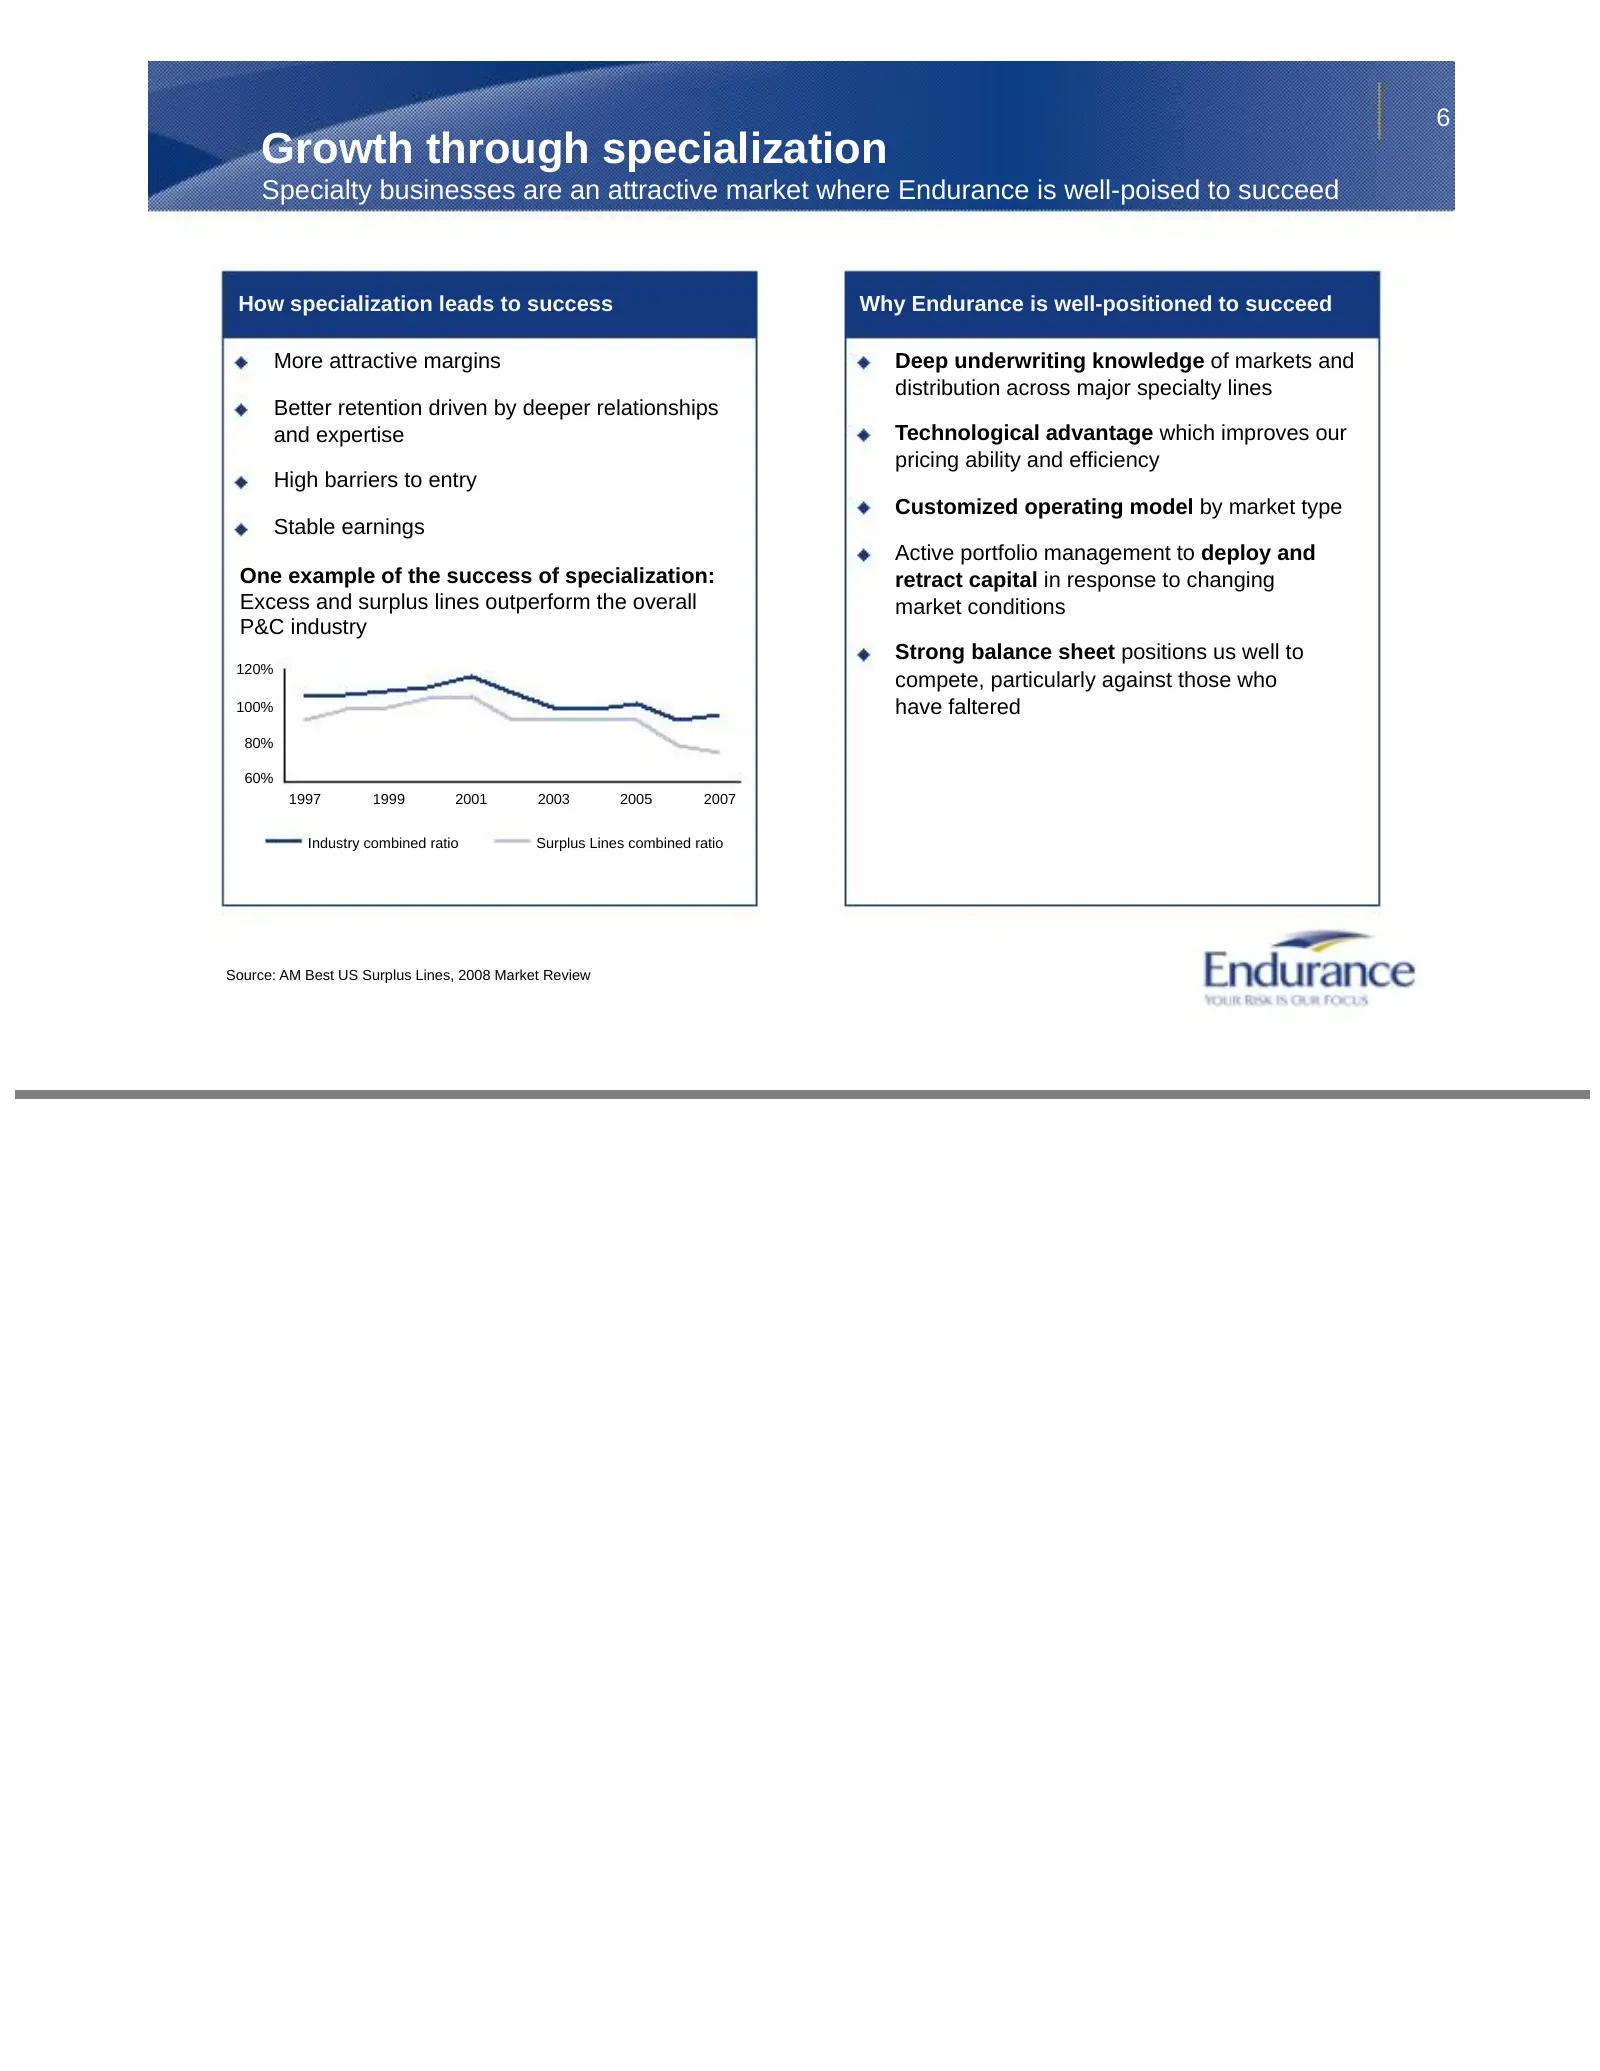
Slide 6: Growth through specialization
6 Growth through specialization Specialty businesses are an attractive market where Endurance is well-poised to succeed How specialization leads to success Why Endurance is well-positioned to succeed More attractive margins Deep underwriting knowledge of markets and distribution across major special
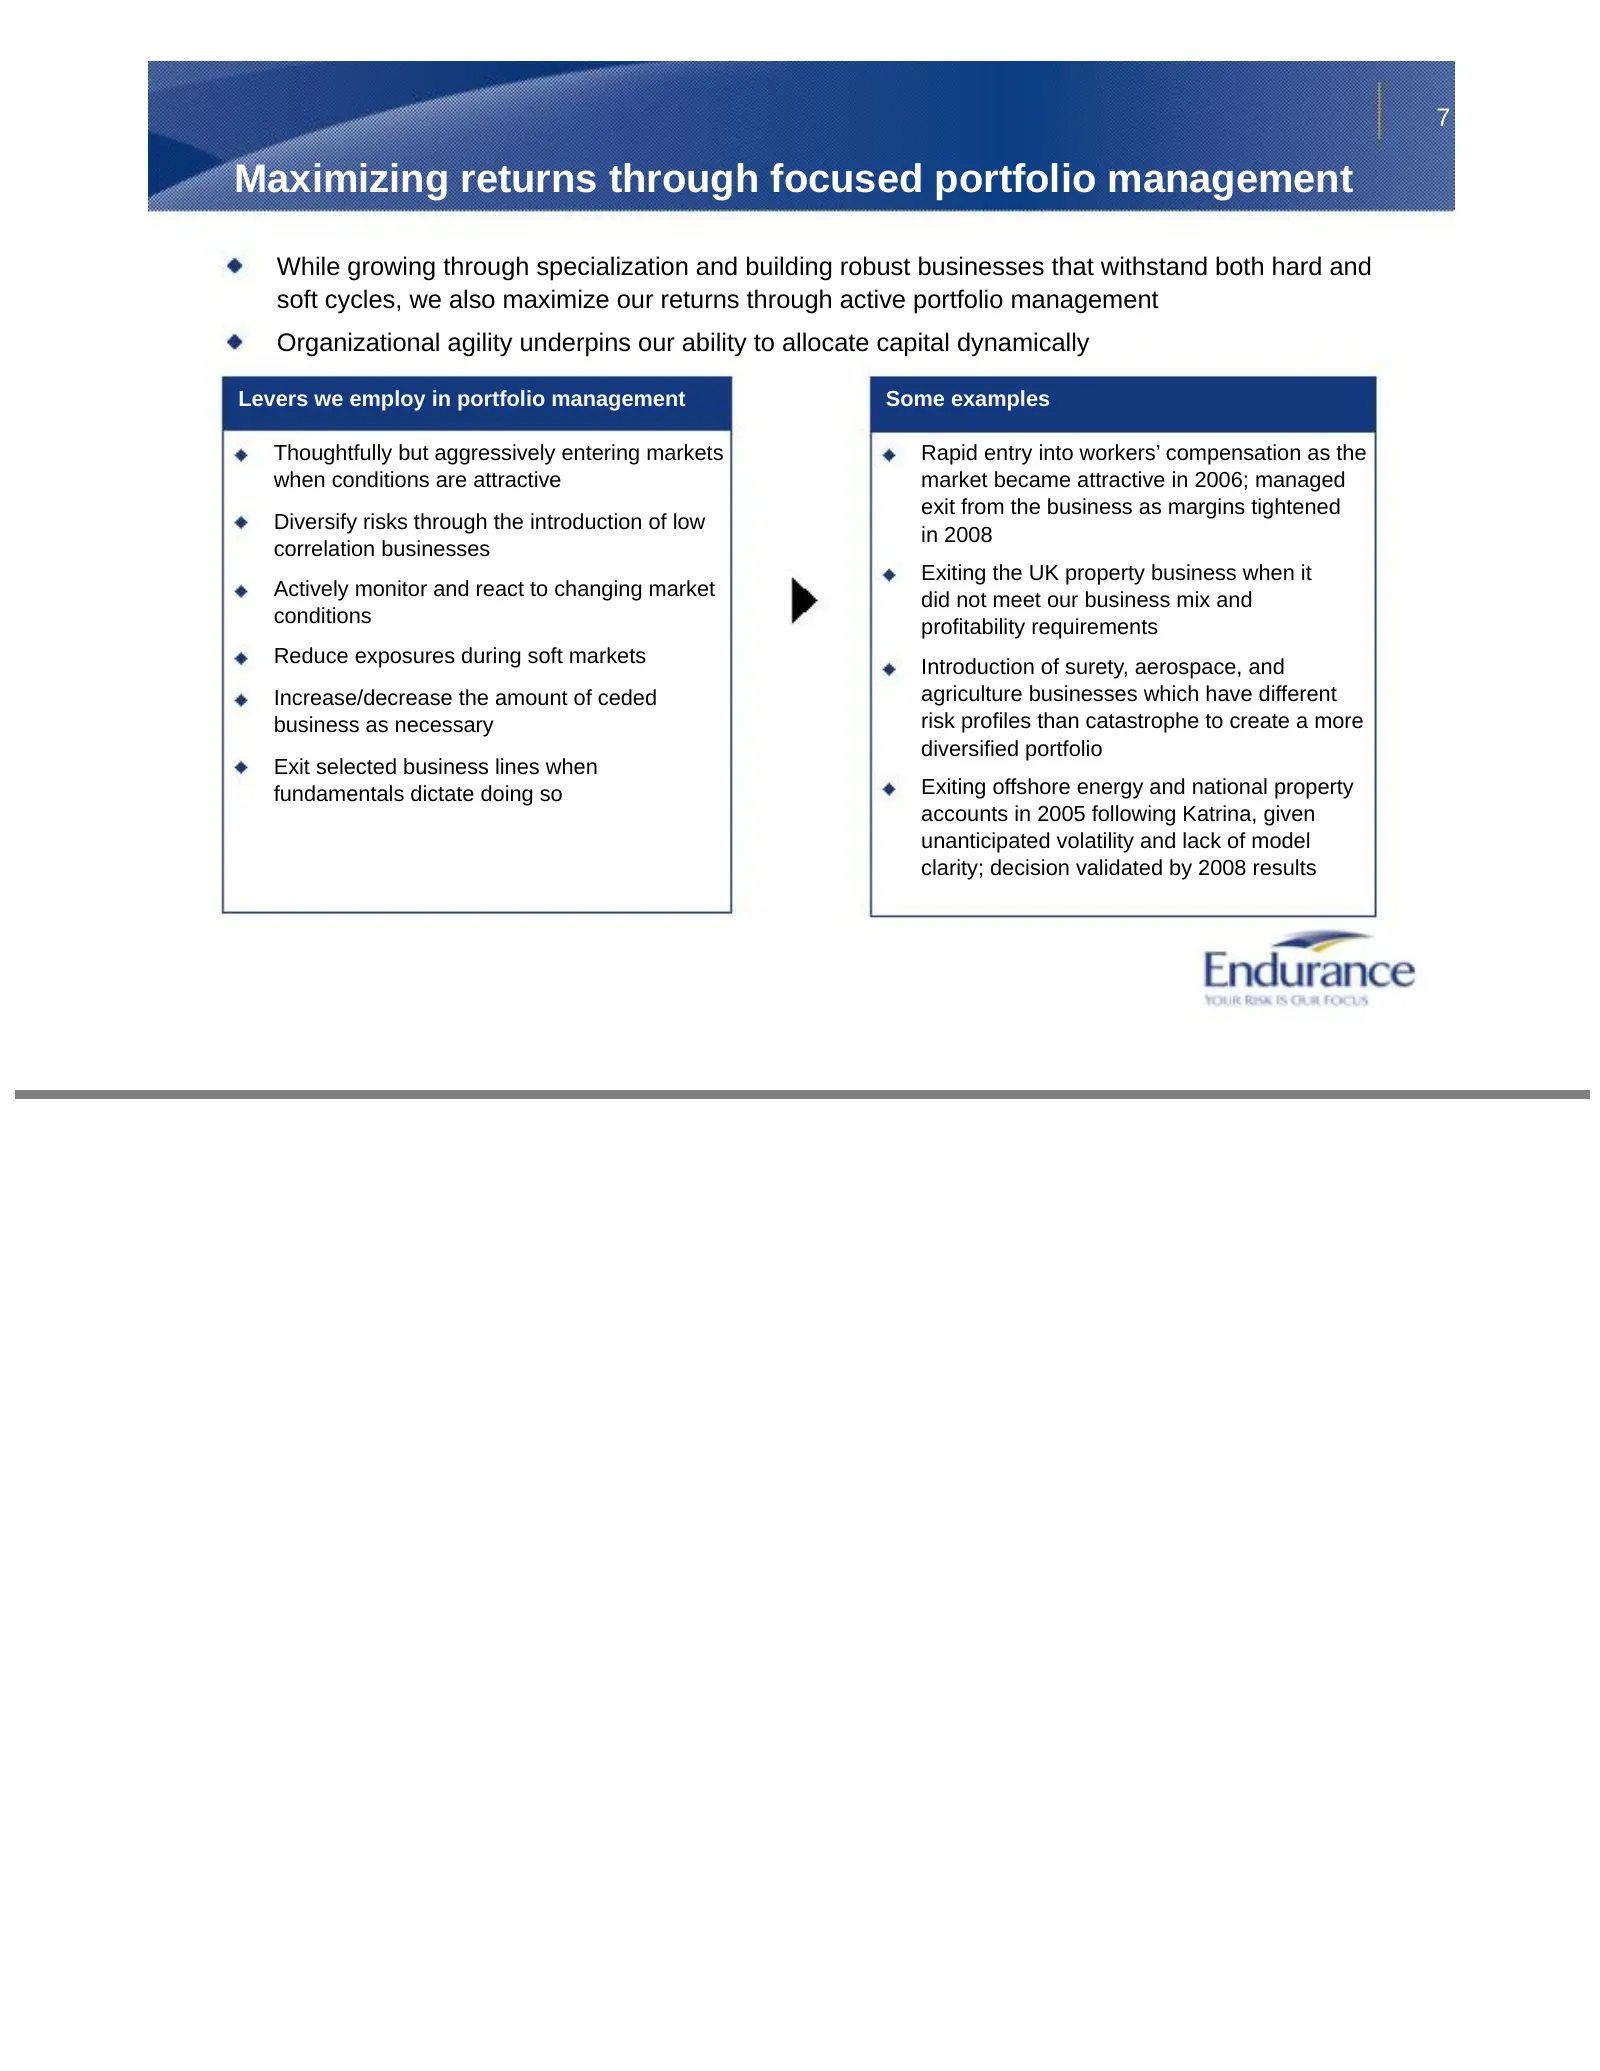
Slide 7: Maximizing returns through focused portfolio management
7 Maximizing returns through focused portfolio management While growing through specialization and building robust businesses that withstand both hard and soft cycles, we also maximize our returns through active portfolio management Organizational agility underpins our ability to allocate capital dy
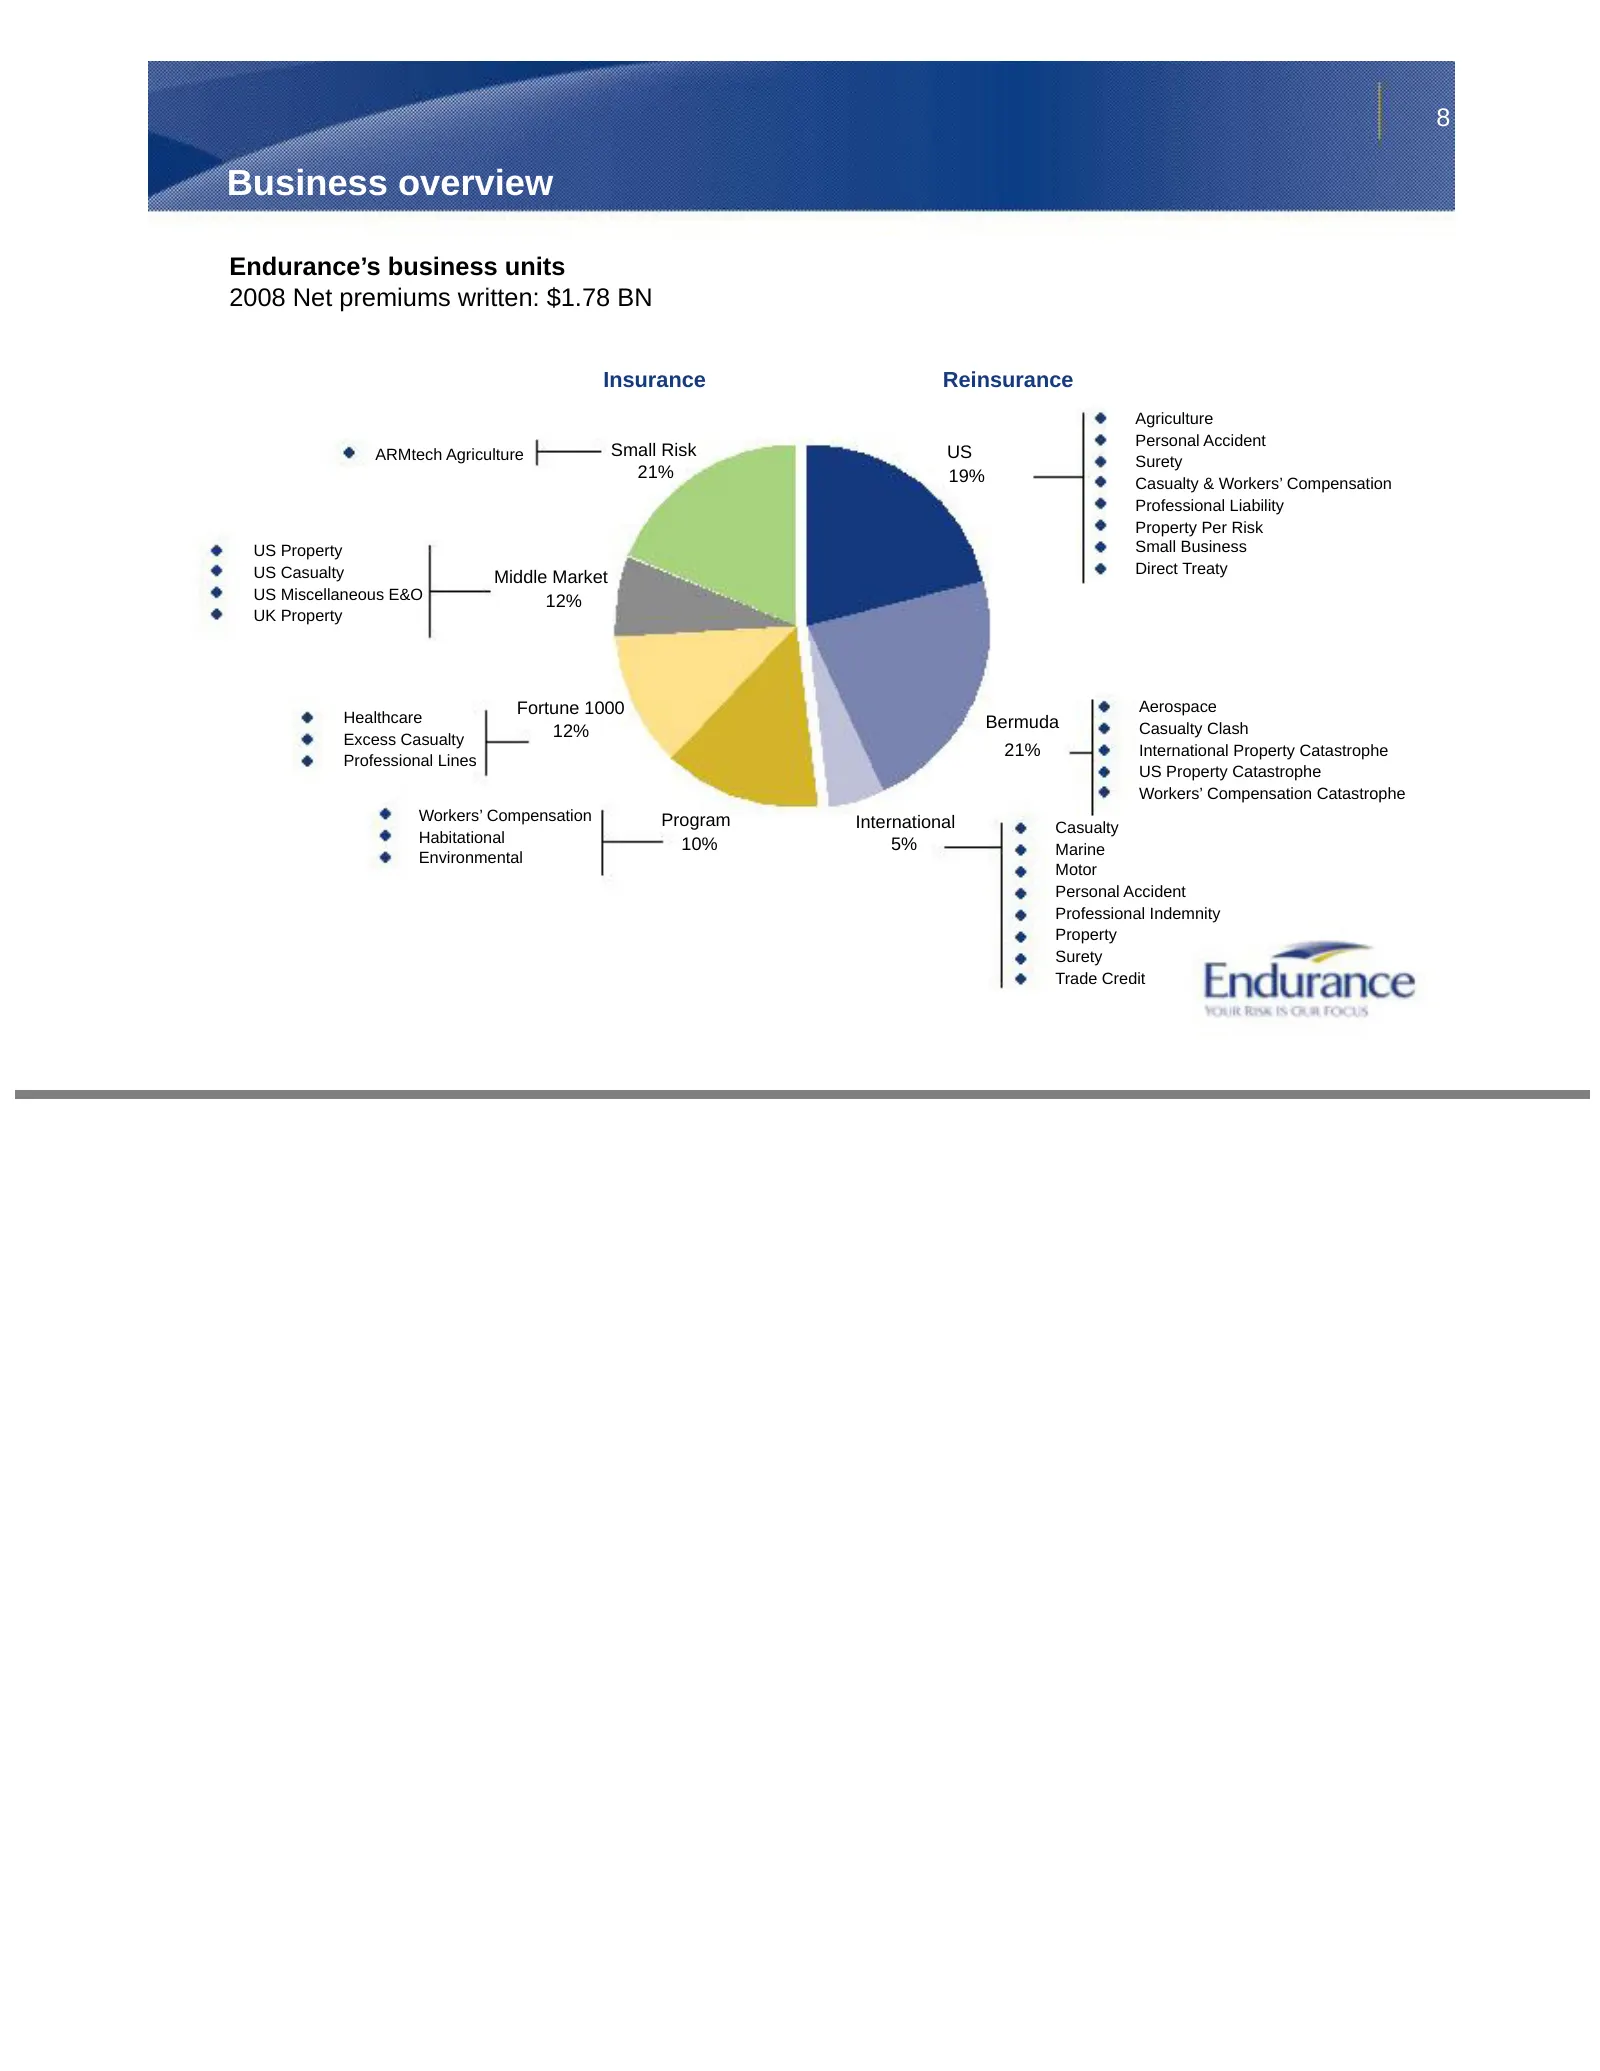
Slide 8: Business overview
8 Business overview Endurance’s business units 2008 Net premiums written: $1.78 BN Insurance Reinsurance Agriculture Personal Accident ARMtech Agriculture Small Risk US Surety 21% 19% Casualty & Workers’ Compensation Professional Liability Property Per Risk US Property Small Business US Casualty Dir
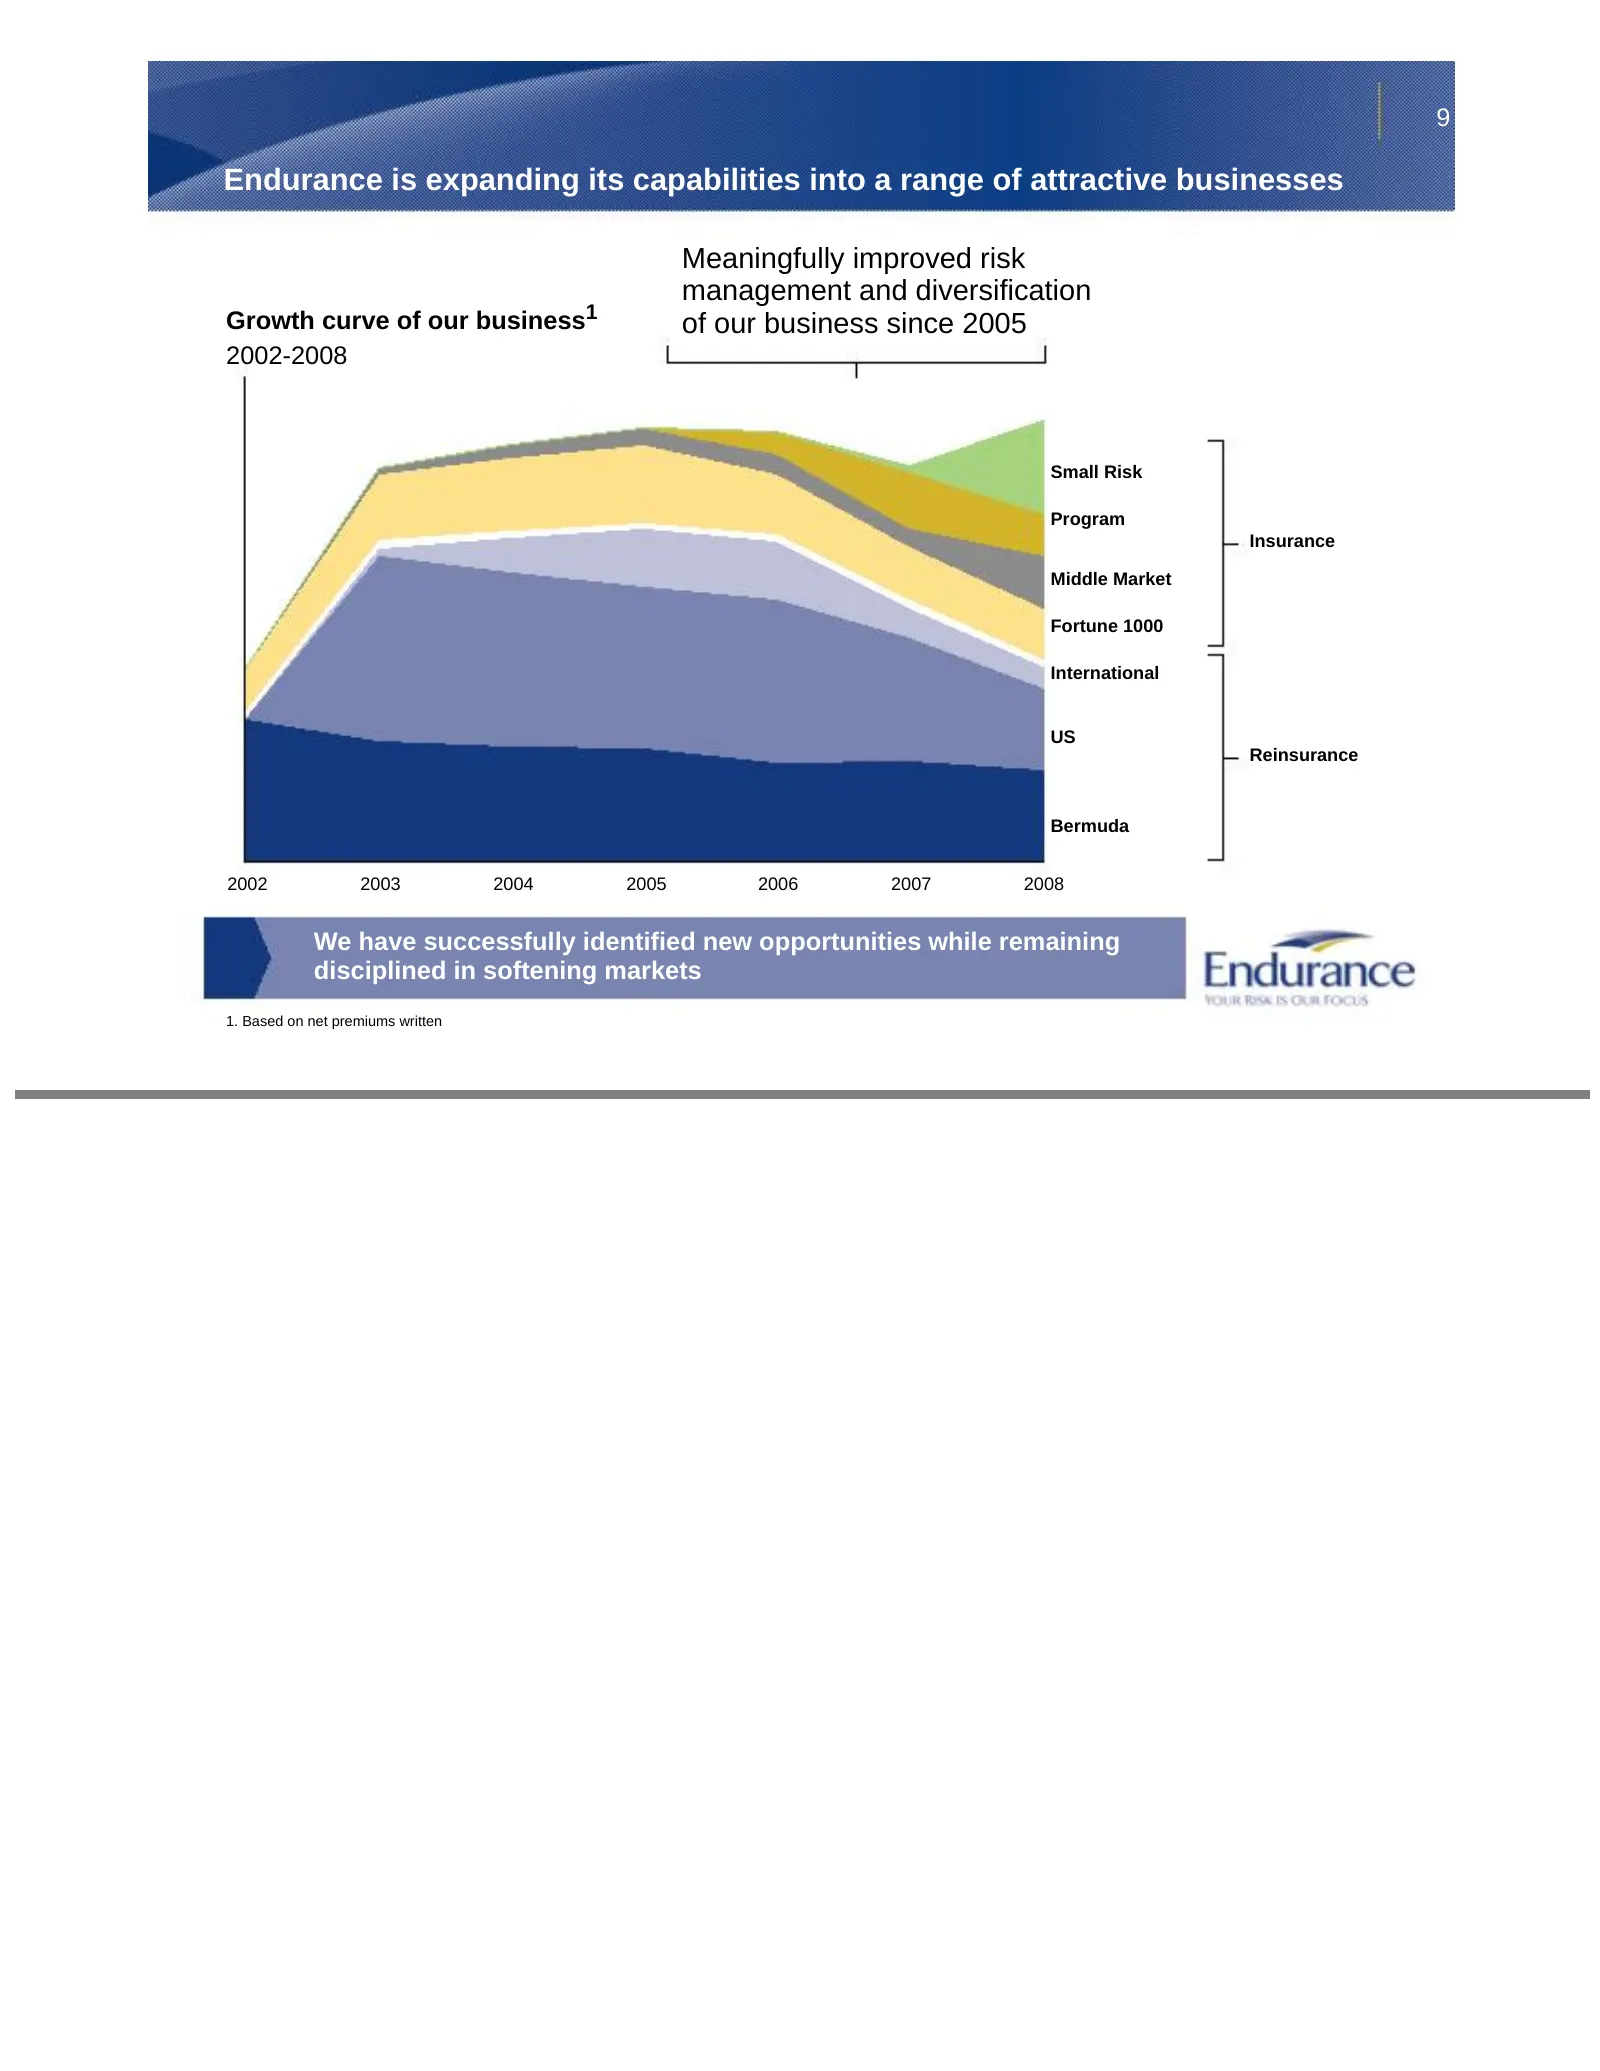
Slide 9: Endurance is expanding its capabilities into a range of attractive businesses
9 Endurance is expanding its capabilities into a range of attractive businesses Meaningfully improved risk management and diversification Growth curve of our business1 of our business since 2005 2002-2008 Small Risk Program Insurance Middle Market Fortune 1000 International US Reinsurance Bermuda 20
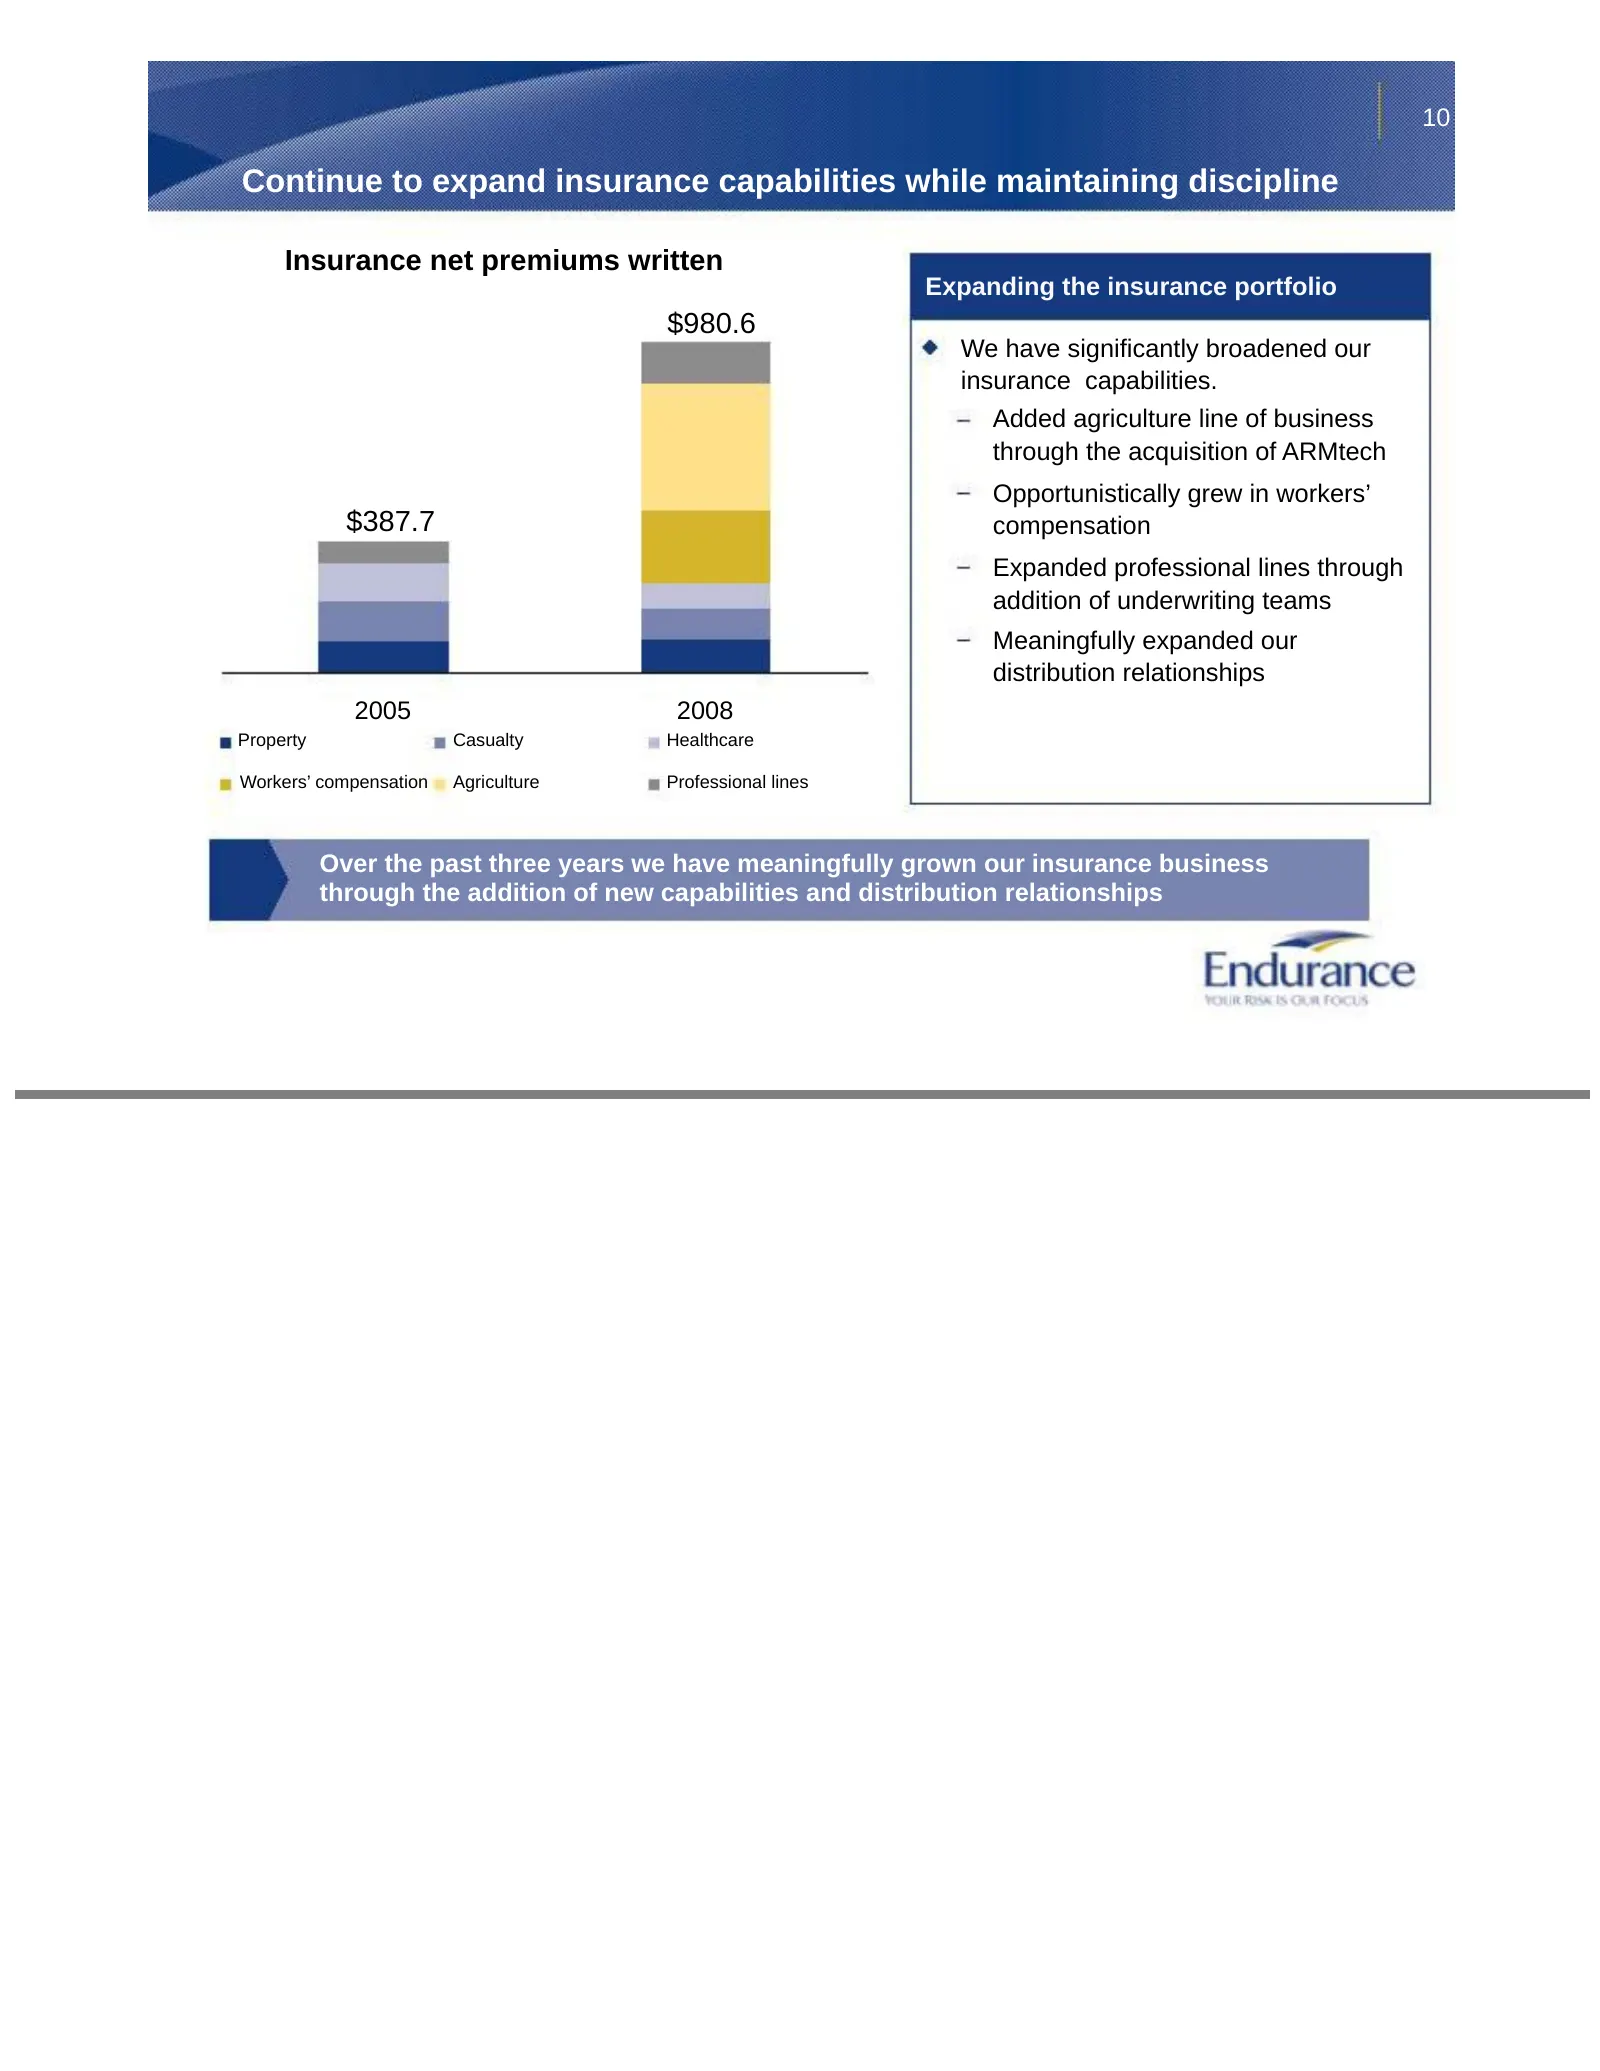
Slide 10: Continue to expand insurance capabilities while maintaining discipline
10 Continue to expand insurance capabilities while maintaining discipline Insurance net premiums written Expanding the insurance portfolio $980.6 We have significantly broadened our insurance capabilities. Added agriculture line of business through the acquisition of ARMtech Opportunistically grew i
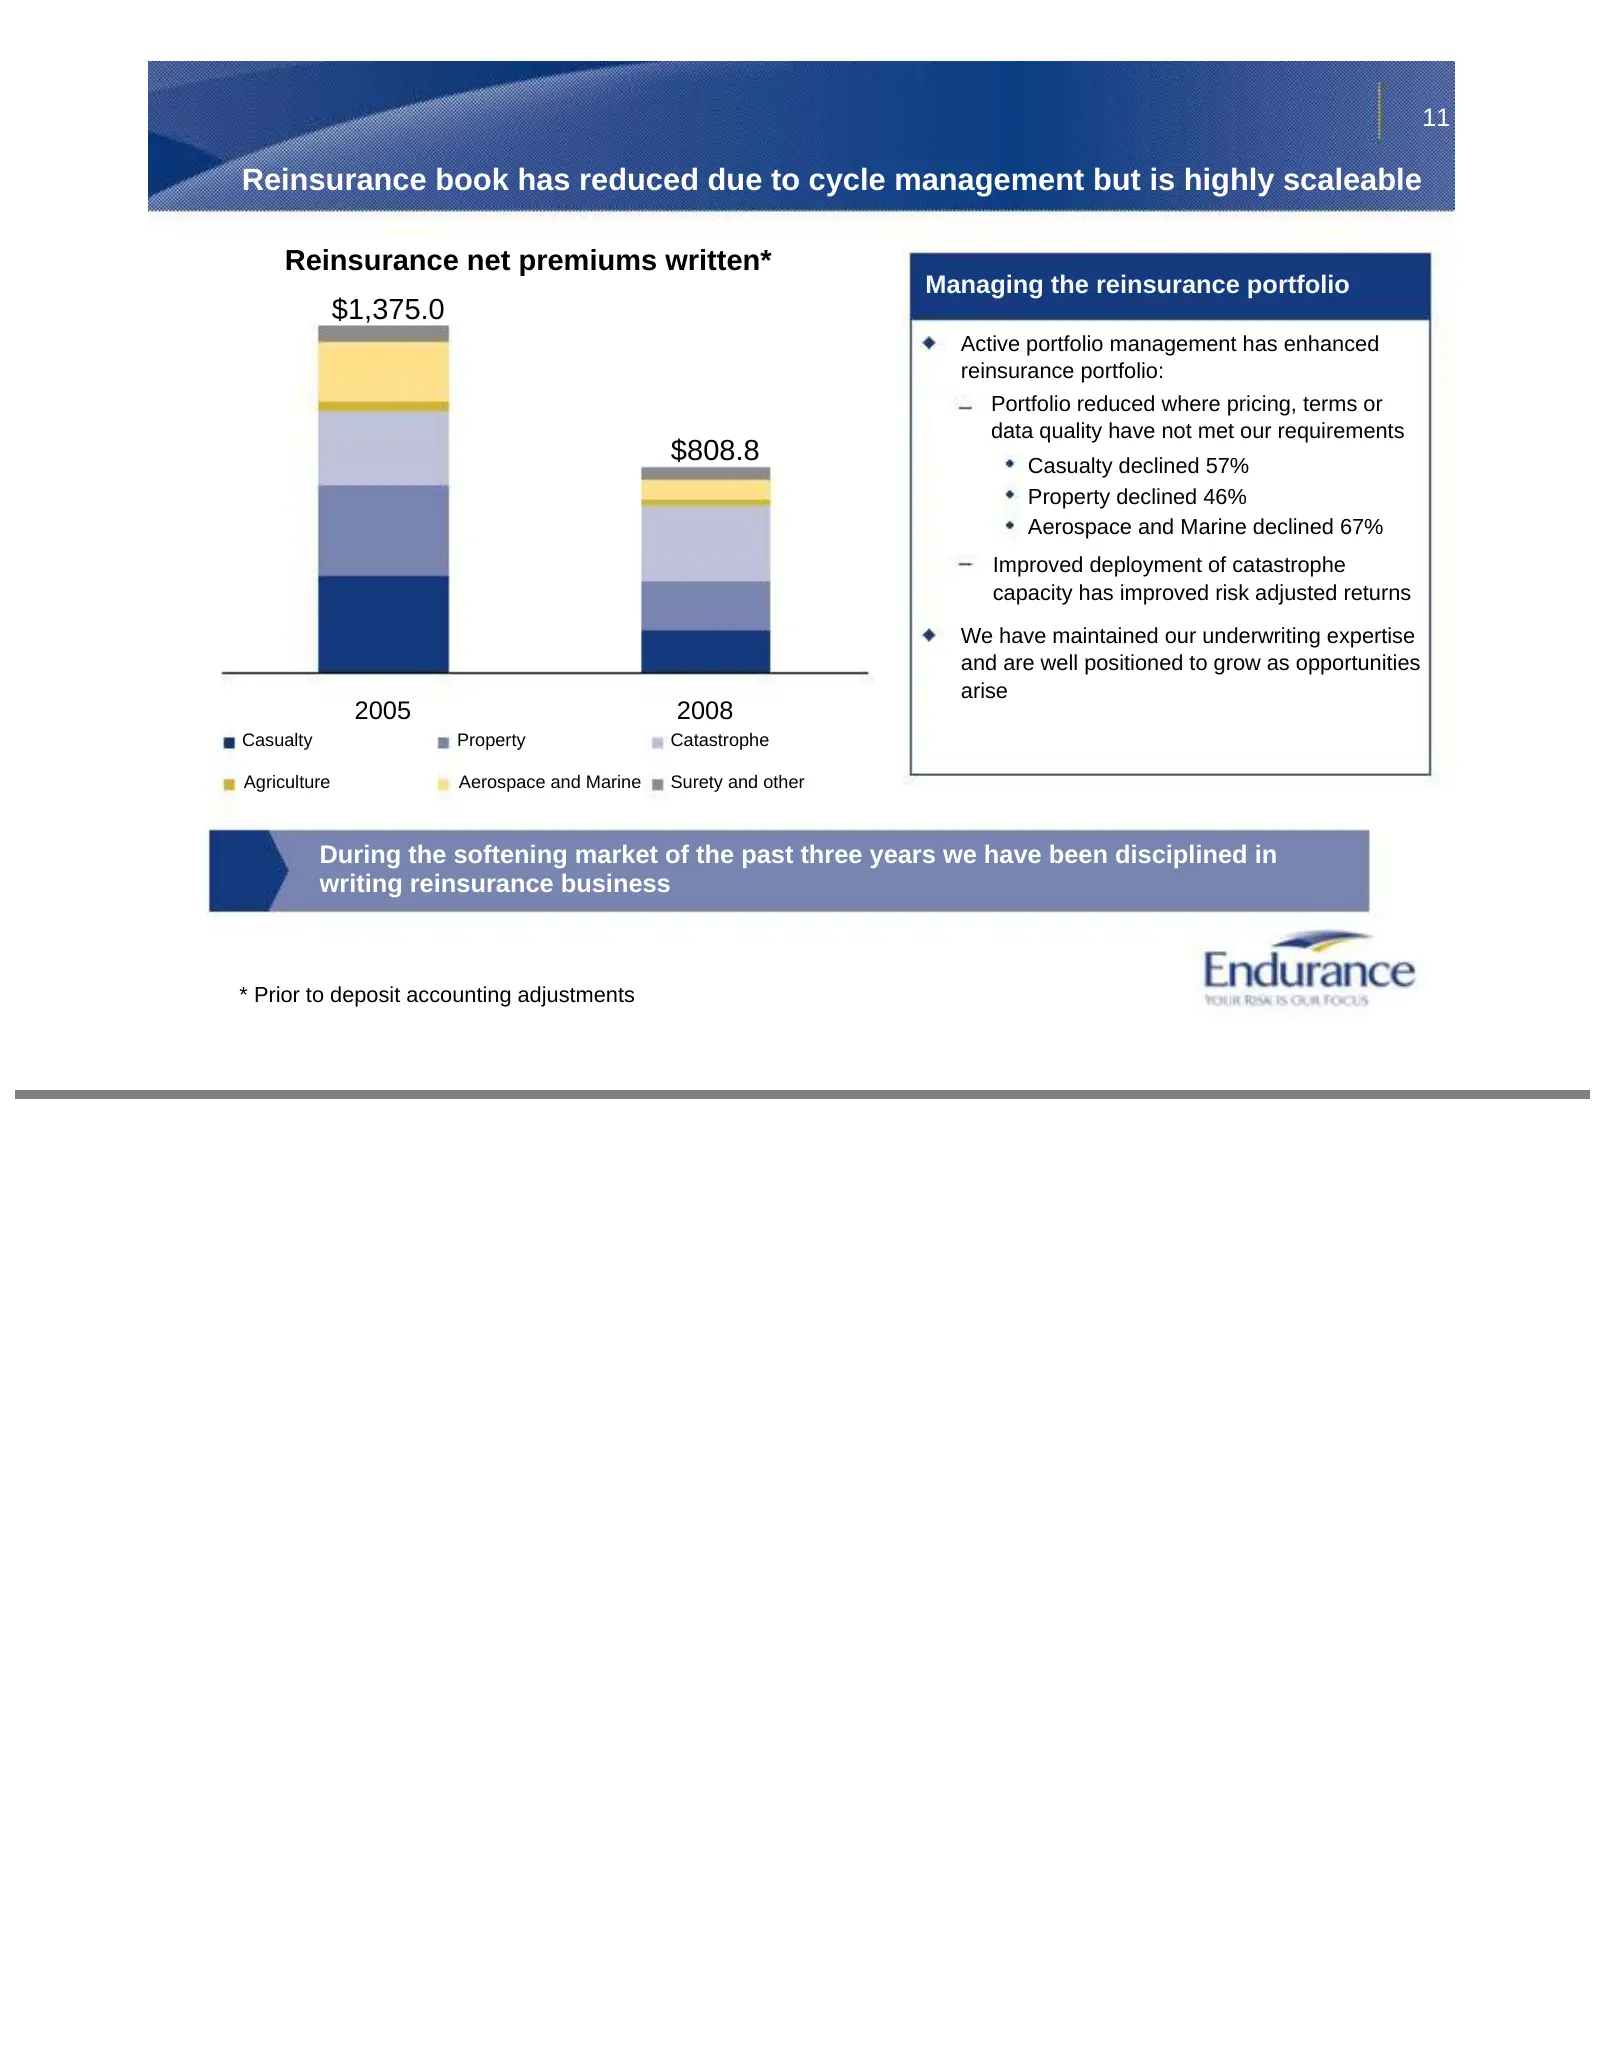
Slide 11: Reinsurance book has reduced due to cycle management but is highly scaleable
11 Reinsurance book has reduced due to cycle management but is highly scaleable Reinsurance net premiums written* Managing the reinsurance portfolio $1,375.0 Active portfolio management has enhanced reinsurance portfolio: Portfolio reduced where pricing, terms or data quality have not met our requir
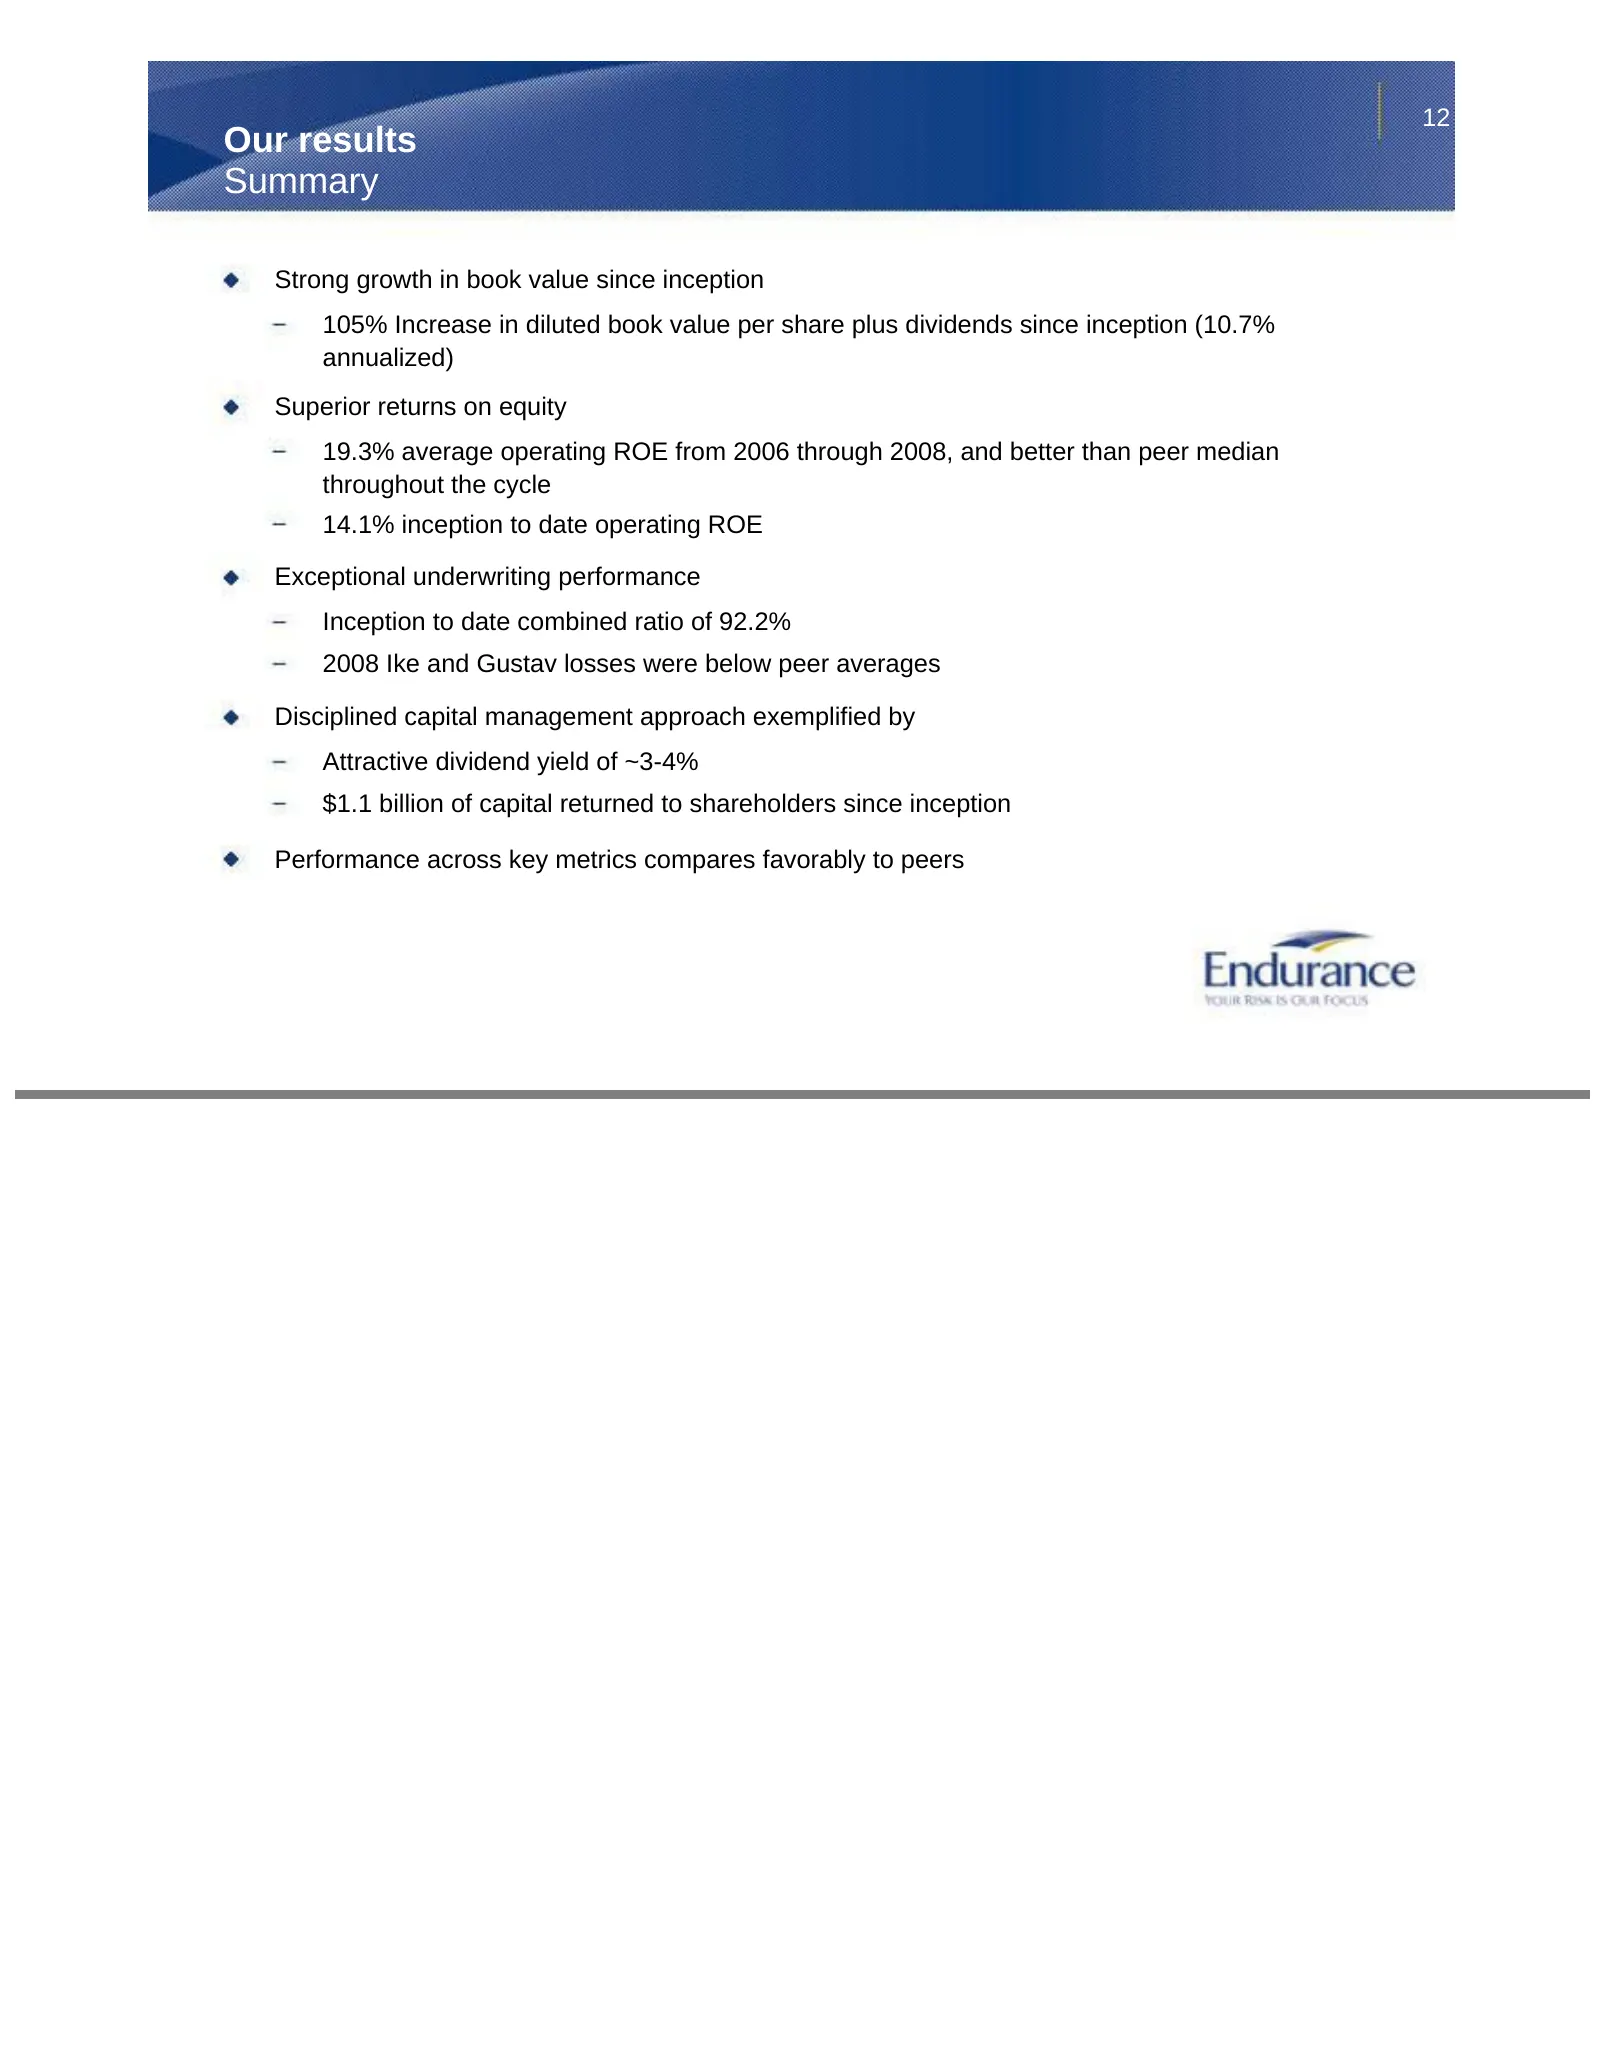
Slide 12: Our results: Summary
12 Our results Summary Strong growth in book value since inception 105% Increase in diluted book value per share plus dividends since inception (10.7% annualized) Superior returns on equity 19.3% average operating ROE from 2006 through 2008, and better than peer median throughout the cycle 14.1% inc
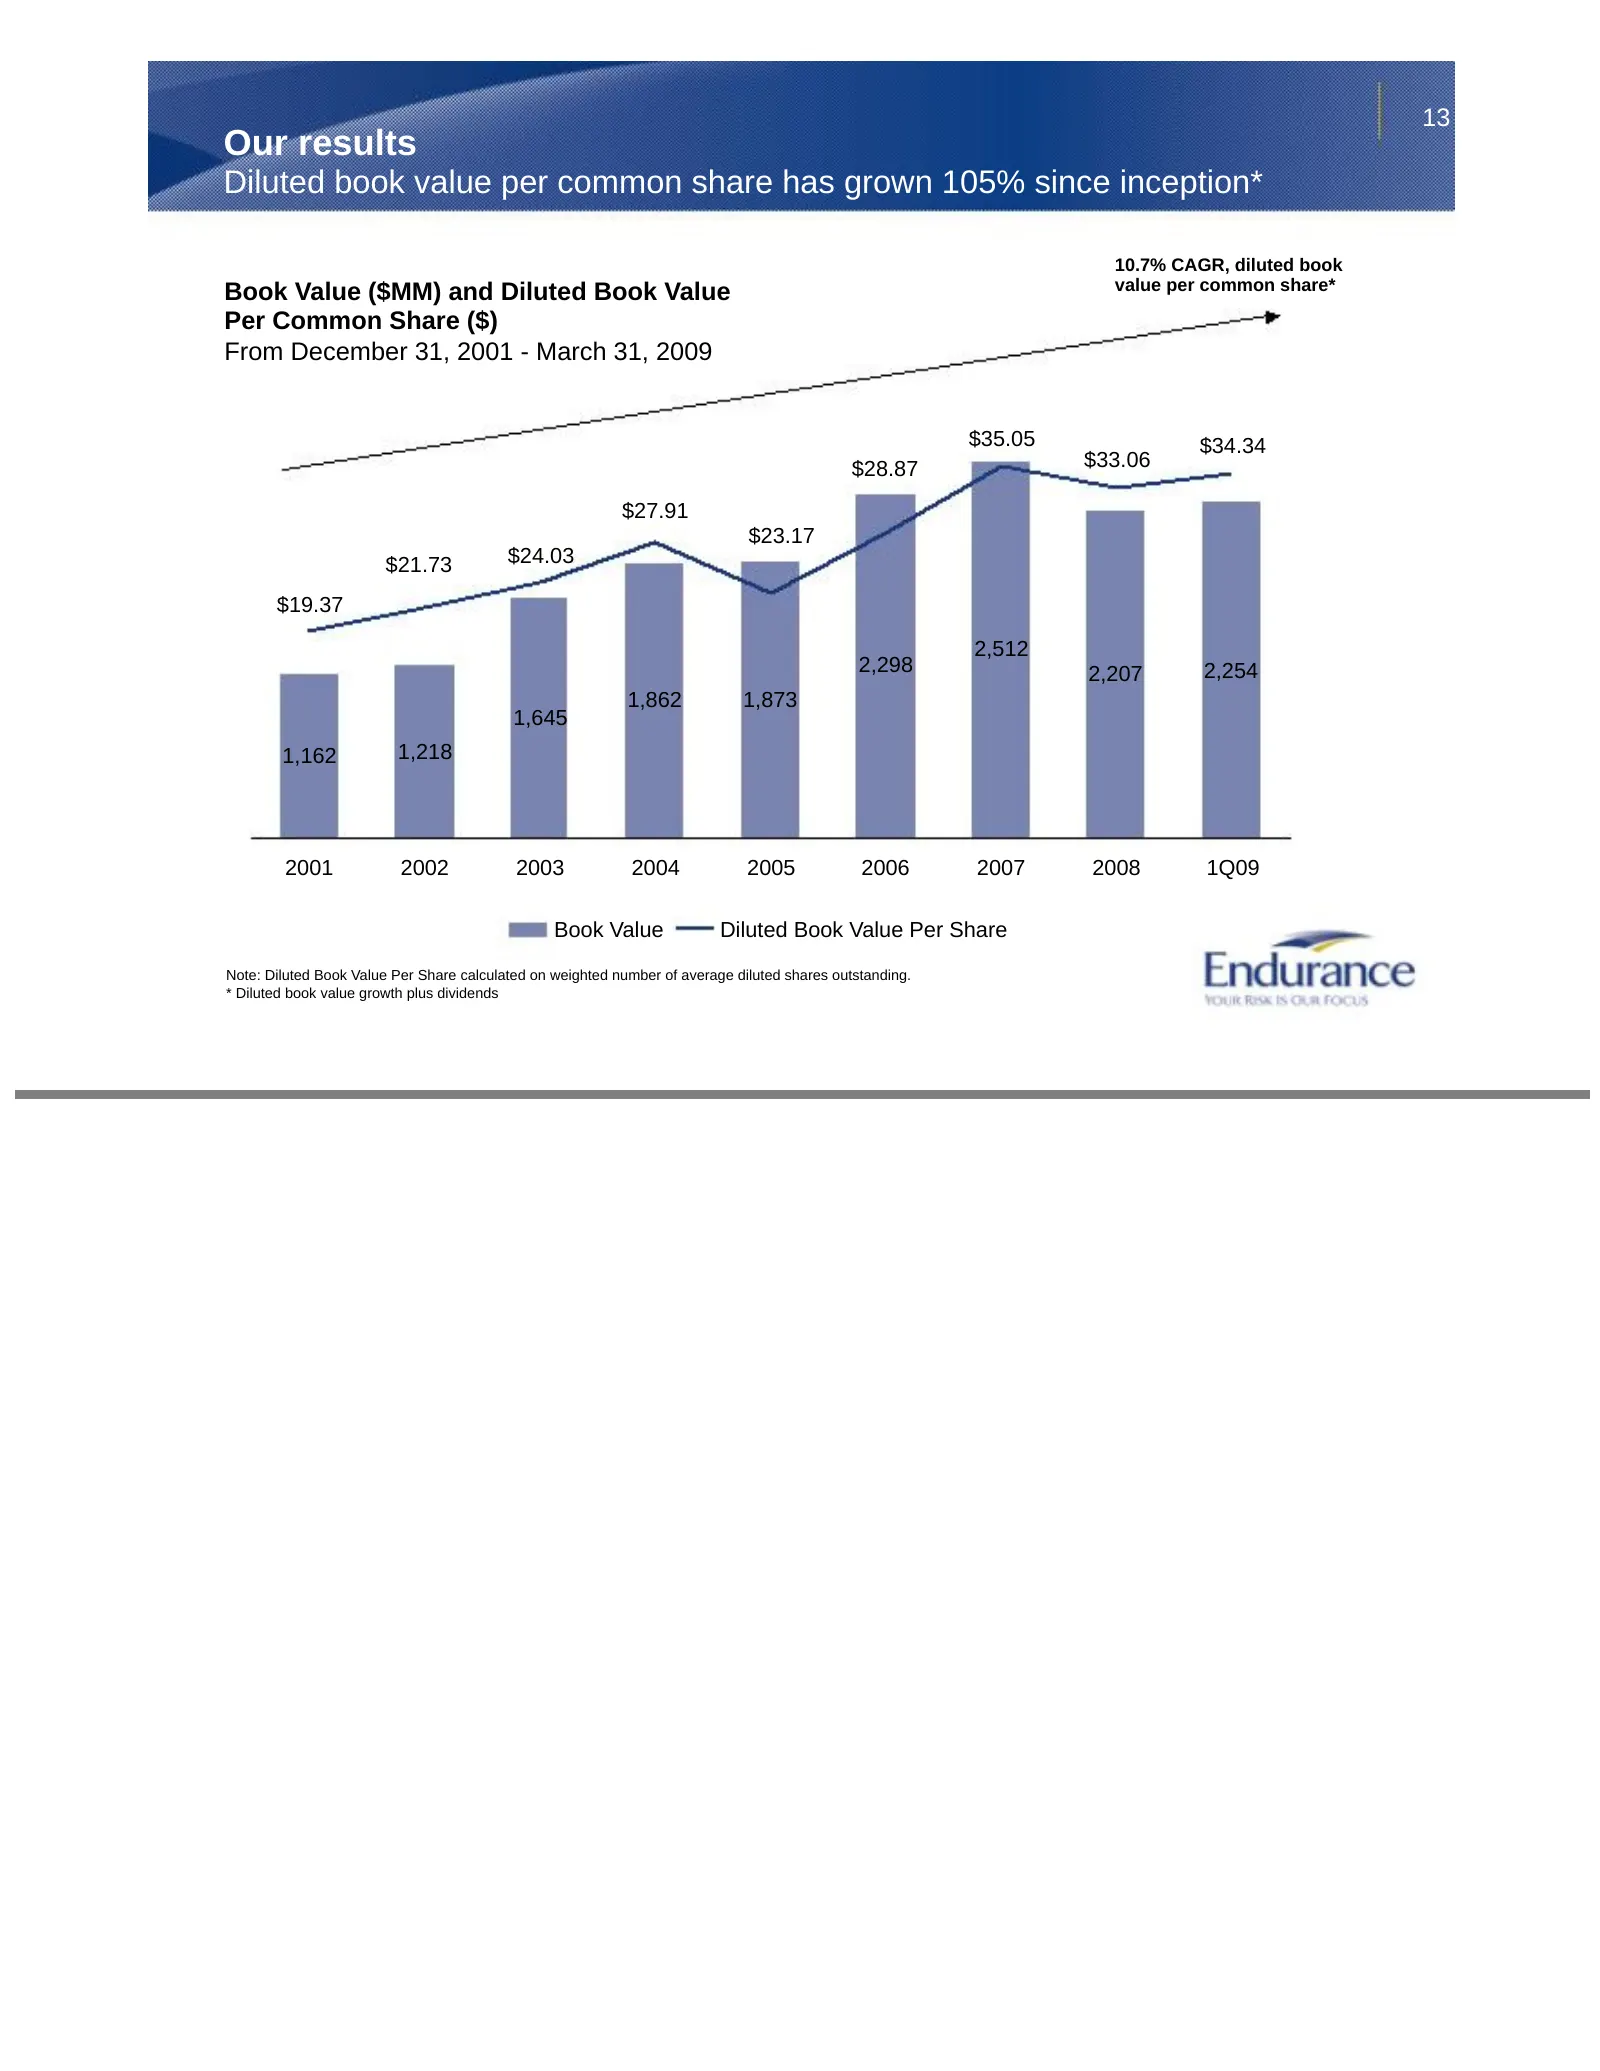
Slide 13: Diluted book value per common share has grown 105% since inception
13 Our results Diluted book value per common share has grown 105% since inception* 10.7% CAGR, diluted book Book Value ($MM) and Diluted Book Value value per common share* Per Common Share ($) From December 31, 2001 - March 31, 2009 $35.05 $34.34 $28.87 $33.06 $27.91 $23.17 $21.73 $24.03 $19.37 2,51
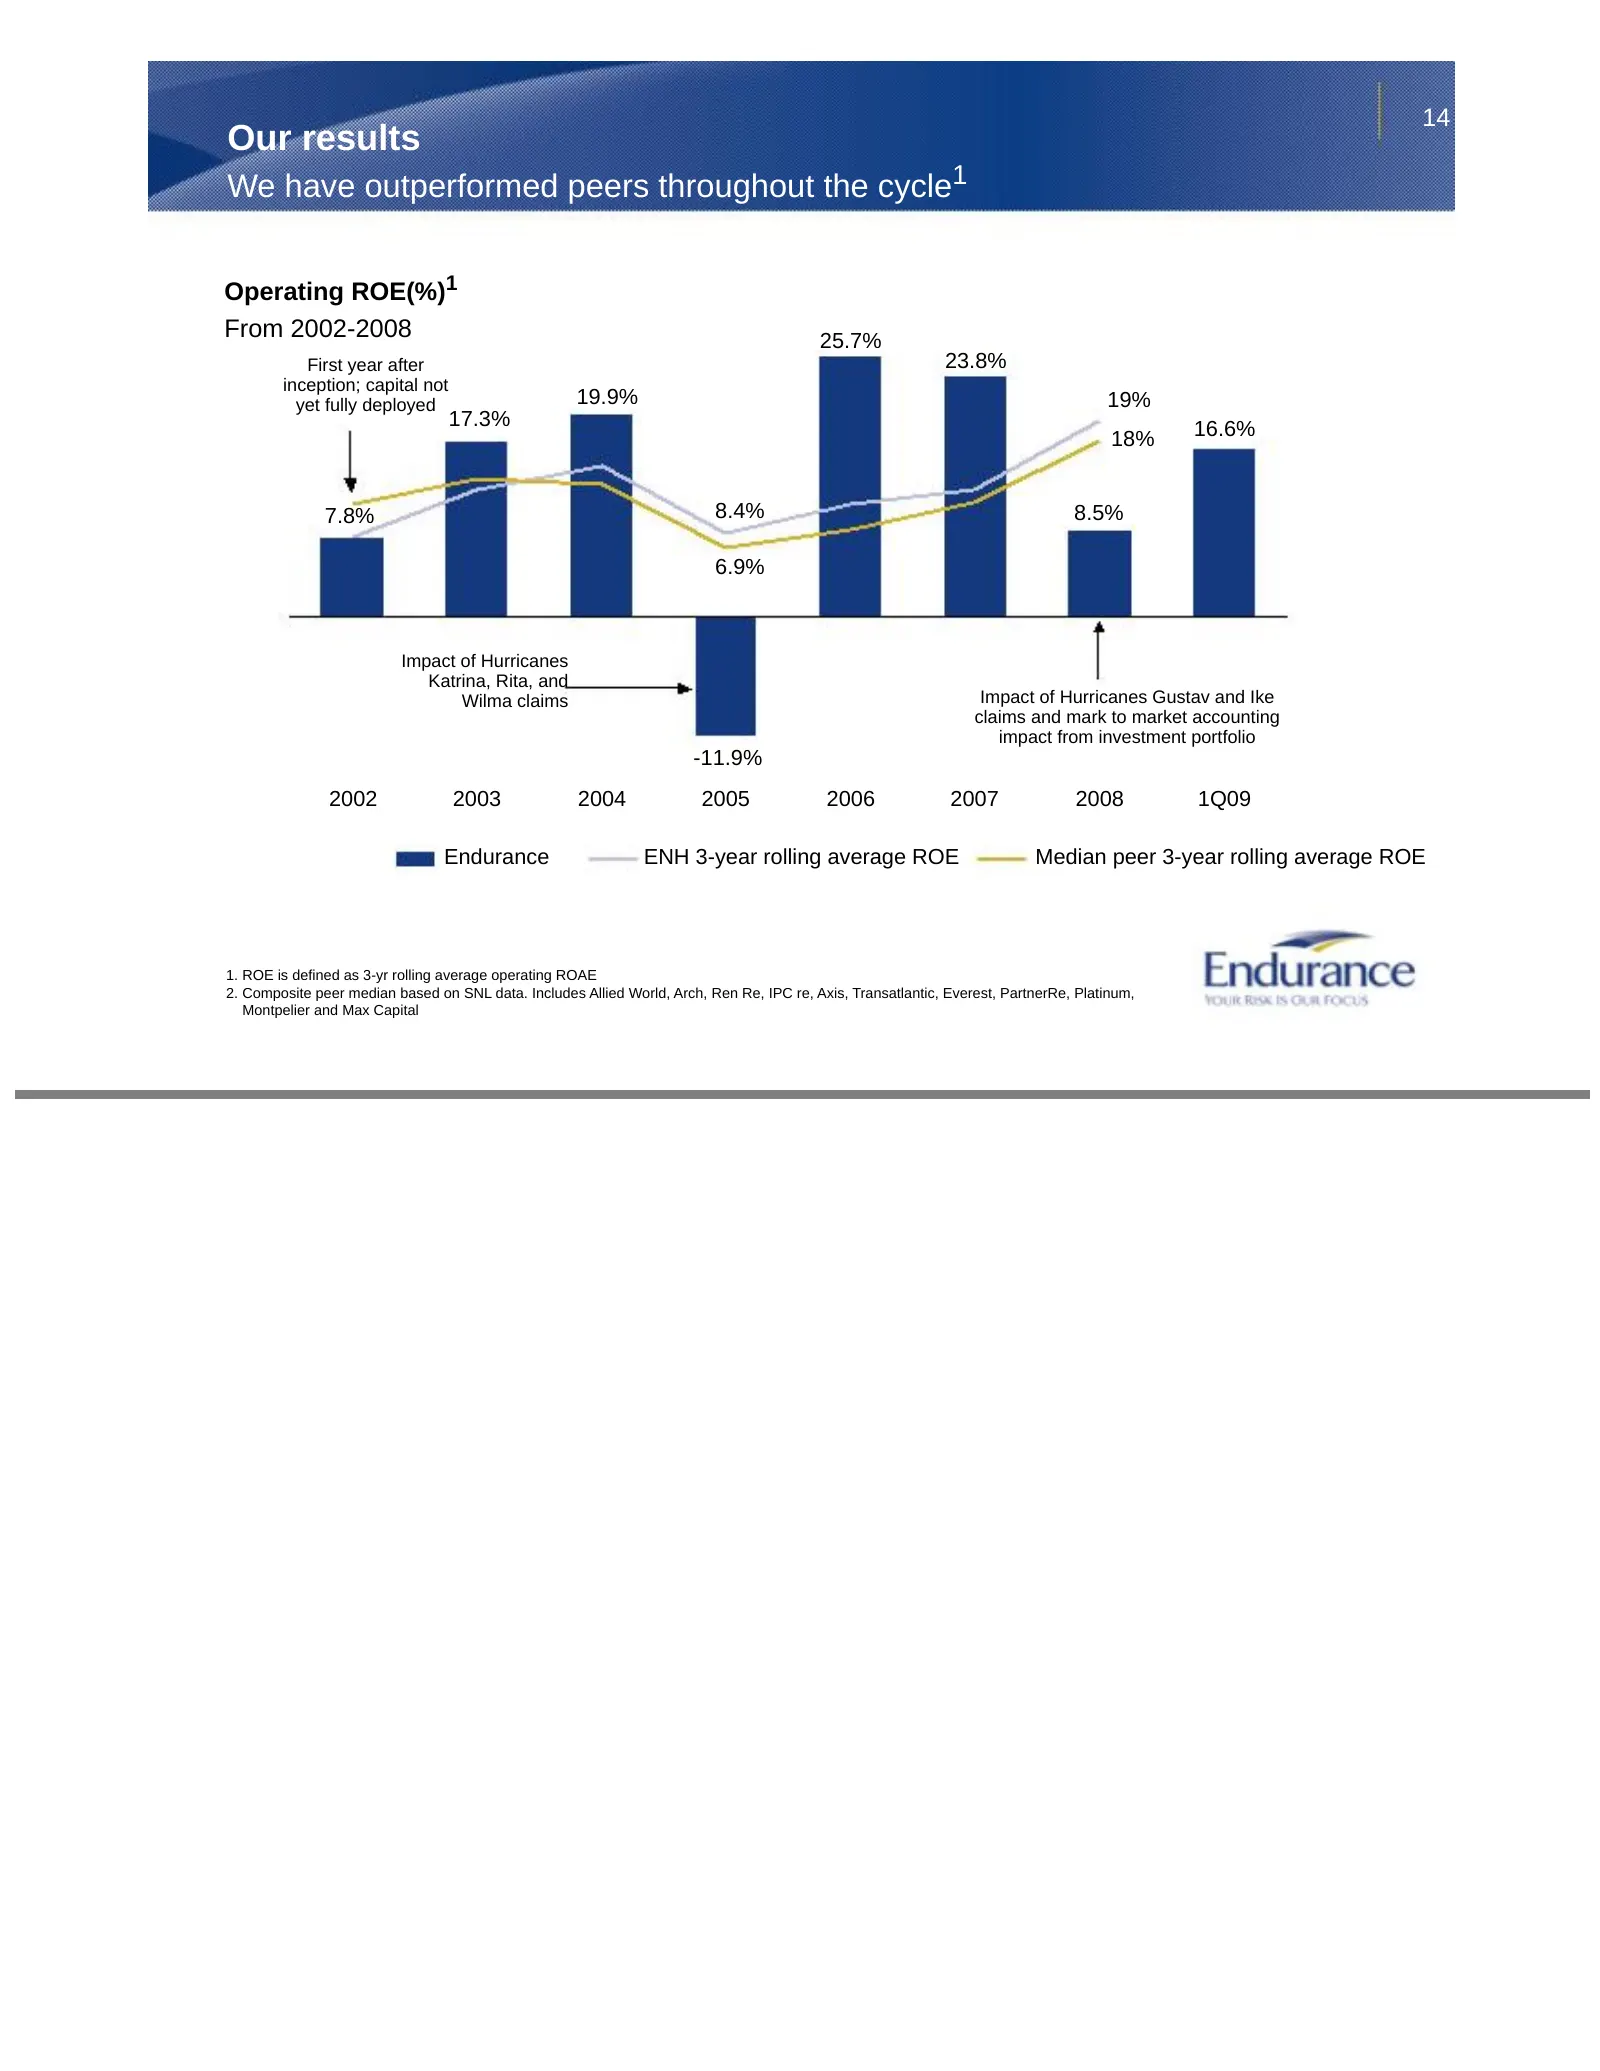
Slide 14: We have outperformed peers throughout the cycle
14 Our results We have outperformed peers throughout the cycle1 Operating ROE(%)1 From 2002-2008 25.7% First year after 23.8% inception; capital not yet fully deployed 19.9% 19% 17.3% 16.6% 18% 7.8% 8.4% 8.5% 6.9% Impact of Hurricanes Katrina, Rita, and Wilma claims Impact of Hurricanes Gustav and I
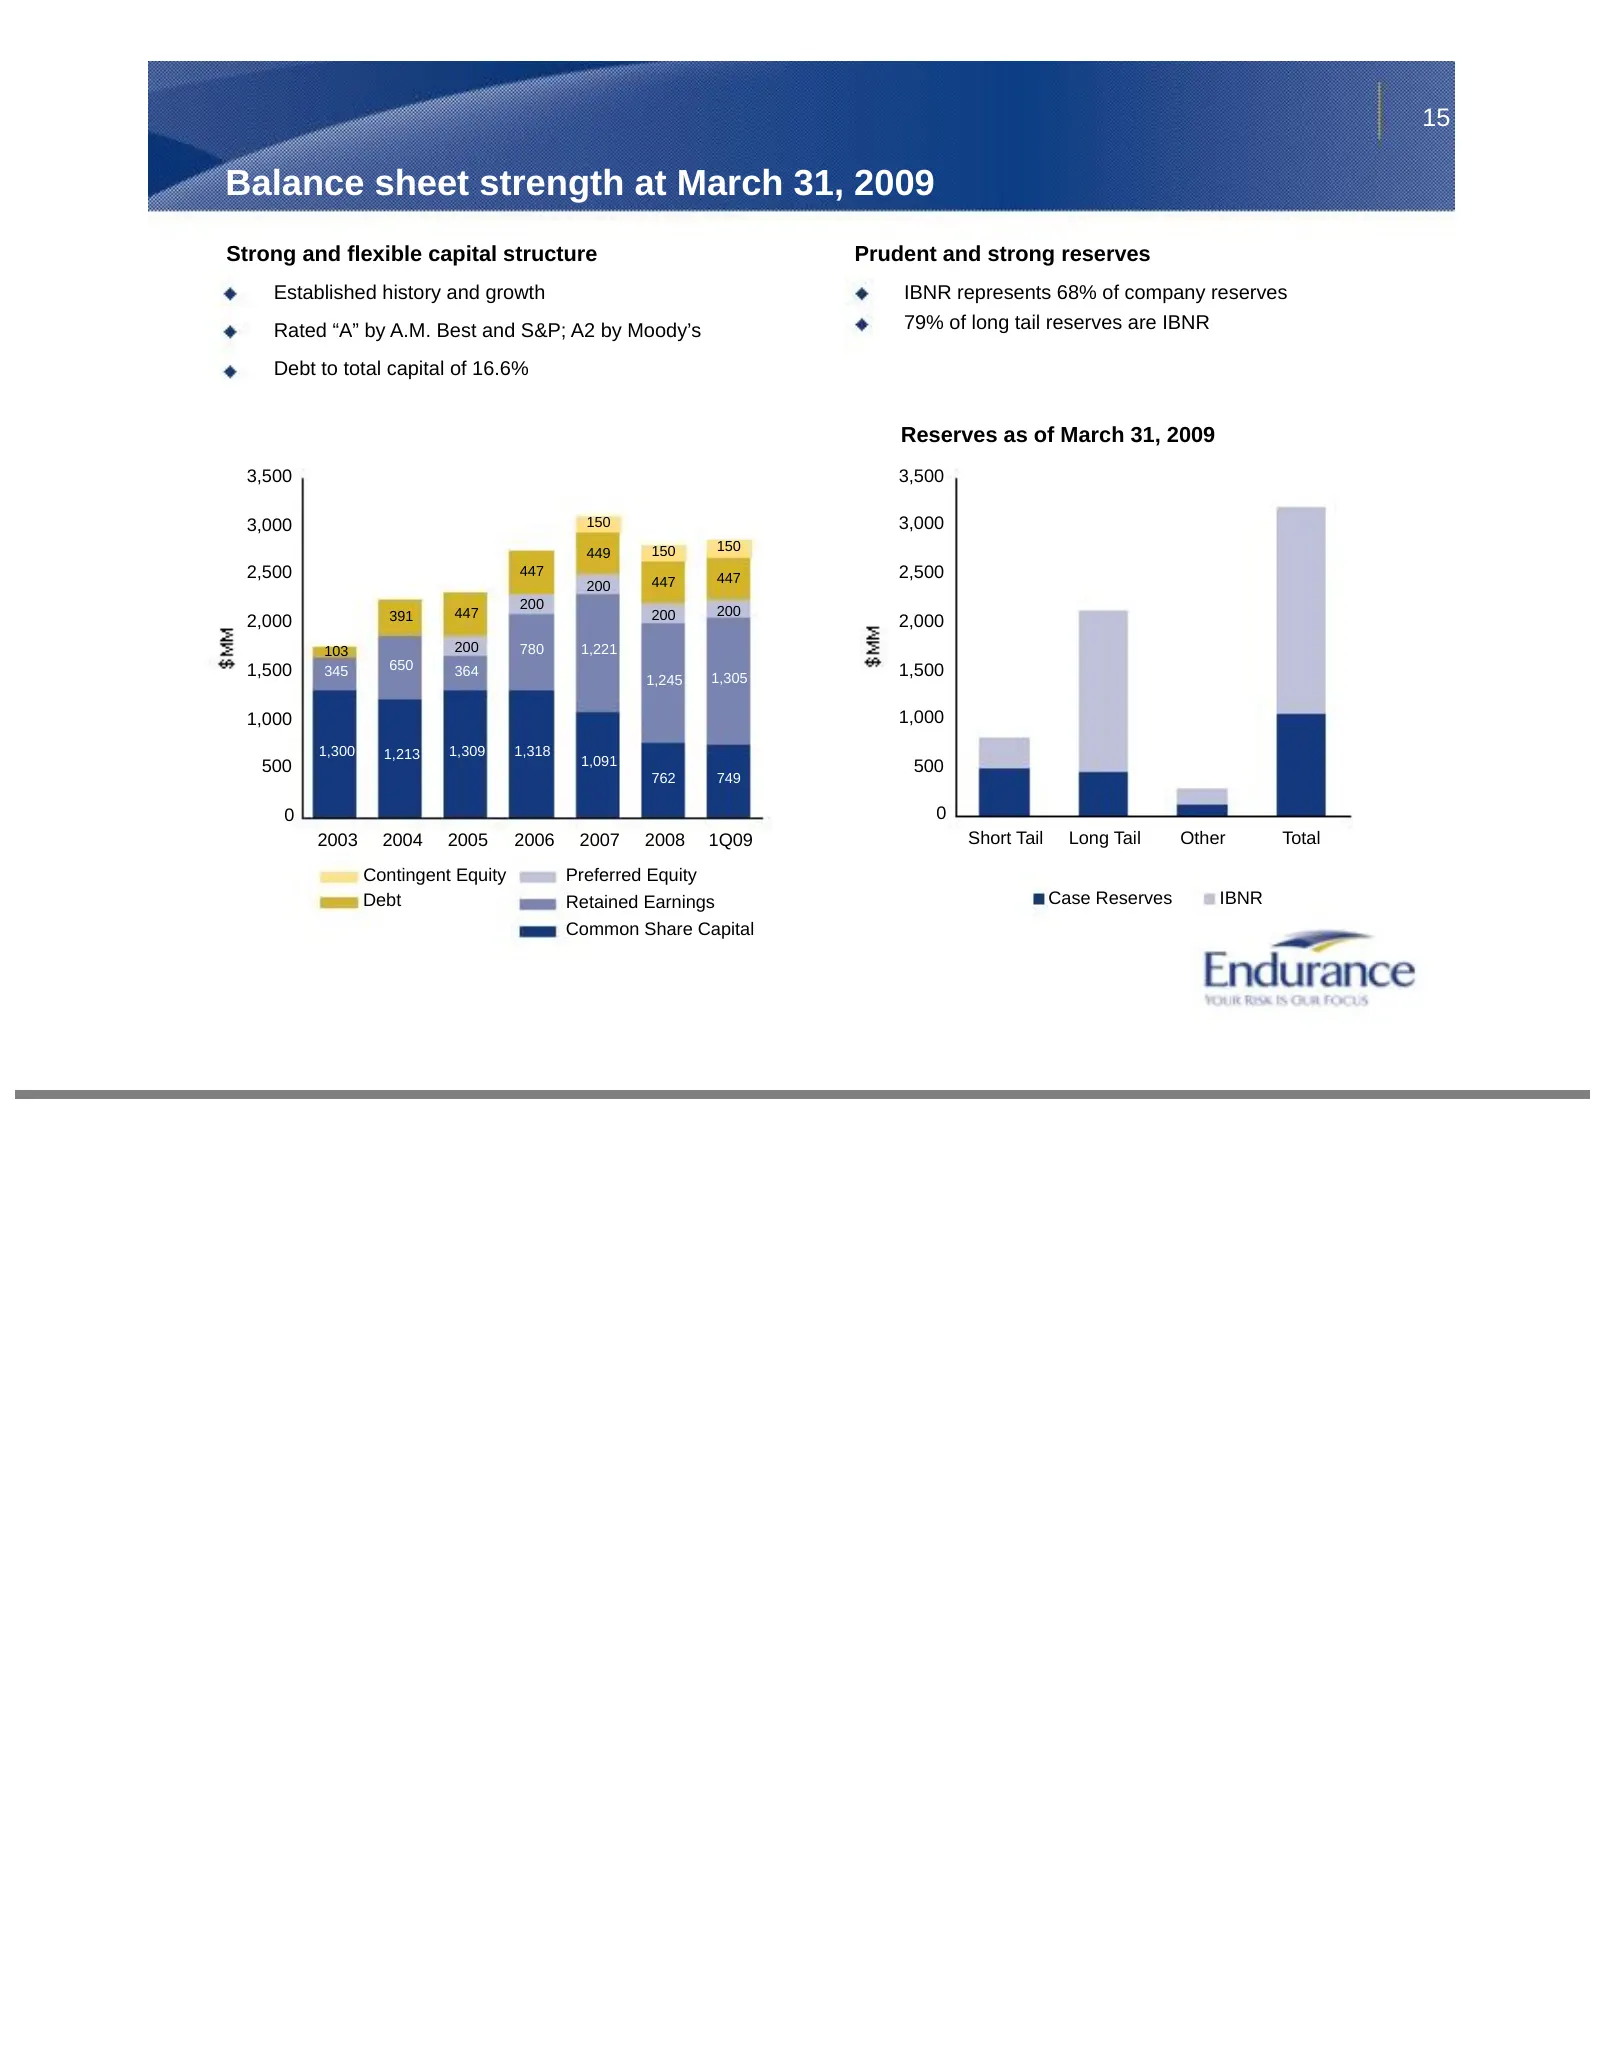
Slide 15: Balance sheet strength at March 31, 2009
15 Balance sheet strength at March 31, 2009 Strong and flexible capital structure Prudent and strong reserves Established history and growth IBNR represents 68% of company reserves Rated “A” by A.M. Best and S&P; A2 by Moody’s 79% of long tail reserves are IBNR Debt to total capital of 16.6% Reserve
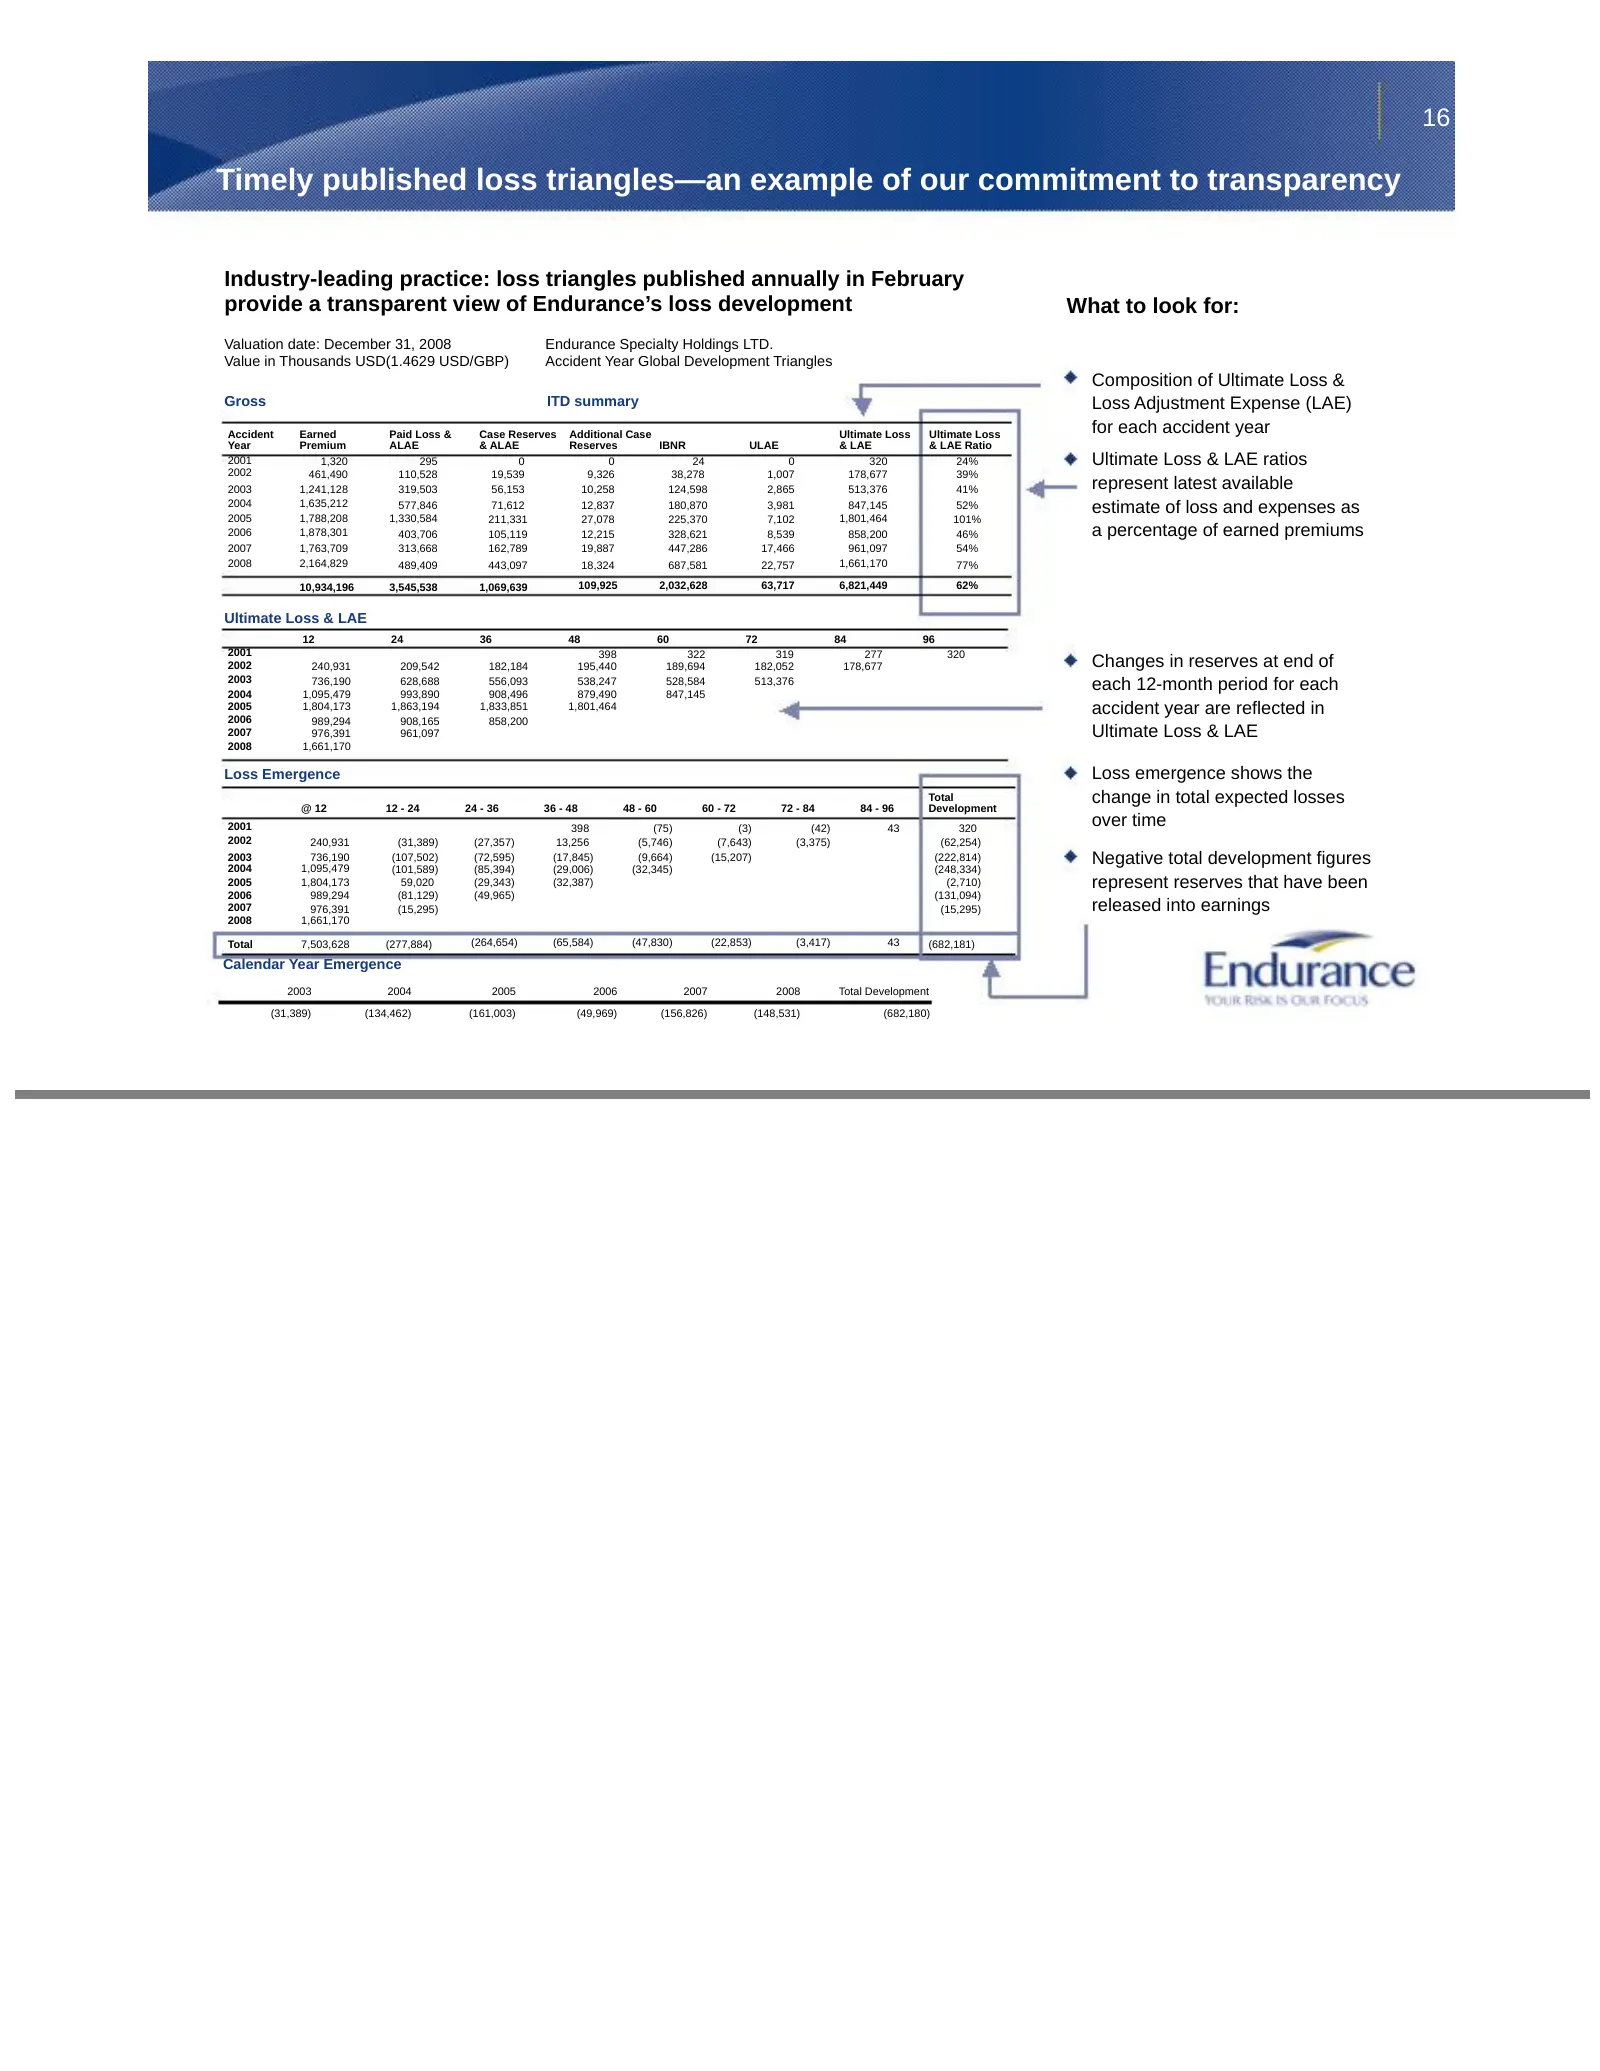
Slide 16: Timely published loss triangles—an example of our commitment to transparency
16 Timely published loss triangles—an example of our commitment to transparency Industry-leading practice: loss triangles published annually in February provide a transparent view of Endurance’s loss development What to look for: Valuation date: December 31, 2008 Endurance Specialty Holdings LTD. Va
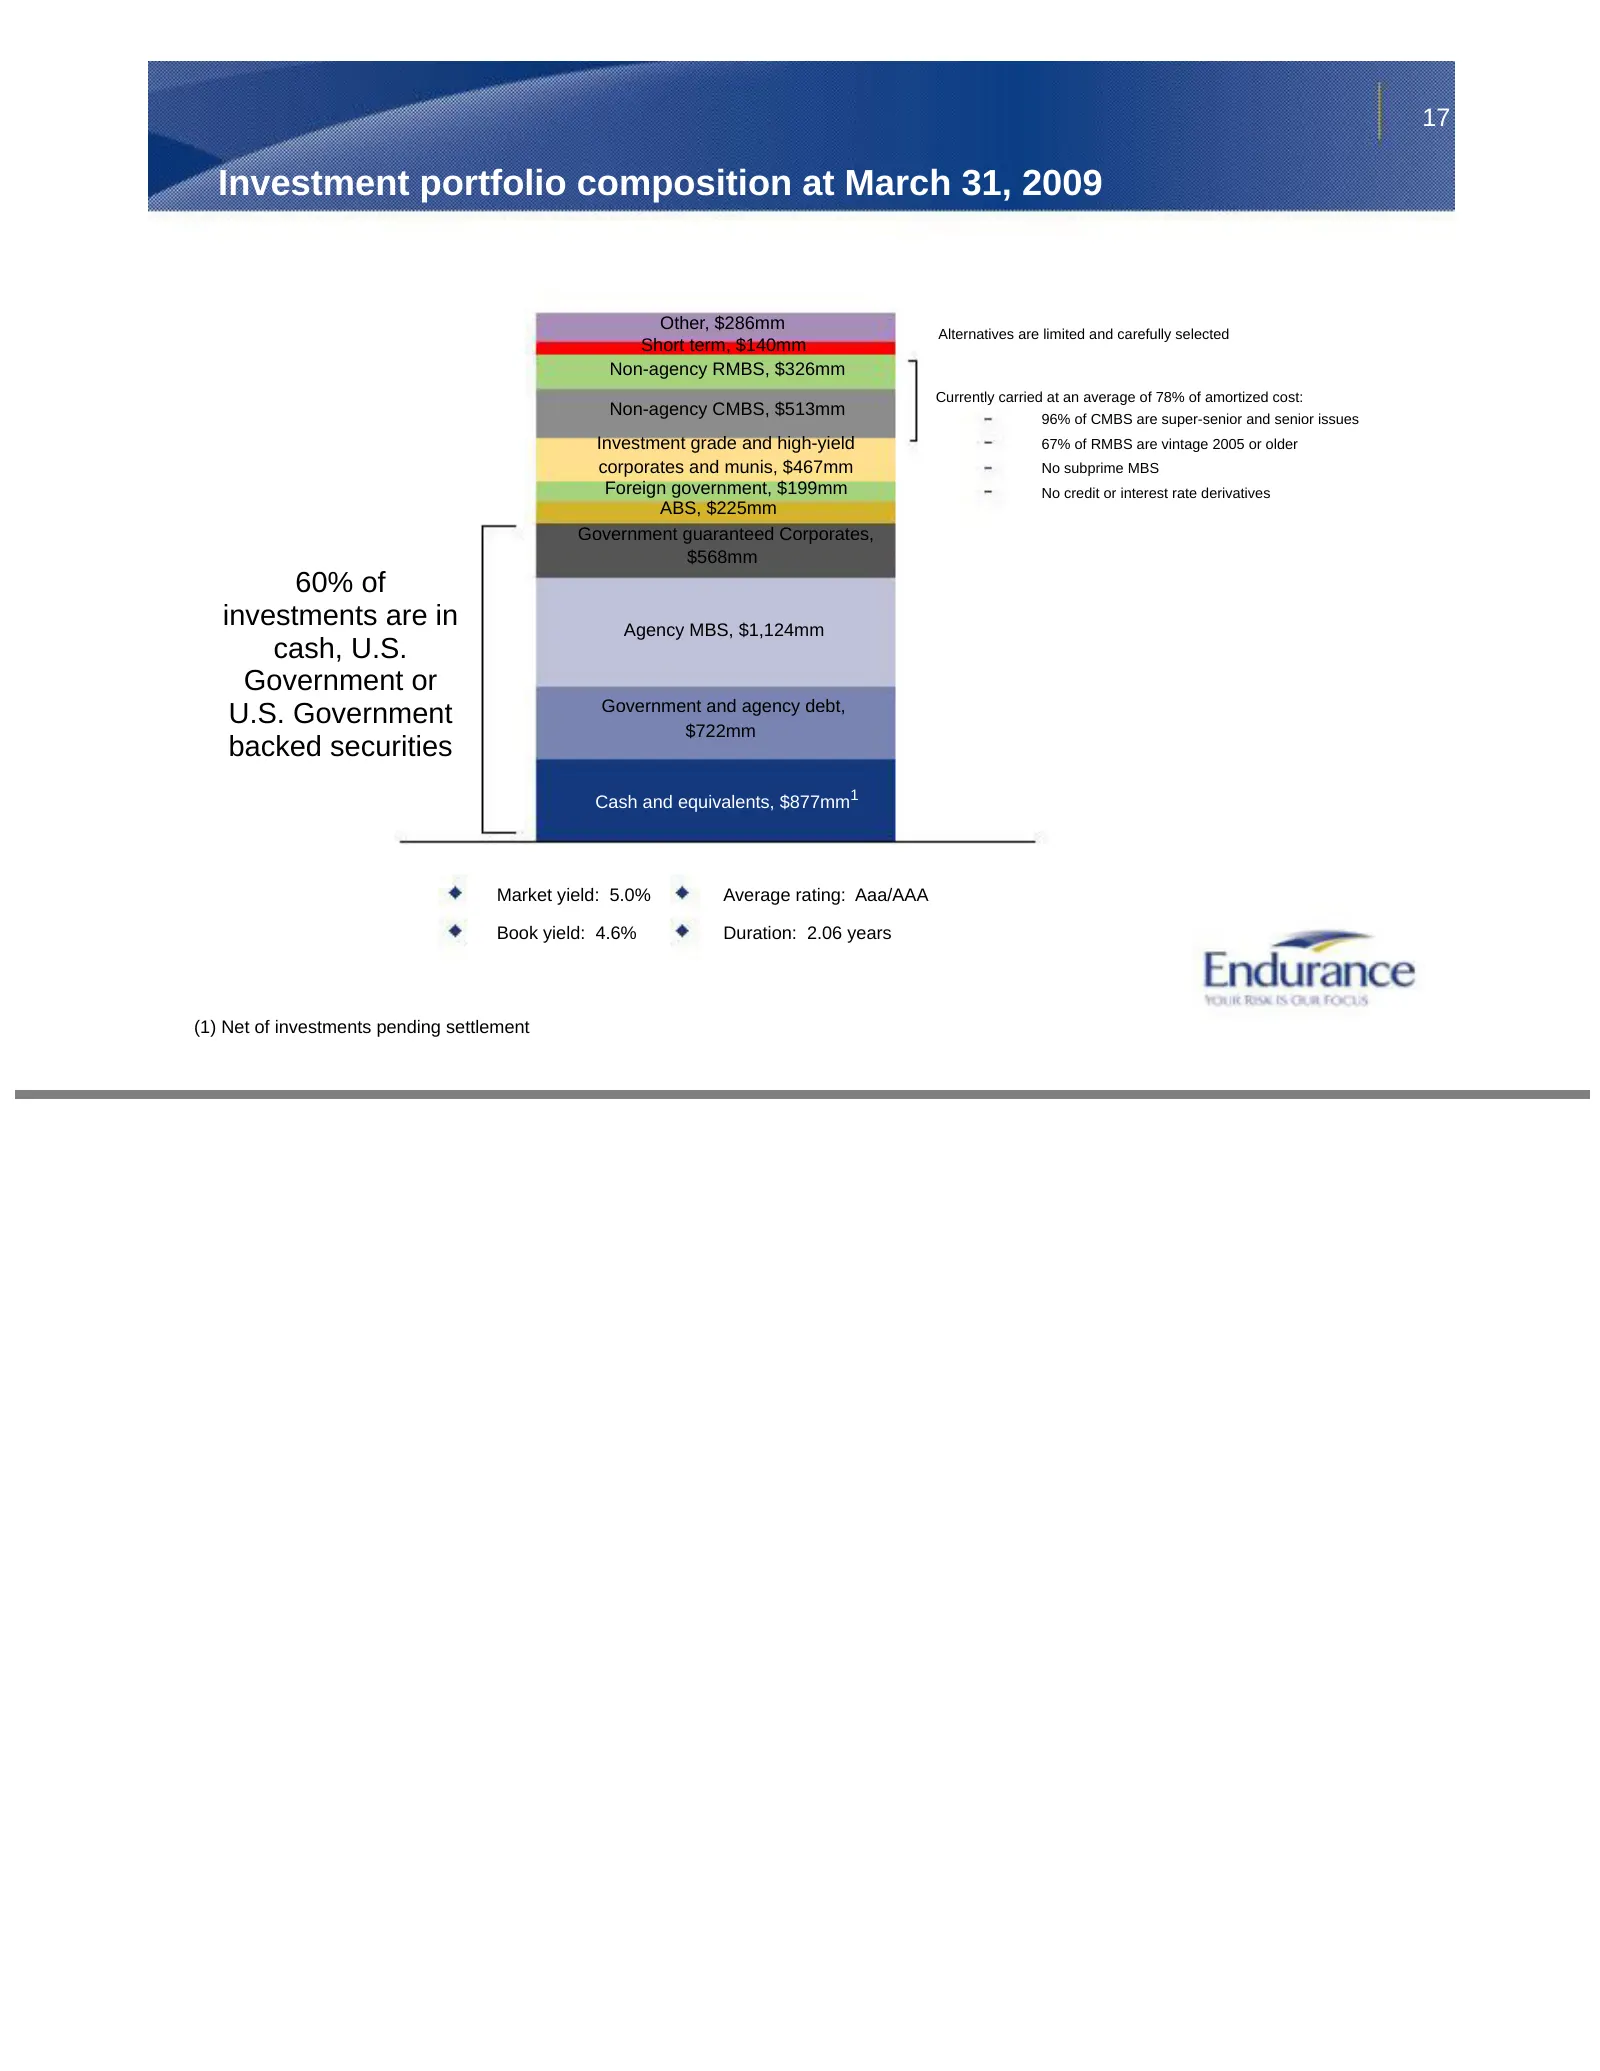
Slide 17: Investment portfolio composition at March 31, 2009
17 Investment portfolio composition at March 31, 2009 Other, $286mm Alternatives are limited and carefully selected Short term, $140mm Non-agency RMBS, $326mm Currently carried at an average of 78% of amortized cost: Non-agency CMBS, $513mm 96% of CMBS are super-senior and senior issues Investment g
Slide 18: Senior non-agency RMBS portfolio as of 3/31/09
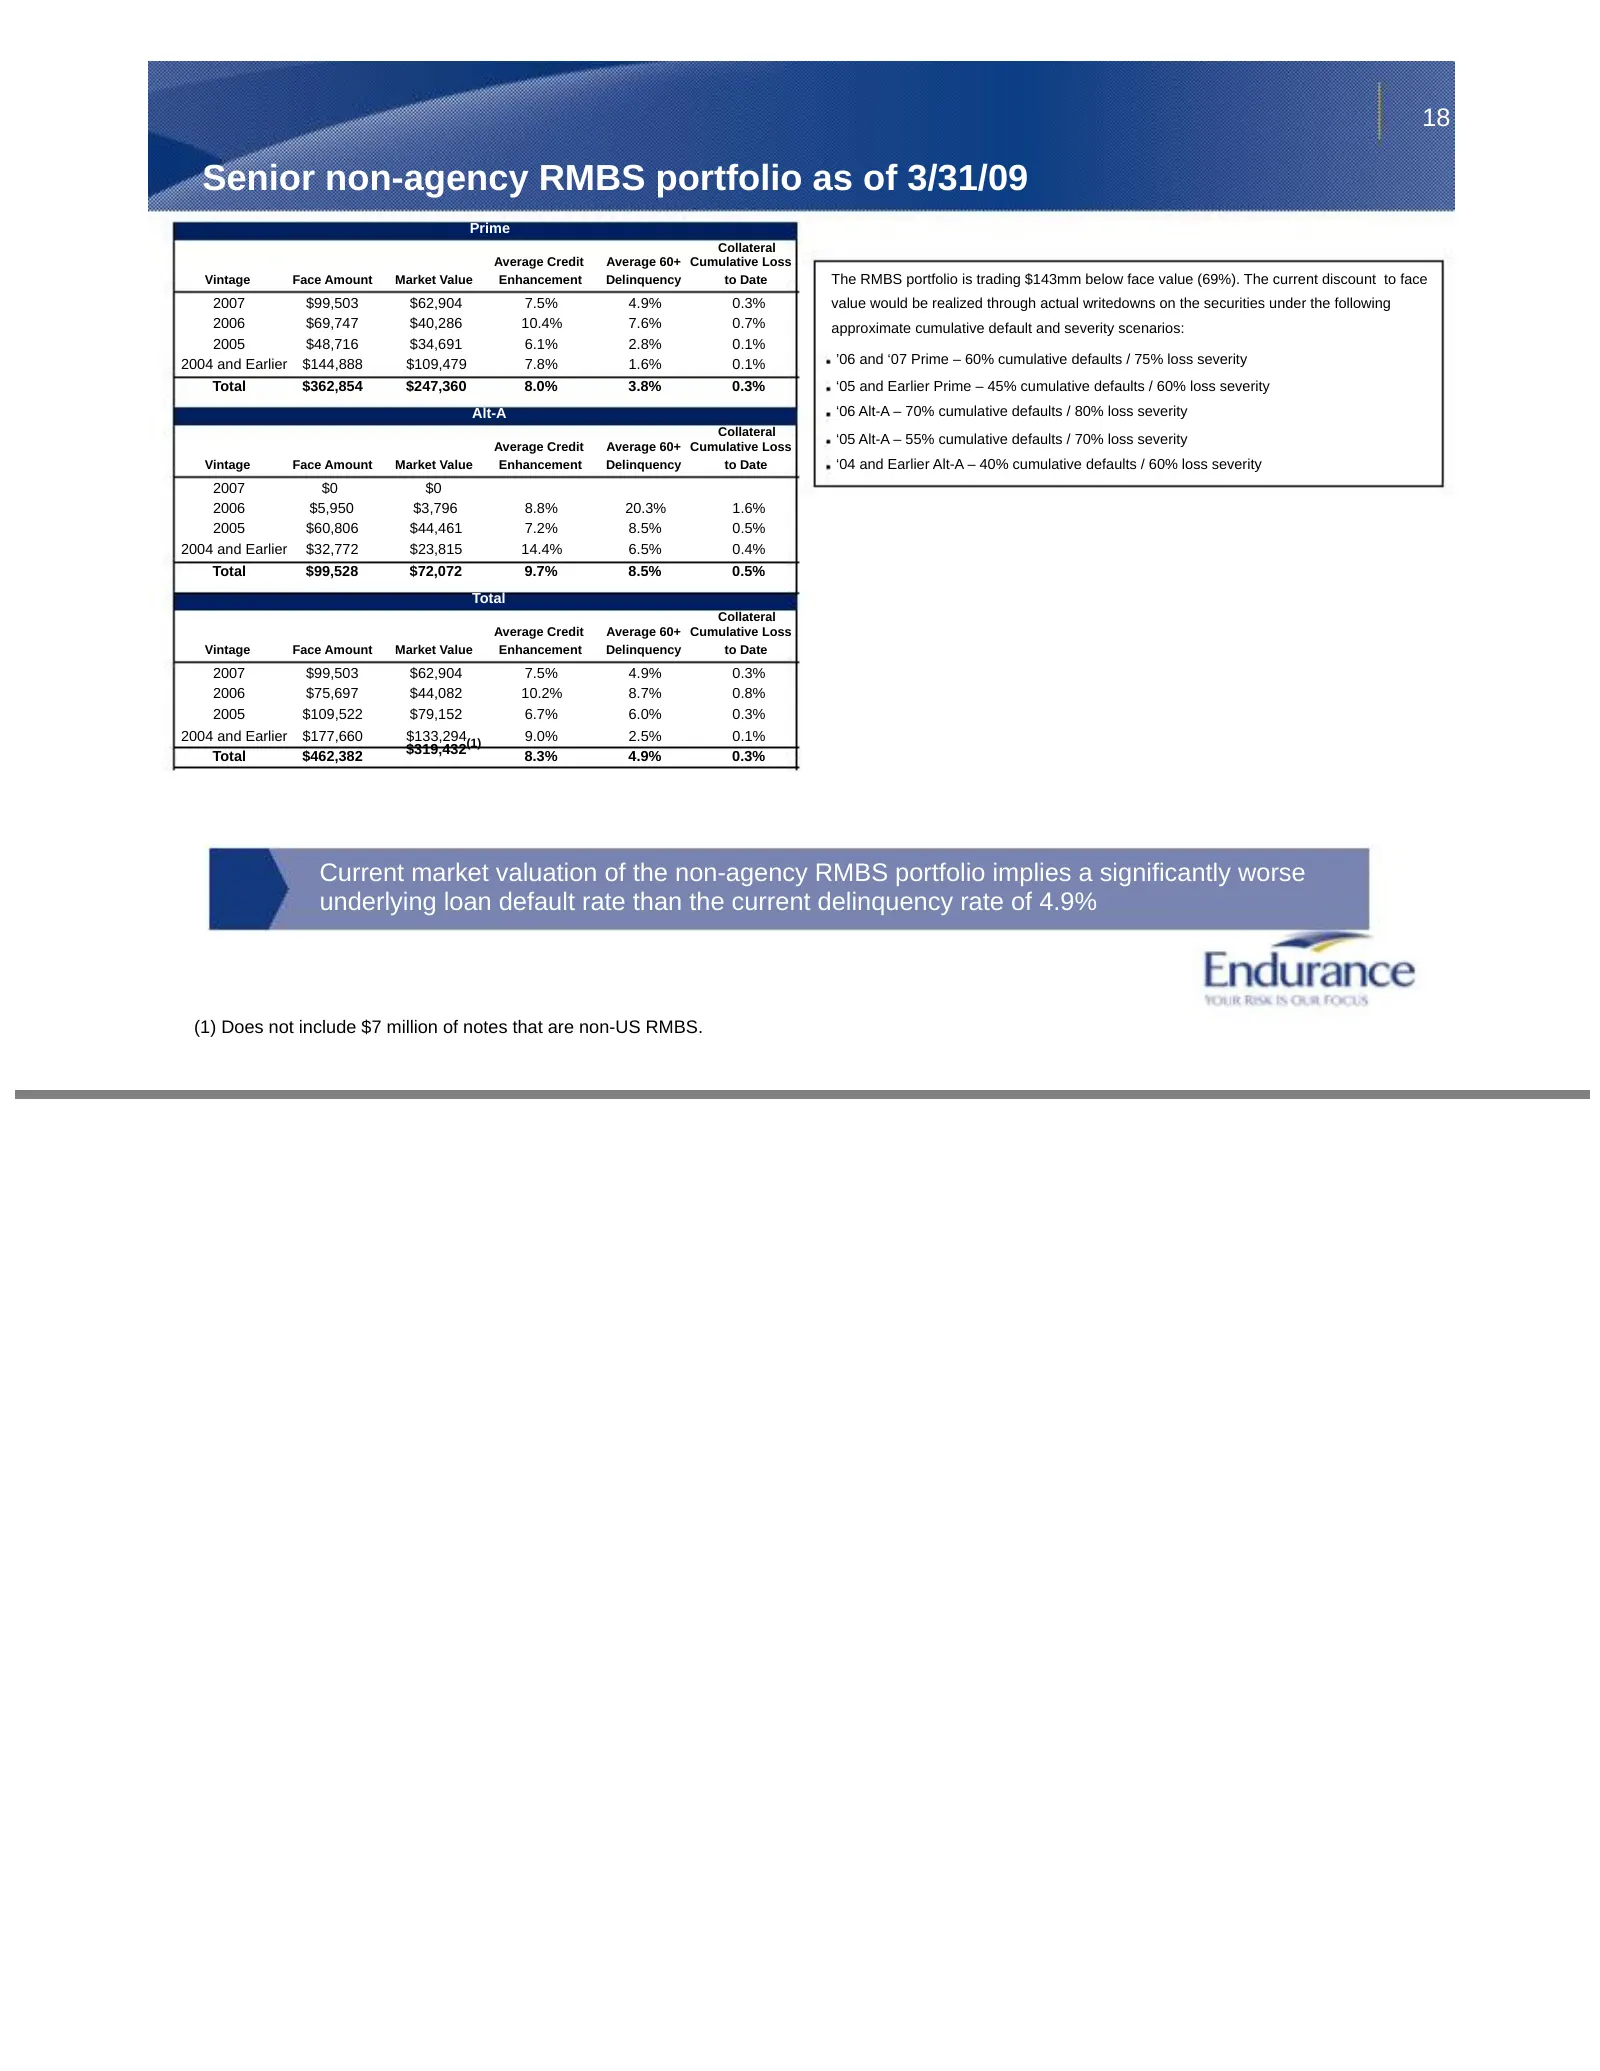
18 Senior non-agency RMBS portfolio as of 3/31/09 Prime Collateral Average Credit Average 60+ Cumulative Loss Vintage Face Amount Market Value Enhancement Delinquency to Date The RMBS portfolio is trading $143mm below face value (69%). The current discount to face 2007 $99,503 $62,904 7.5% 4.9% 0.3%
Slide 19: Senior non-agency CMBS portfolio as of 3/31/09
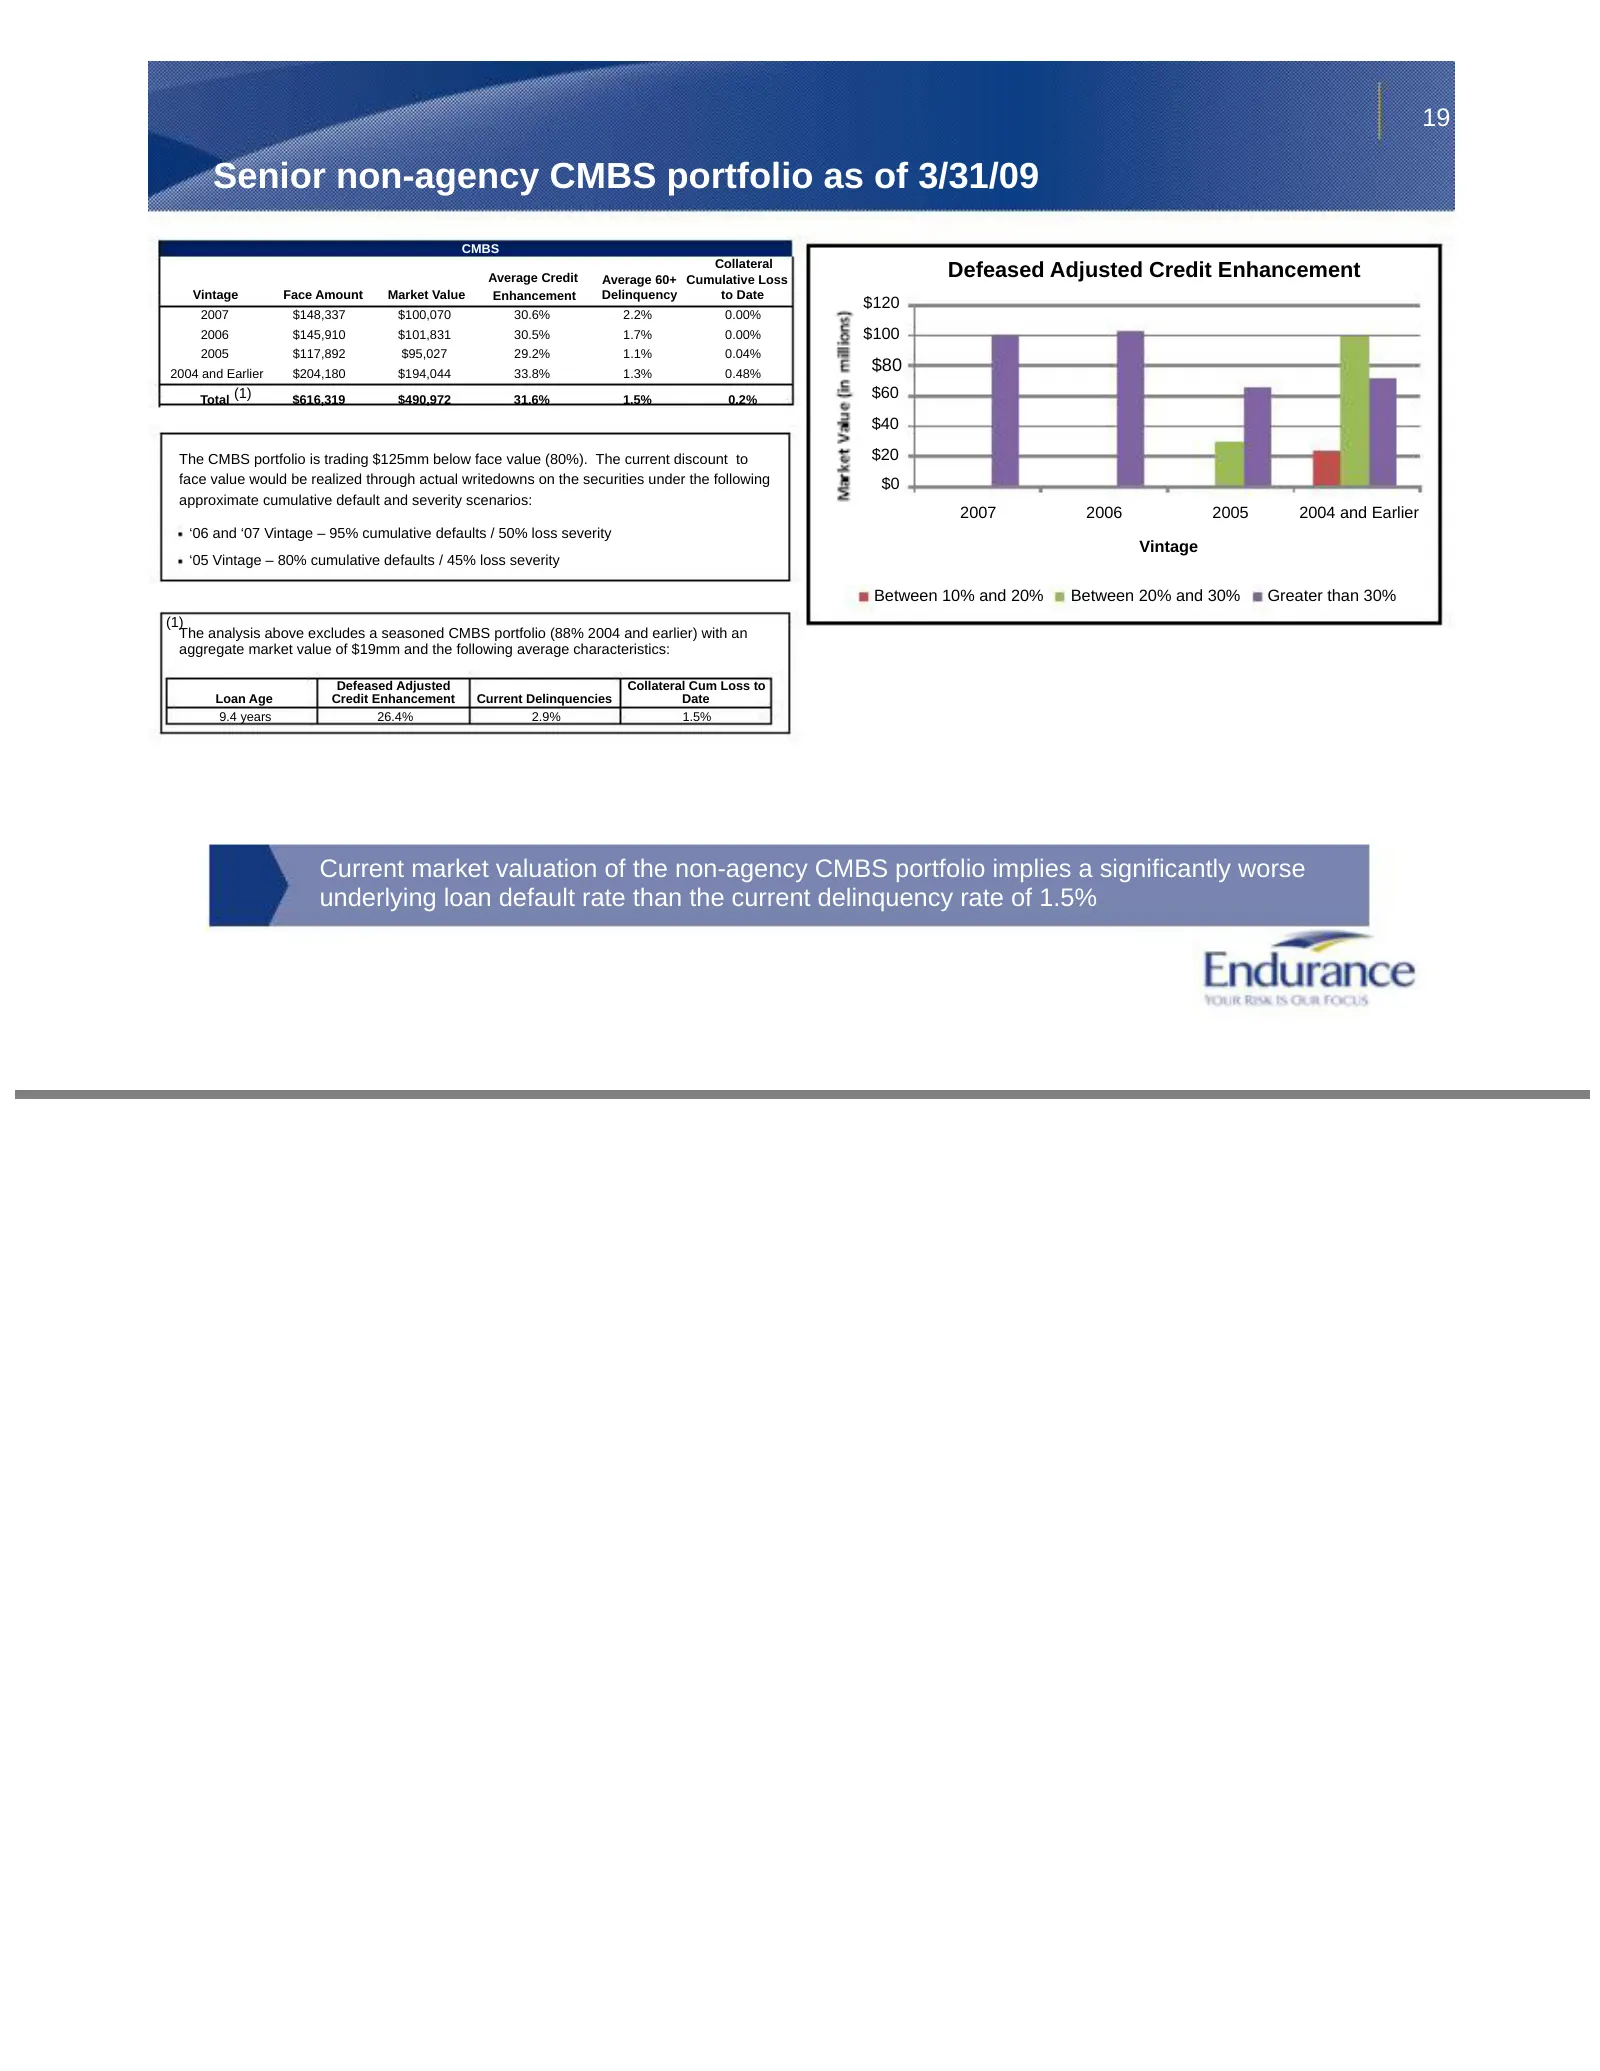
19 Senior non-agency CMBS portfolio as of 3/31/09 CMBS Collateral Average Credit Average 60+ Cumulative Loss Defeased Adjusted Credit Enhancement Vintage Face Amount Market Value Enhancement Delinquency to Date $120 2007 $148,337 $100,070 30.6% 2.2% 0.00% 2006 $145,910 $101,831 30.5% 1.7% 0.00% $100
Slide 20: Conclusion
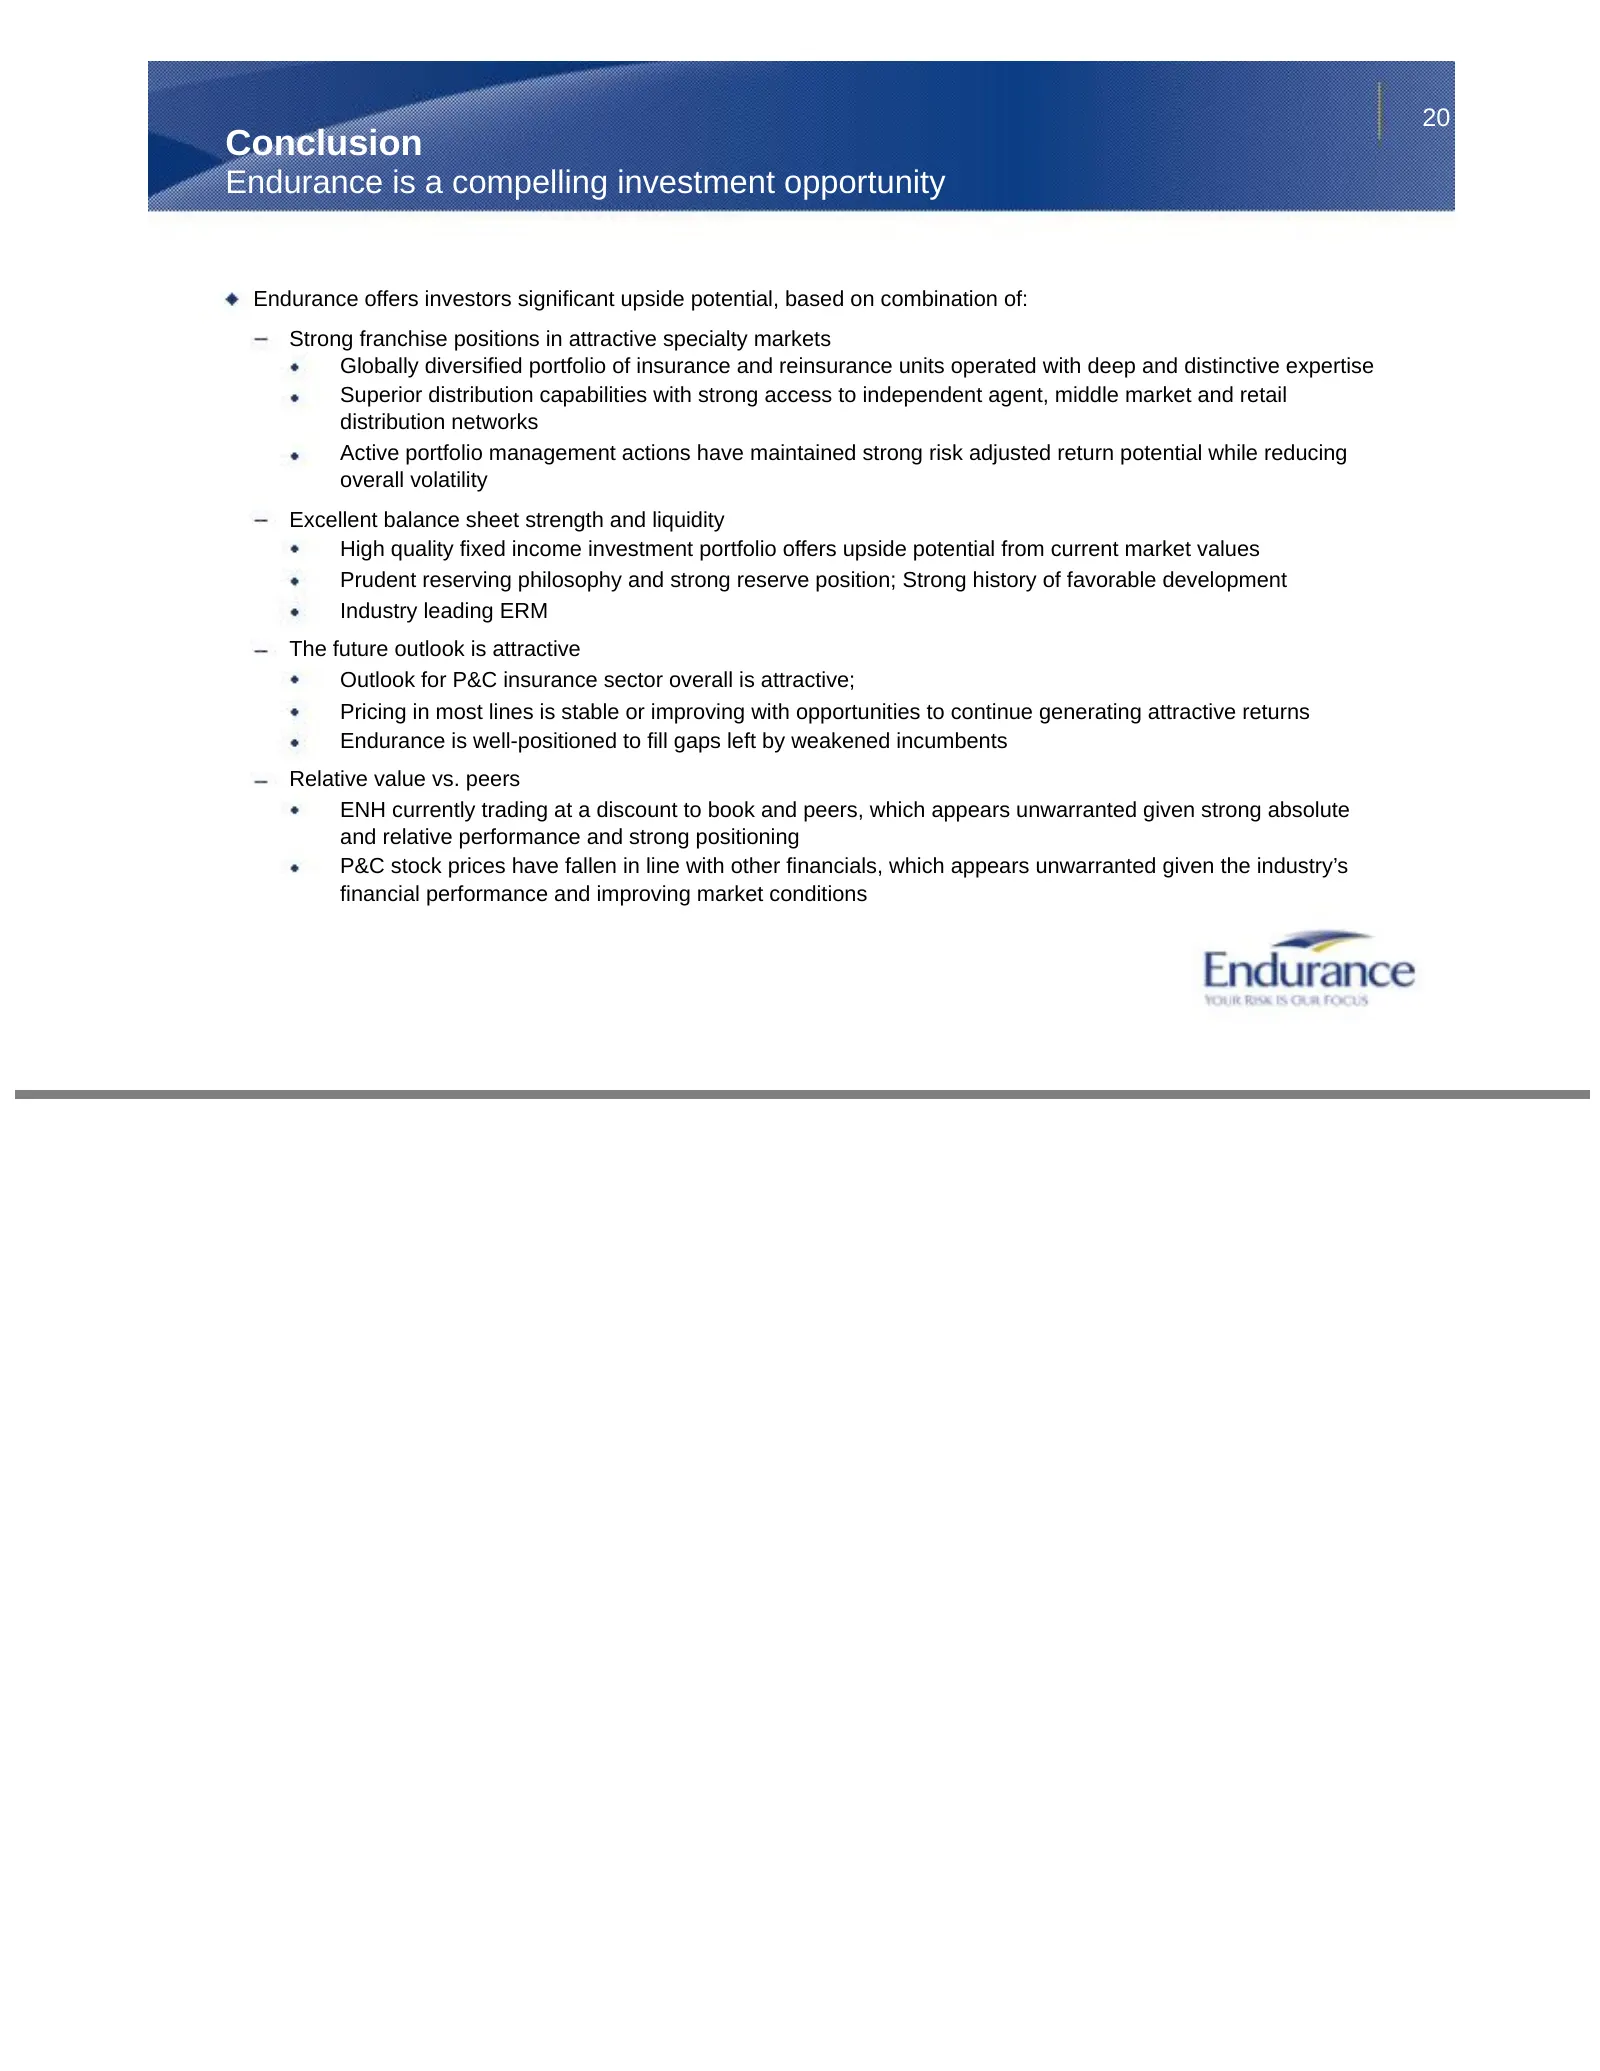
20 Conclusion Endurance is a compelling investment opportunity Endurance offers investors significant upside potential, based on combination of: Strong franchise positions in attractive specialty markets Globally diversified portfolio of insurance and reinsurance units operated with deep and distinc

Slide 21: Appendix
Appendix ee Endurance
Slide 22: Growth through specialization: track record of entering new businesses
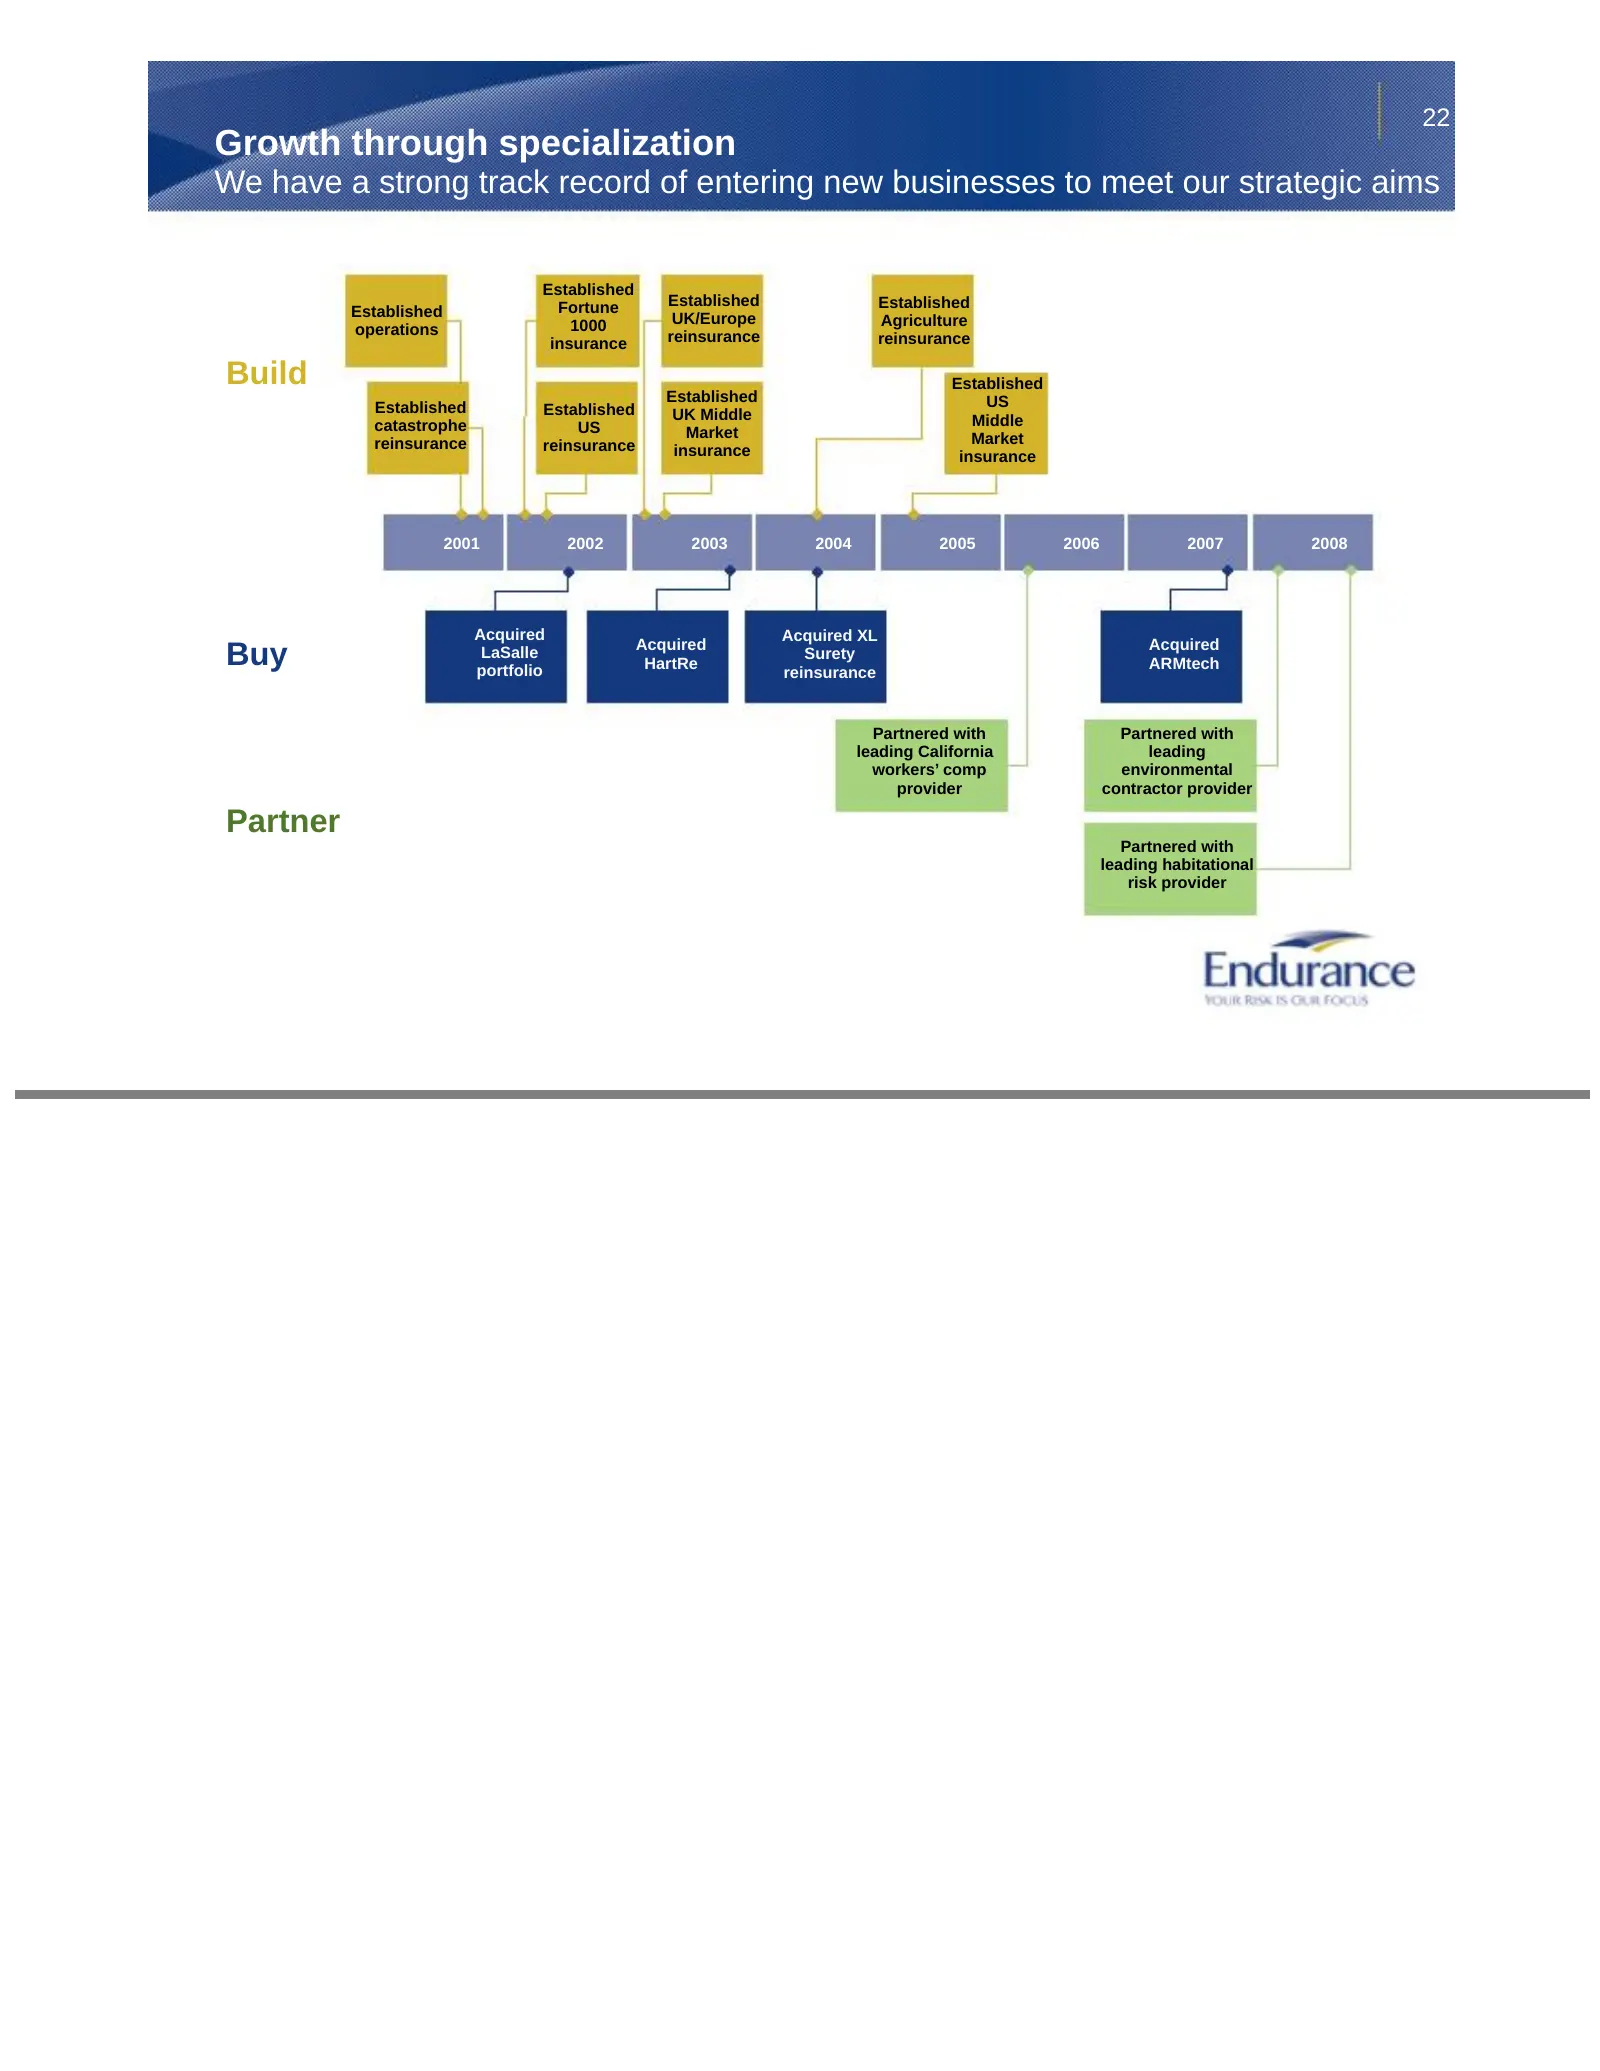
22 Growth through specialization We have a strong track record of entering new businesses to meet our strategic aims Established Fortune Established Established Established UK/Europe 1000 Agriculture operations reinsurance insurance reinsurance Build Established Established US Established Establishe
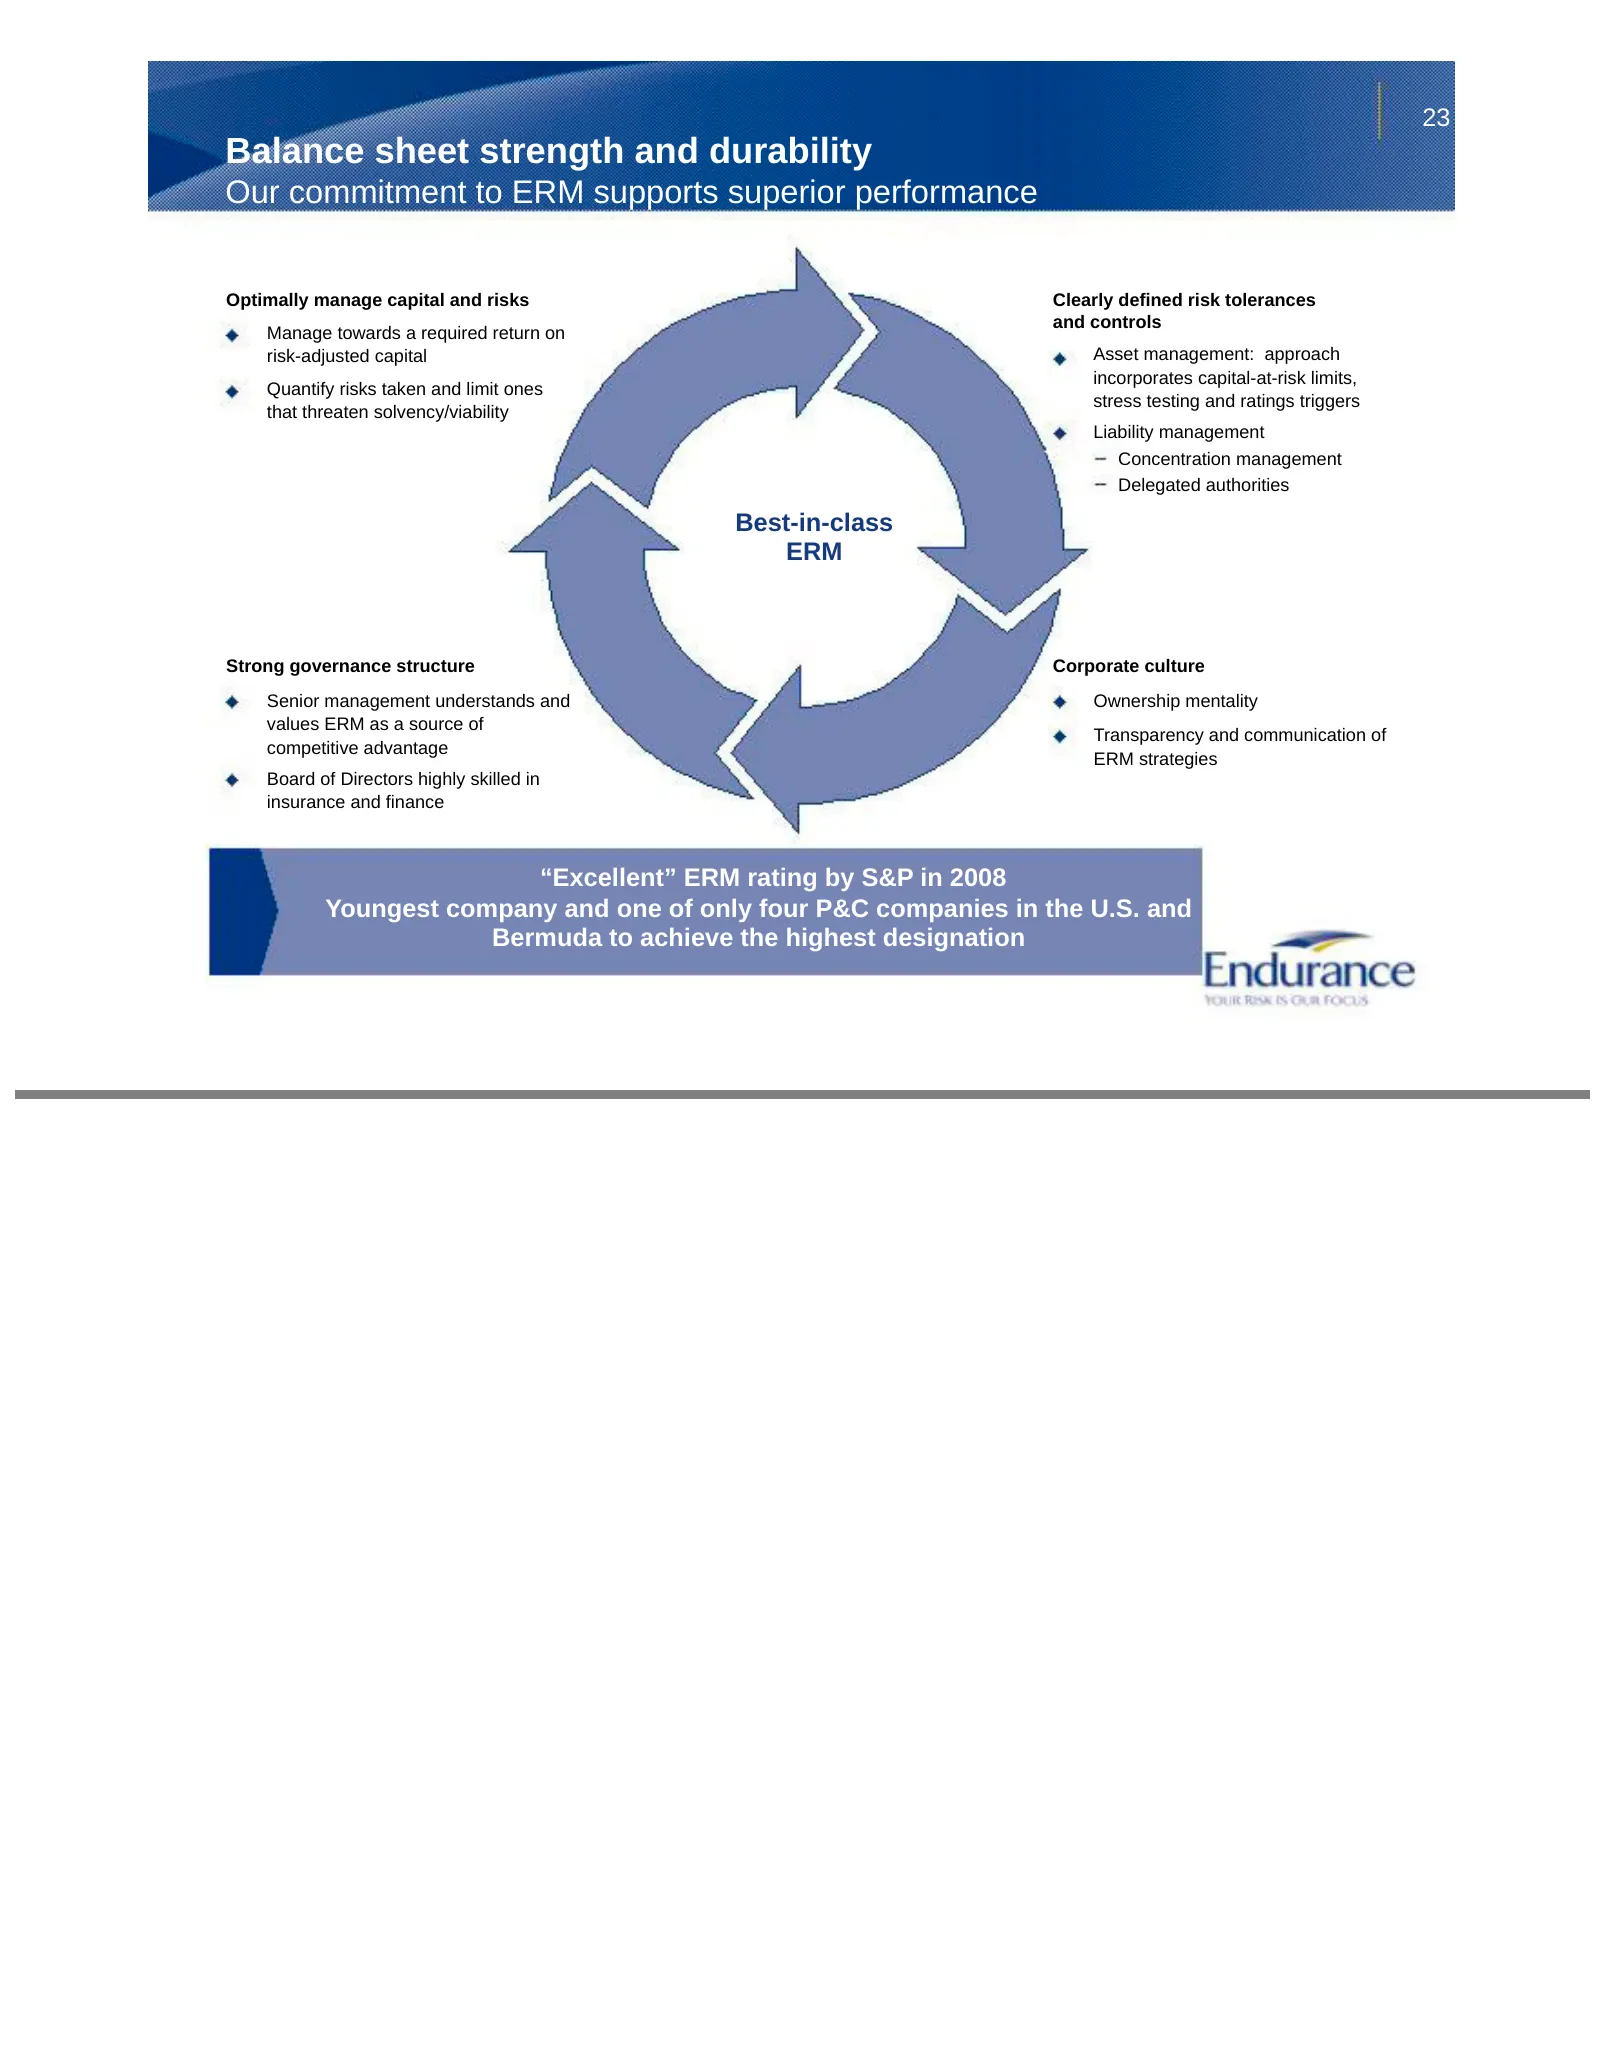
Slide 23: Balance sheet strength and durability
23 Balance sheet strength and durability Our commitment to ERM supports superior performance Optimally manage capital and risks Clearly defined risk tolerances and controls Manage towards a required return on risk-adjusted capital Asset management: approach incorporates capital-at-risk limits, Quant
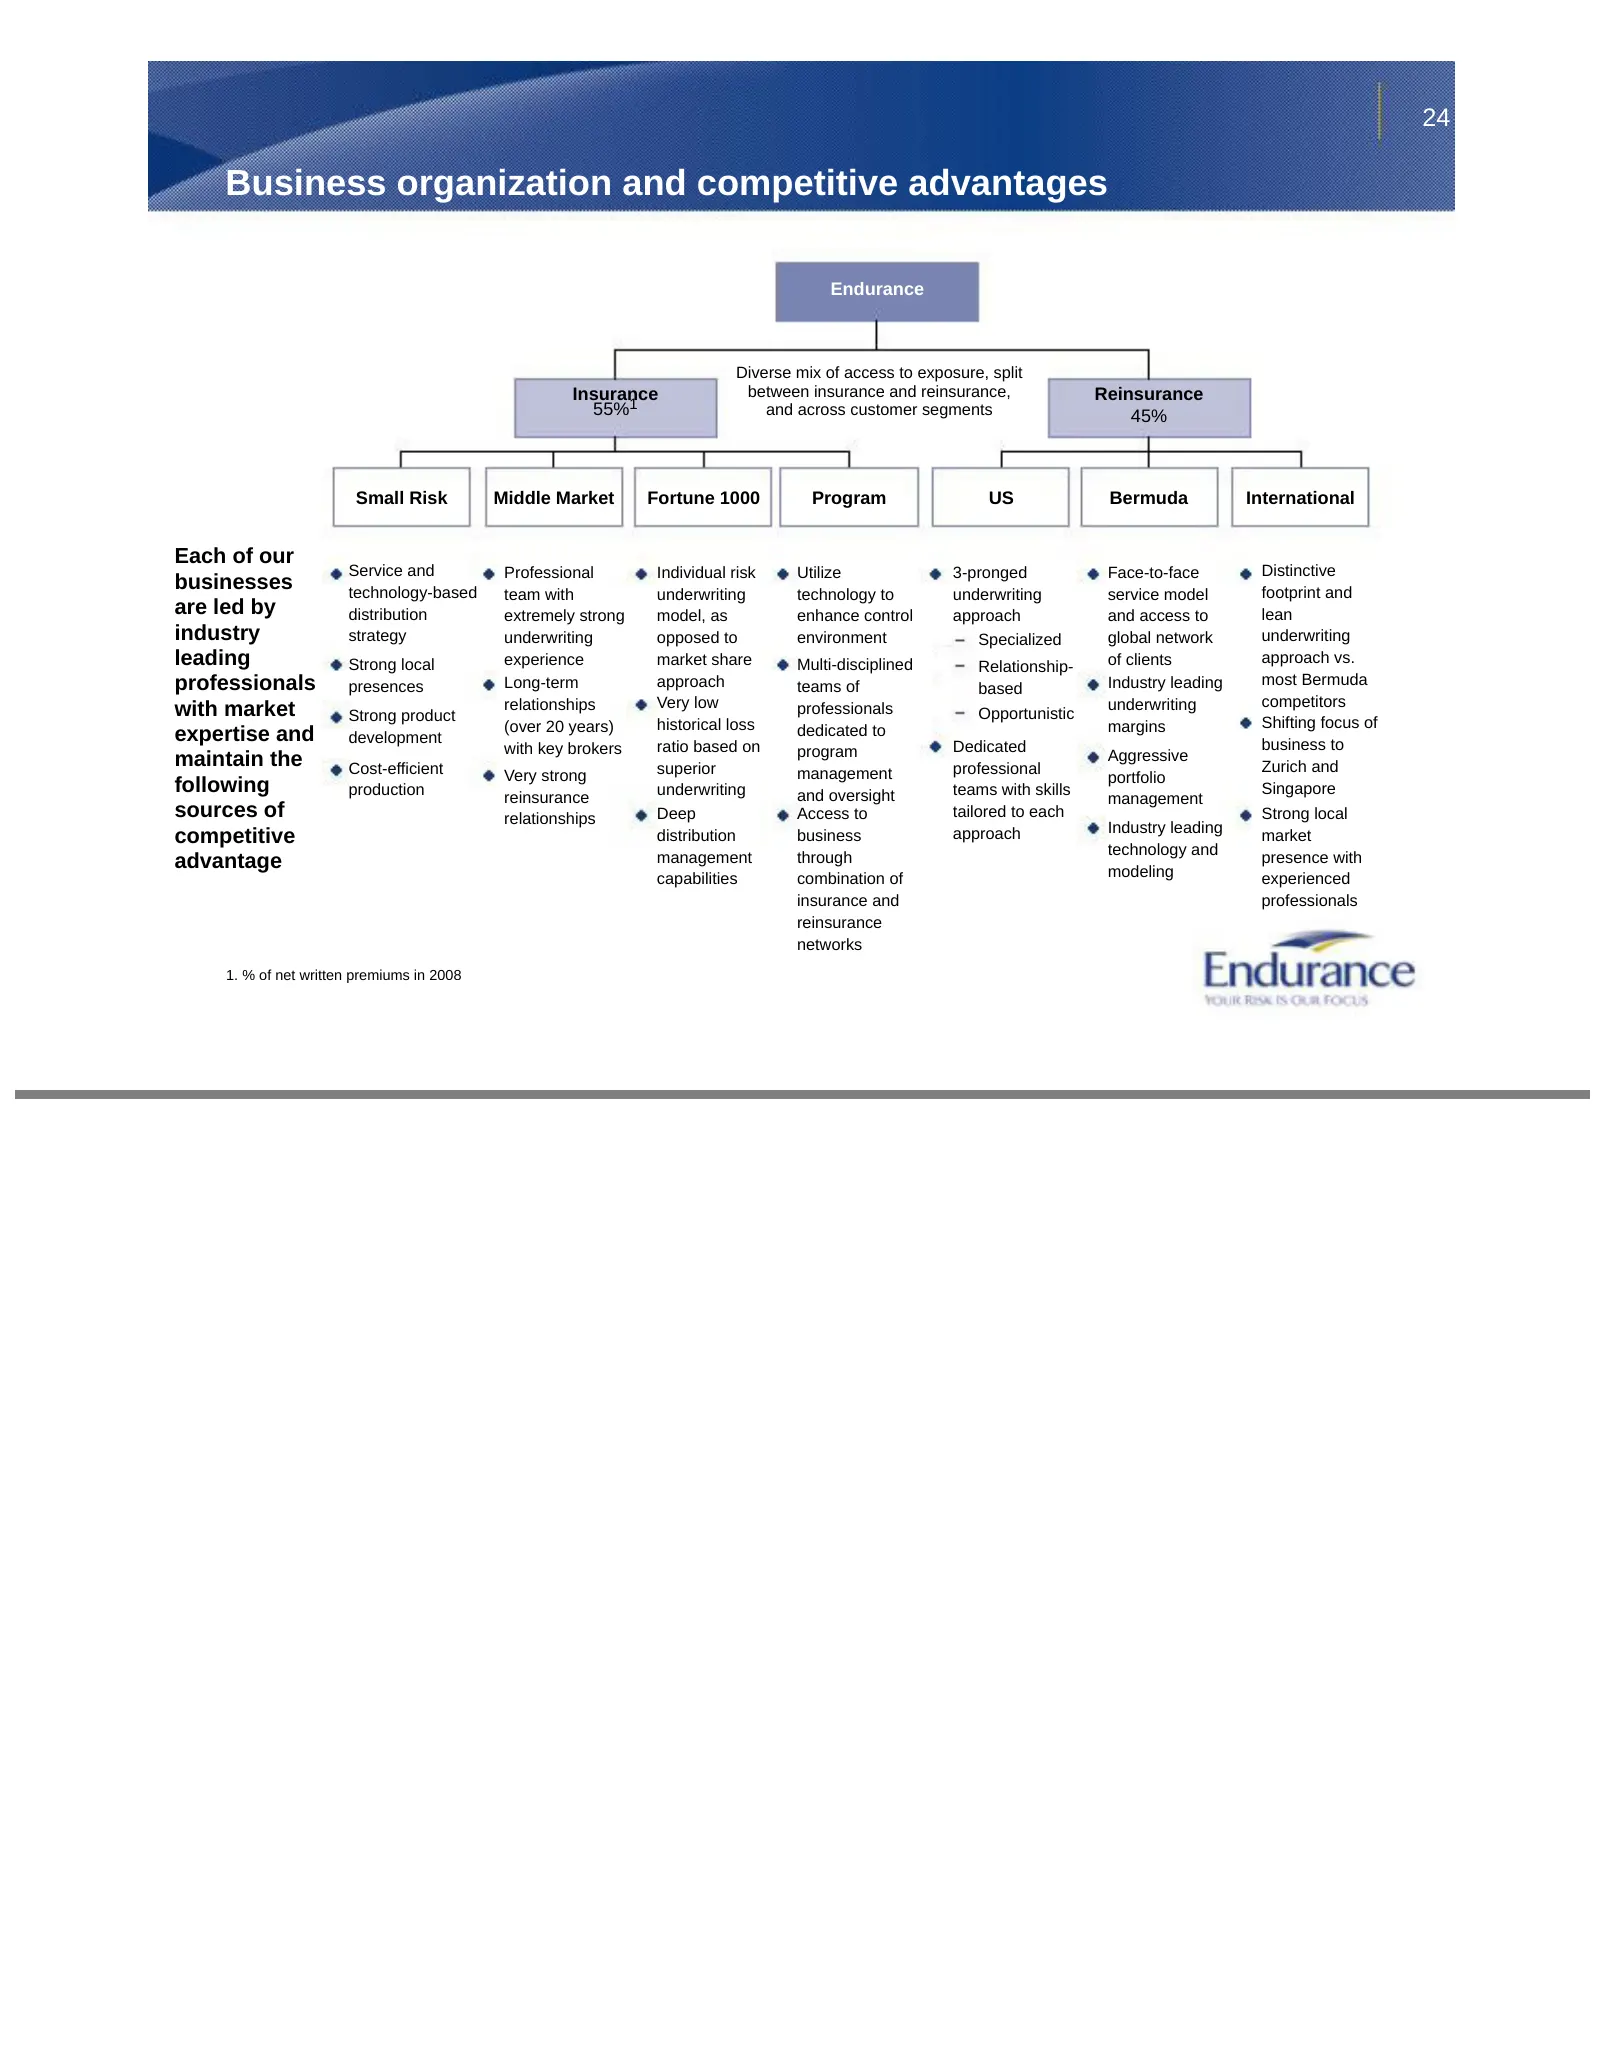
Slide 24: Business organization and competitive advantages
24 Business organization and competitive advantages Endurance Diverse mix of access to exposure, split Insurance between insurance and reinsurance, Reinsurance 55%1 and across customer segments 45% Small Risk Middle Market Fortune 1000 Program US Bermuda International Each of our Service and Profess
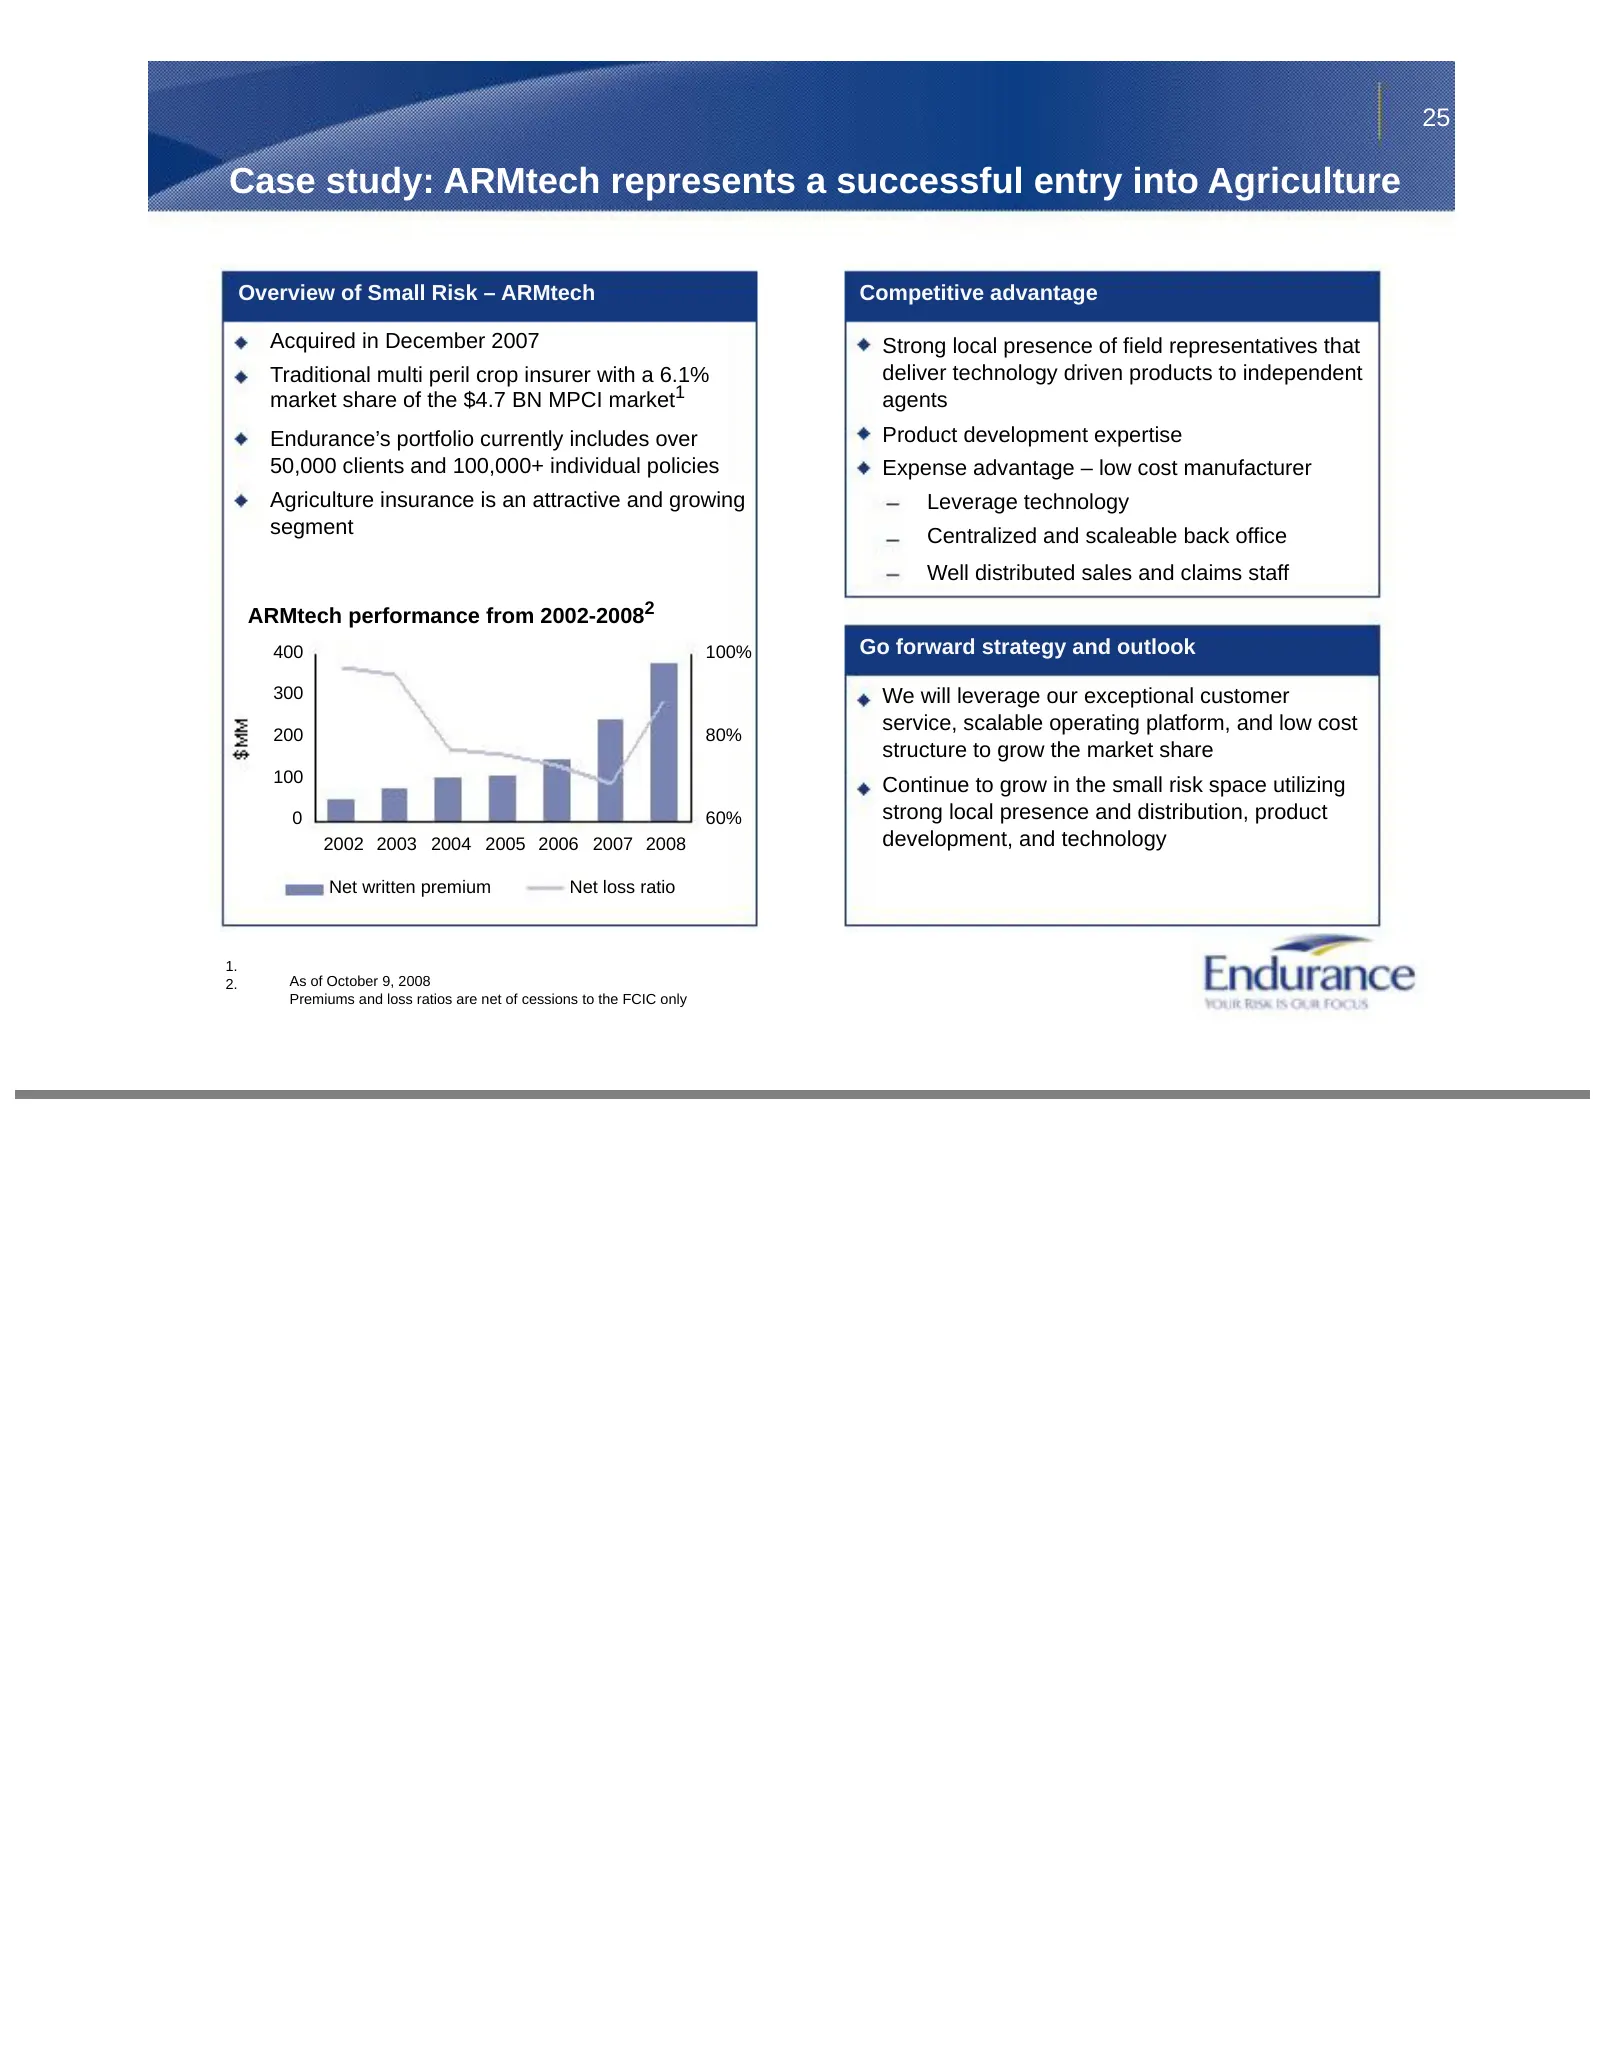
Slide 25: Case study: ARMtech represents a successful entry into Agriculture
25 Case study: ARMtech represents a successful entry into Agriculture Overview of Small Risk – ARMtech Competitive advantage Acquired in December 2007 Strong local presence of field representatives that Traditional multi peril crop insurer with a 6.1% deliver technology driven products to independen
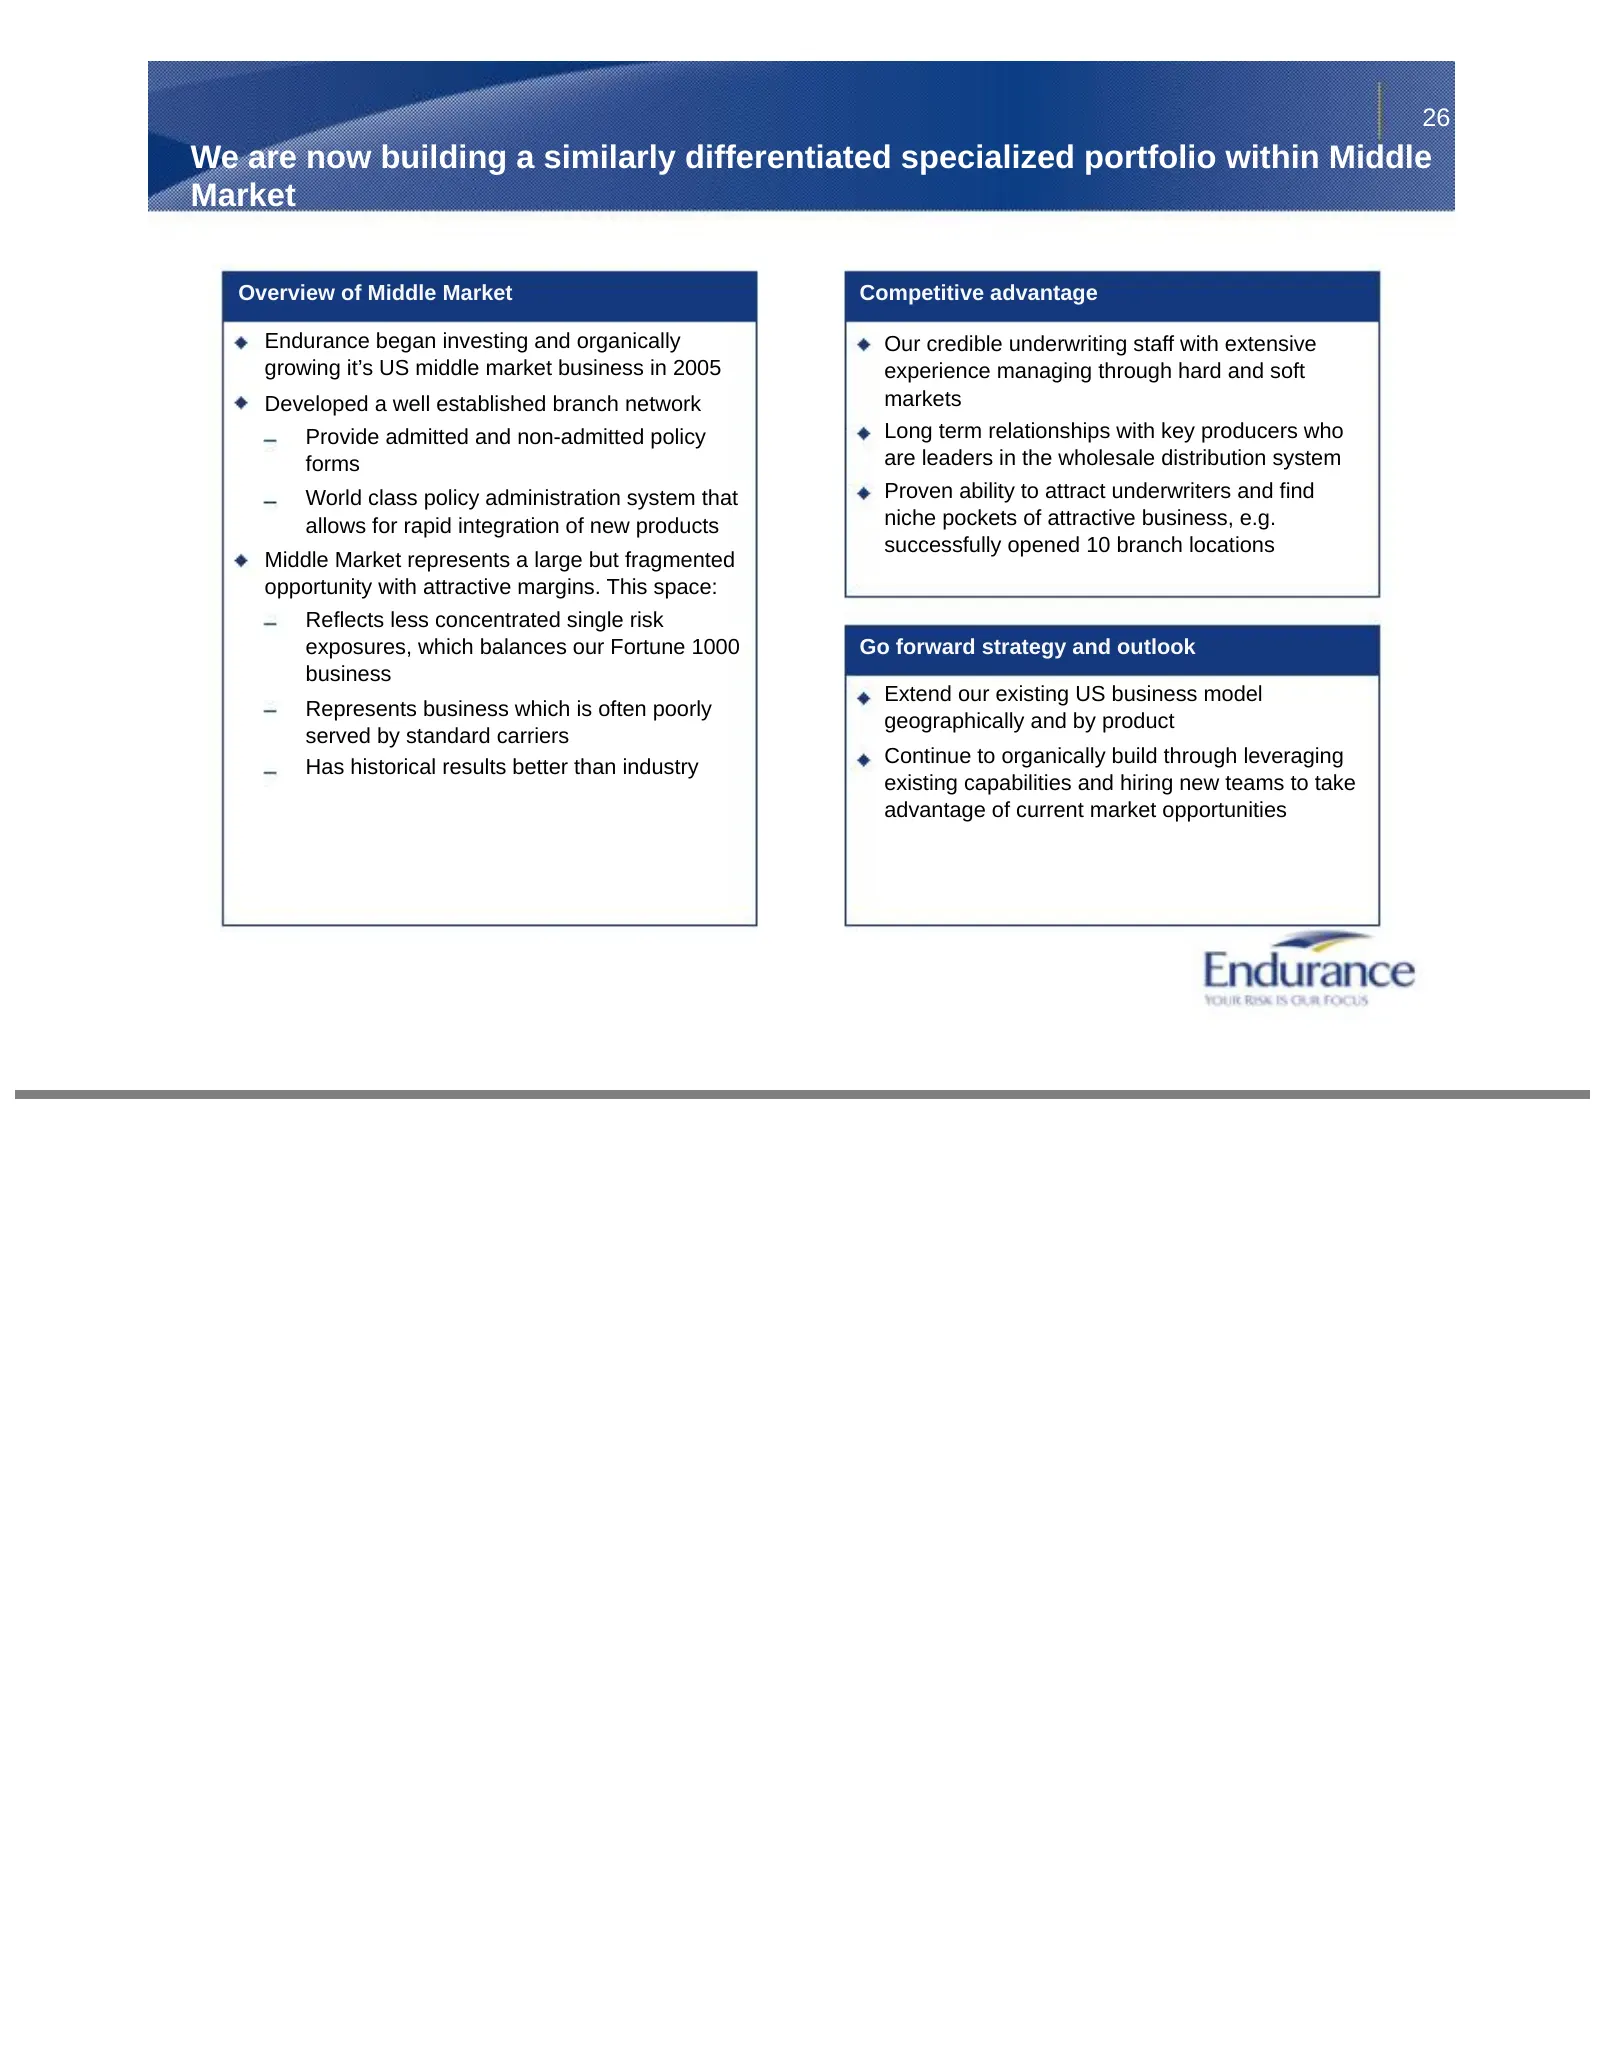
Slide 26: Building a differentiated specialized portfolio within Middle Market
26 We are now building a similarly differentiated specialized portfolio within Middle Market Overview of Middle Market Competitive advantage Endurance began investing and organically Our credible underwriting staff with extensive growing it’s US middle market business in 2005 experience managing thr
Slide 27: Case study: Strong performance in Bermuda Cat
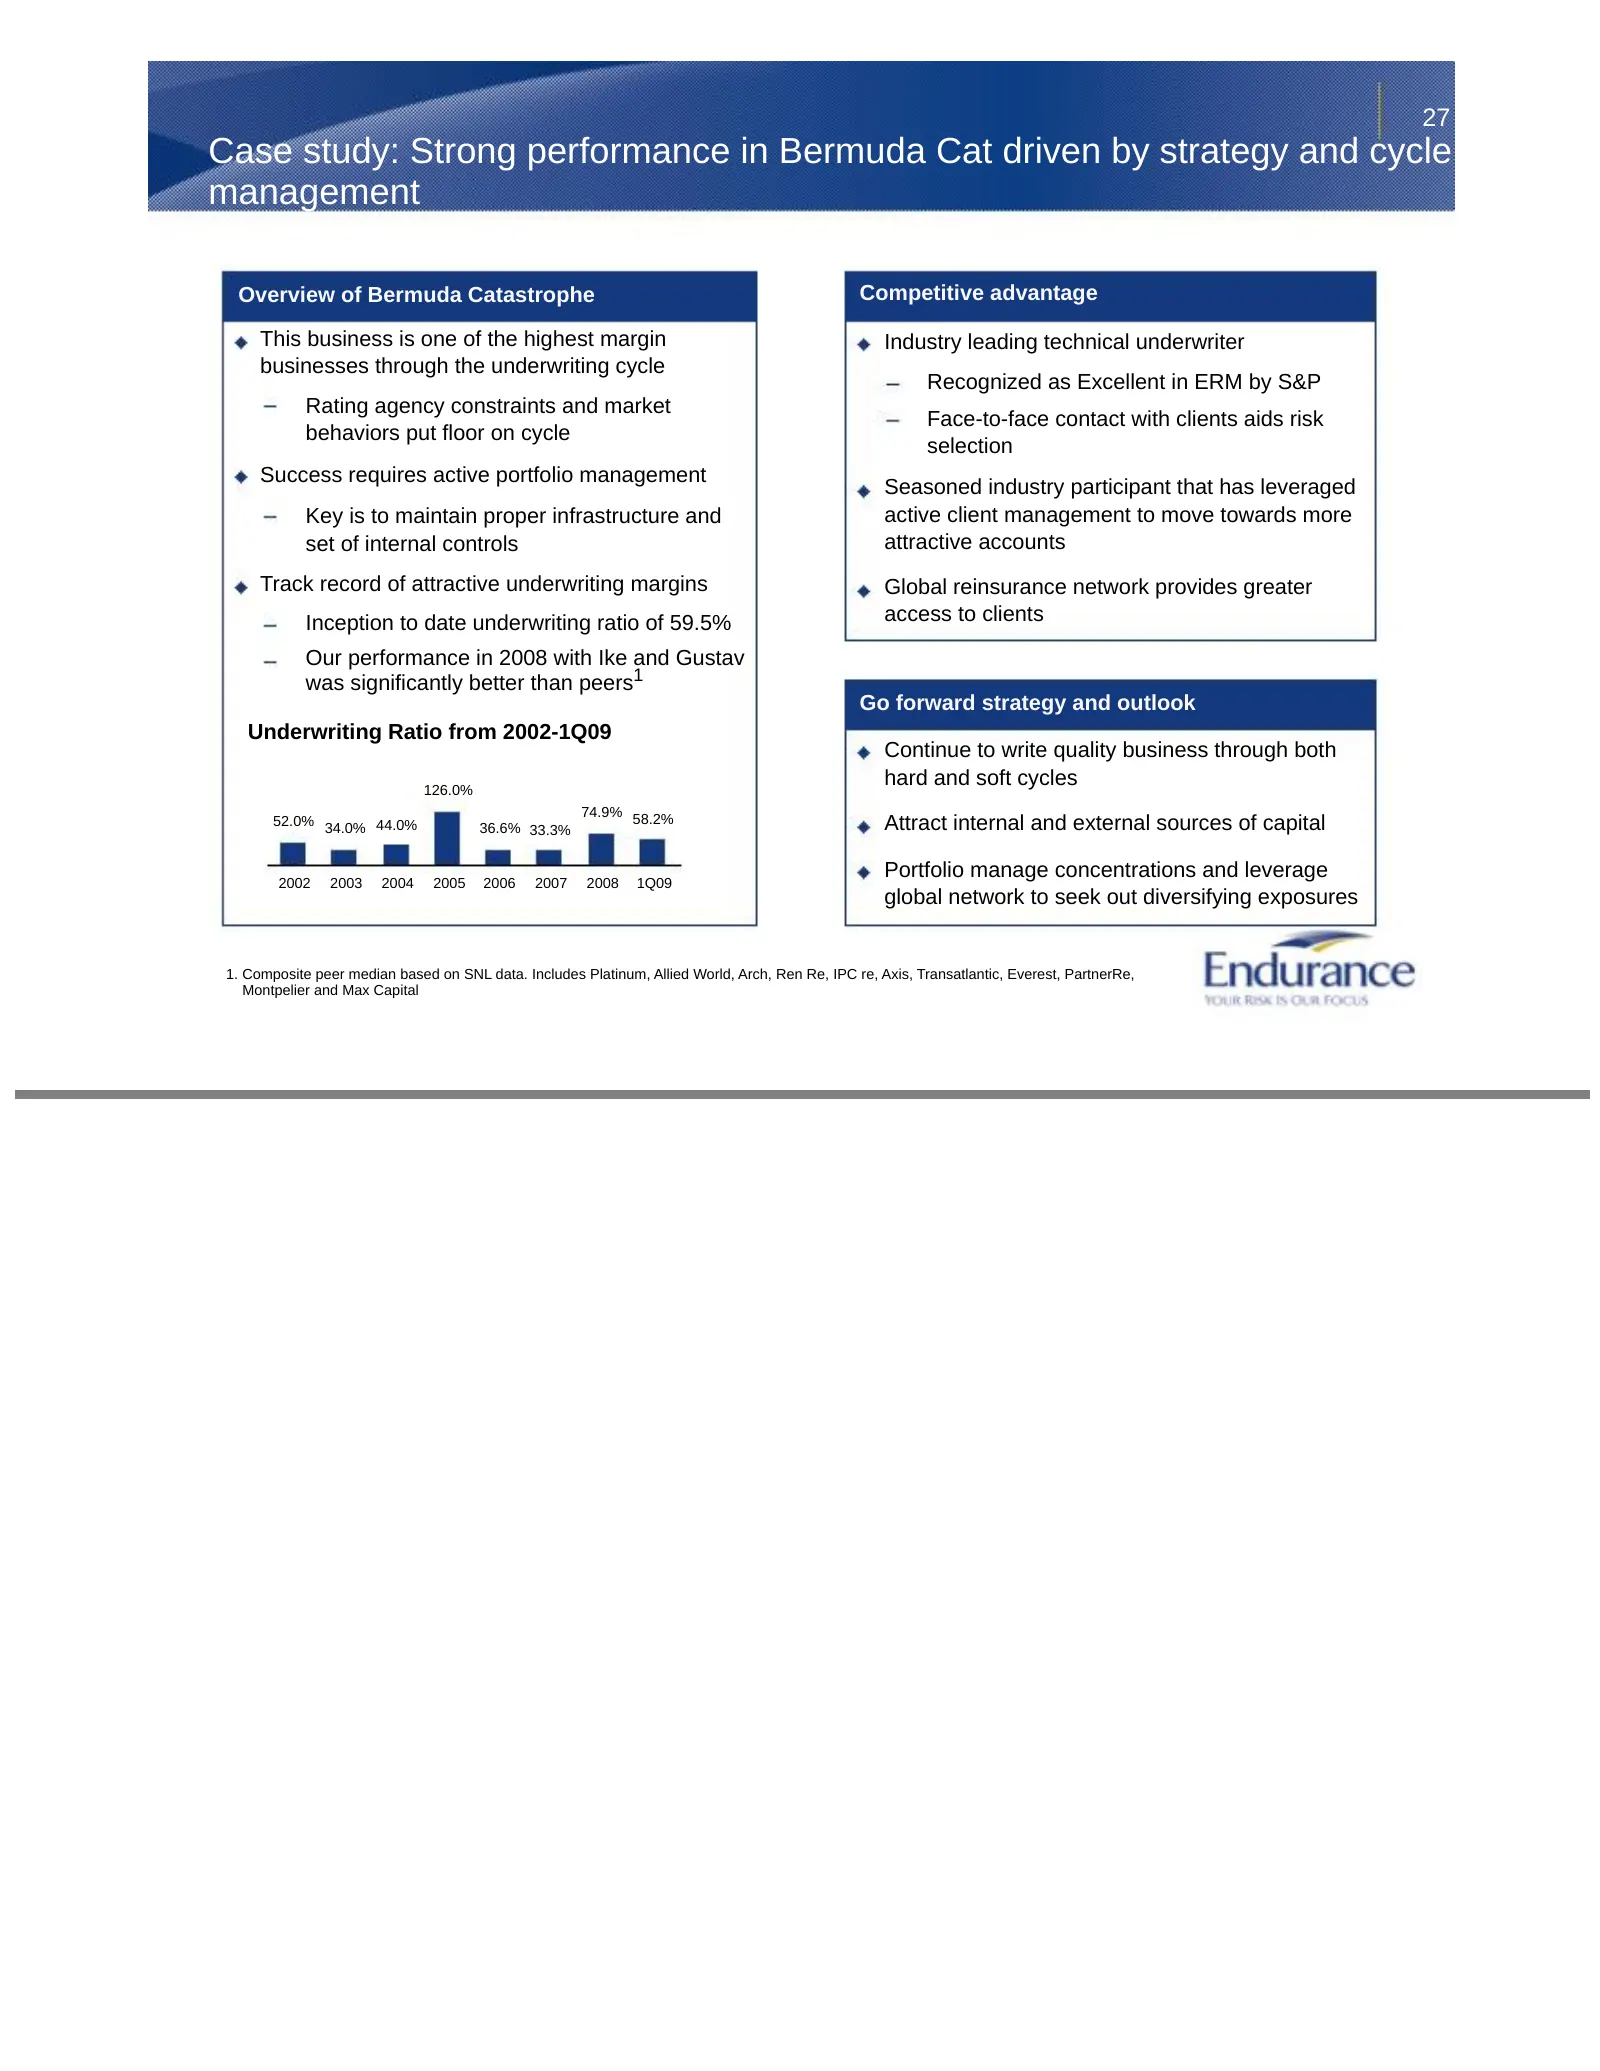
27 Case study: Strong performance in Bermuda Cat driven by strategy and cycle management Overview of Bermuda Catastrophe Competitive advantage This business is one of the highest margin Industry leading technical underwriter businesses through the underwriting cycle Recognized as Excellent in ERM by
Slide 28: Case study: California Workers' Comp insurance
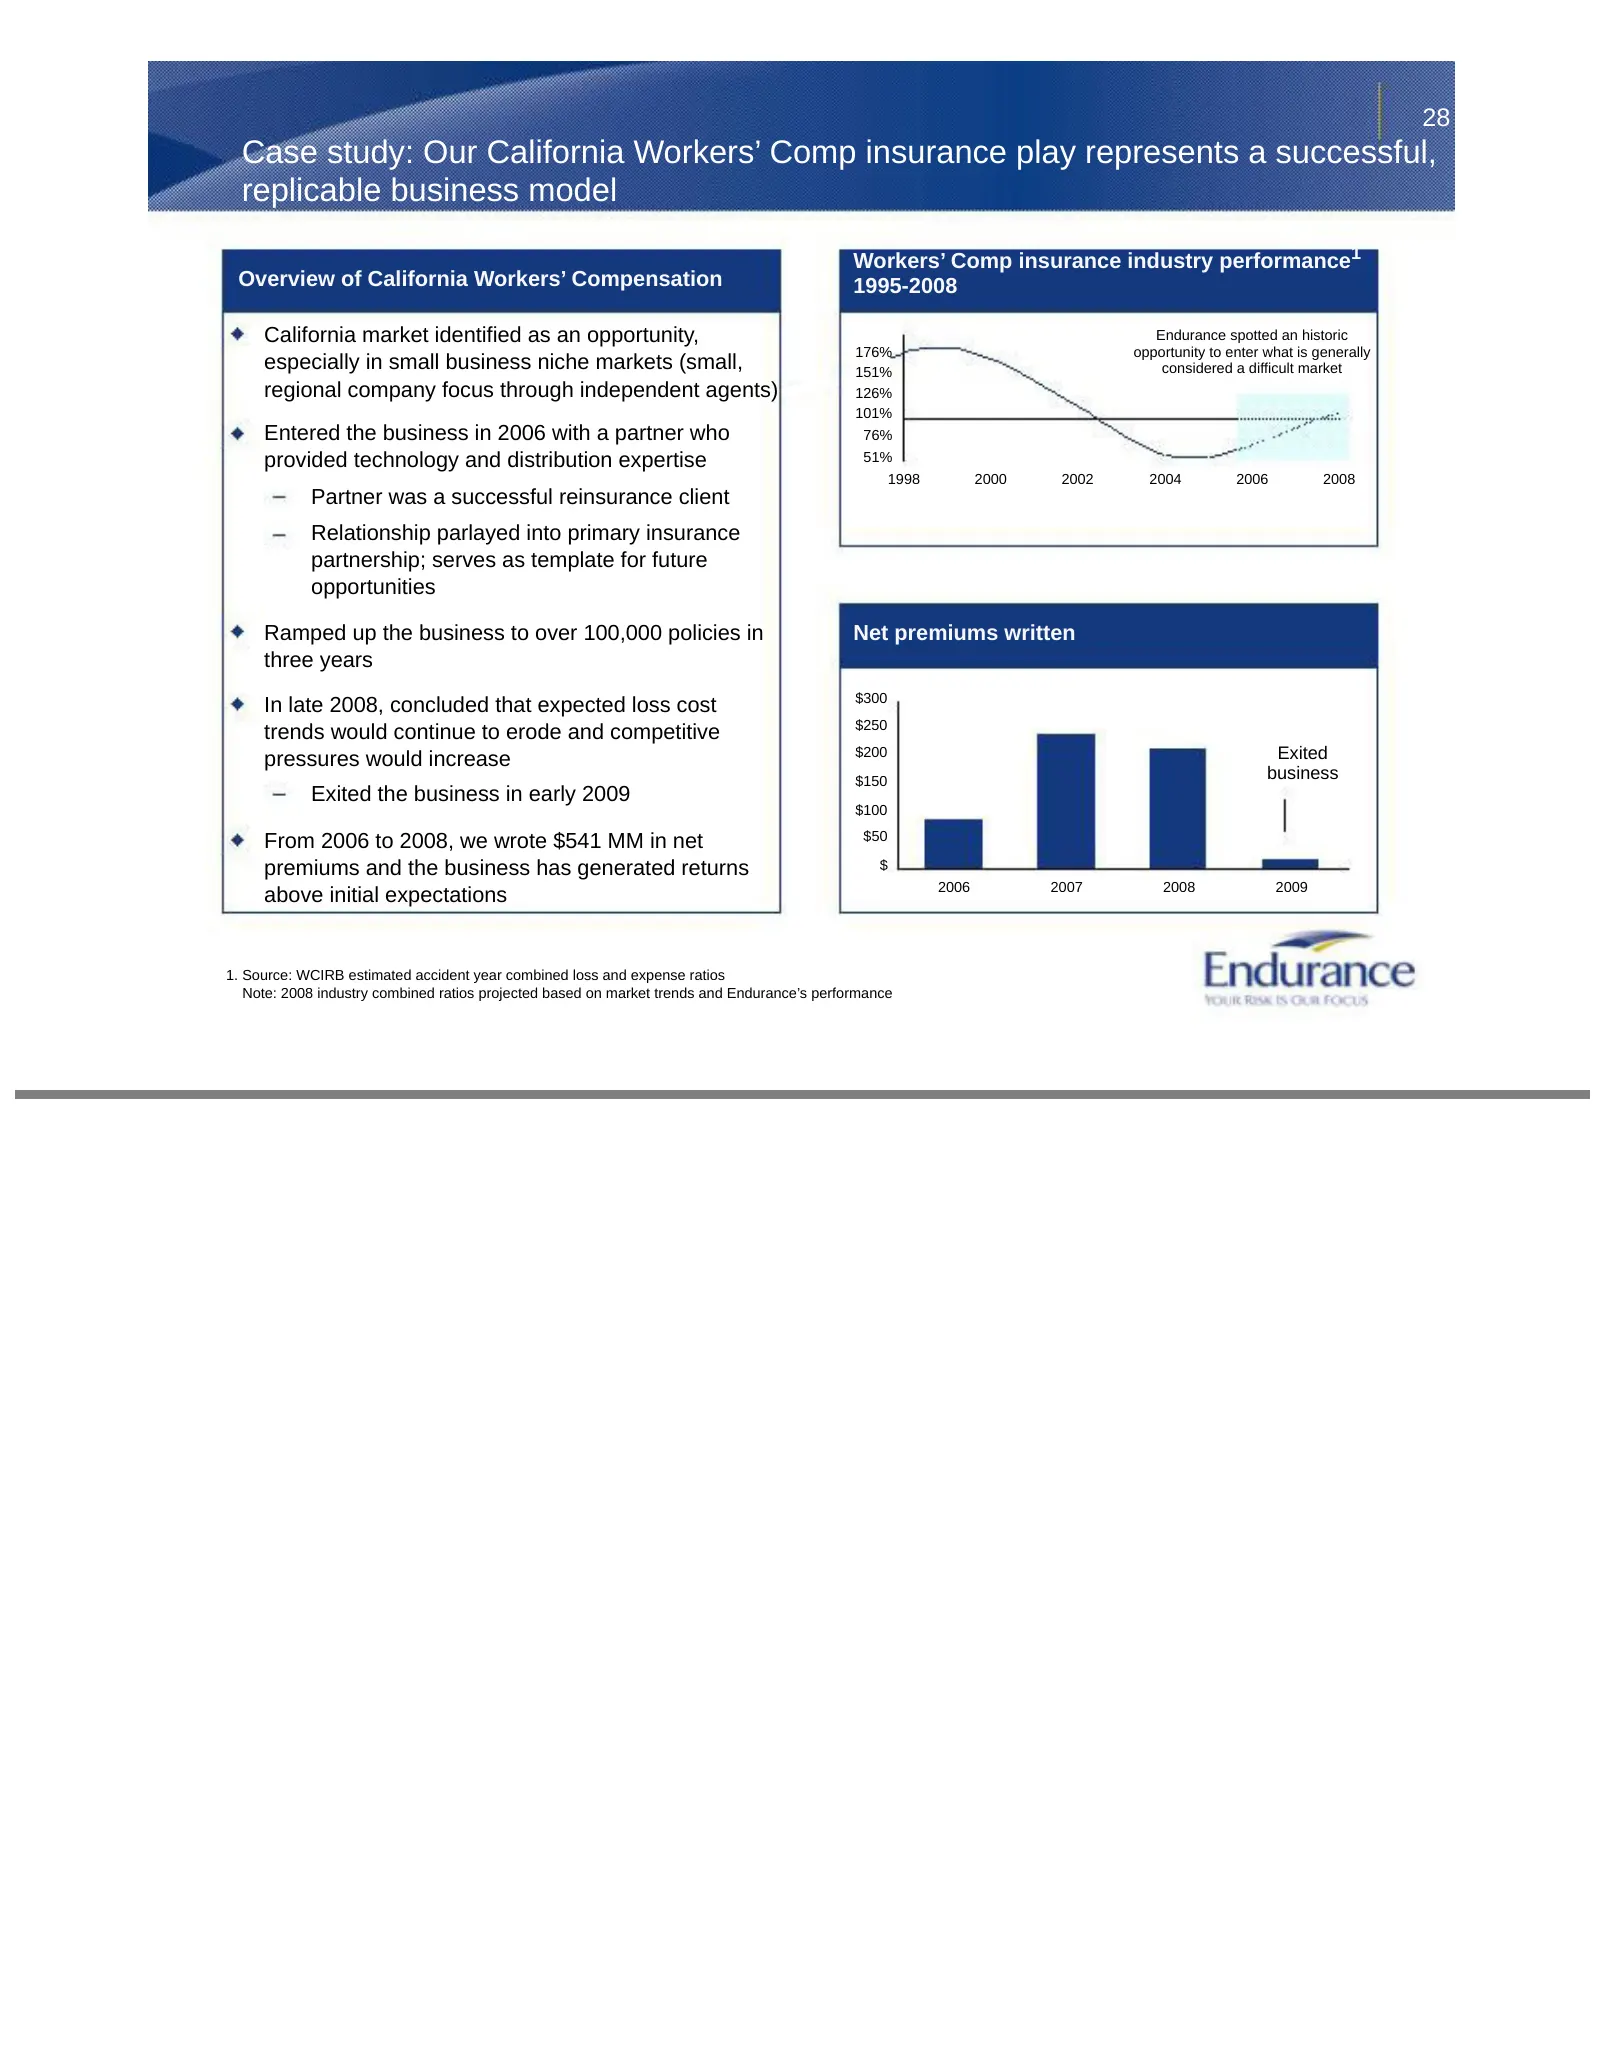
28 Case study: Our California Workers’ Comp insurance play represents a successful, replicable business model Workers’ Comp insurance industry performance1 Overview of California Workers’ Compensation 1995-2008 California market identified as an opportunity, Endurance spotted an historic 176% opport
Slide 29: Fortune 1000 – business overview
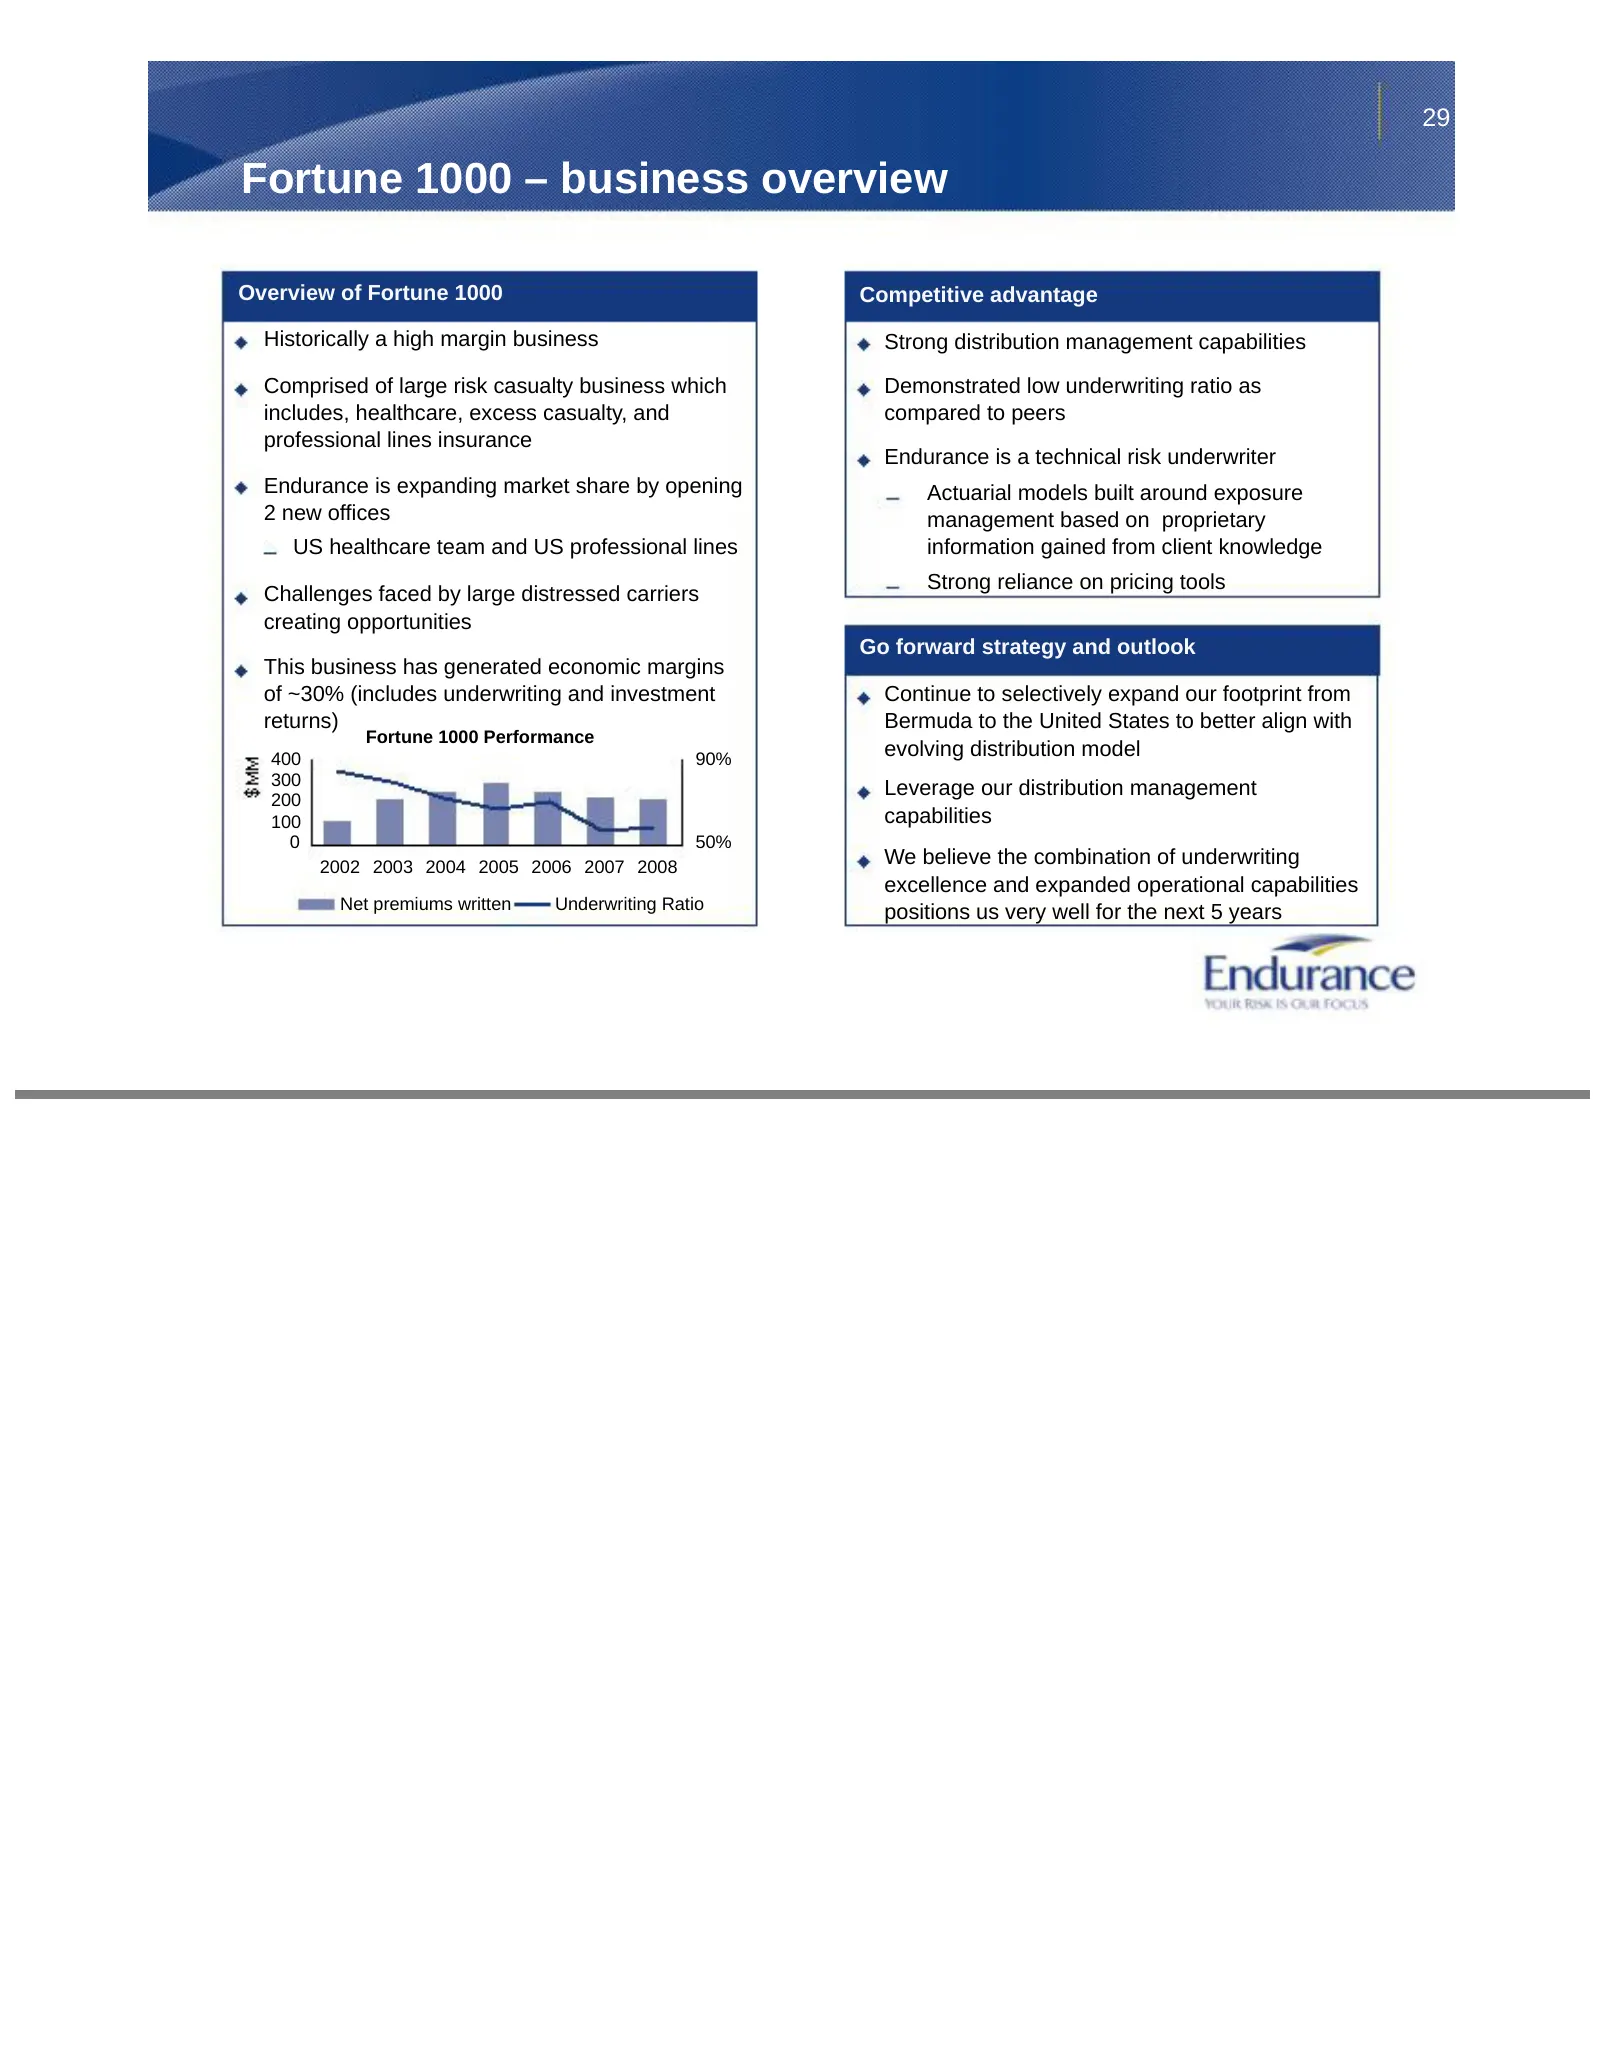
29 Fortune 1000 – business overview Overview of Fortune 1000 Competitive advantage Historically a high margin business Strong distribution management capabilities Comprised of large risk casualty business which Demonstrated low underwriting ratio as includes, healthcare, excess casualty, and compare
Slide 30: Program business overview
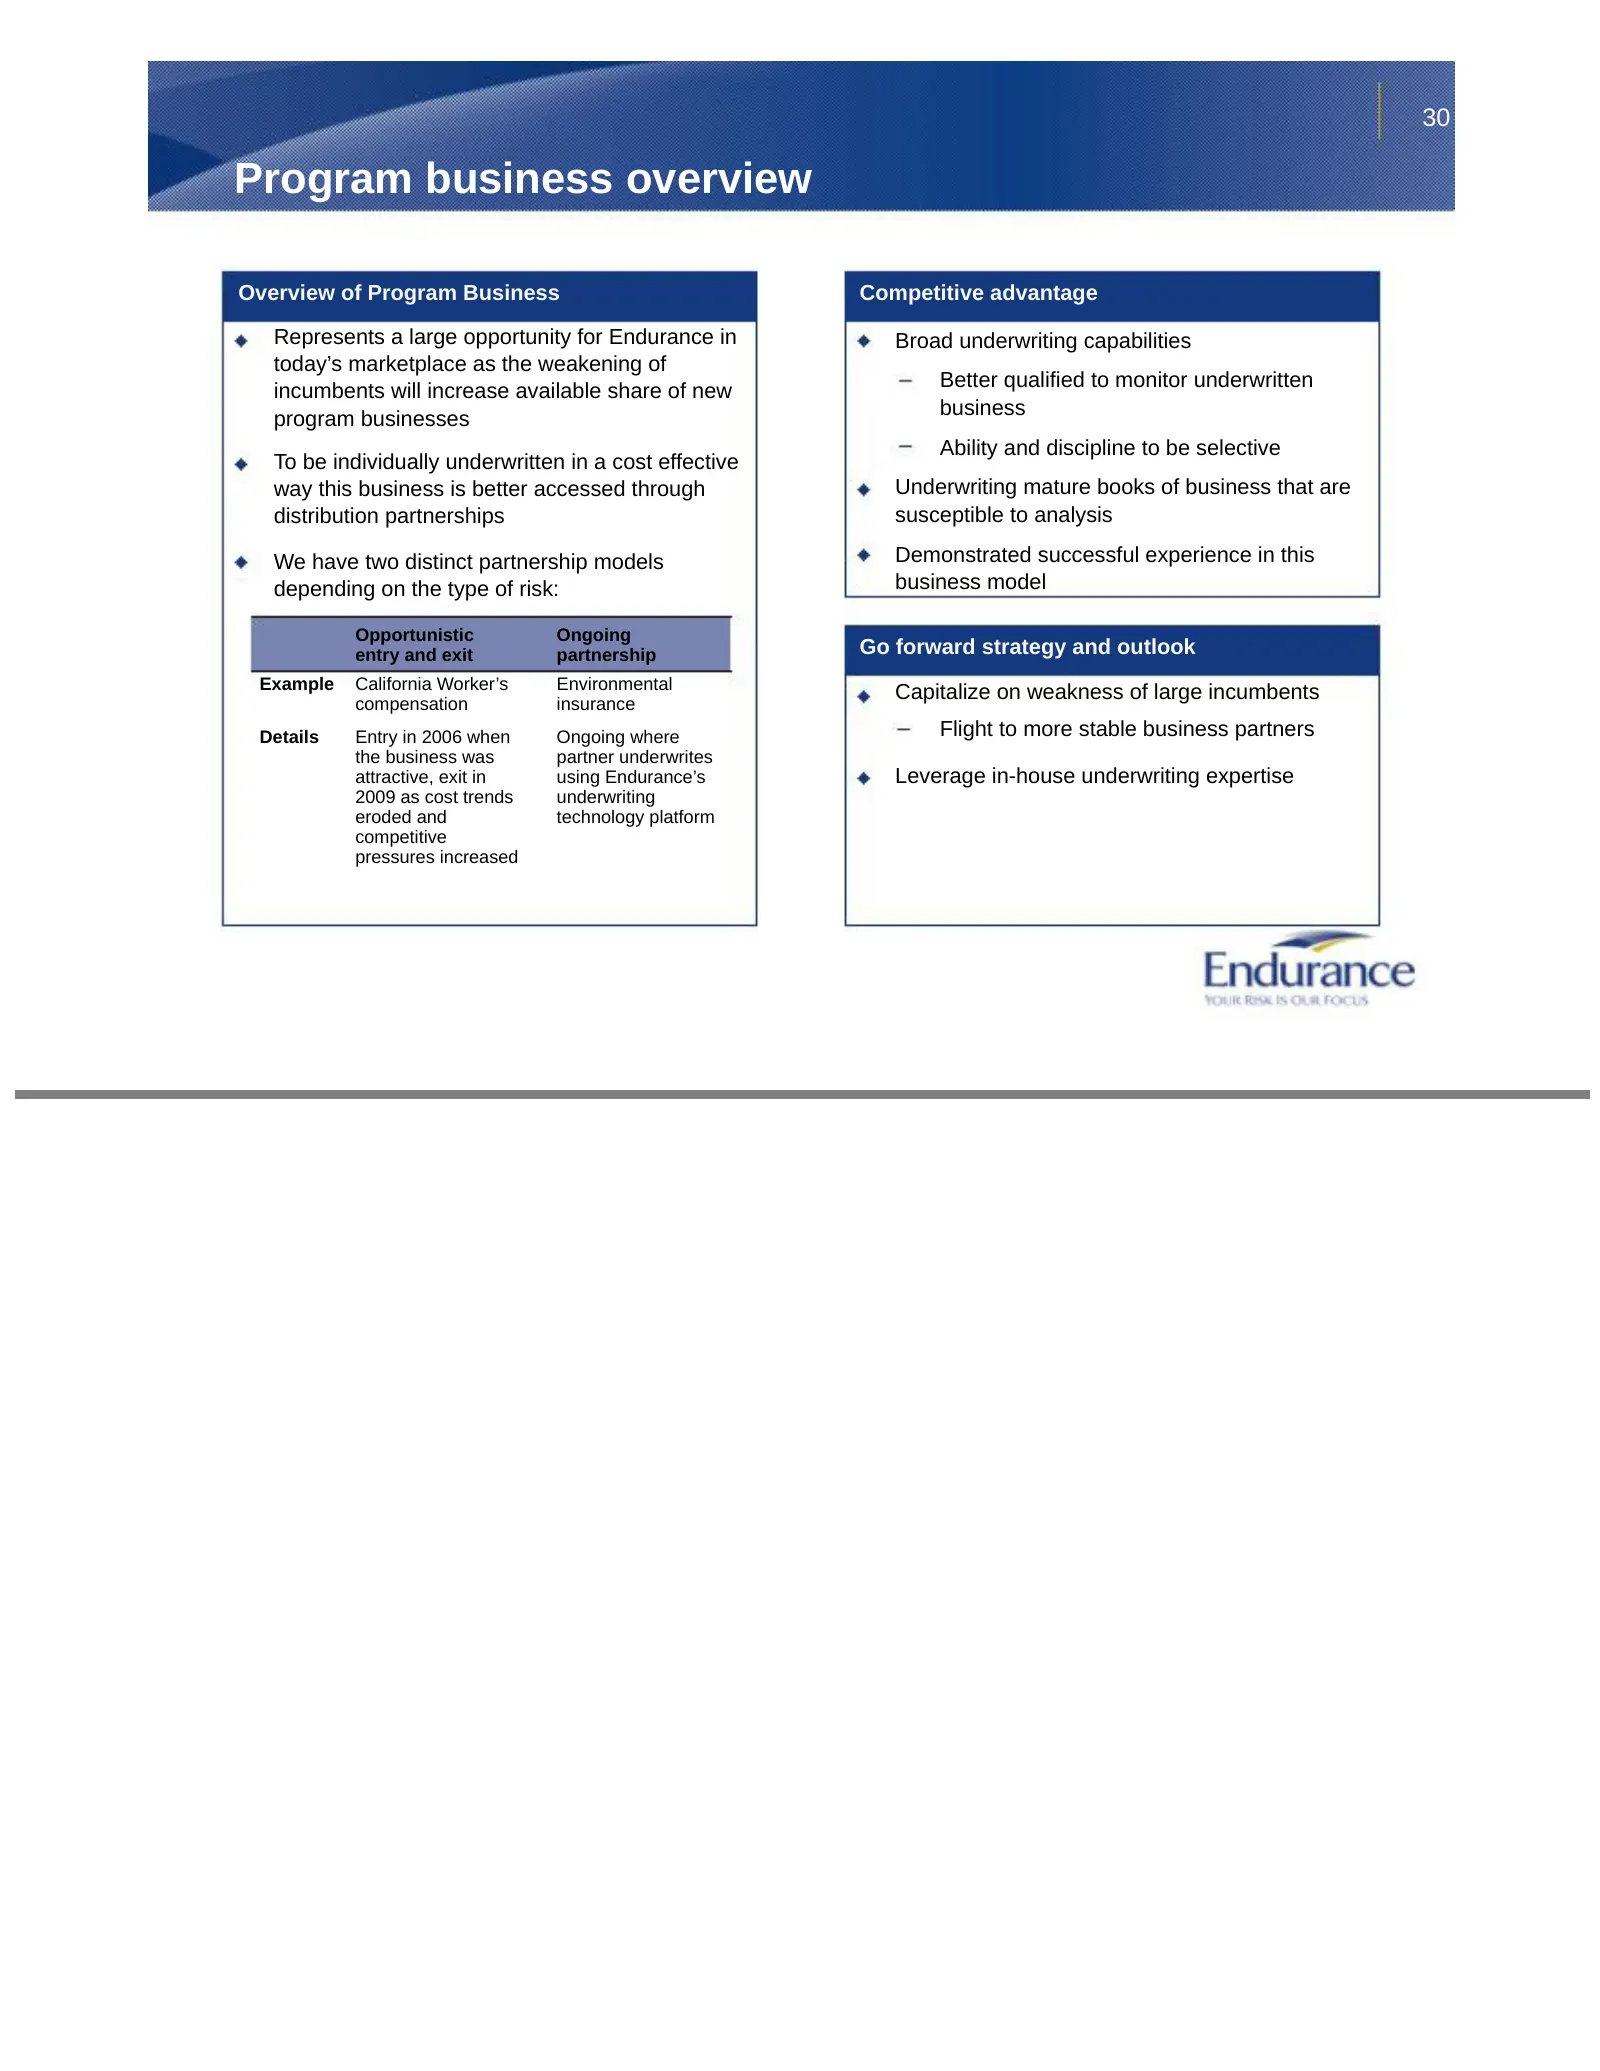
30 Program business overview Overview of Program Business Competitive advantage Represents a large opportunity for Endurance in Broad underwriting capabilities today’s marketplace as the weakening of Better qualified to monitor underwritten incumbents will increase available share of new business pr
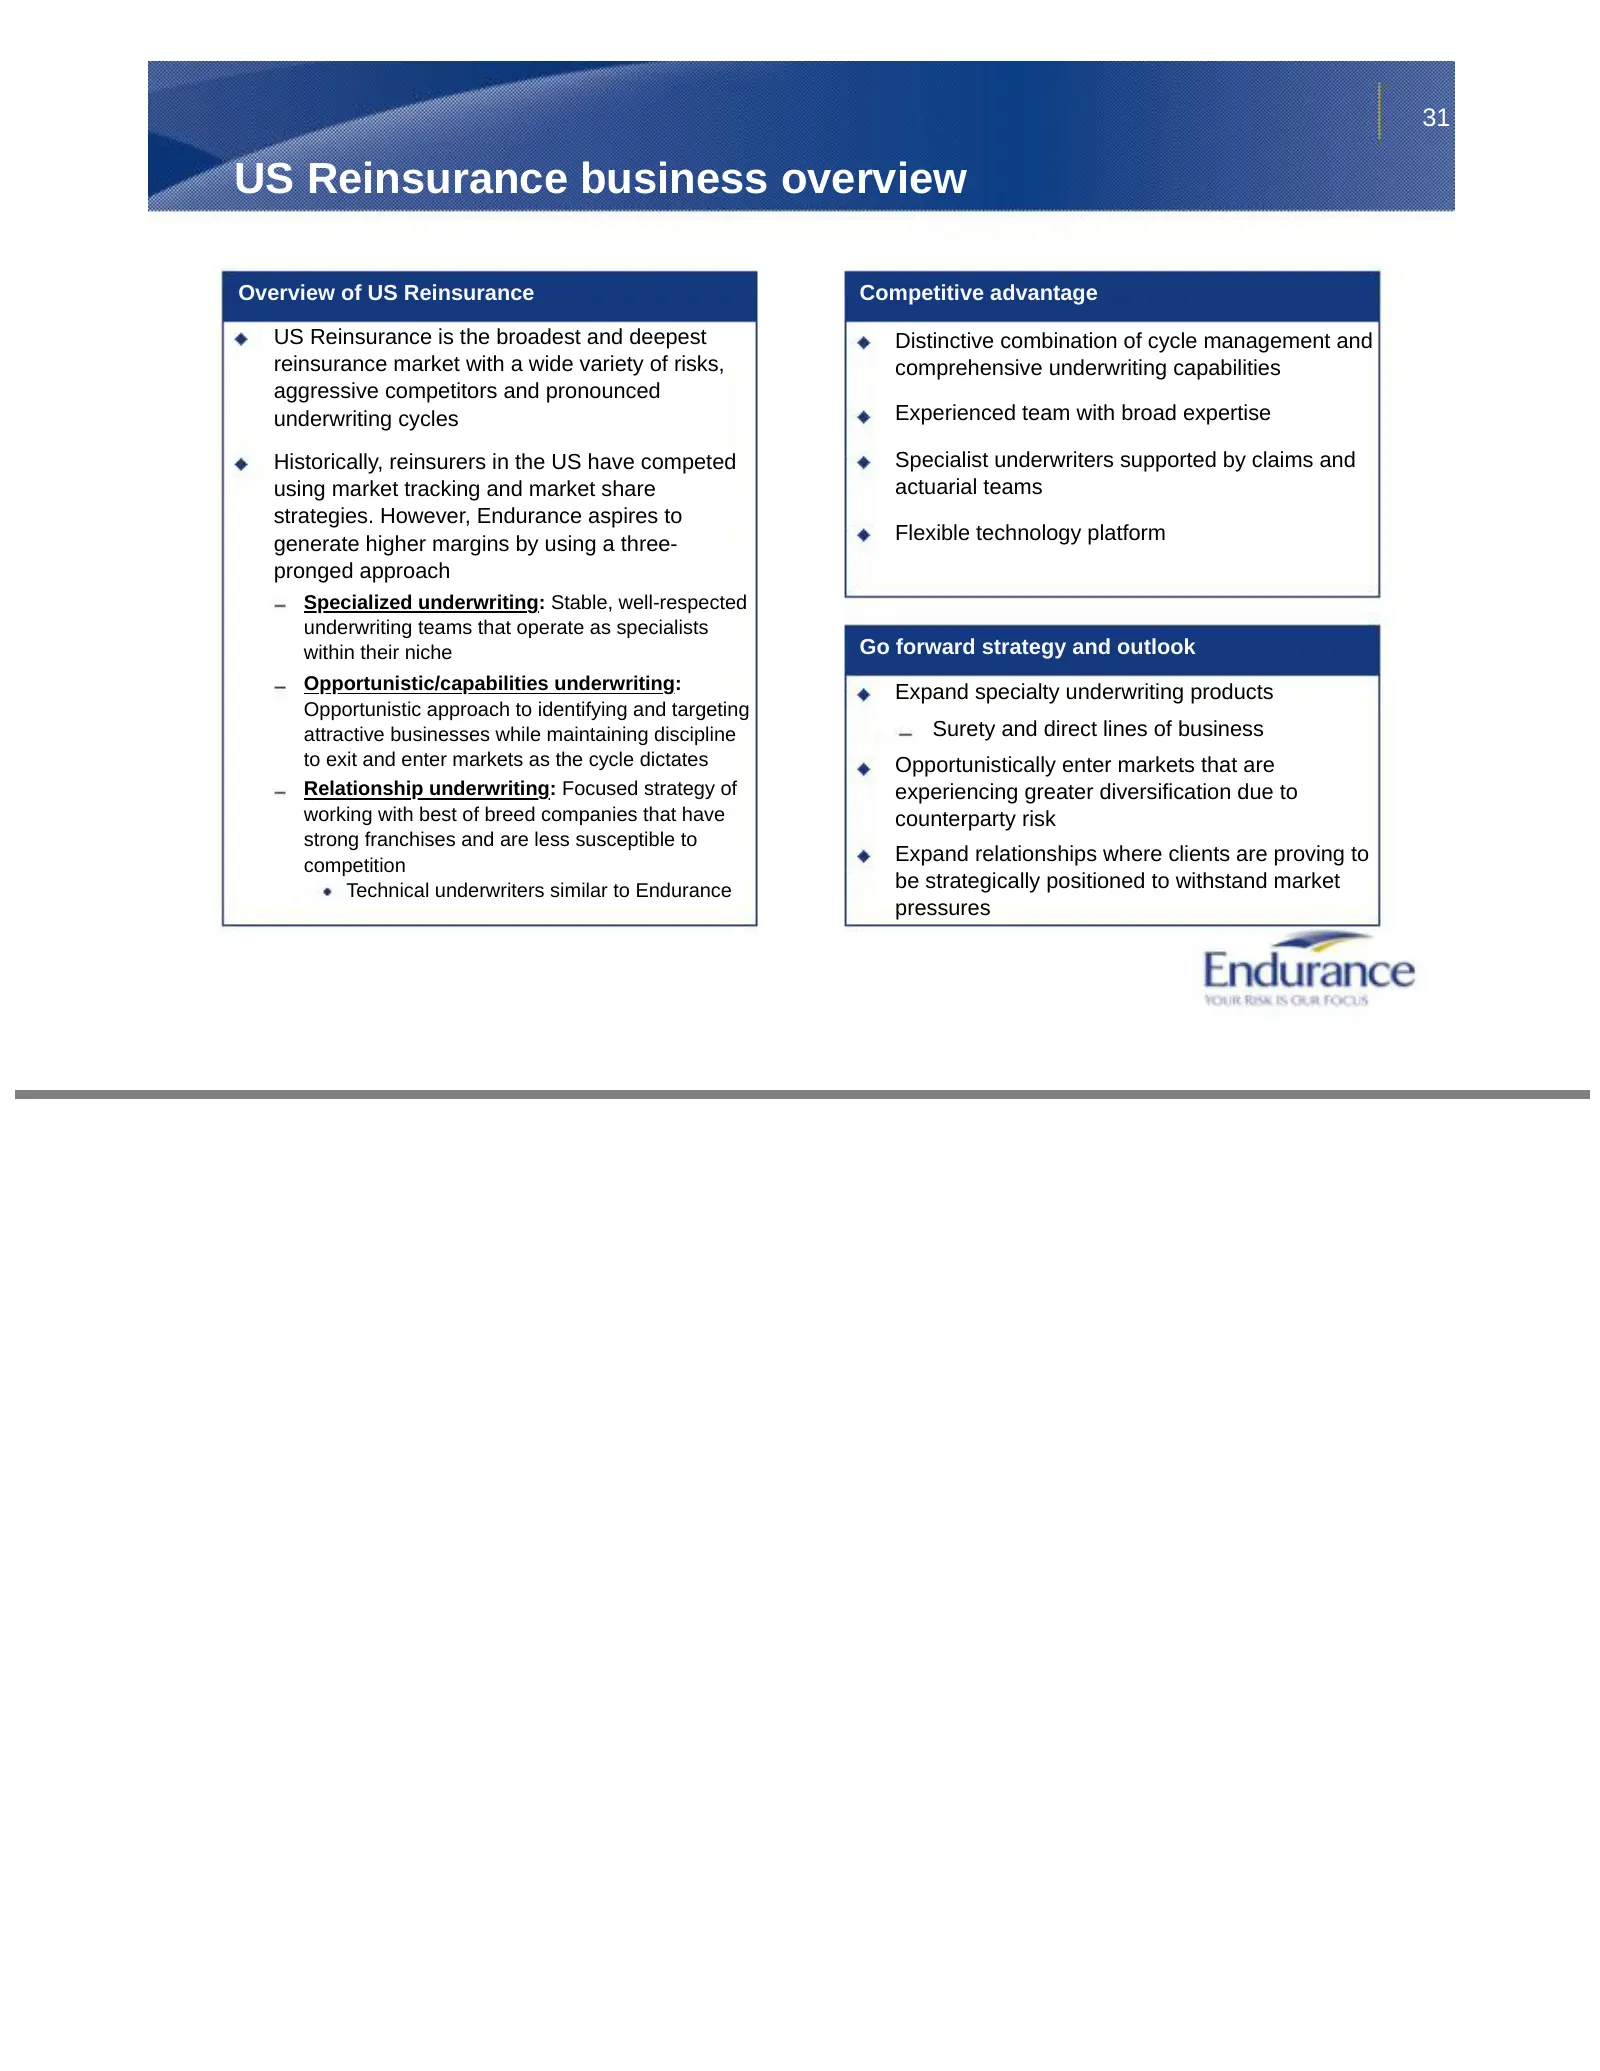
Slide 31: US Reinsurance business overview
31 US Reinsurance business overview Overview of US Reinsurance Competitive advantage US Reinsurance is the broadest and deepest Distinctive combination of cycle management and reinsurance market with a wide variety of risks, comprehensive underwriting capabilities aggressive competitors and pronounc
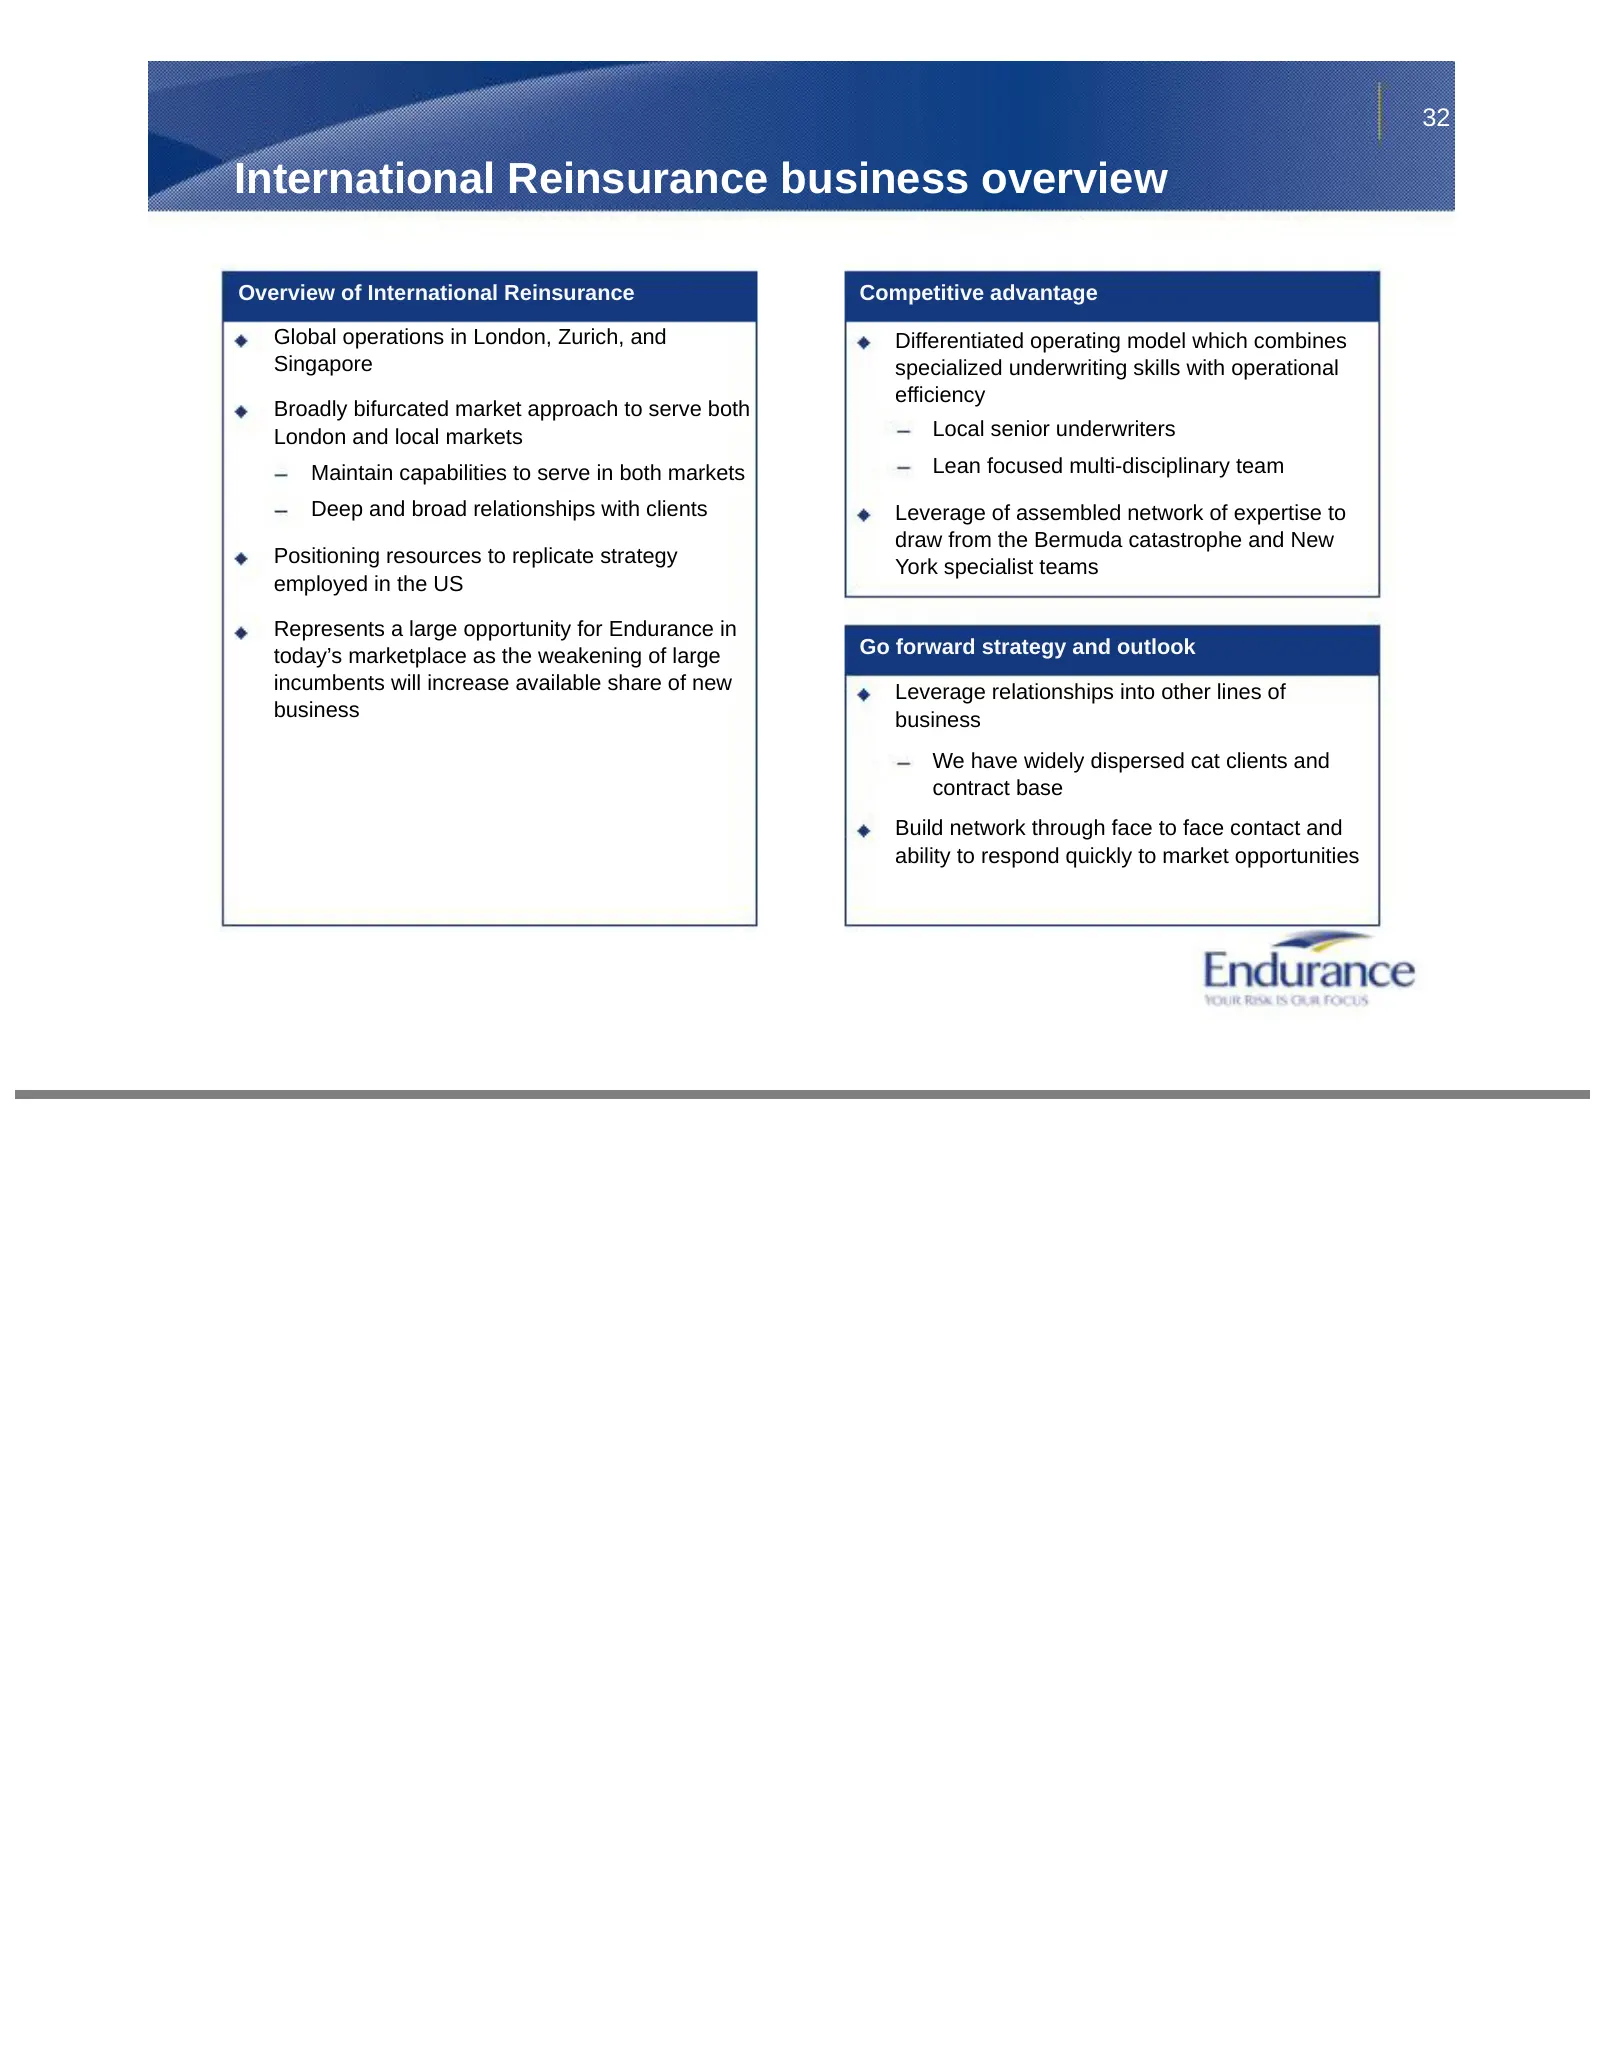
Slide 32: International Reinsurance business overview
32 International Reinsurance business overview Overview of International Reinsurance Competitive advantage Global operations in London, Zurich, and Differentiated operating model which combines Singapore specialized underwriting skills with operational efficiency Broadly bifurcated market approach t
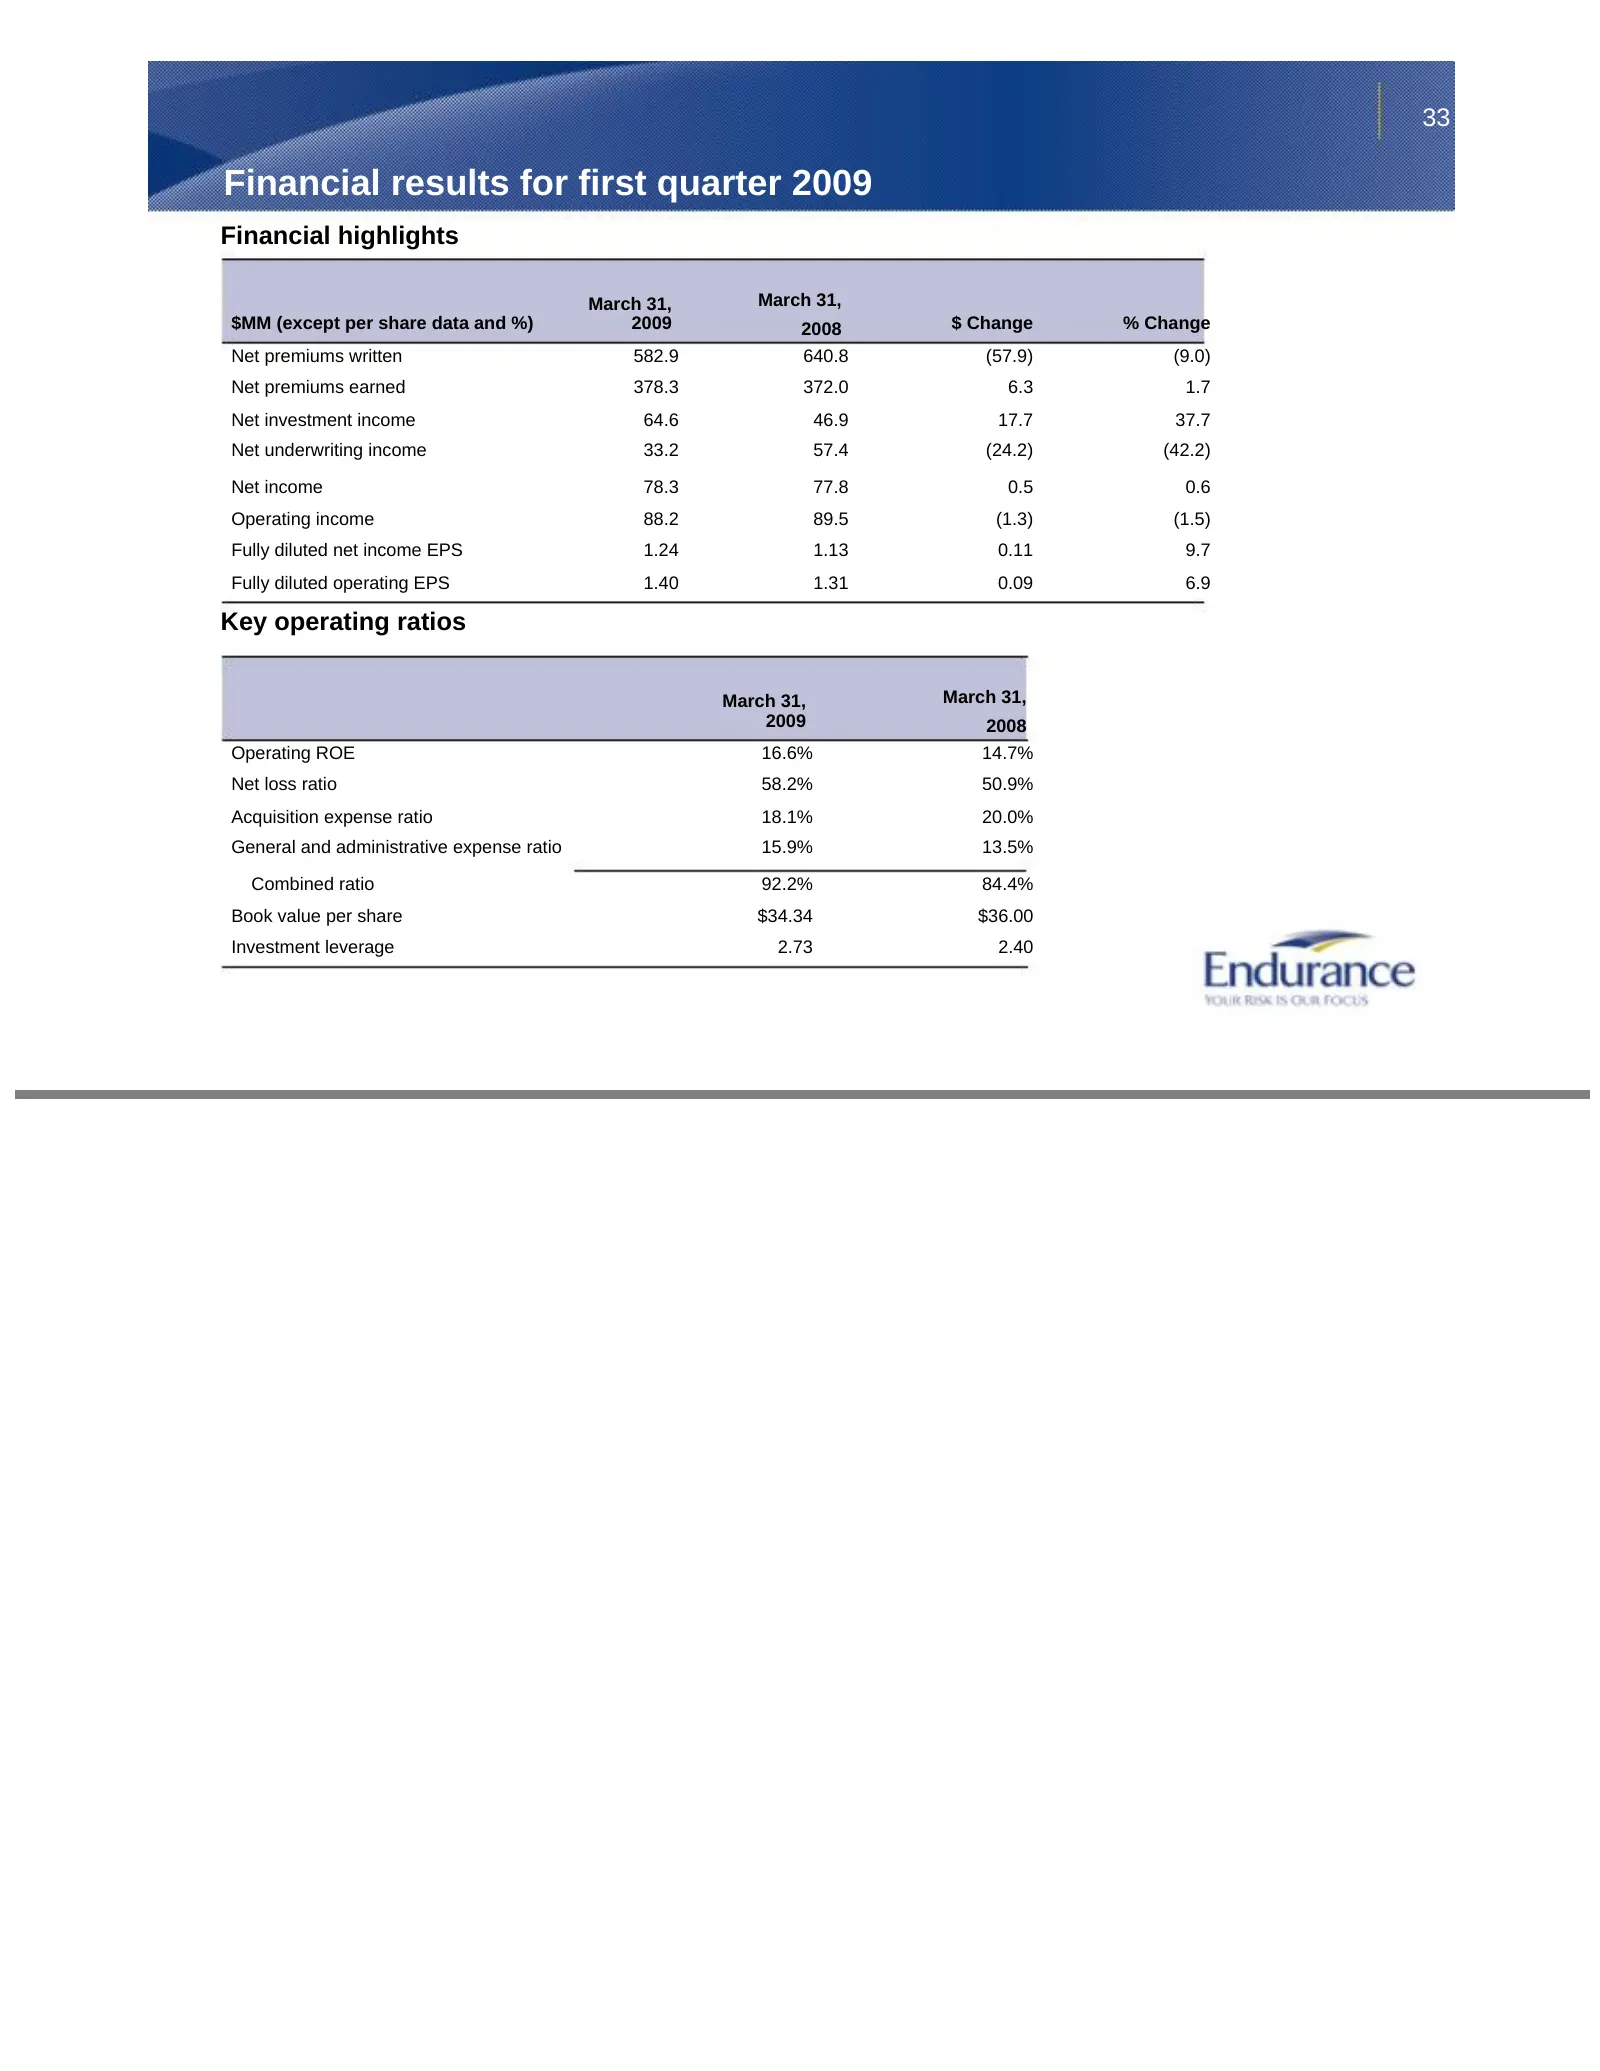
Slide 33: Financial results for first quarter 2009
33 Financial results for first quarter 2009 Financial highlights March 31, March 31, $MM (except per share data and %) 2009 2008 $ Change % Change Net premiums written 582.9 640.8 (57.9) (9.0) Net premiums earned 378.3 372.0 6.3 1.7 Net investment income 64.6 46.9 17.7 37.7 Net underwriting income 3
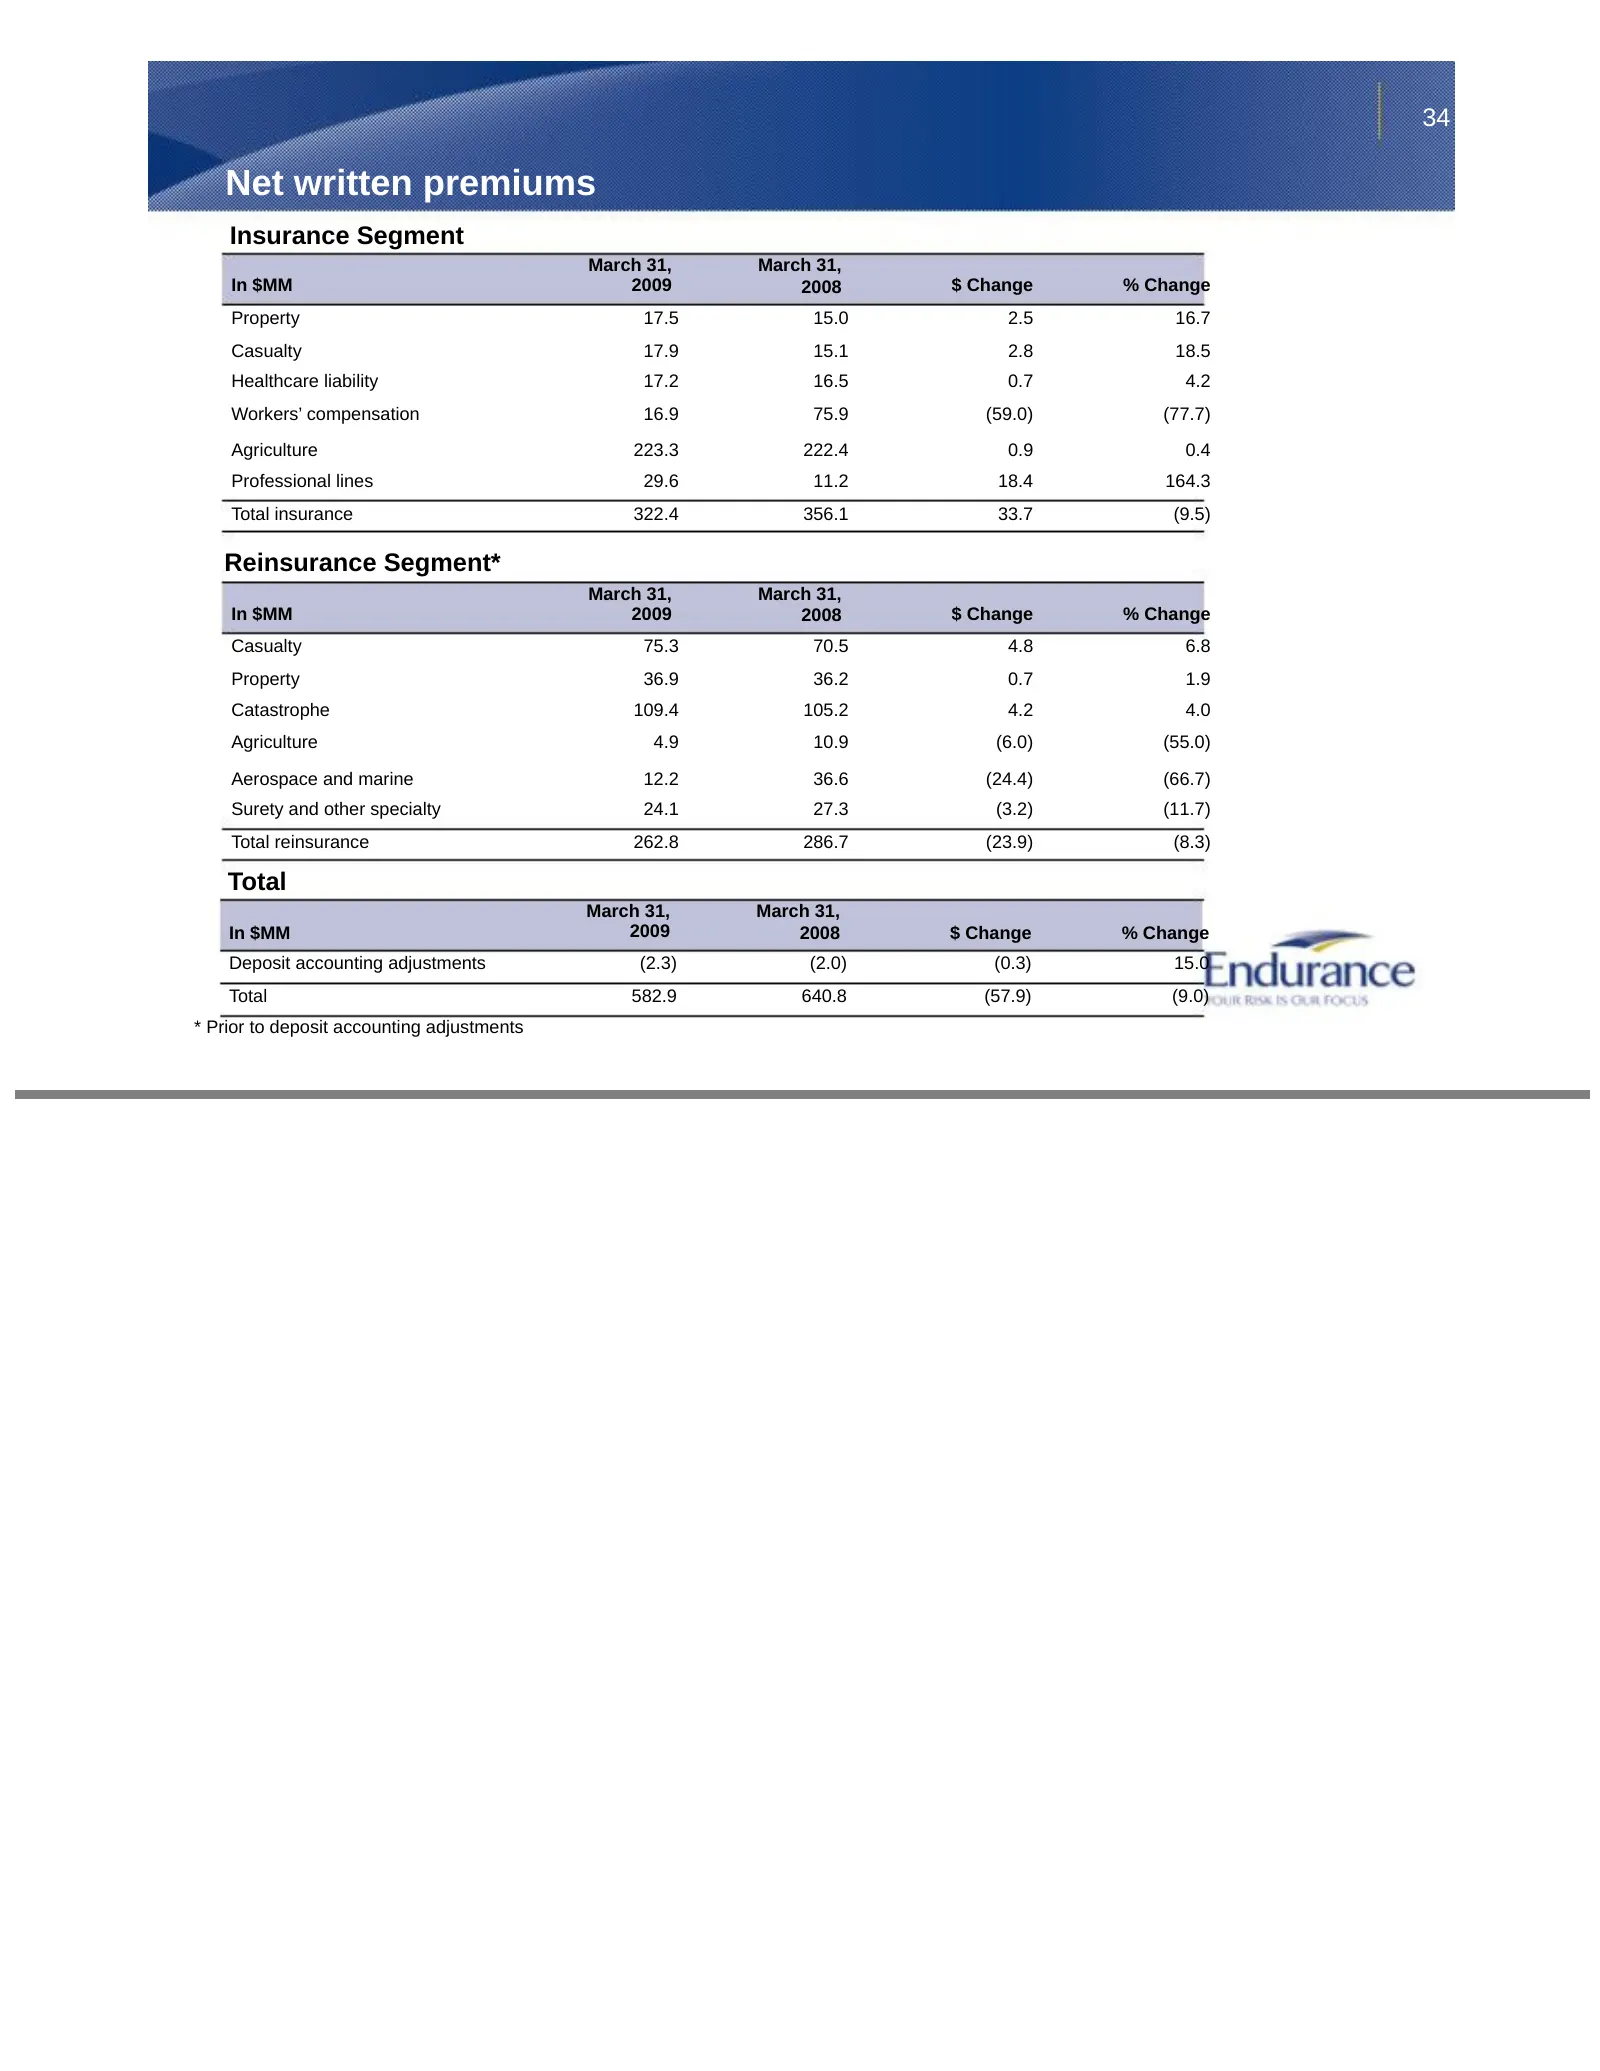
Slide 34: Net written premiums
34 Net written premiums Insurance Segment March 31, March 31, In $MM 2009 2008 $ Change % Change Property 17.5 15.0 2.5 16.7 Casualty 17.9 15.1 2.8 18.5 Healthcare liability 17.2 16.5 0.7 4.2 Workers’ compensation 16.9 75.9 (59.0) (77.7) Agriculture 223.3 222.4 0.9 0.4 Professional lines 29.6 11.2 1
Slide 35: Financial overview: historical
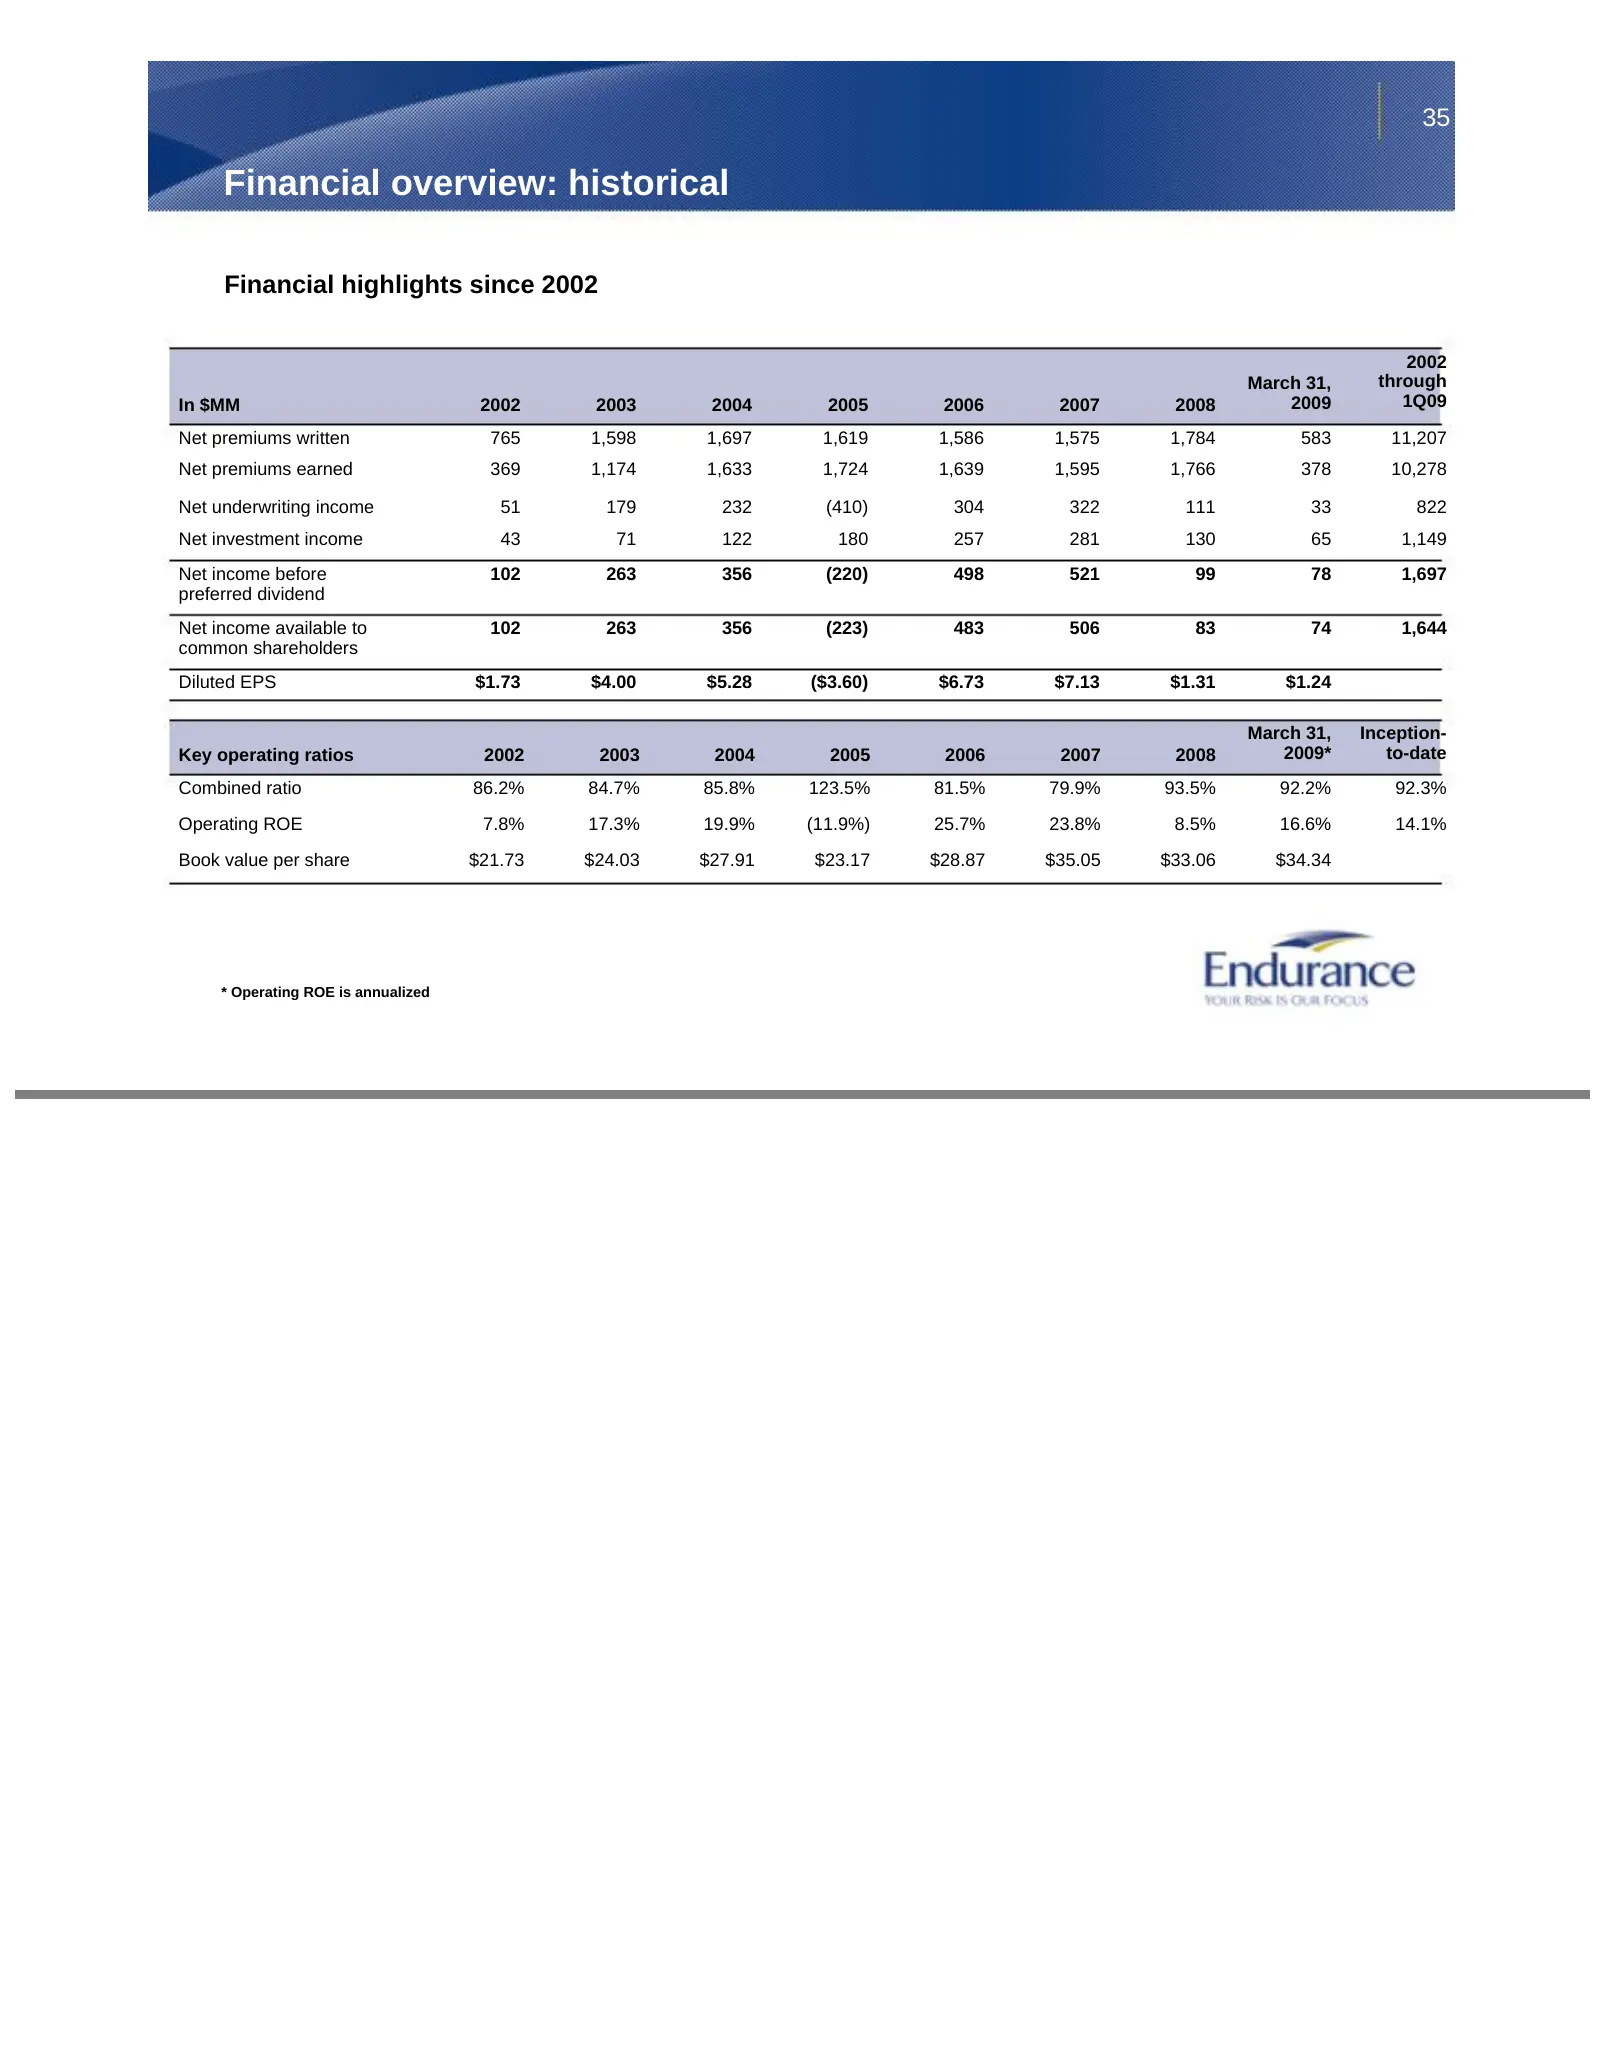
35 Financial overview: historical Financial highlights since 2002 2002 March 31, through In $MM 2002 2003 2004 2005 2006 2007 2008 2009 1Q09 Net premiums written 765 1,598 1,697 1,619 1,586 1,575 1,784 583 11,207 Net premiums earned 369 1,174 1,633 1,724 1,639 1,595 1,766 378 10,278 Net underwriting
Slide 36: Capital management
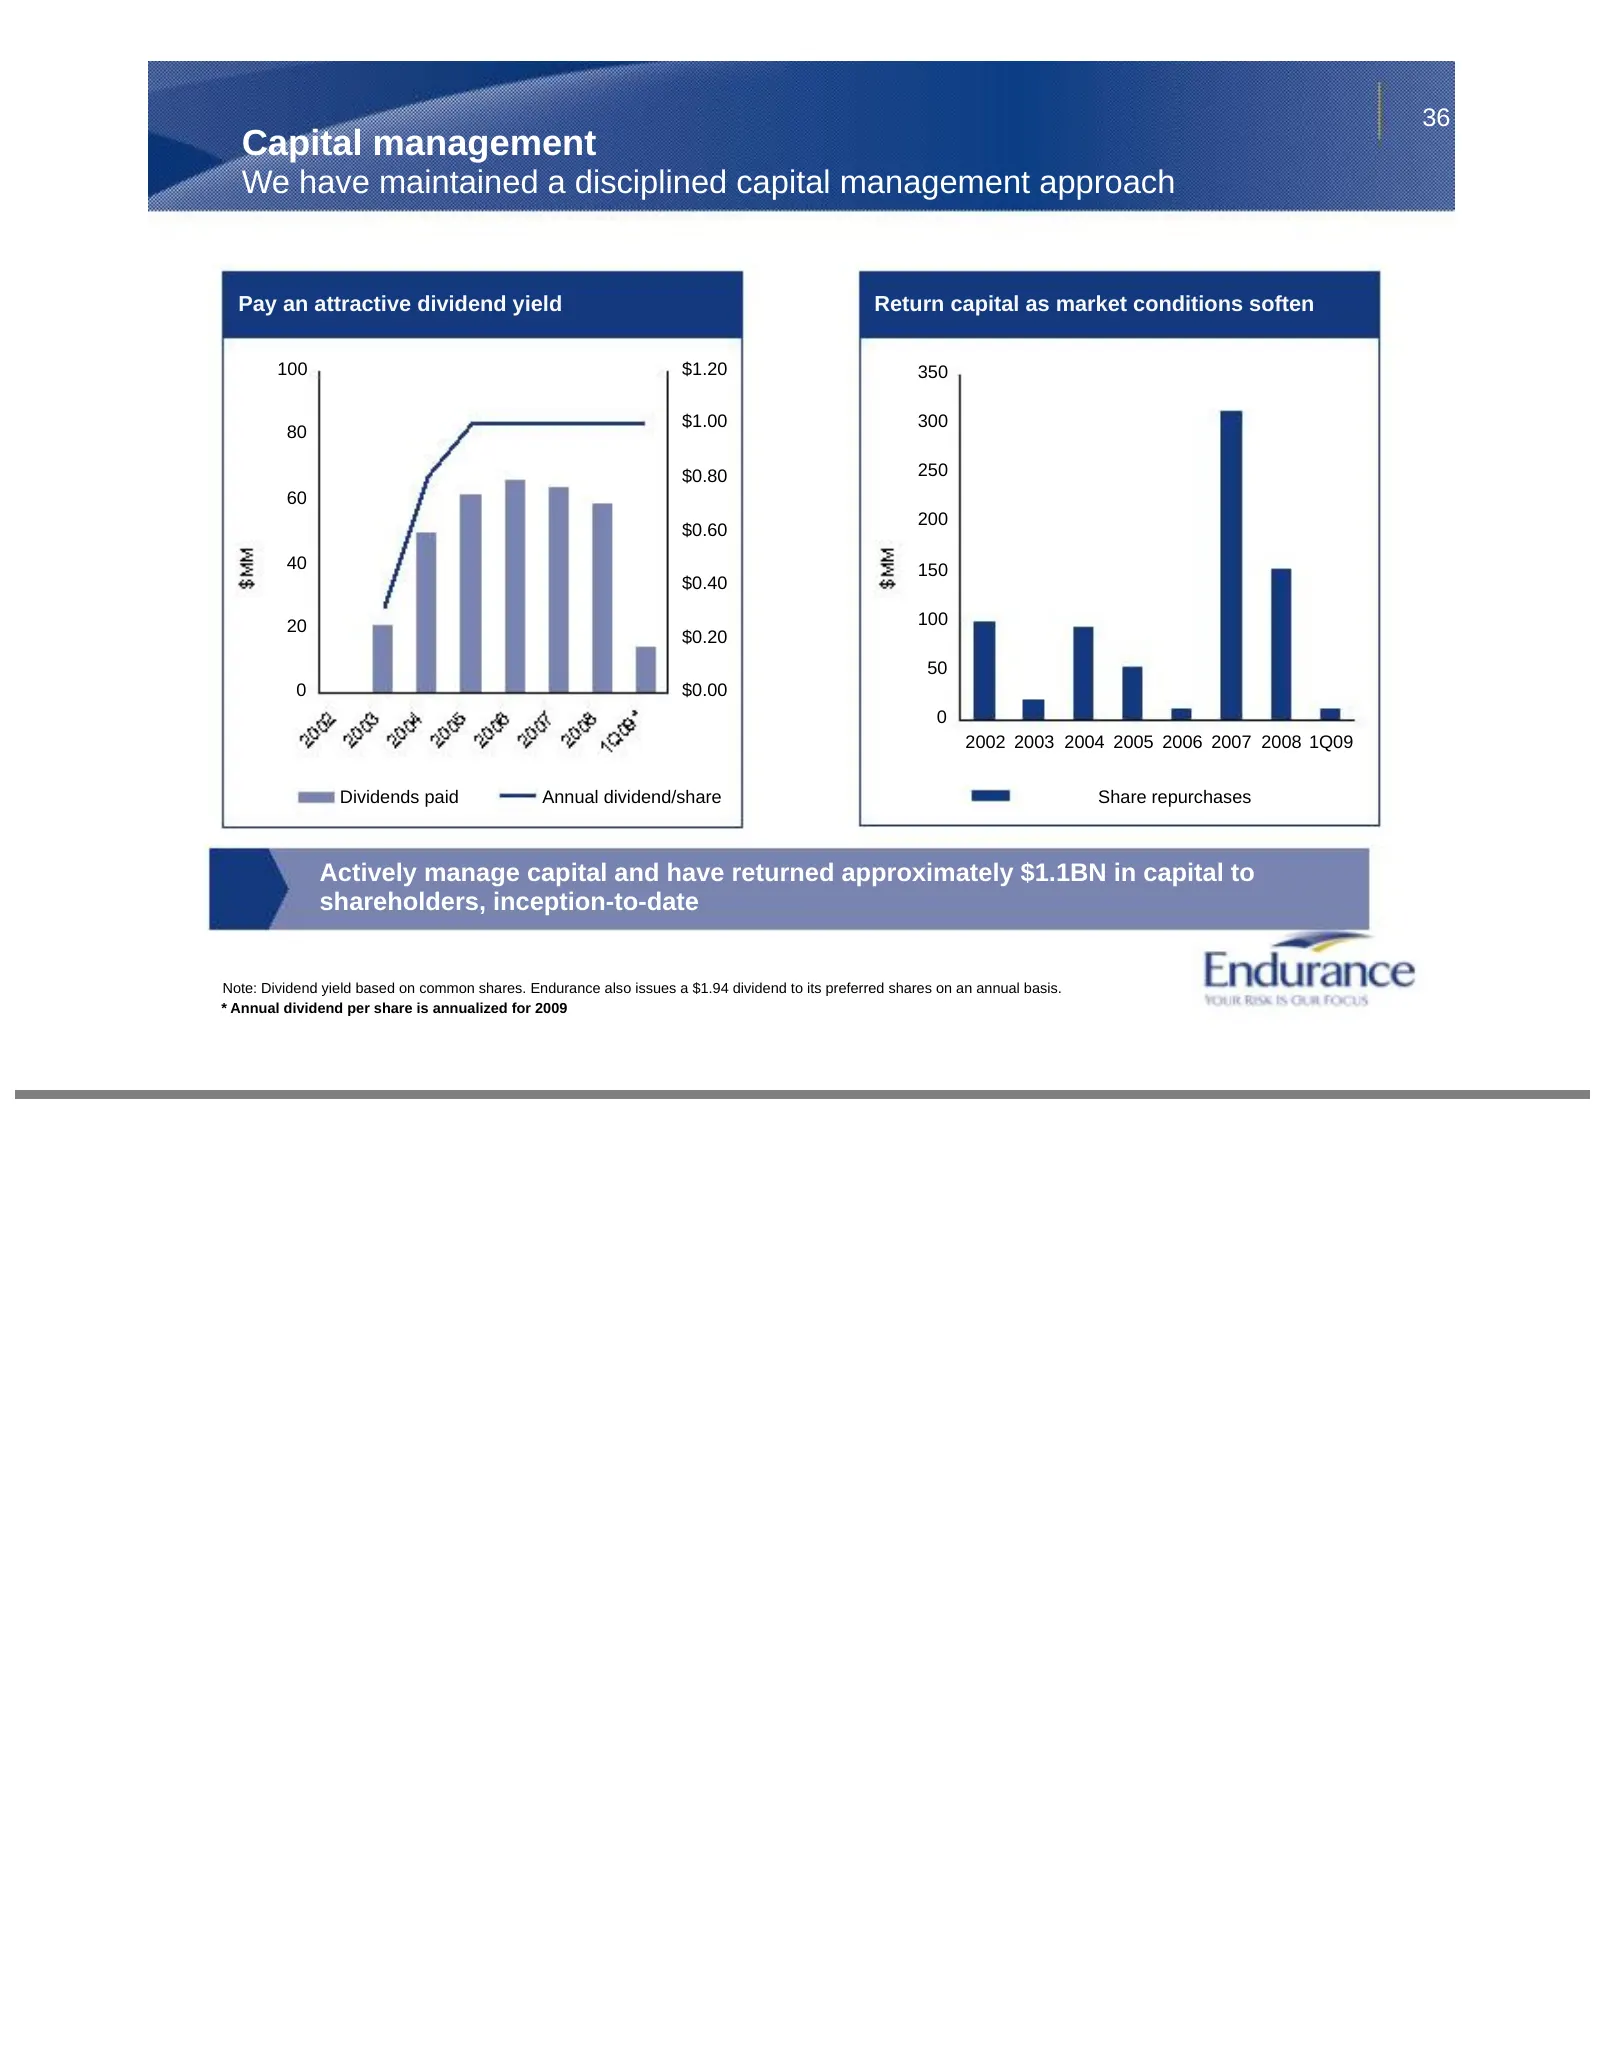
36 Capital management We have maintained a disciplined capital management approach Pay an attractive dividend yield Return capital as market conditions soften 100 $1.20 350 $1.00 300 80 $0.80 250 60 200 $0.60 40 150 $0.40 20 100 $0.20 50 0 $0.00 0 2002 2003 2004 2005 2006 2007 2008 1Q09 Dividends pa
Source: SEC EDGAR · 8-K filed Jun 16, 2009
More decks from Endurance Specialty Holdings Ltd
 Merger or Acquisition (October 2016)17 slides · Oct 12, 2016
 Investor Presentation (August 2016)29 slides · Aug 9, 2016
 Investor Presentation (May 2016)28 slides · May 10, 2016
 Investor Presentation (February 2016)29 slides · Feb 9, 2016
 Investor Presentation (February 2015)28 slides · Feb 11, 2015
 Merger or Acquisition (April 2014)22 slides · Apr 14, 2014