Tib Financial — Gulf South Bank Conference 2008
15 slides from Tib Financial's conference presentation, Apr 30, 2008

Slide 1: Gulf South Bank Conference, April 29, 2008
1 Naples, FL (Nasdaq: TIBB) Michael Carrigan CEO and President TIB Bank Stephen J. Gilhooly EVP/Chief Financial Officer GULF SOUTH BANK CONFERENCE APRIL 29, 2008

Slide 2: Forward Looking Statement
TIBB - -GULF SOUTH 2008 # 2 This presentation contains certain forward-looking statements including those concerning the banking industry and the company’s operations, performance, financial condition, and growth. For this purpose, any statements contained in the presentation, that are not statement

Slide 3: Financial Profile
TIBB - -GULF SOUTH 2008 # 3 Headquartered in Naples, Florida Third Largest Publicly Traded Florida Bank Largest Publicly Traded Community Bank Headquartered in Southwest Florida Financial Profile
Slide 4: Franchise
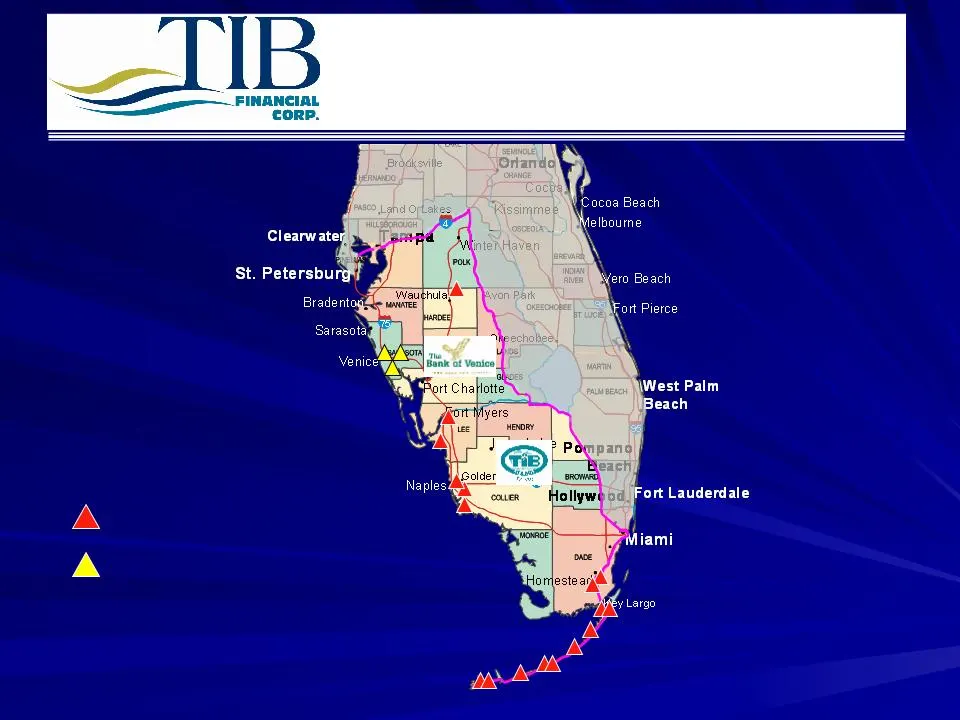
TIBB - -GULF SOUTH 2008 # 4 Key West TIB Branches BOV Branches Franchise
Slide 5: Hallmarks
TIBB - -GULF SOUTH 2008 # 5 TIB’s service-oriented culture is hard to beat Senior officers are empowered, turnover is low We focus on middle market commercial banking Owner-operated commercial real estate Financing operating businesses Underwriting based on cash flow Hallmarks
Slide 6: Strategic Objectives
TIBB - -GULF SOUTH 2008 # 6 Optimize Organic Opportunities TIB Bank The Bank of Venice Naples Capital Advisors Strategic Alliance with Two of S.W. Florida’s Leading Families and their Companies, The Barron Collier Companies and The Lutgert Companies Strategic Objectives
Slide 7: Loan Composition
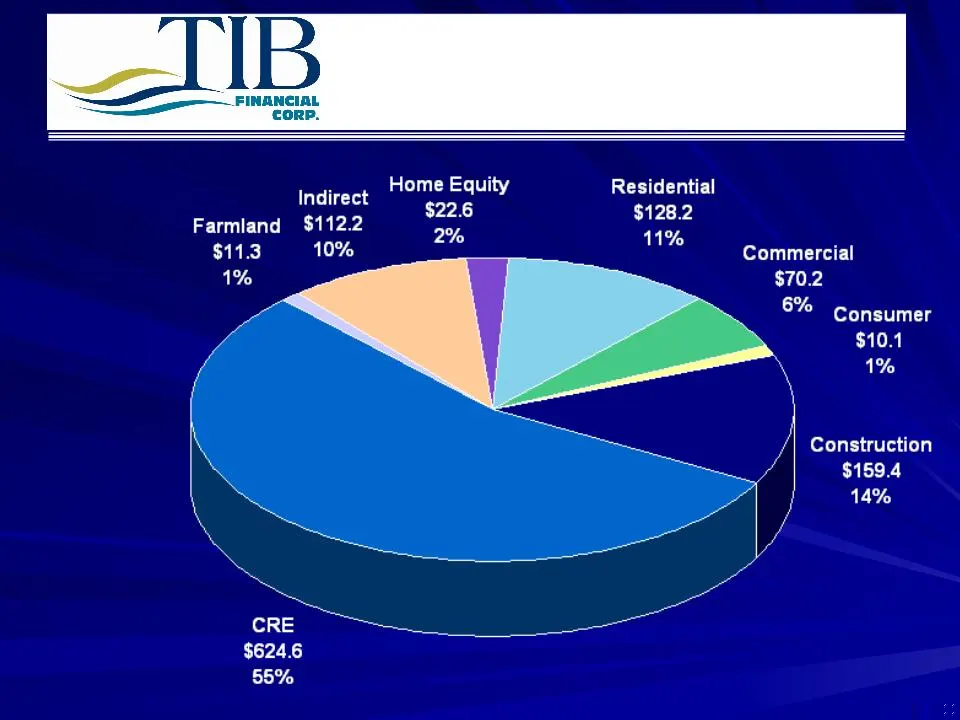
TIBB - -GULF SOUTH 2008 # 7 as of 3/31/2008 ($ in millions) Loan Composition $1,138.5M
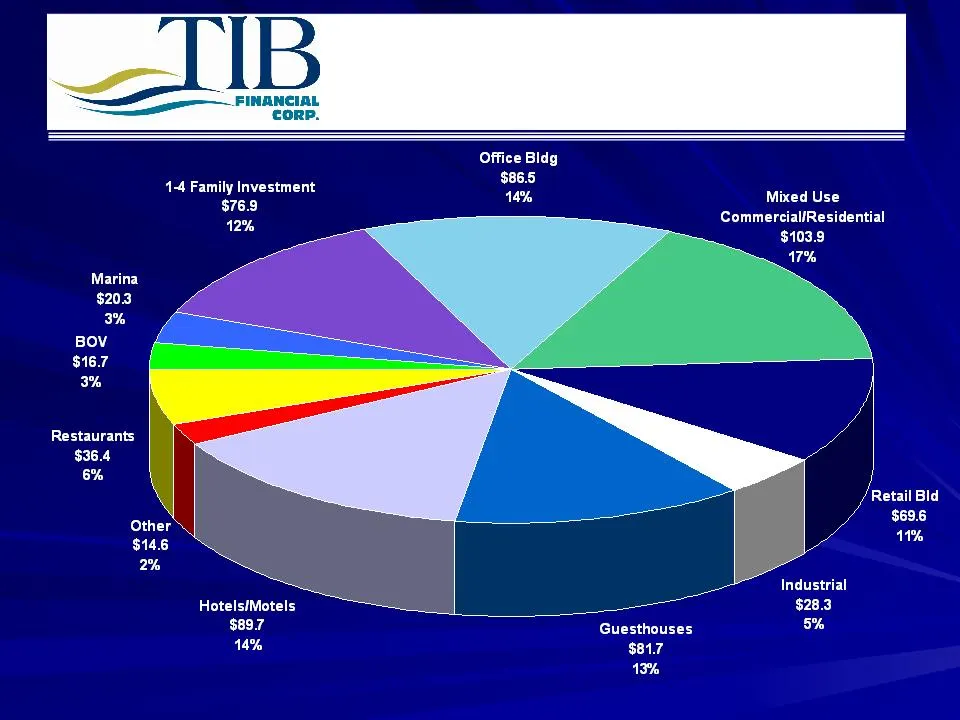
Slide 8: CRE Loans by Collateral Type
TIBB - -GULF SOUTH 2008 # 8 as of 3/31/2008 ($ in millions) CRE Loans by Collateral Type $624.6M
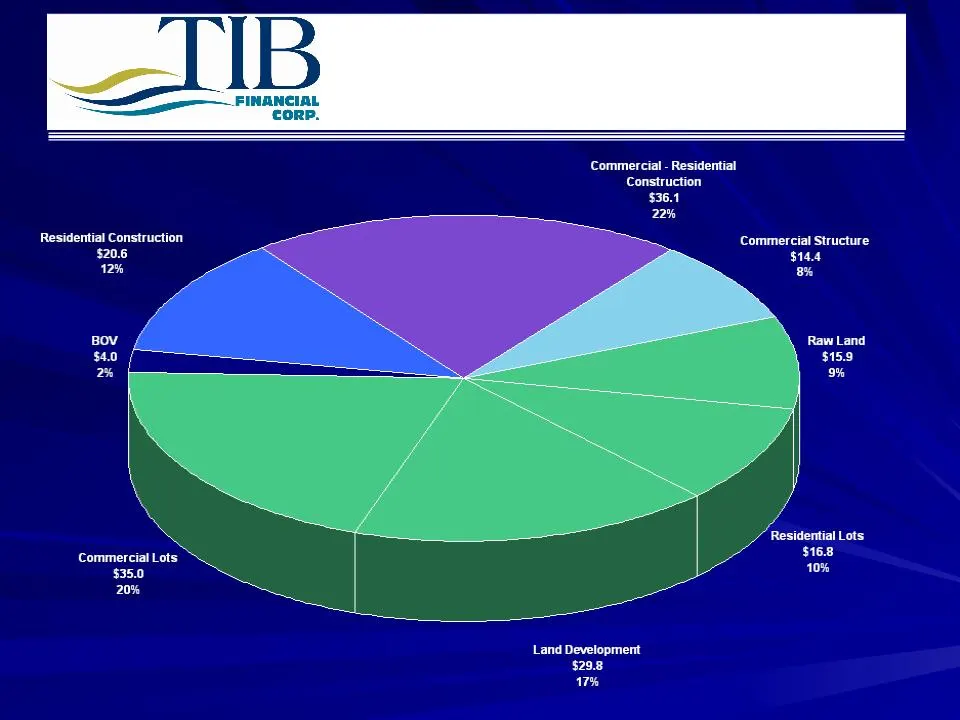
Slide 9: Construction Loan Analysis
TIBB - -GULF SOUTH 2008 # 9 as of 3/31/2008 ($ in millions) Construction Loan Analysis $159.4M

Slide 10: Non-Performing Loans
TIBB - -GULF SOUTH 2008 # 10 March 31, 2008 December 31, 2007 Loan Type # of Loans Outstanding Balance # of Loans Outstanding Balance Residential 24 $5,000 13 $4,442 Commercial and agricultural 2 286 4 293 Commercial real estate 4 2,372 4 2,619 Residential land development - - 1 2,686 Commercial lan

Slide 11: Non-Performing Loans: Impaired and Nonaccrual Loans
TIBB - -GULF SOUTH 2008 # 11 As of 3/31/2008 Impaired Loans are as follows: March 31, 2008 December 31, 2007 Loans w/ no allocated allowance for loan losses $5,783 $4,448 Loans with allocated allowance for loan losses 18,106 3,748 Total 23,889 8,196 Amount of the allowance for loan losses allocated

Slide 12: Non-Performing Loans: OREO Activity
TIBB - -GULF SOUTH 2008 # 12 As of 3/31/2008 OREO ACTIVITY OREO as of December 31, 2007 $1,846 Real estate foreclosures 2,814 Other increases 61 Write-down of value (226) Property sold - OREO at March 31, 2008 $4,495 Non-Performing Loans
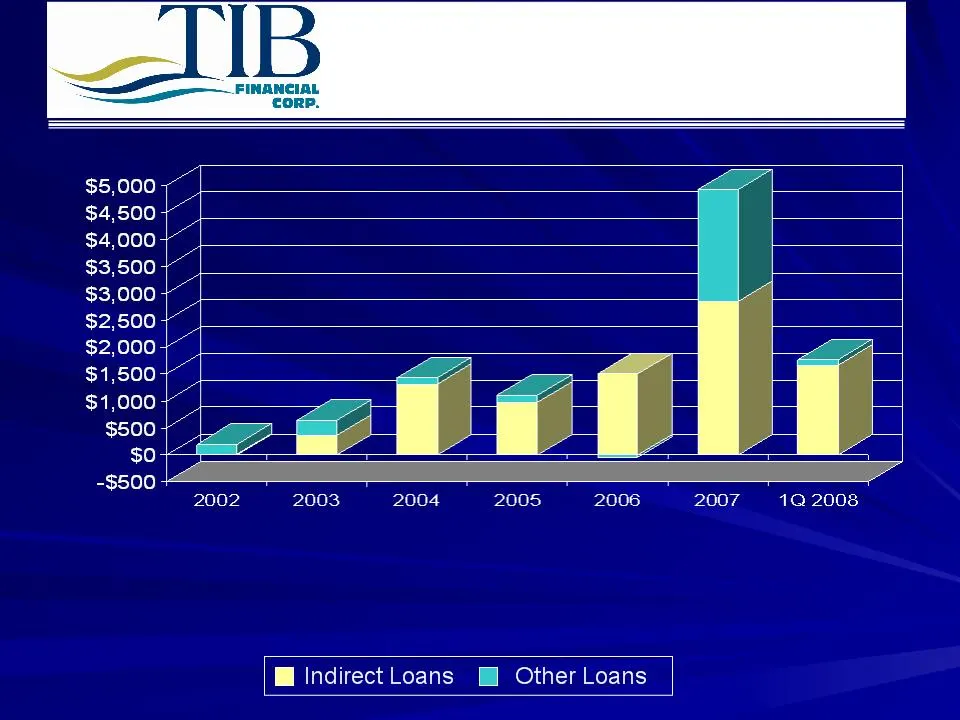
Slide 13: Asset Quality
TIBB - -GULF SOUTH 2008 # 13 Indirect Loans $16 $362 $1,310 $980 $1,502 $2,848 $1,661 Other Loans $178 $280 $118 $130 $(46) $2,084 $110 Total loans 0.05% 0.13% 0.24% 0.14% 0.15% 0.45% 0.63% Indirect Loans 0.19% 0.95% 1.72% 0.92% 1.17% 2.16% 5.8% 194 1,110 1,428 642 1,456 Charge-offs: As of 3/31/2008

Slide 14: Indirect Lending: Current Direction
TIBB - -GULF SOUTH 2008 # 14 Current Direction More Conservative Mix of Loans Portfolio Has and Will Continue to Decline Portfolio Reduction from $141.5M as of December 31, 2006 to $112.2M as of March 31, 2008 Indirect Loan Portfolio as a % of Total Assets on December 31, 2006 of 10.73% declining to
Slide 15: Indirect Lending: Corrective Actions
TIBB - -GULF SOUTH 2008 # 15 Hired BenchMark Consulting International Tightened Underwriting standards Enhanced Management Reporting System New Collection Process Implemented More Effective Disposition of Repossessed Vehicles Created a More Aggressive Recovery Program Indirect Lending
Source: SEC EDGAR · 8-K filed Apr 30, 2008
More decks from Tib Financial Corp
 Gulf South Bank Conference 201016 slides · May 10, 2010
 KBW 10th Annual Community Bank Investor Conference 200926 slides · Jul 28, 2009
 2009 Gulf South Bank Conference16 slides · May 6, 2009
 KBW Community Bank Conference 200813 slides · Jul 28, 2008
 Shareholder Meeting (April 2008)38 slides · Apr 30, 2008
 Sandler O'Neill conference 200723 slides · Nov 13, 2007