Seacoast Banking Corporation of Florida · NASDAQ:SBCF
Seacoast Banking Corporation of Florida — Q2 2021 Earnings Presentation
41 slides from Seacoast Banking Corporation of Florida's earnings presentation, August 2021
Slide 1: Earnings Presentation Second Quarter 2021
Earnings Presentation SECOND QUARTER 2021 INVESTOR PRESENTATION
Slide 2: Cautionary Notice Regarding Forward-Looking Statements
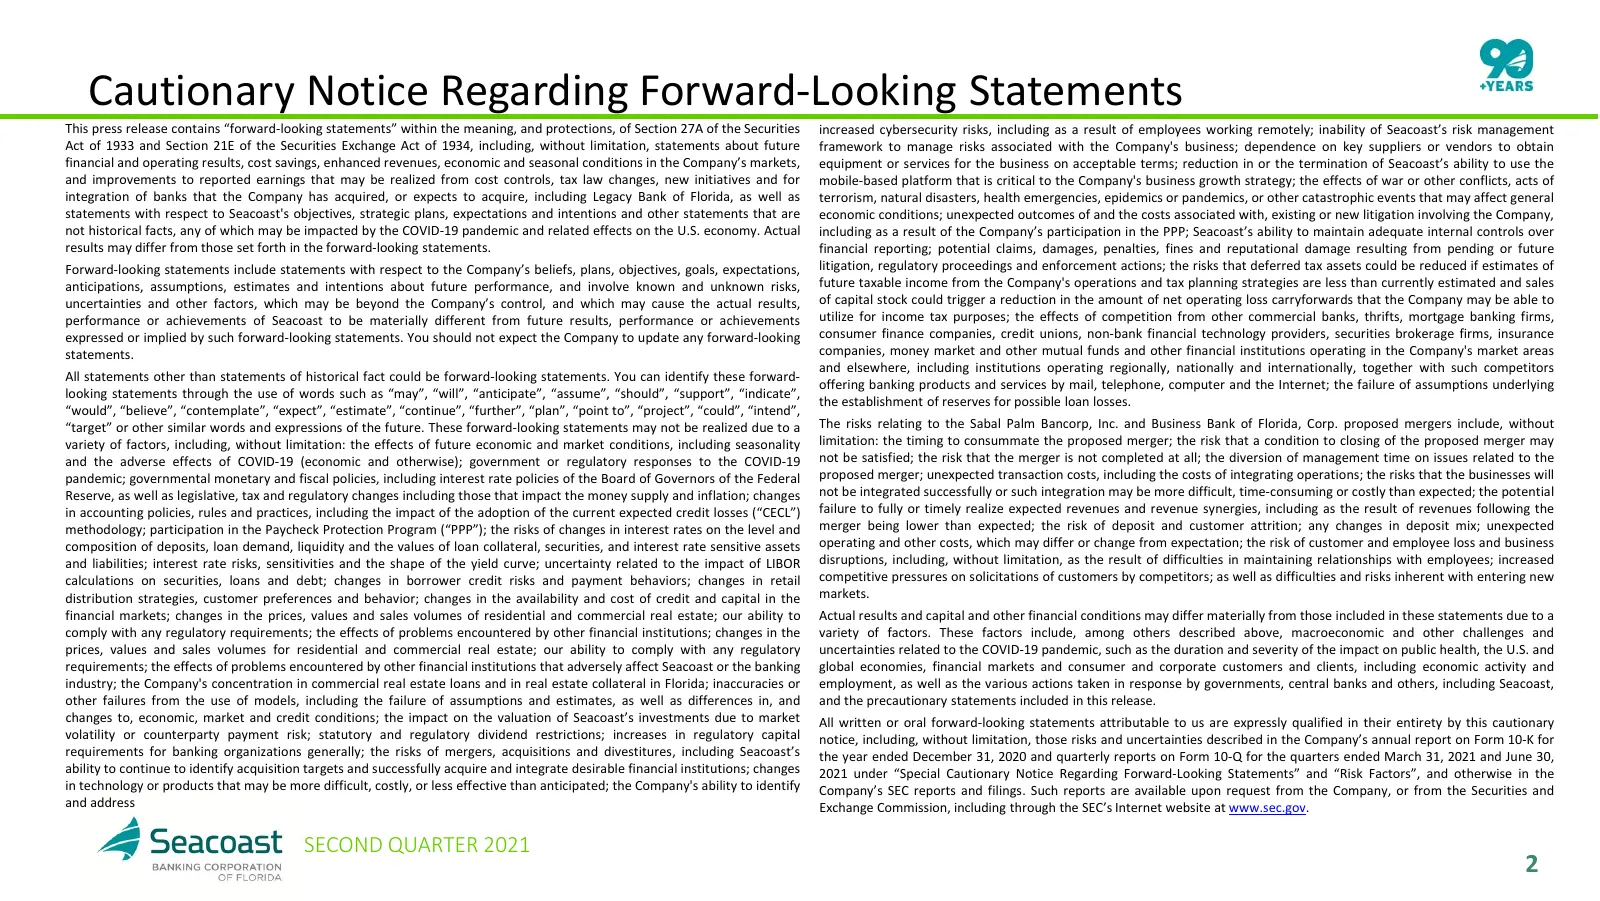
Cautionary Notice Regarding Forward-Looking Statements This press release contains “forward-looking statements” within the meaning, and protections, of Section 27A of the Securities increased cybersecurity risks, including as a result of employees working remotely; inability of Seacoast’s risk manag
Slide 3: Agenda
Agenda 1 ABOUT SEACOAST BANK 2 COMPANY PERFORMANCE 3 LENDING AND CREDIT 4 CAPITAL 5 DIGITAL AND MULTI CHANNEL DISTRIBUTION 6 APPENDIX SECOND QUARTER 2021 3
Slide 4: Valuable Florida Franchise, Well Positioned for Growth
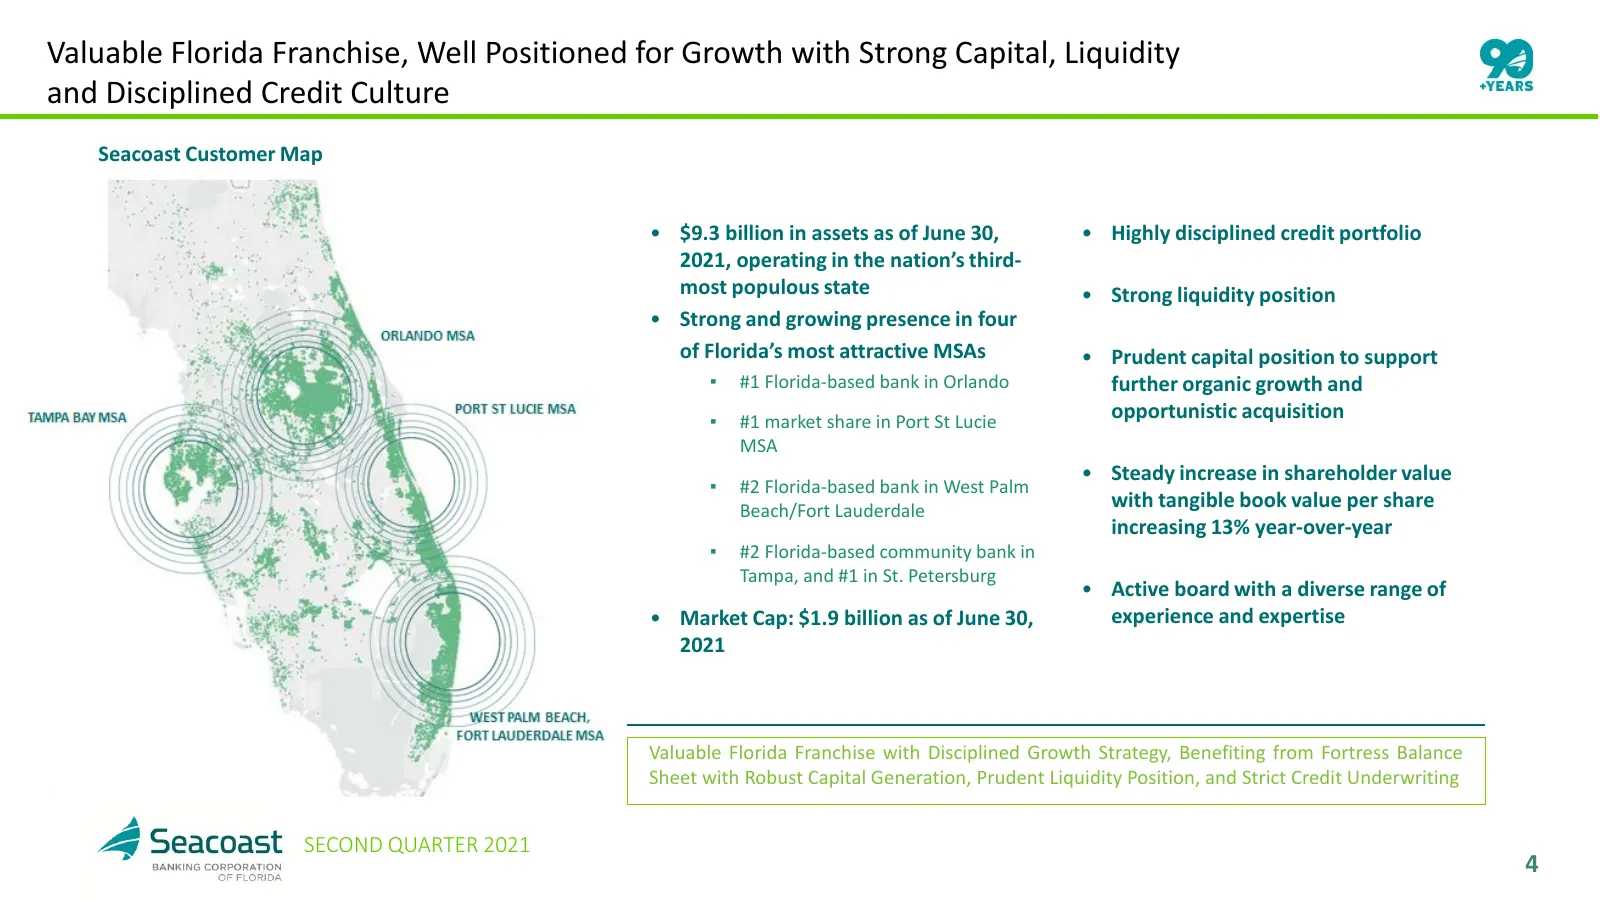
Valuable Florida Franchise, Well Positioned for Growth with Strong Capital, Liquidity and Disciplined Credit Culture Seacoast Customer Map • $9.3 billion in assets as of June 30, • Highly disciplined credit portfolio 2021, operating in the nation’s third- most populous state • Strong liquidity posit
Slide 5: Florida's Economic Growth Continues to Accelerate
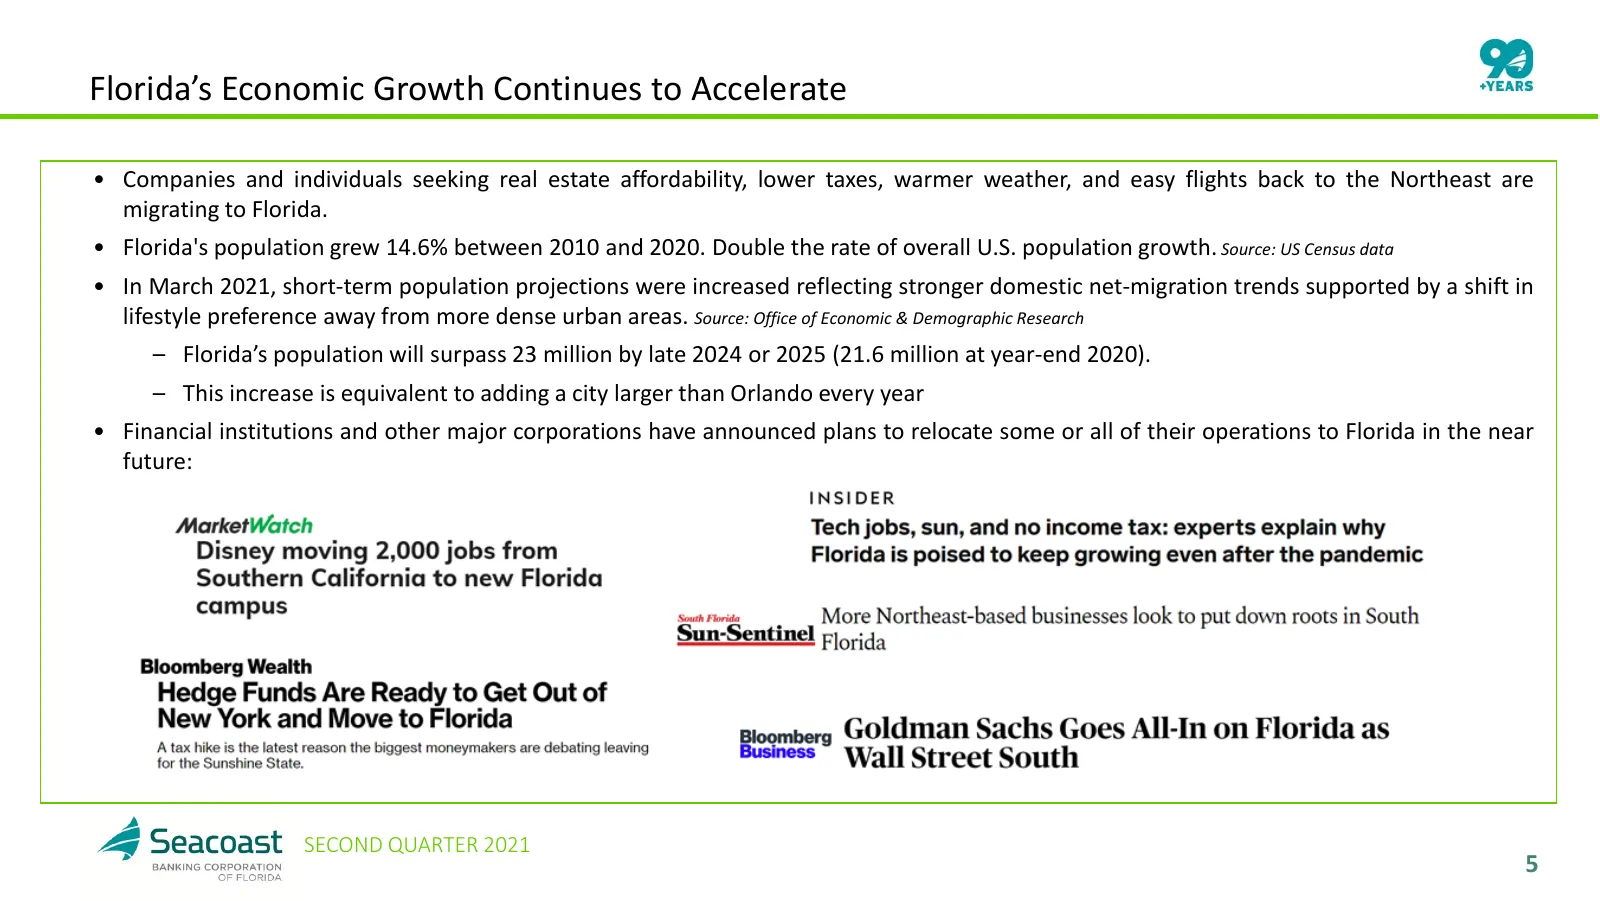
Florida’s Economic Growth Continues to Accelerate • Companies and individuals seeking real estate affordability, lower taxes, warmer weather, and easy flights back to the Northeast are migrating to Florida. • Florida's population grew 14.6% between 2010 and 2020. Double the rate of overall U.S. popu
Slide 6: Seacoast Executes a Differentiated Strategy From Other Community Banks
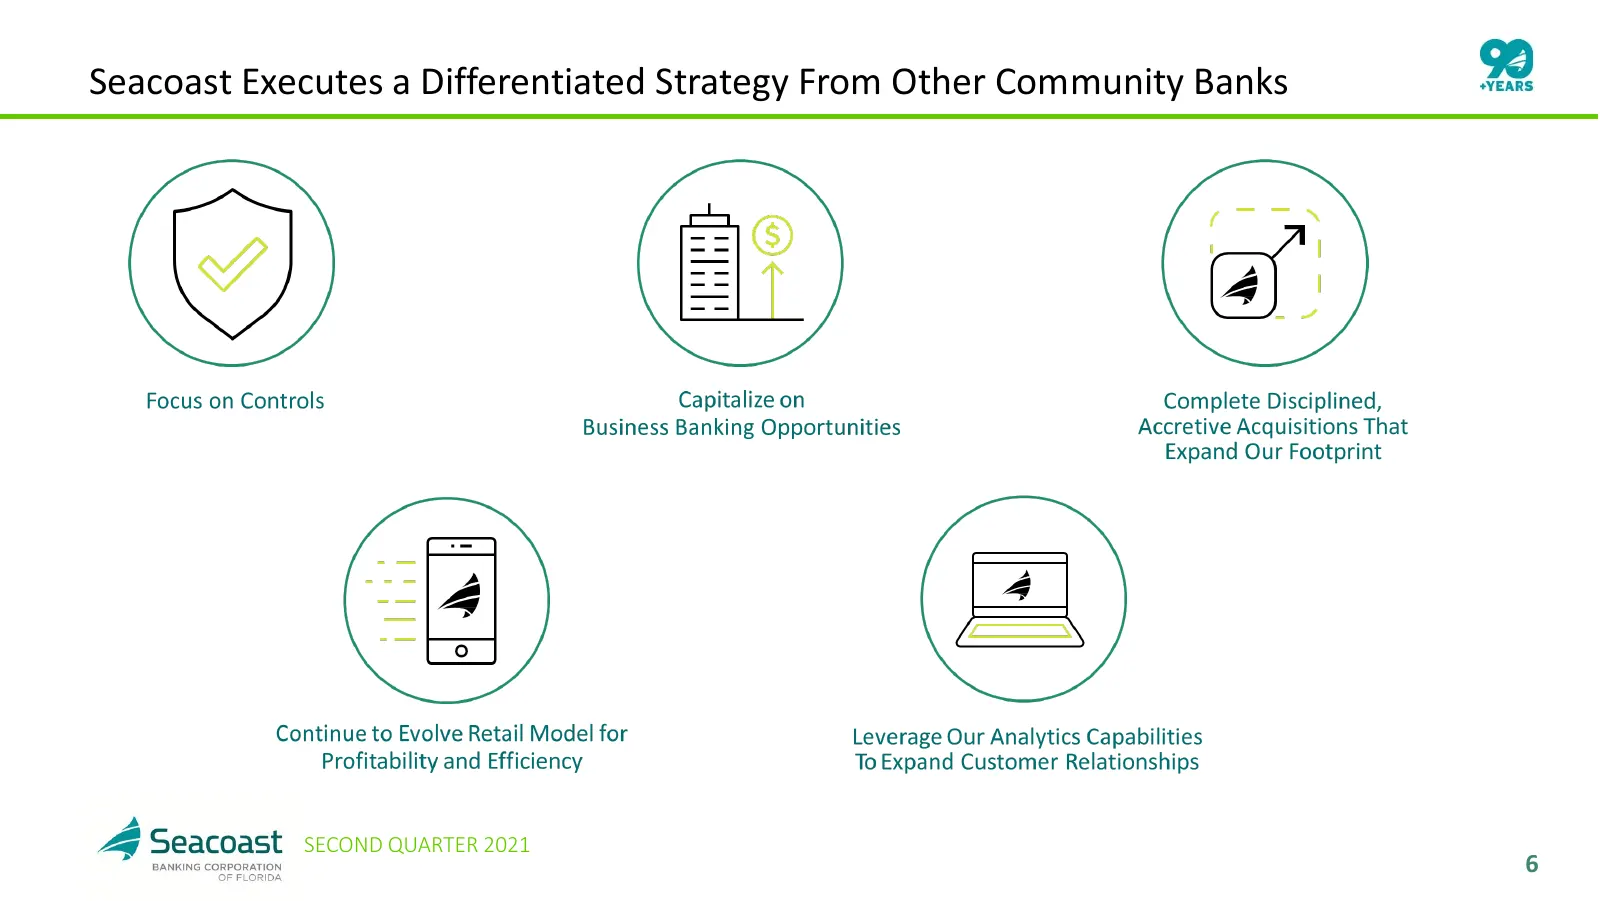
Seacoast Executes a Differentiated Strategy From Other Community Banks SECOND QUARTER 2021 6
Slide 7: Delivering Consistent Growth and Long-Term Value Creation
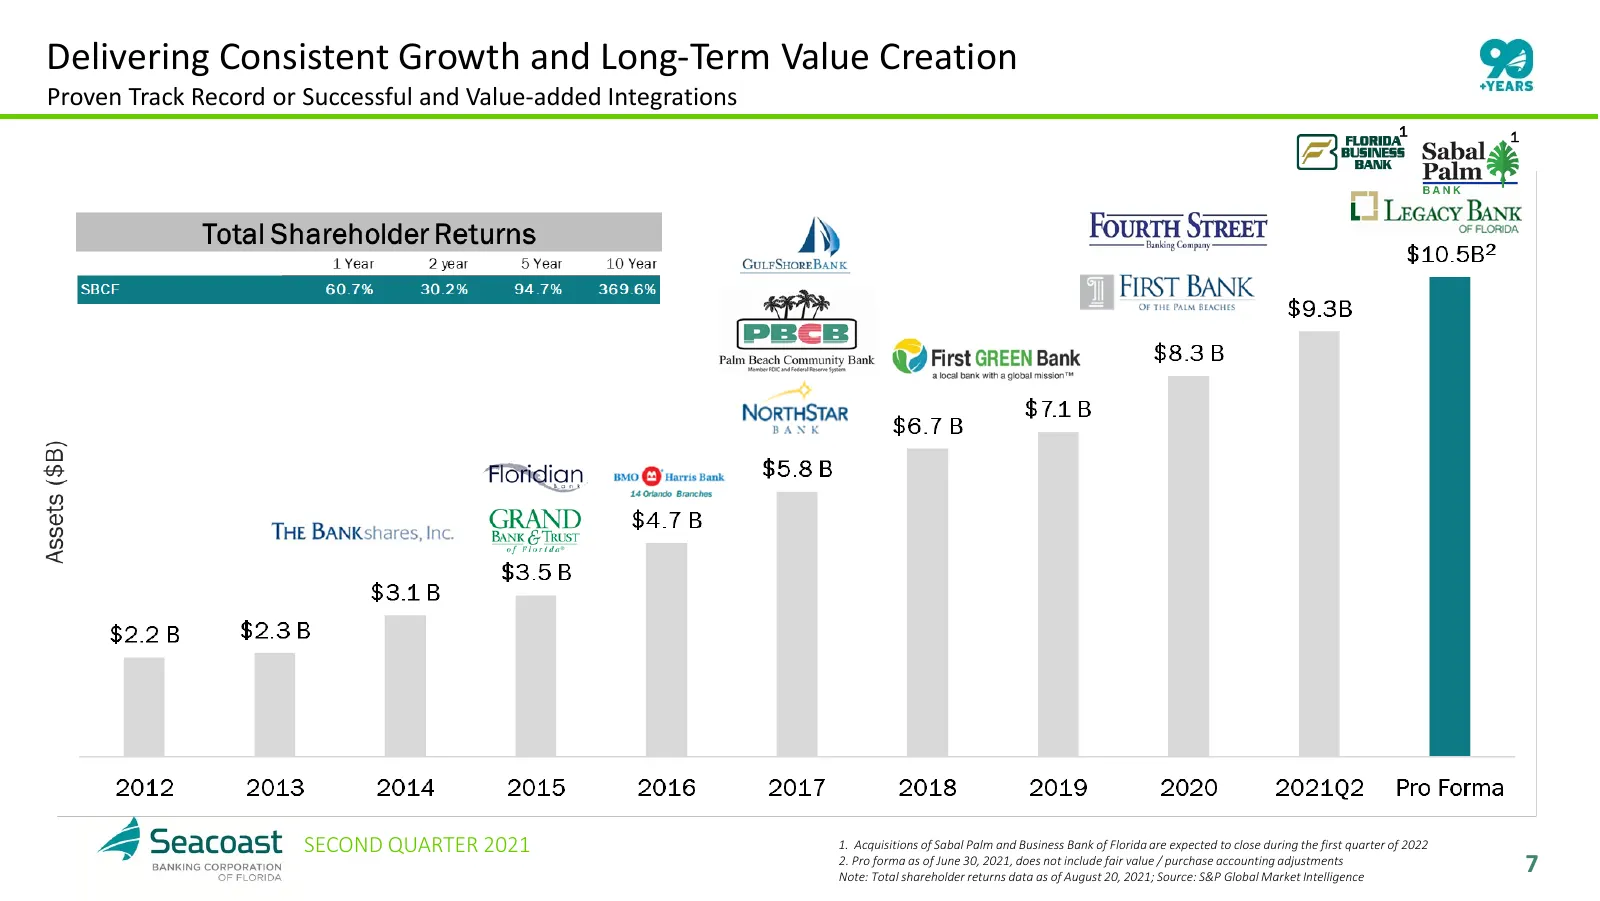
Delivering Consistent Growth and Long-Term Value Creation Proven Track Record or Successful and Value-added Integrations 1 1 SECOND QUARTER 2021 1. Acquisitions of Sabal Palm and Business Bank of Florida are expected to close during the first quarter of 2022 2. Pro forma as of June 30, 2021, does no
Slide 8: Meeting the $10 Billion Asset Threshold Challenge
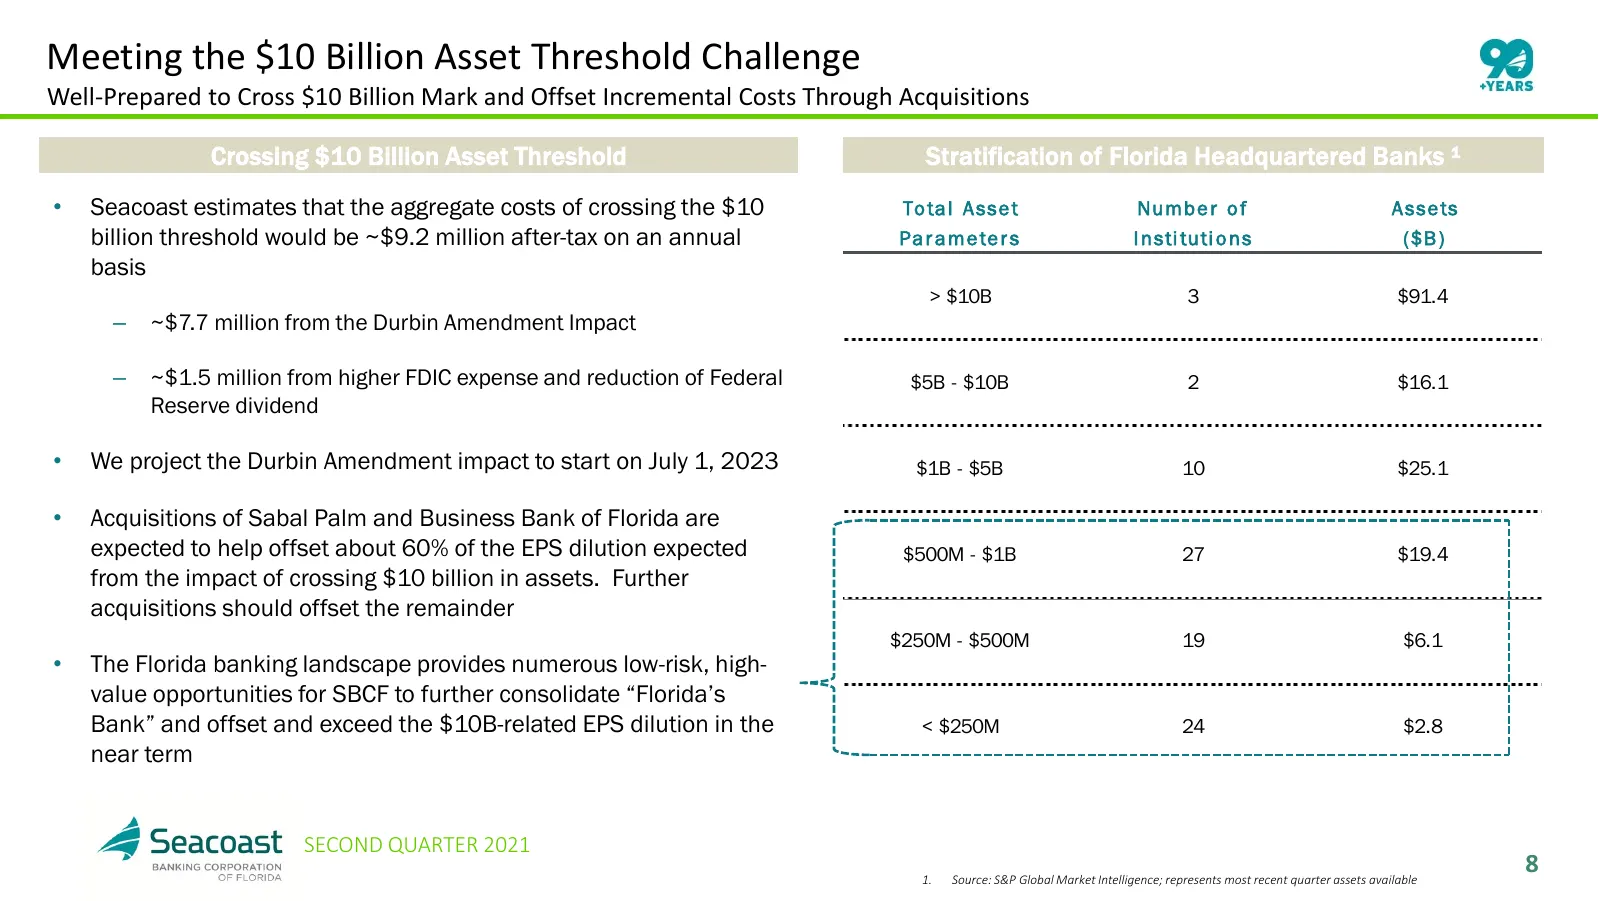
Meeting the $10 Billion Asset Threshold Challenge Well-Prepared to Cross $10 Billion Mark and Offset Incremental Costs Through Acquisitions Crossing $10 Billion Asset Threshold Stratification of Florida Headquartered Banks ¹ • Seacoast estimates that the aggregate costs of crossing the $10 To ta l A
Slide 9: Agenda
Agenda 1 ABOUT SEACOAST BANK 2 COMPANY PERFORMANCE 3 LENDING AND CREDIT 4 CAPITAL 5 DIGITAL AND MULTI CHANNEL DISTRIBUTION 6 APPENDIX SECOND QUARTER 2021 9
Slide 10: Second Quarter 2021 Highlights
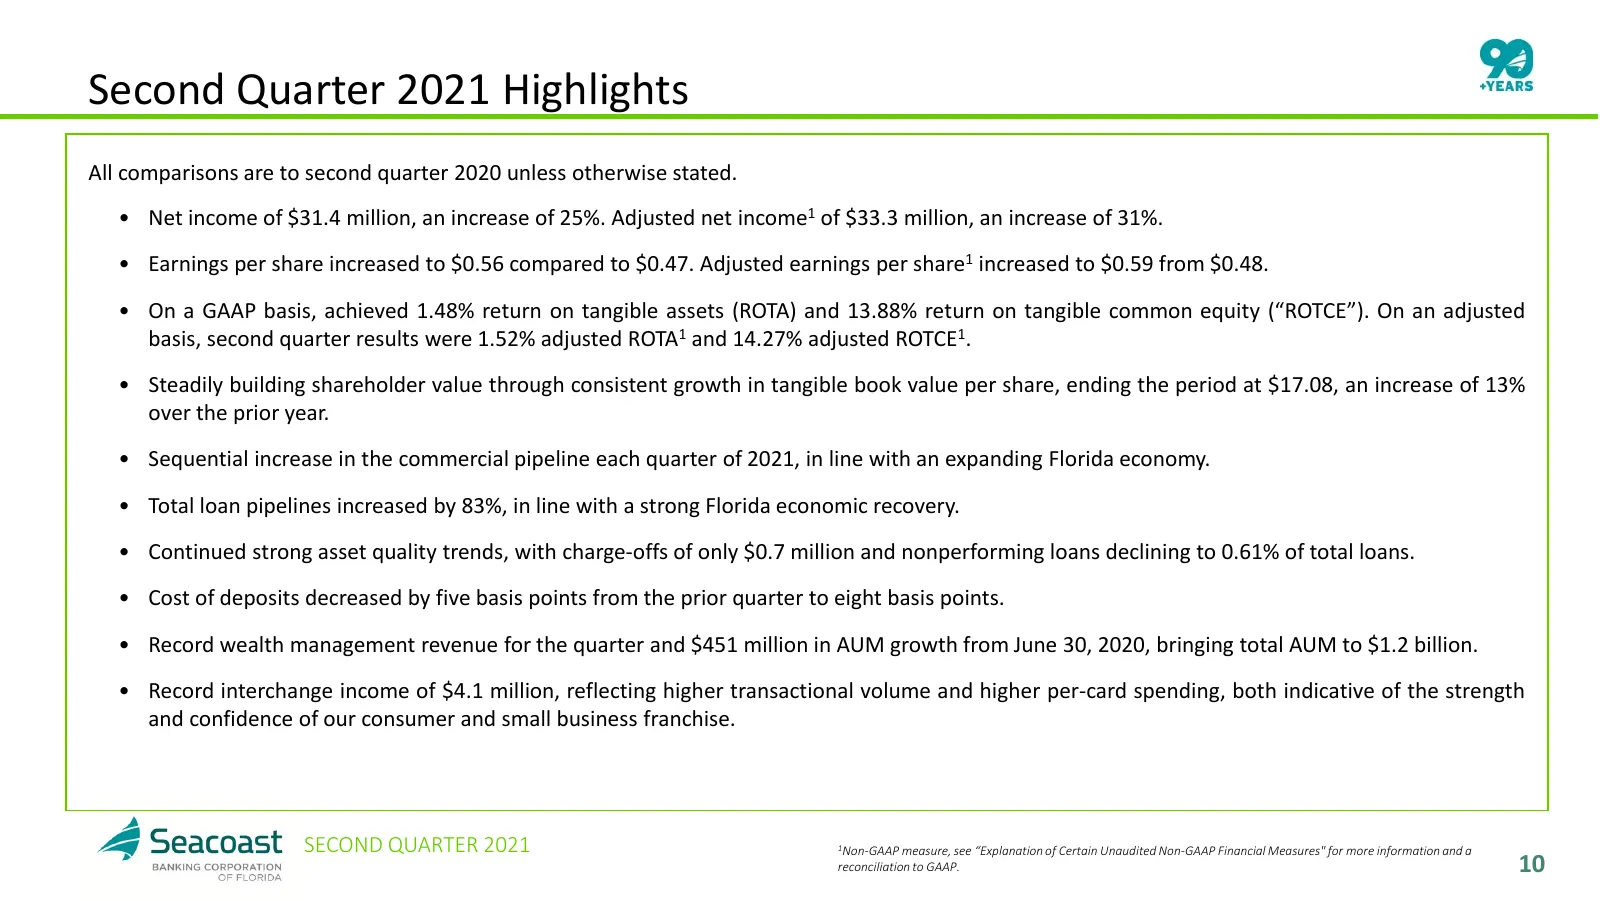
Second Quarter 2021 Highlights All comparisons are to second quarter 2020 unless otherwise stated. • Net income of $31.4 million, an increase of 25%. Adjusted net income1 of $33.3 million, an increase of 31%. • Earnings per share increased to $0.56 compared to $0.47. Adjusted earnings per share1 inc
Slide 11: Net Interest Income and Margin
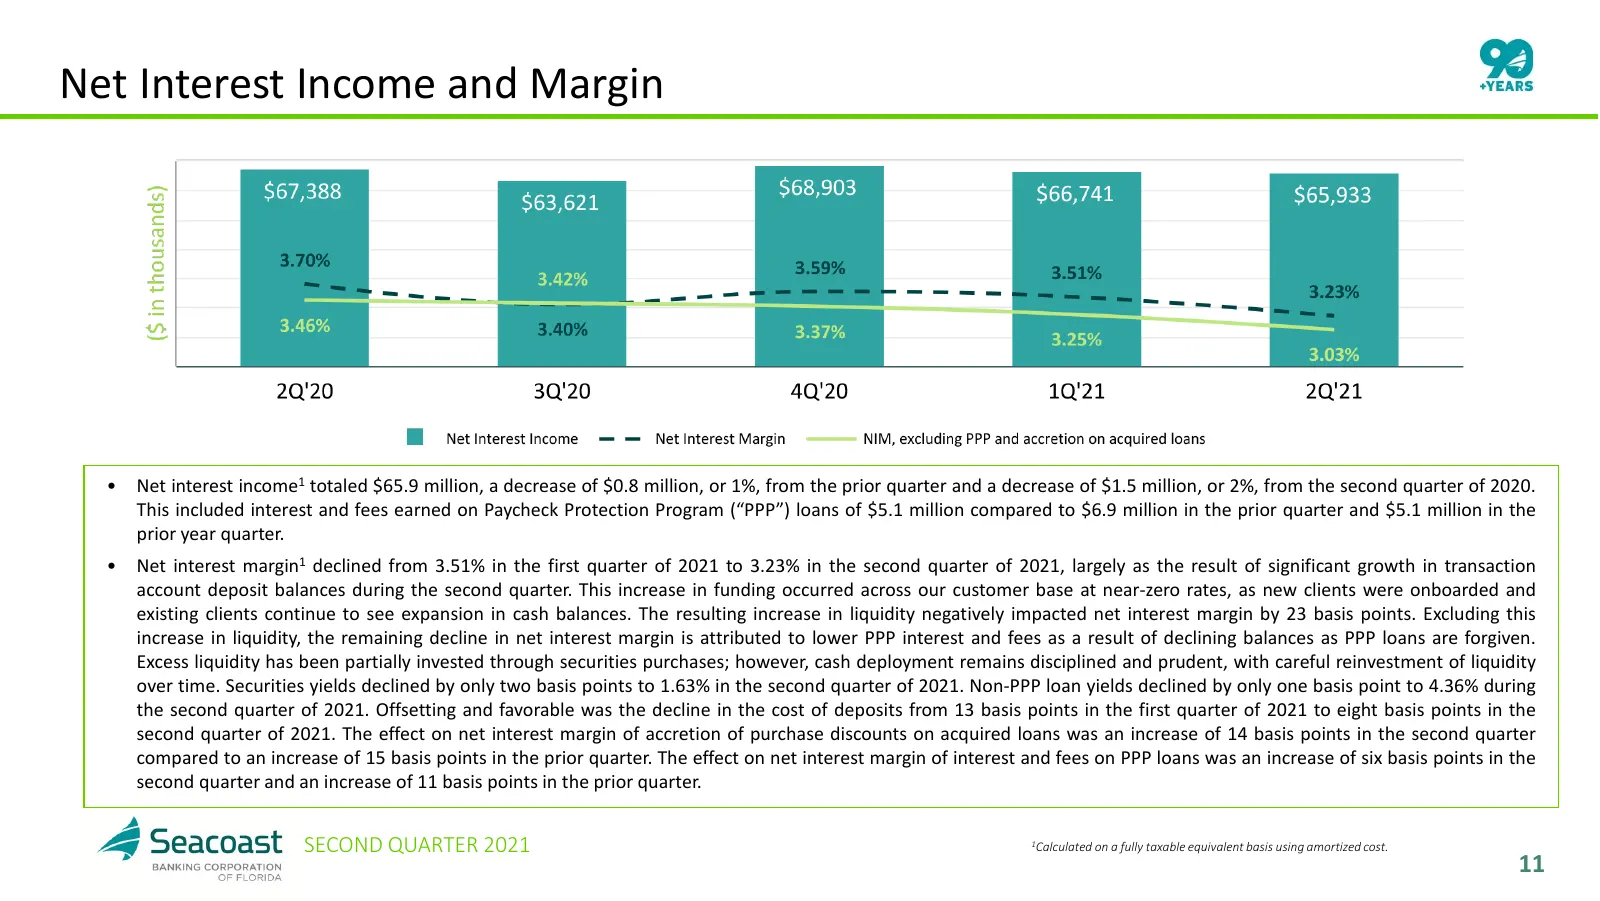
Net Interest Income and Margin • Net interest income1 totaled $65.9 million, a decrease of $0.8 million, or 1%, from the prior quarter and a decrease of $1.5 million, or 2%, from the second quarter of 2020. This included interest and fees earned on Paycheck Protection Program (“PPP”) loans of $5.1 m
Slide 12: Continued Strength in Noninterest Income
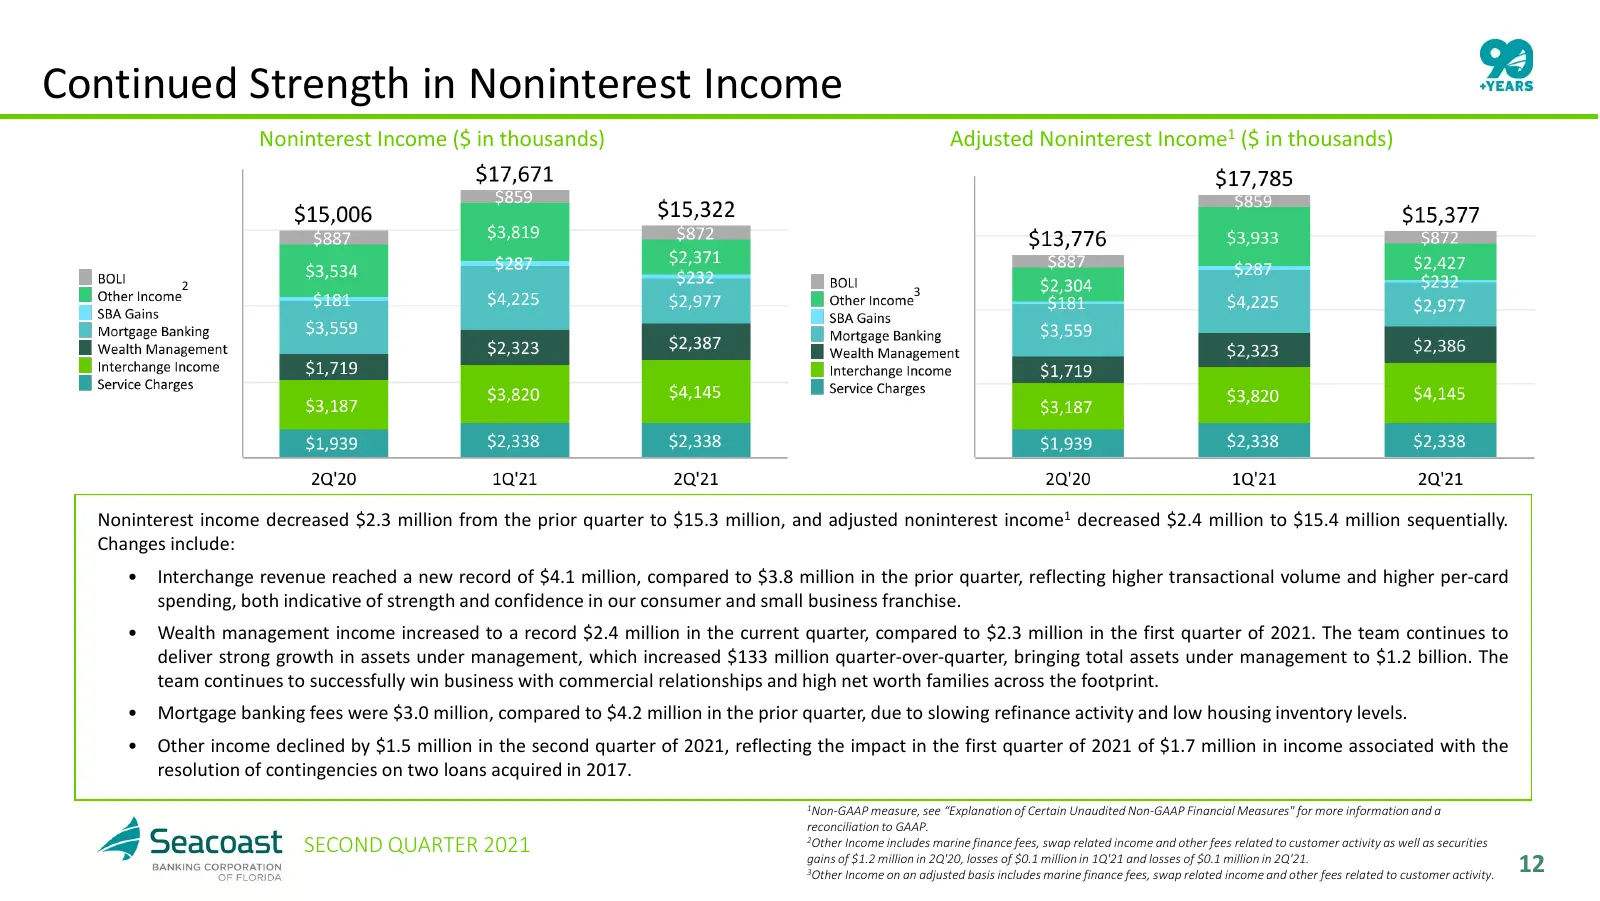
Continued Strength in Noninterest Income Noninterest Income ($ in thousands) Adjusted Noninterest Income1 ($ in thousands) 2 3 Noninterest income decreased $2.3 million from the prior quarter to $15.3 million, and adjusted noninterest income1 decreased $2.4 million to $15.4 million sequentially. Cha
Slide 13: Continued Focus on Disciplined Expense Control
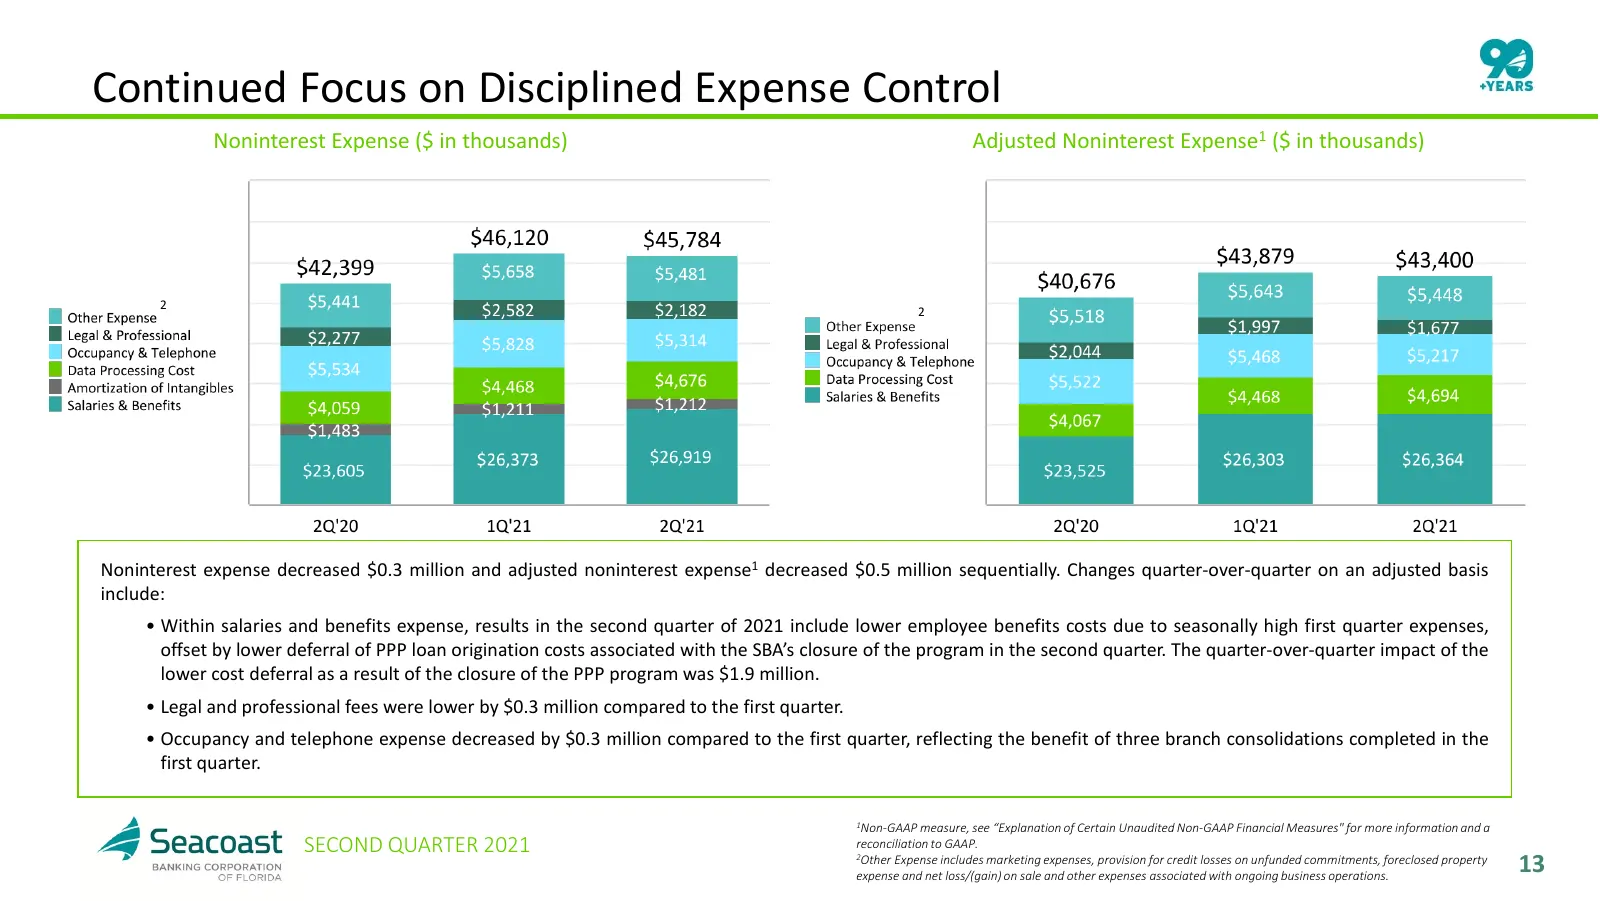
Continued Focus on Disciplined Expense Control Noninterest Expense ($ in thousands) Adjusted Noninterest Expense1 ($ in thousands) 2 2 Noninterest expense decreased $0.3 million and adjusted noninterest expense1 decreased $0.5 million sequentially. Changes quarter-over-quarter on an adjusted basis i
Slide 14: Efficiency Ratio Trend
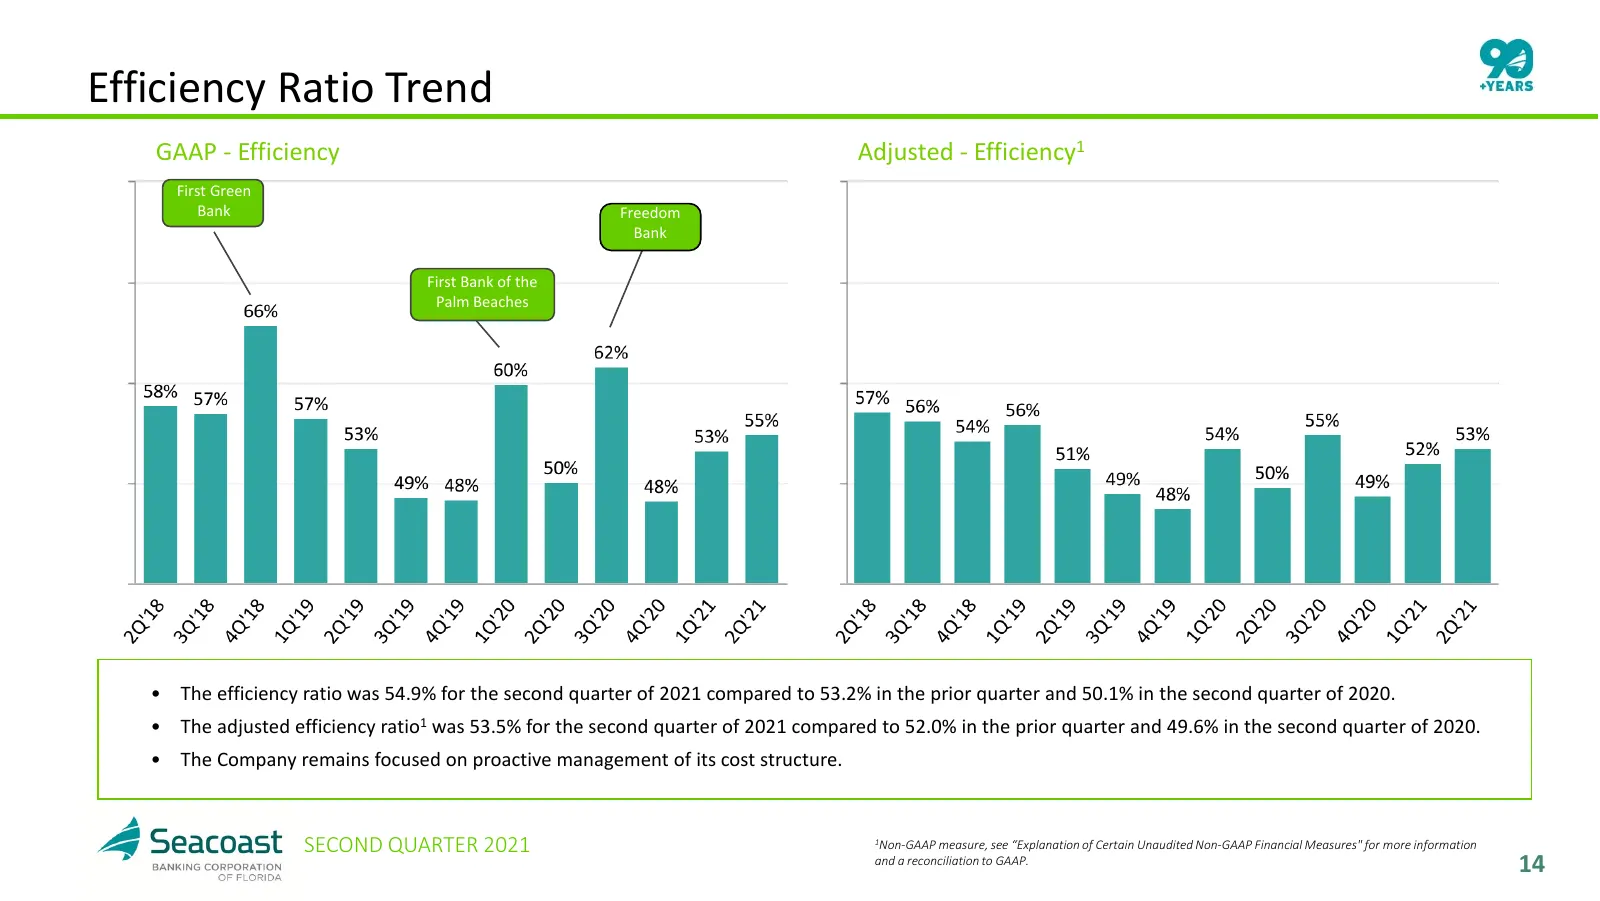
Efficiency Ratio Trend GAAP - Efficiency Adjusted - Efficiency1 First Green Palm Beach Bank Freedom Community Bank Bank and North Star Bank First Bank of the Acquisitions Palm Beaches Palm Beach Community and North Star Bank Acquisition • The efficiency ratio was 54.9% for the second quarter of 2021
Slide 15: Disciplined Approach to Lending in an Expanding Florida Economy
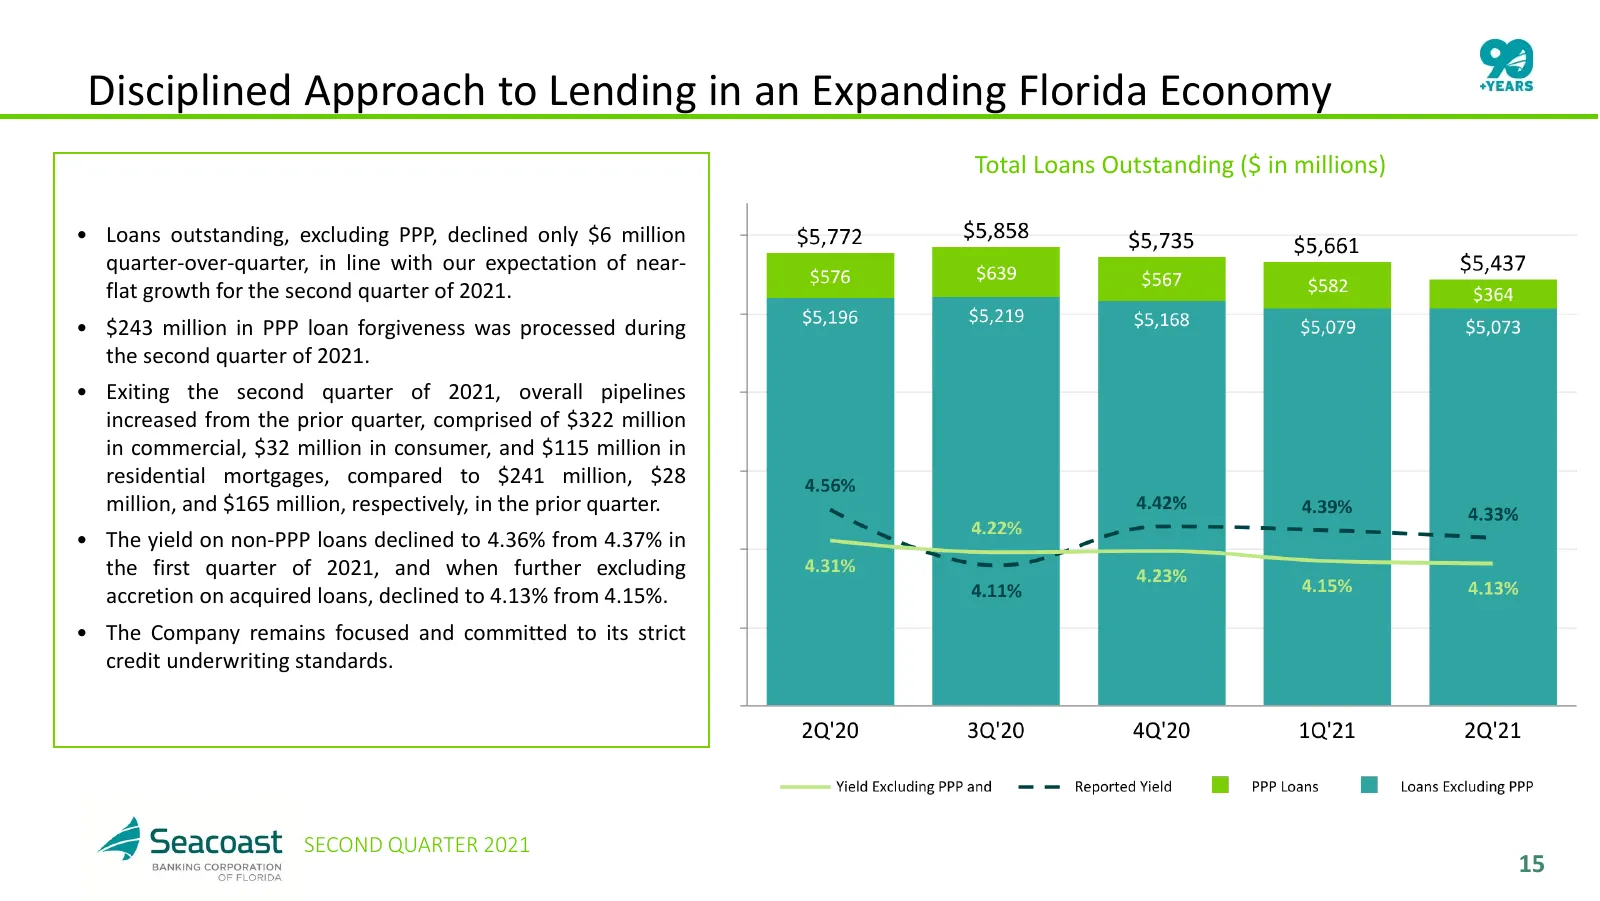
Disciplined Approach to Lending in an Expanding Florida Economy Total Loans Outstanding ($ in millions) • Loans outstanding, excluding PPP, declined only $6 million quarter-over-quarter, in line with our expectation of near- flat growth for the second quarter of 2021. • $243 million in PPP loan forg
Slide 16: Strong Deposit Franchise Supported by Attractive Markets
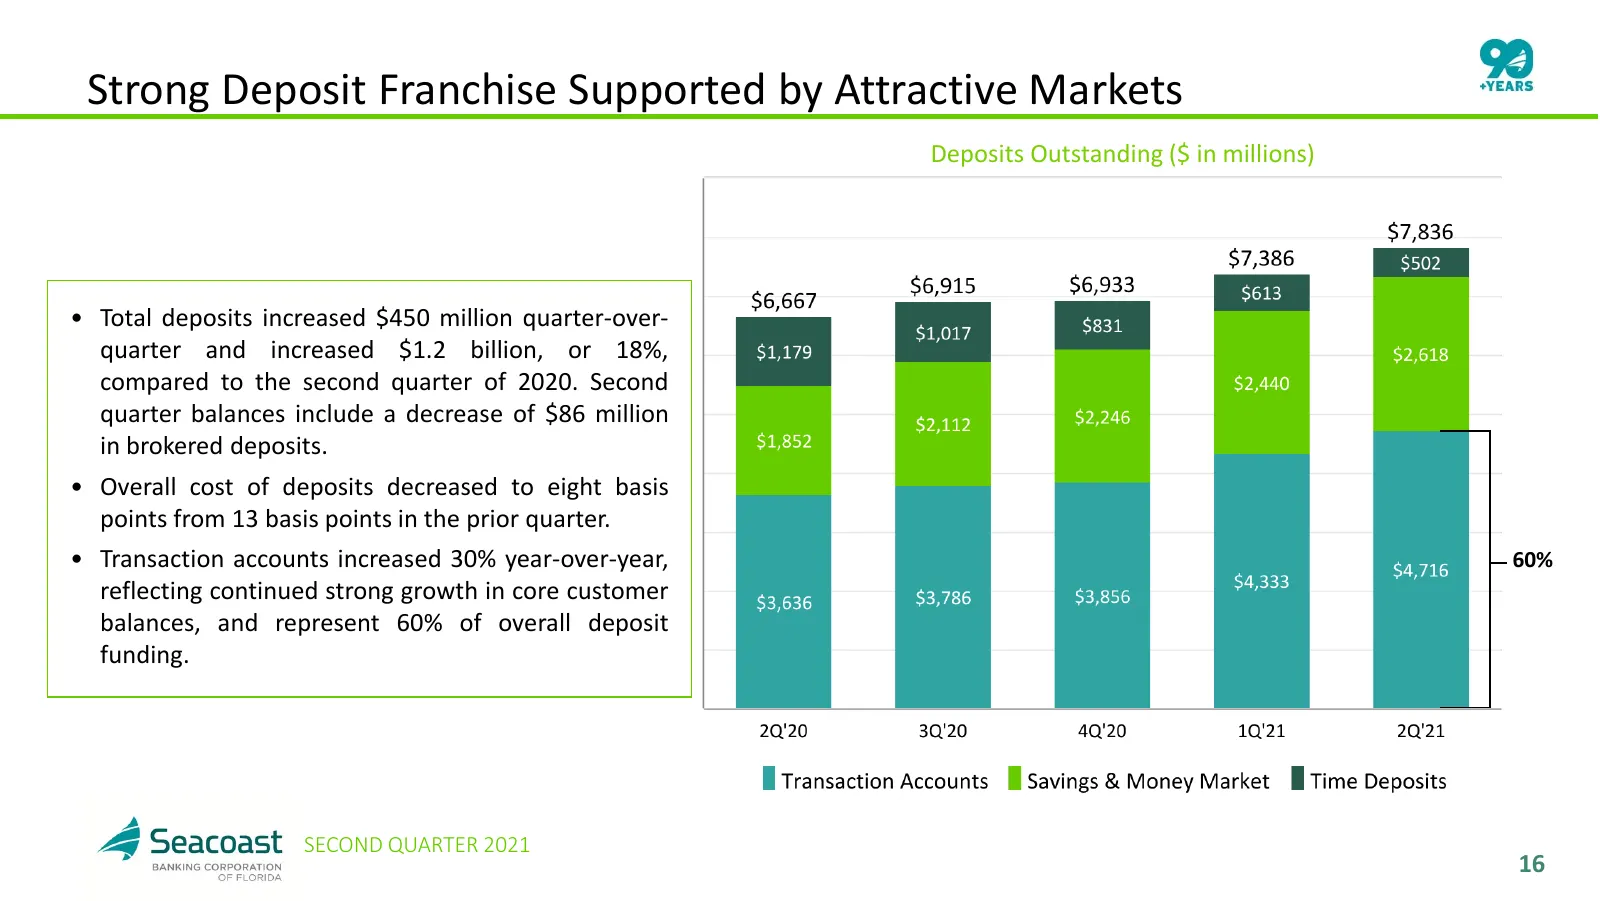
Strong Deposit Franchise Supported by Attractive Markets Deposits Outstanding ($ in millions) • Total deposits increased $450 million quarter-over- quarter and increased $1.2 billion, or 18%, compared to the second quarter of 2020. Second quarter balances include a decrease of $86 million in brokere
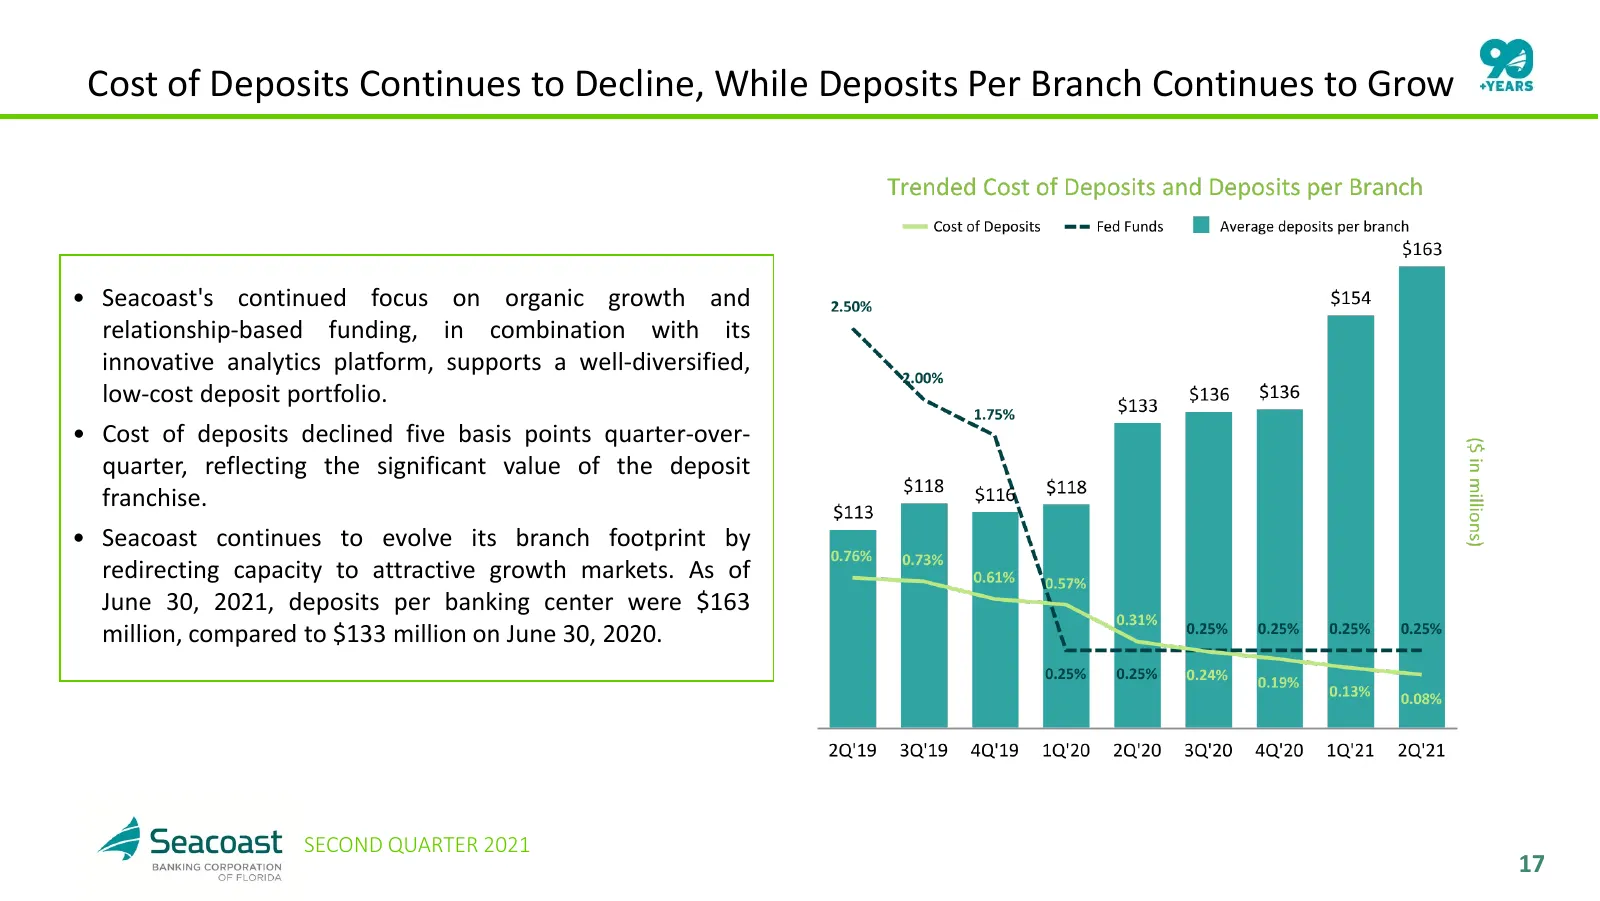
Slide 17: Cost of Deposits Continues to Decline
Cost of Deposits Continues to Decline, While Deposits Per Branch Continues to Grow • Seacoast's continued focus on organic growth and relationship-based funding, in combination with its innovative analytics platform, supports a well-diversified, low-cost deposit portfolio. • Cost of deposits decline
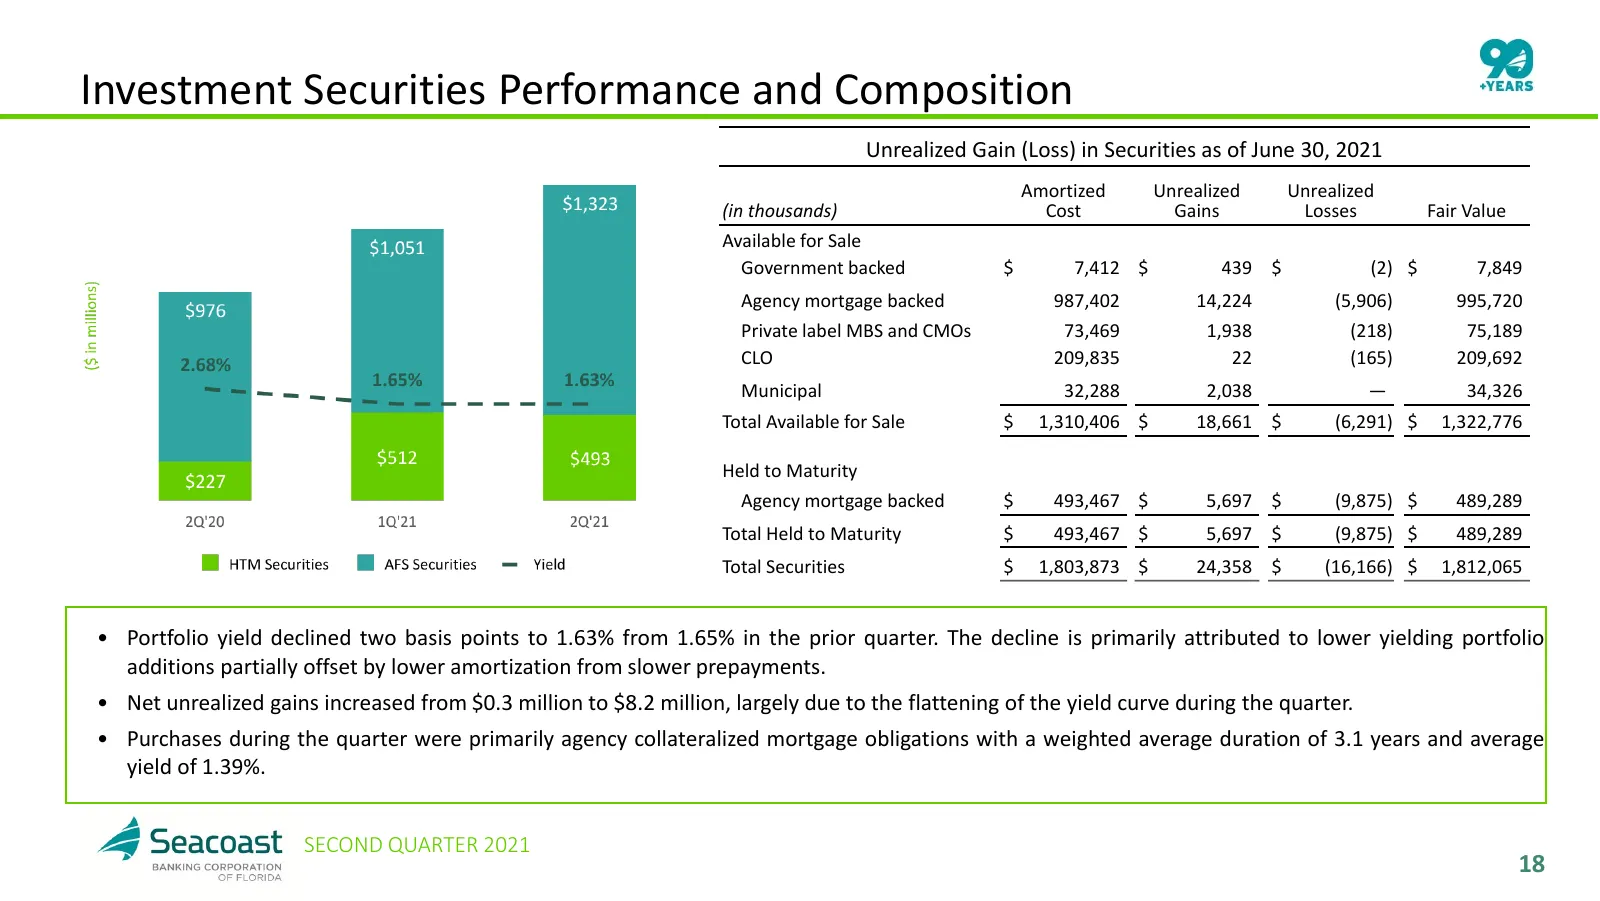
Slide 18: Investment Securities Performance and Composition
Investment Securities Performance and Composition Unrealized Gain (Loss) in Securities as of June 30, 2021 Amortized Unrealized Unrealized (in thousands) Cost Gains Losses Fair Value Available for Sale Government backed $ 7,412 $ 439 $ (2) $ 7,849 Agency mortgage backed 987,402 14,224 (5,906) 995,72
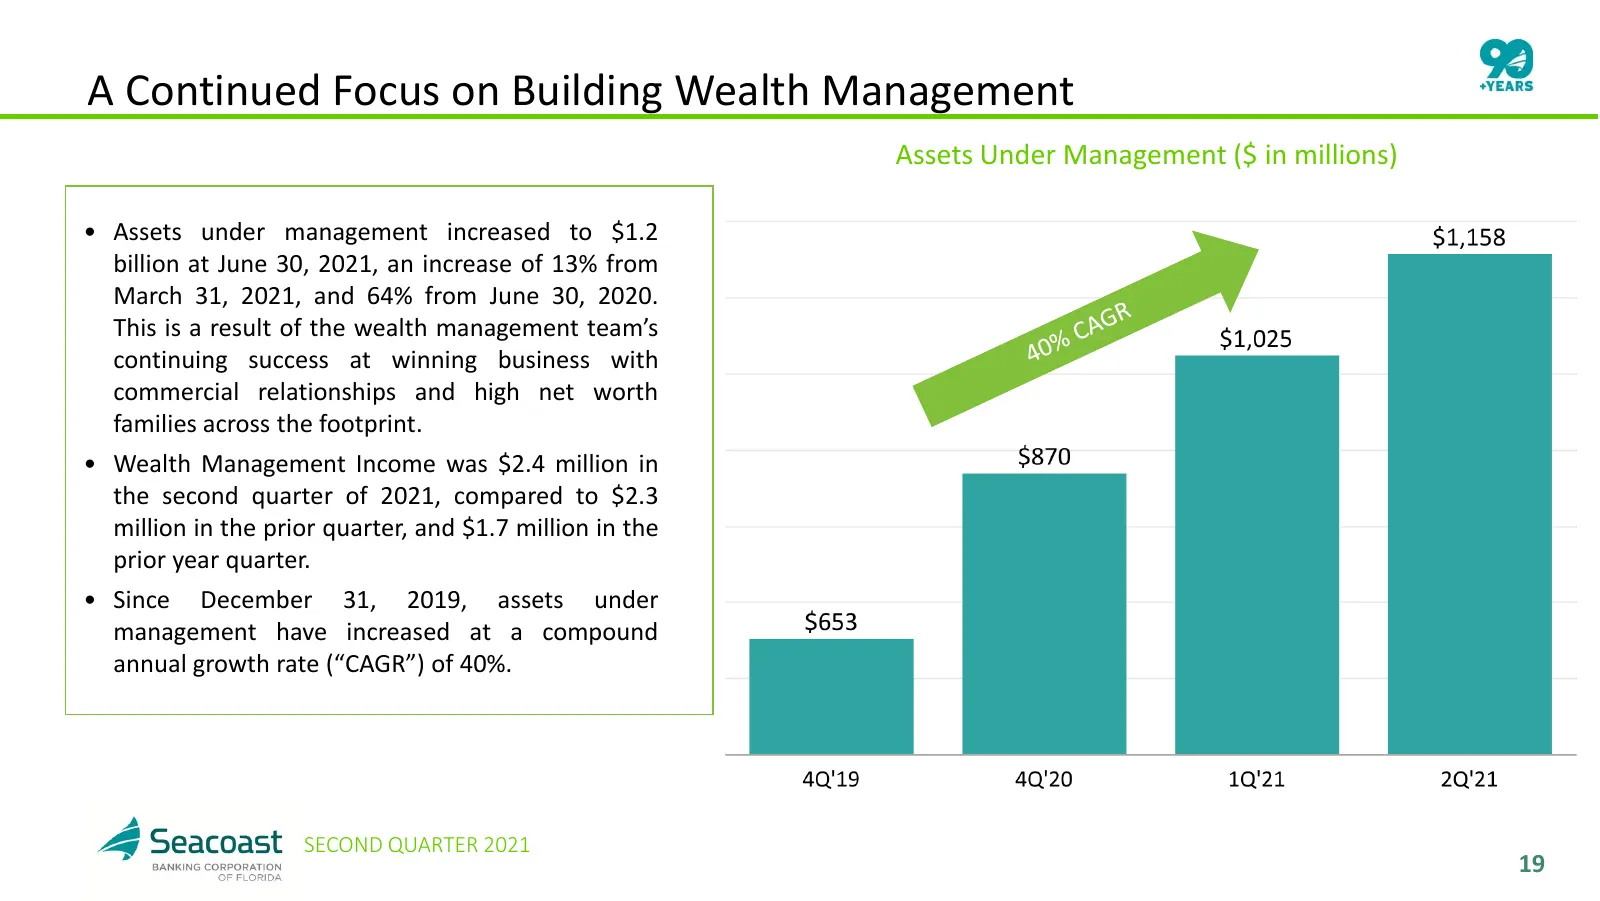
Slide 19: A Continued Focus on Building Wealth Management
A Continued Focus on Building Wealth Management Assets Under Management ($ in millions) • Assets under management increased to $1.2 billion at June 30, 2021, an increase of 13% from March 31, 2021, and 64% from June 30, 2020. This is a result of the wealth management team’s continuing success at win
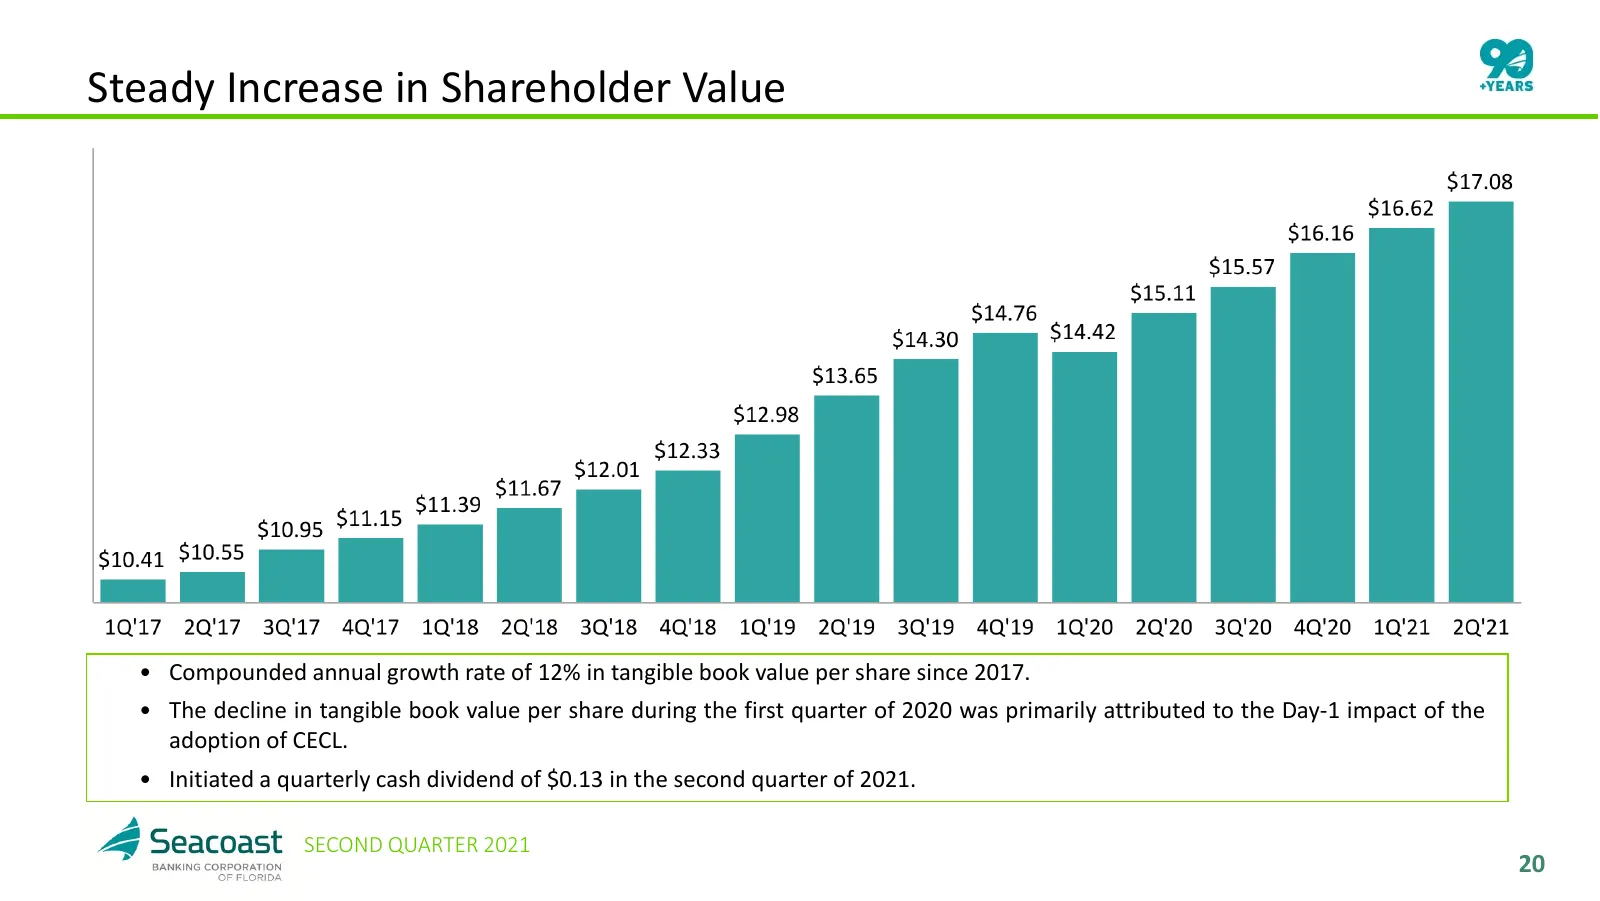
Slide 20: Steady Increase in Shareholder Value
Steady Increase in Shareholder Value • Compounded annual growth rate of 12% in tangible book value per share since 2017. • The decline in tangible book value per share during the first quarter of 2020 was primarily attributed to the Day-1 impact of the adoption of CECL. • Initiated a quarterly cash
Slide 21: Agenda
Agenda 1 ABOUT SEACOAST BANK 2 COMPANY PERFORMANCE 3 LENDING AND CREDIT 4 CAPITAL 5 DIGITAL AND MULTI CHANNEL DISTRIBUTION 6 APPENDIX SECOND QUARTER 2021 21
Slide 22: Seacoast's Lending Strategy Sustains a Diverse Loan Portfolio
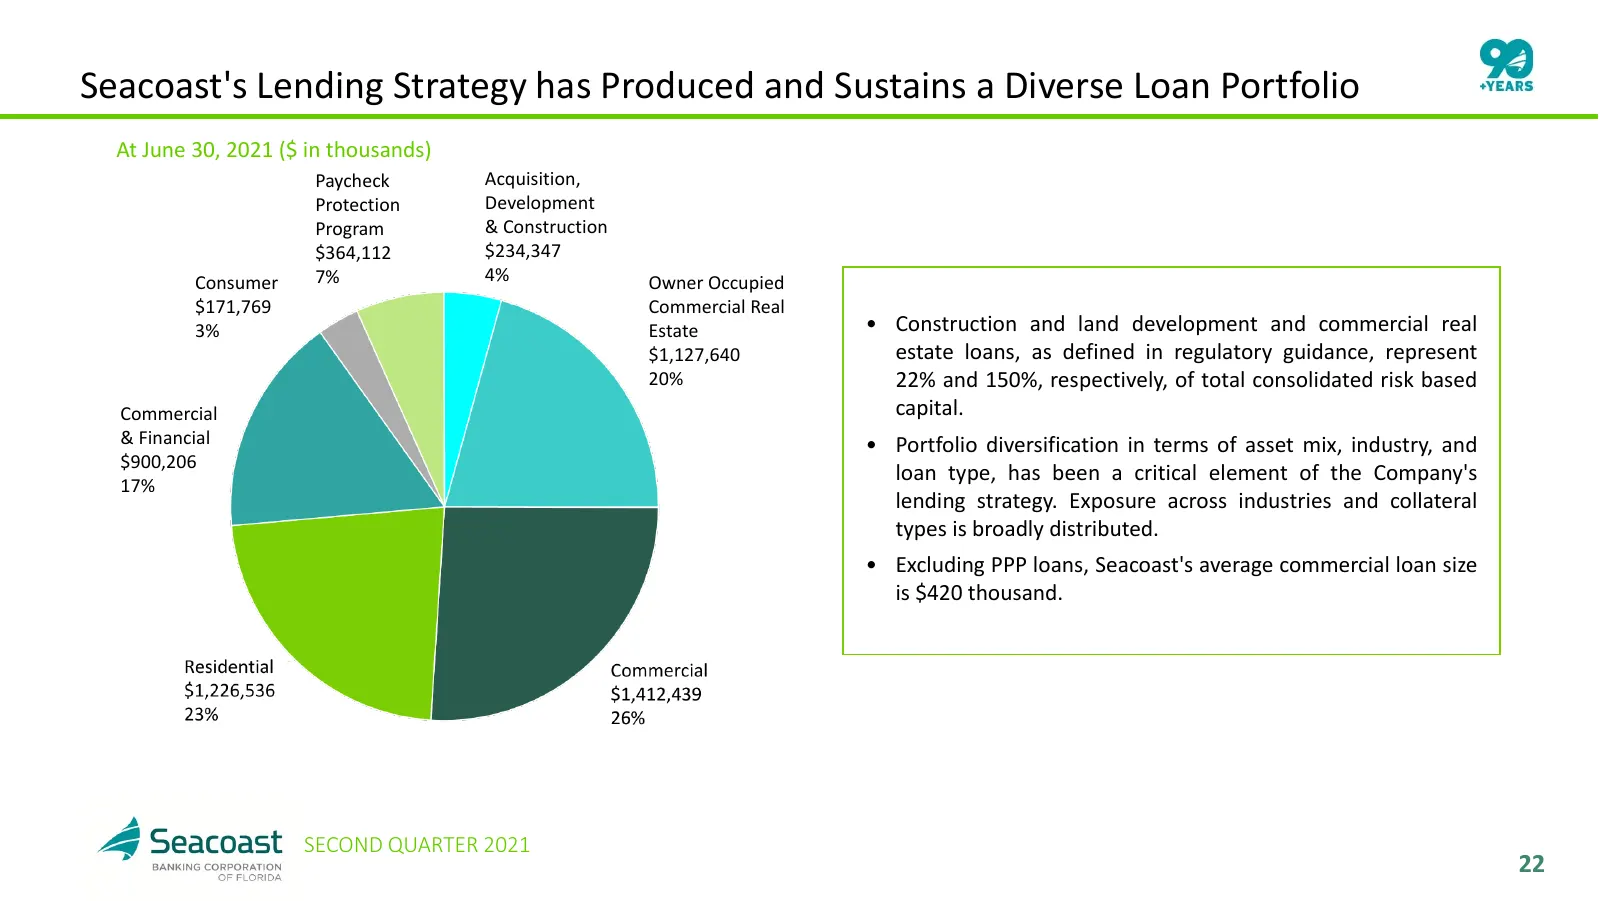
Seacoast's Lending Strategy has Produced and Sustains a Diverse Loan Portfolio At June 30, 2021 ($ in thousands) Paycheck Acquisition, Protection Development Program & Construction $364,112 $234,347 Consumer 7% 4% Owner Occupied $171,769 Commercial Real 3% Estate • Construction and land development
Slide 23: Paycheck Protection Program Loans
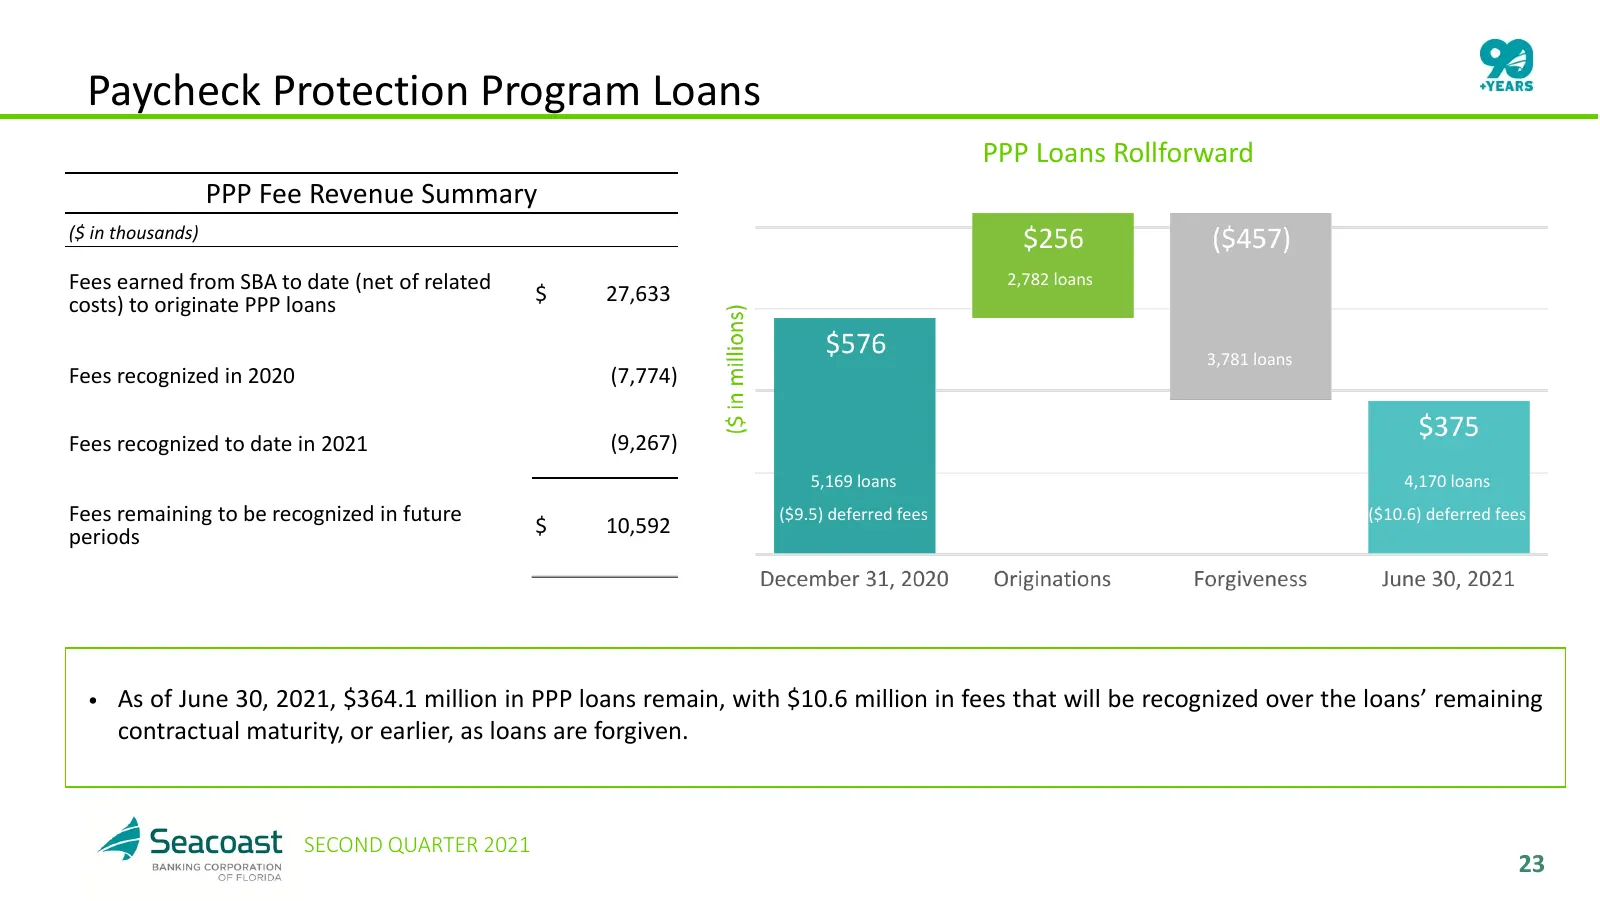
Paycheck Protection Program Loans PPP Loans Rollforward PPP Fee Revenue Summary ($ in thousands) Fees earned from SBA to date (net of related $ 27,633 2,782 loans costs) to originate PPP loans 3,781 loans Fees recognized in 2020 (7,774) Fees recognized to date in 2021 (9,267) 5,169 loans 4,170 loans
Slide 24: Allowance for Credit Losses and Purchase Discount
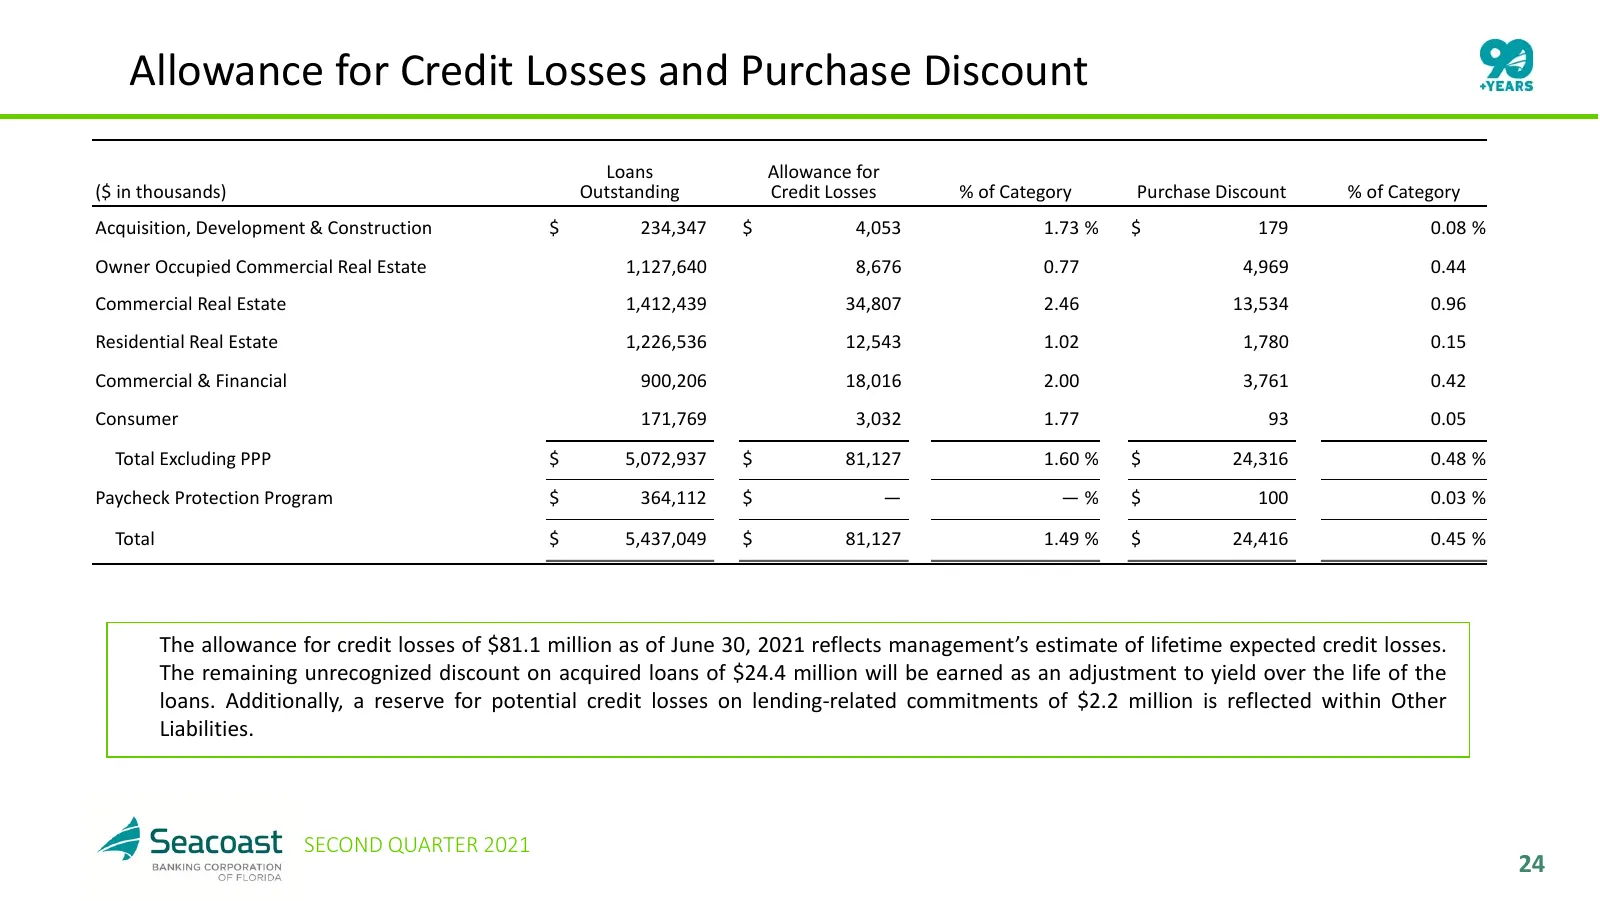
Allowance for Credit Losses and Purchase Discount Loans Allowance for ($ in thousands) Outstanding Credit Losses % of Category Purchase Discount % of Category Acquisition, Development & Construction $ 234,347 $ 4,053 1.73 % $ 179 0.08 % Owner Occupied Commercial Real Estate 1,127,640 8,676 0.77 4,96
Slide 25: Continued Strong Asset Quality Trends
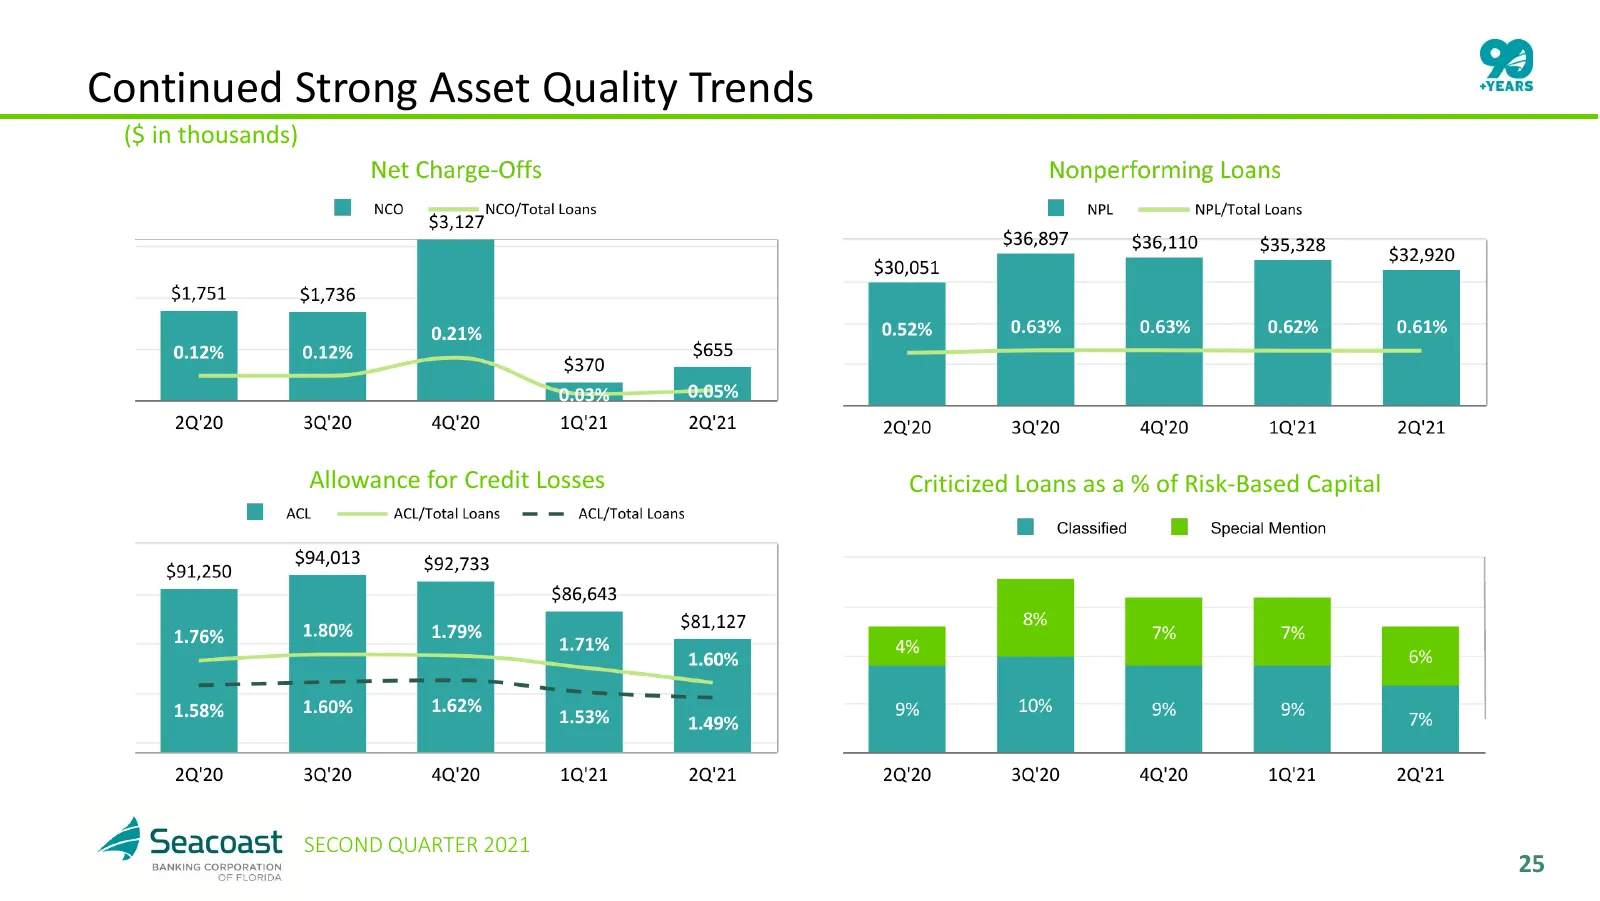
Continued Strong Asset Quality Trends ($ in thousands) Allowance for Credit Losses Criticized Loans as a % of Risk-Based Capital SECOND QUARTER 2021 25
Slide 26: Expanding Florida's Commercial Bank
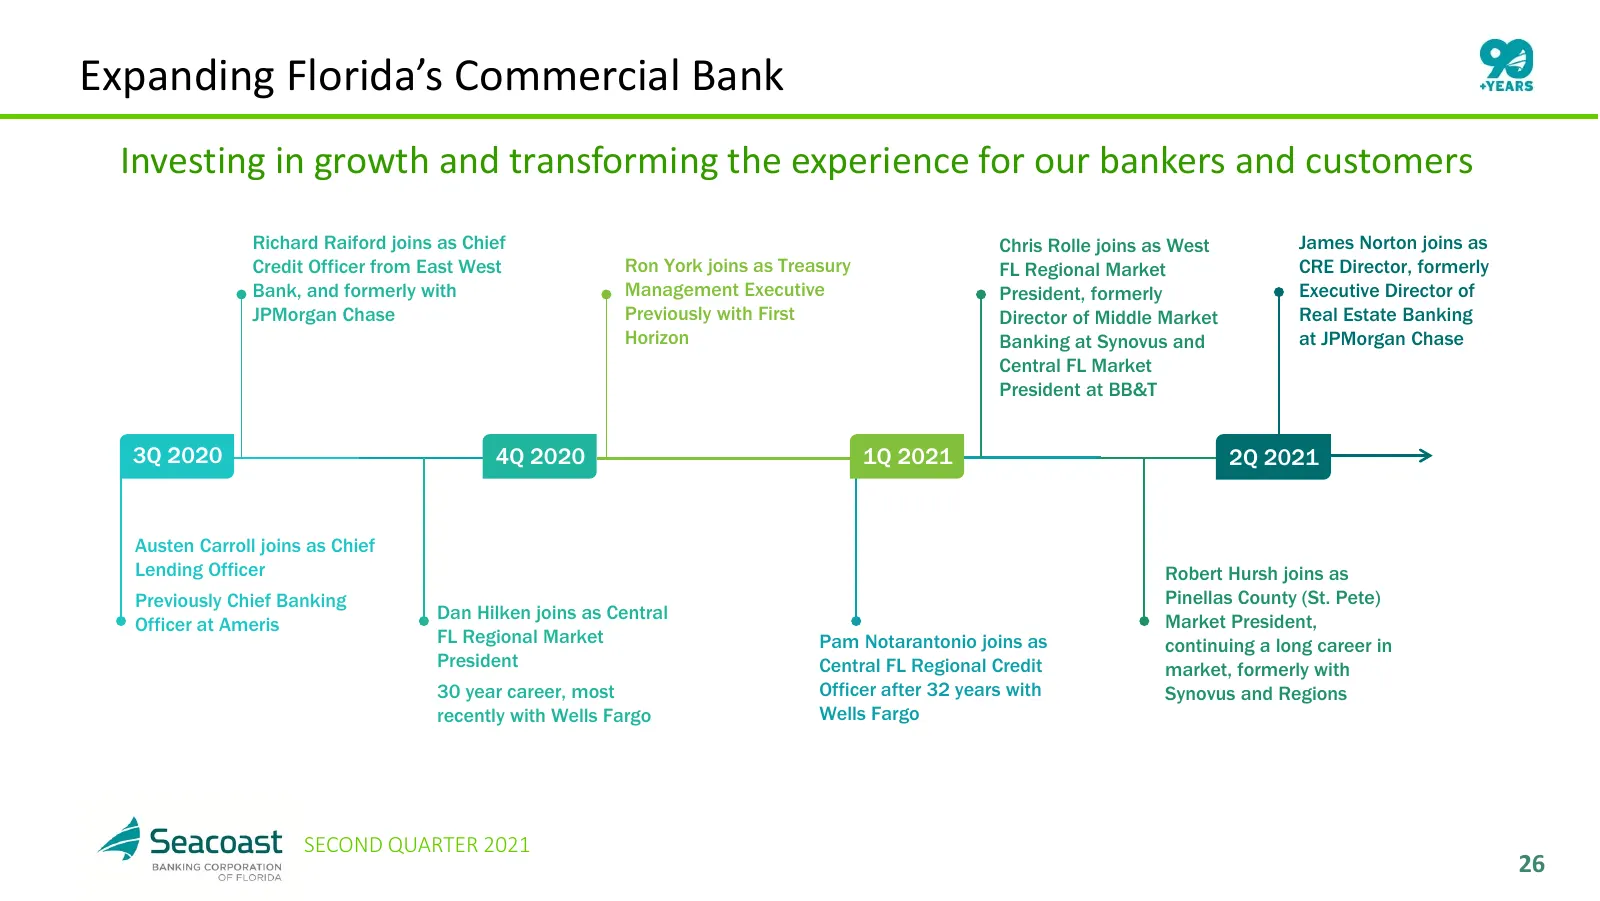
Expanding Florida’s Commercial Bank Investing in growth and transforming the experience for our bankers and customers Richard Raiford joins as Chief Chris Rolle joins as West James Norton joins as Credit Officer from East West Ron York joins as Treasury FL Regional Market CRE Director, formerly Bank
Slide 27: Agenda
Agenda 1 ABOUT SEACOAST BANK 2 COMPANY PERFORMANCE 3 LENDING AND CREDIT 4 CAPITAL 5 DIGITAL AND MULTI CHANNEL DISTRIBUTION 6 APPENDIX SECOND QUARTER 2021 27
Slide 28: Strong Capital Supporting a Fortress Balance Sheet
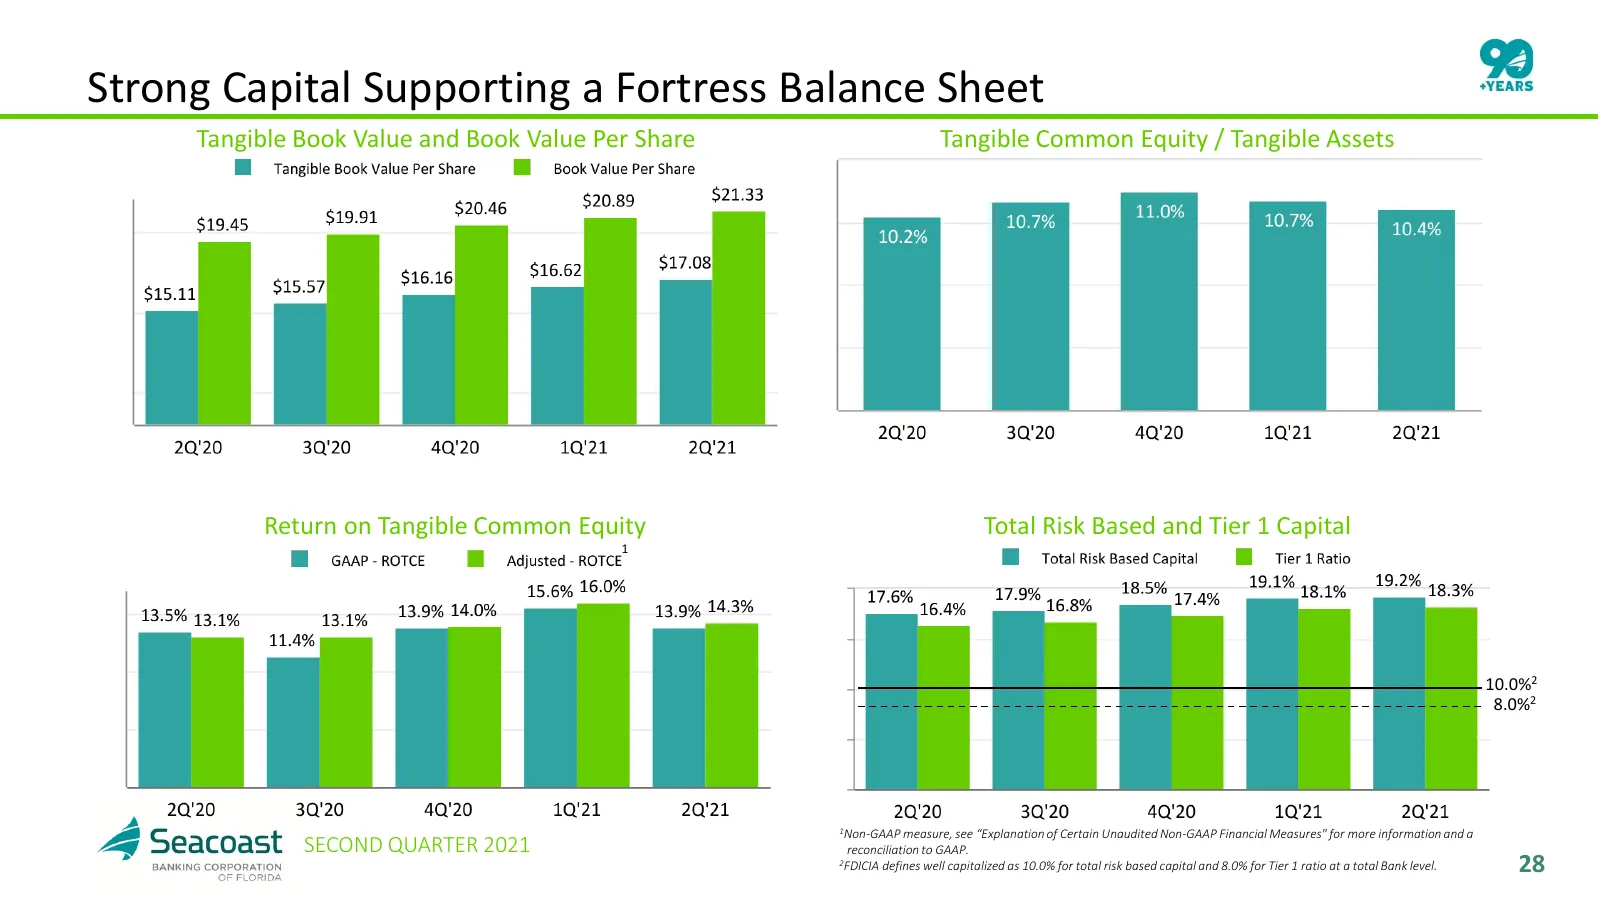
Strong Capital Supporting a Fortress Balance Sheet Tangible Book Value and Book Value Per Share Tangible Common Equity / Tangible Assets Return on Tangible Common Equity Total Risk Based and Tier 1 Capital 1 10.0%2 8.0%2 1Non-GAAP measure, see “Explanation of Certain Unaudited Non-GAAP Financial Mea
Slide 29: Agenda
Agenda 1 ABOUT SEACOAST BANK 2 COMPANY PERFORMANCE 3 LENDING AND CREDIT 4 CAPITAL 5 DIGITAL AND MULTI CHANNEL DISTRIBUTION 6 APPENDIX SECOND QUARTER 2021 29
Slide 30: Seacoast's Approach to Customer Analytics
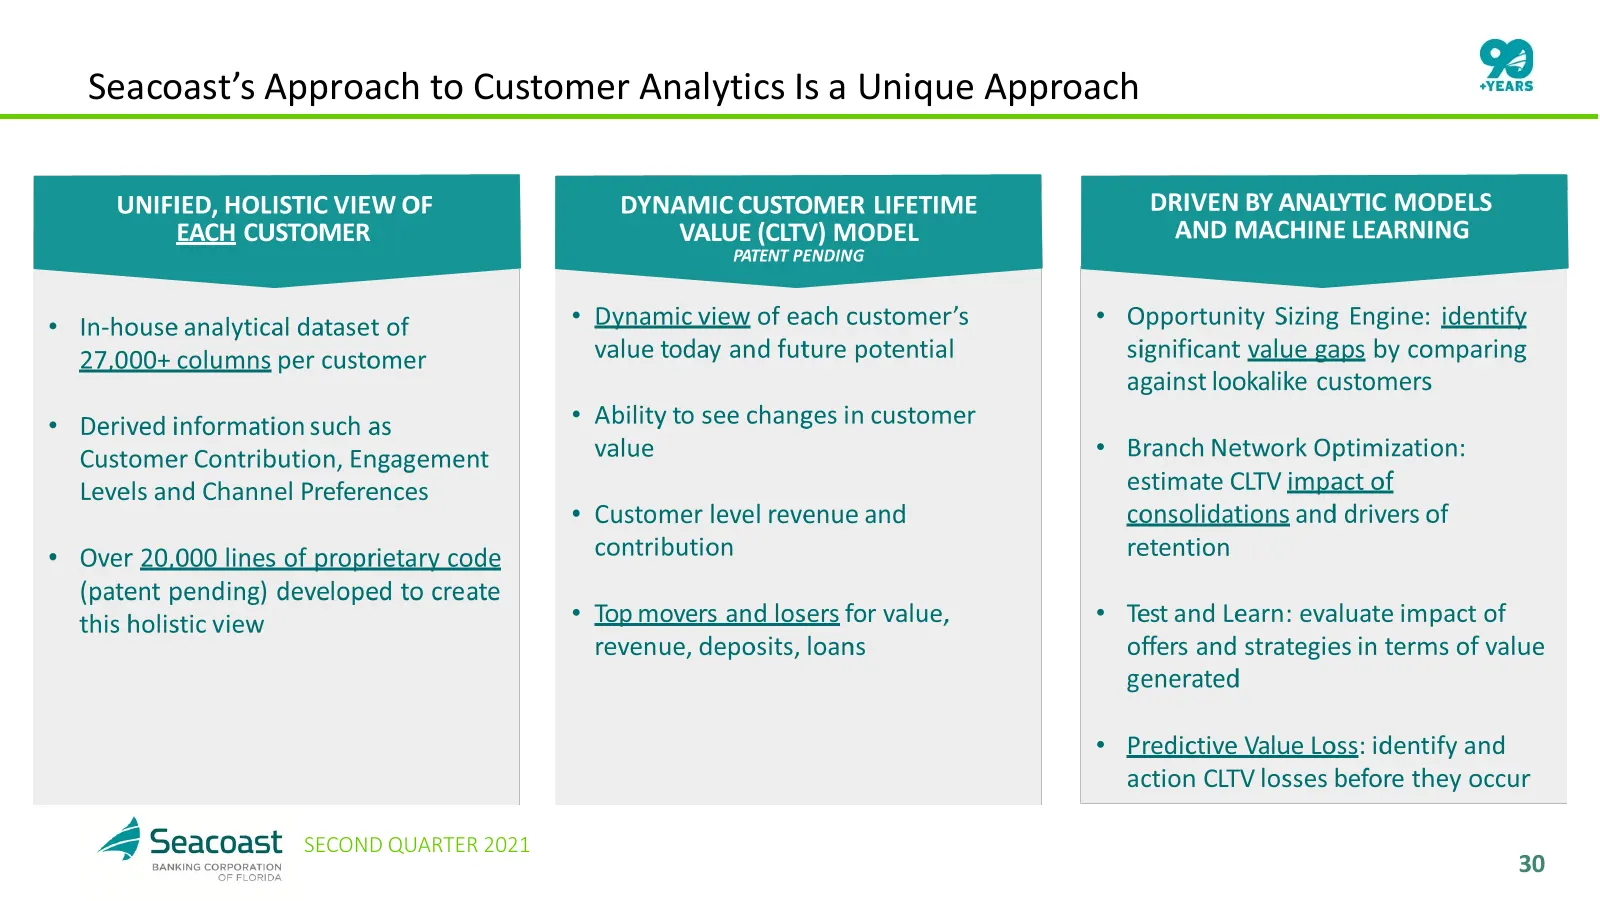
Seacoast’s Approach to Customer Analytics Is a Unique Approach SECOND QUARTER 2021 30
Slide 31: Unique Approach to Growing Customer Value
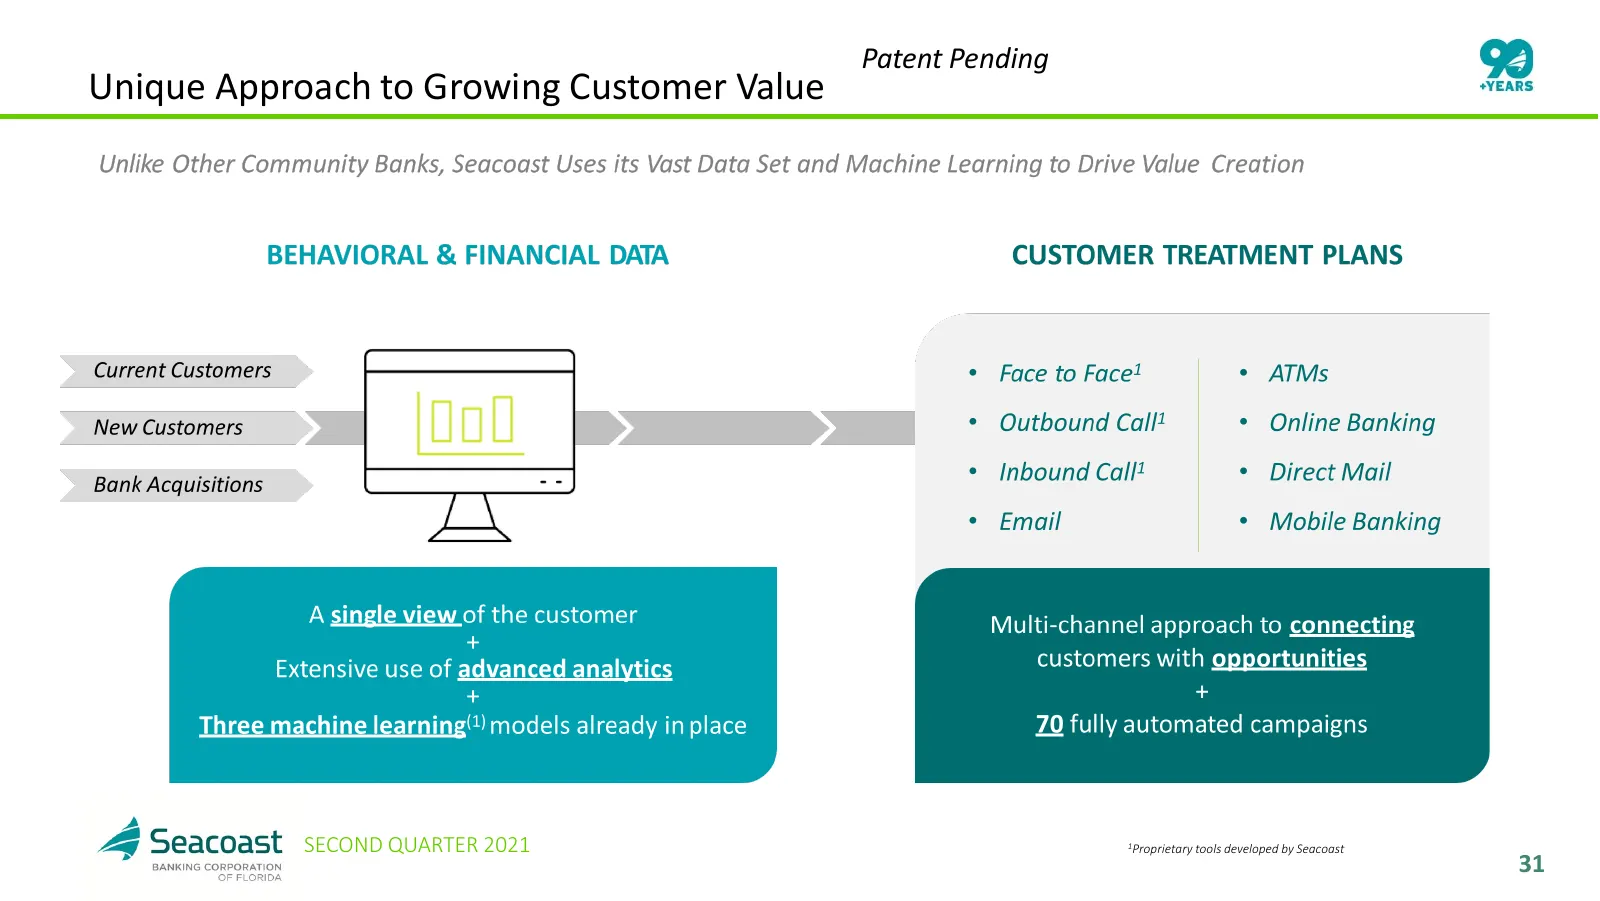
Patent Pending Unique Approach to Growing Customer Value SECOND QUARTER 2021 1Proprietary tools developed by Seacoast 31
Slide 32: Example of a Targeted, Multi-Channel Marketing Campaign
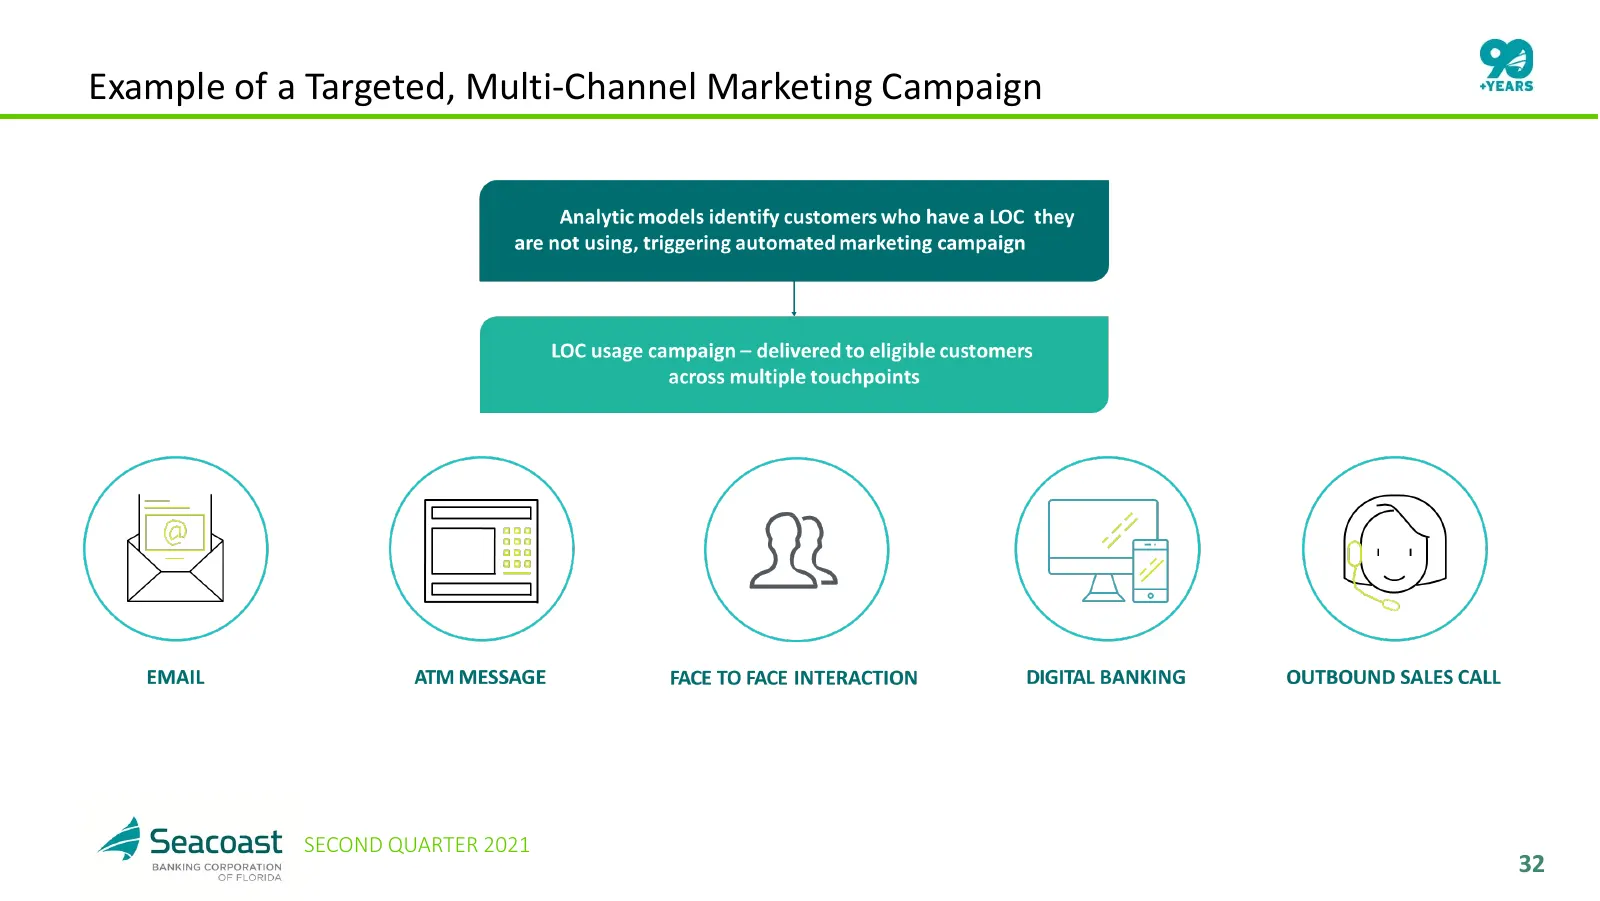
Example of a Targeted, Multi-Channel Marketing Campaign SECOND QUARTER 2021 32
Slide 33: Seacoast's Integrated Delivery Model Supports Our Growth Strategy
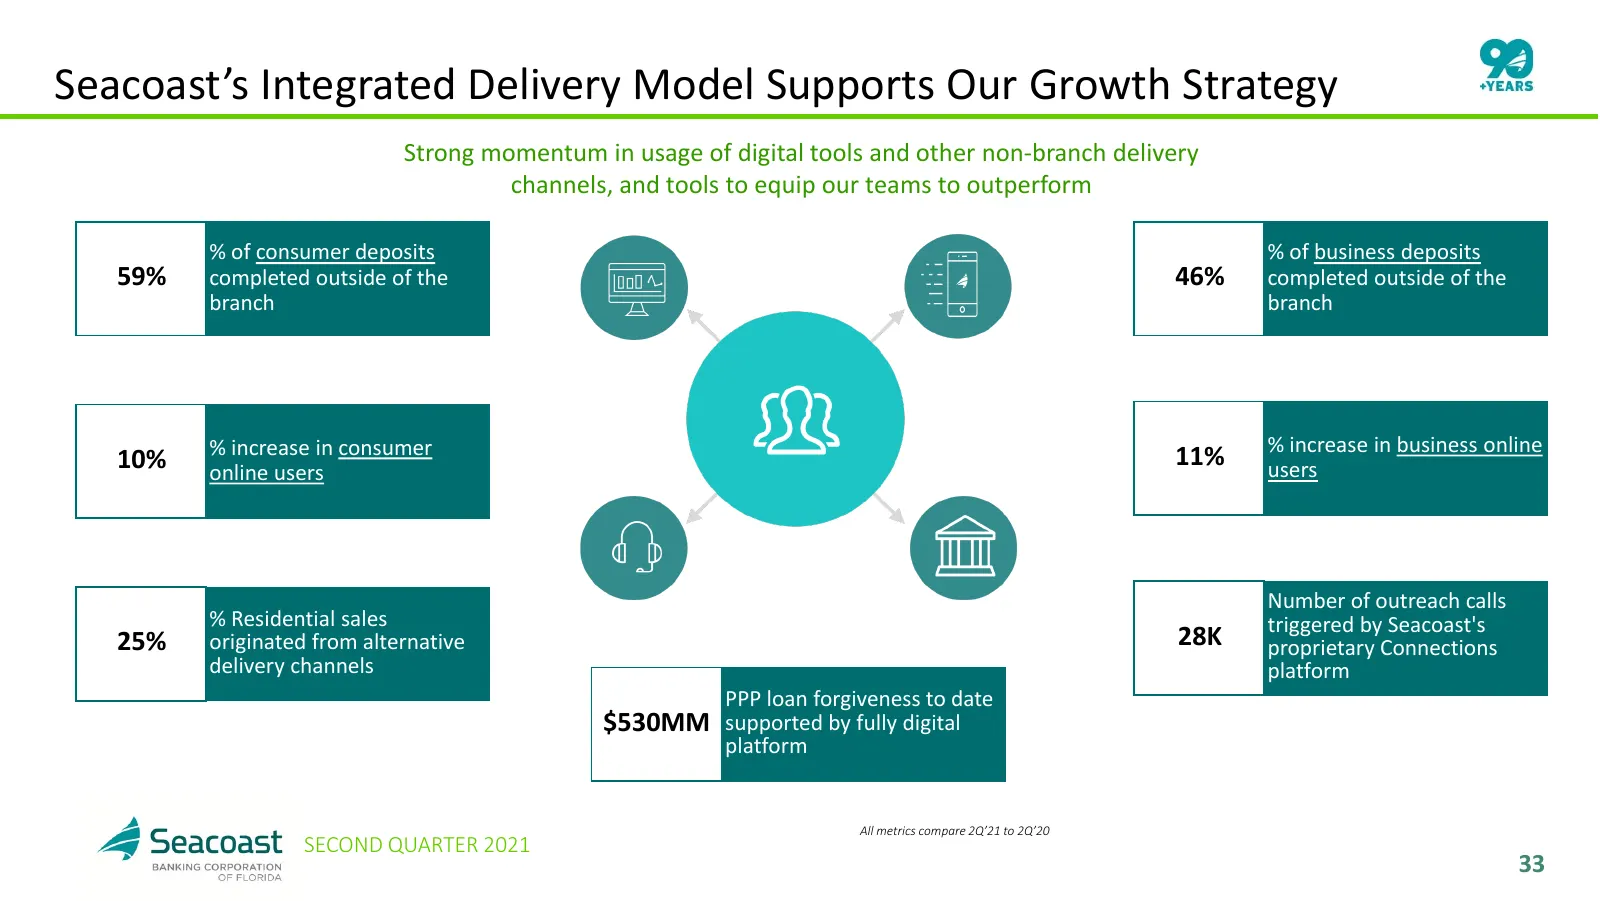
Seacoast’s Integrated Delivery Model Supports Our Growth Strategy Strong momentum in usage of digital tools and other non-branch delivery channels, and tools to equip our teams to outperform % of consumer deposits % of business deposits 59% completed outside of the 46% completed outside of the branc
Slide 34: Contact Details: Seacoast Banking Corporation of Florida
Contact Details: Seacoast Banking Corporation of Florida Tracey L. Dexter Executive Vice President Chief Financial Officer (772) 403-0461 INVESTOR RELATIONS NASDAQ: SBCF SECOND QUARTER 2021 34
Slide 35: Agenda
Agenda 1 ABOUT SEACOAST BANK 2 COMPANY PERFORMANCE 3 LENDING AND CREDIT 4 CAPITAL 5 DIGITAL AND MULTI CHANNEL DISTRIBUTION 6 APPENDIX SECOND QUARTER 2021 35
Slide 36: Loan Production and Pipeline Trend
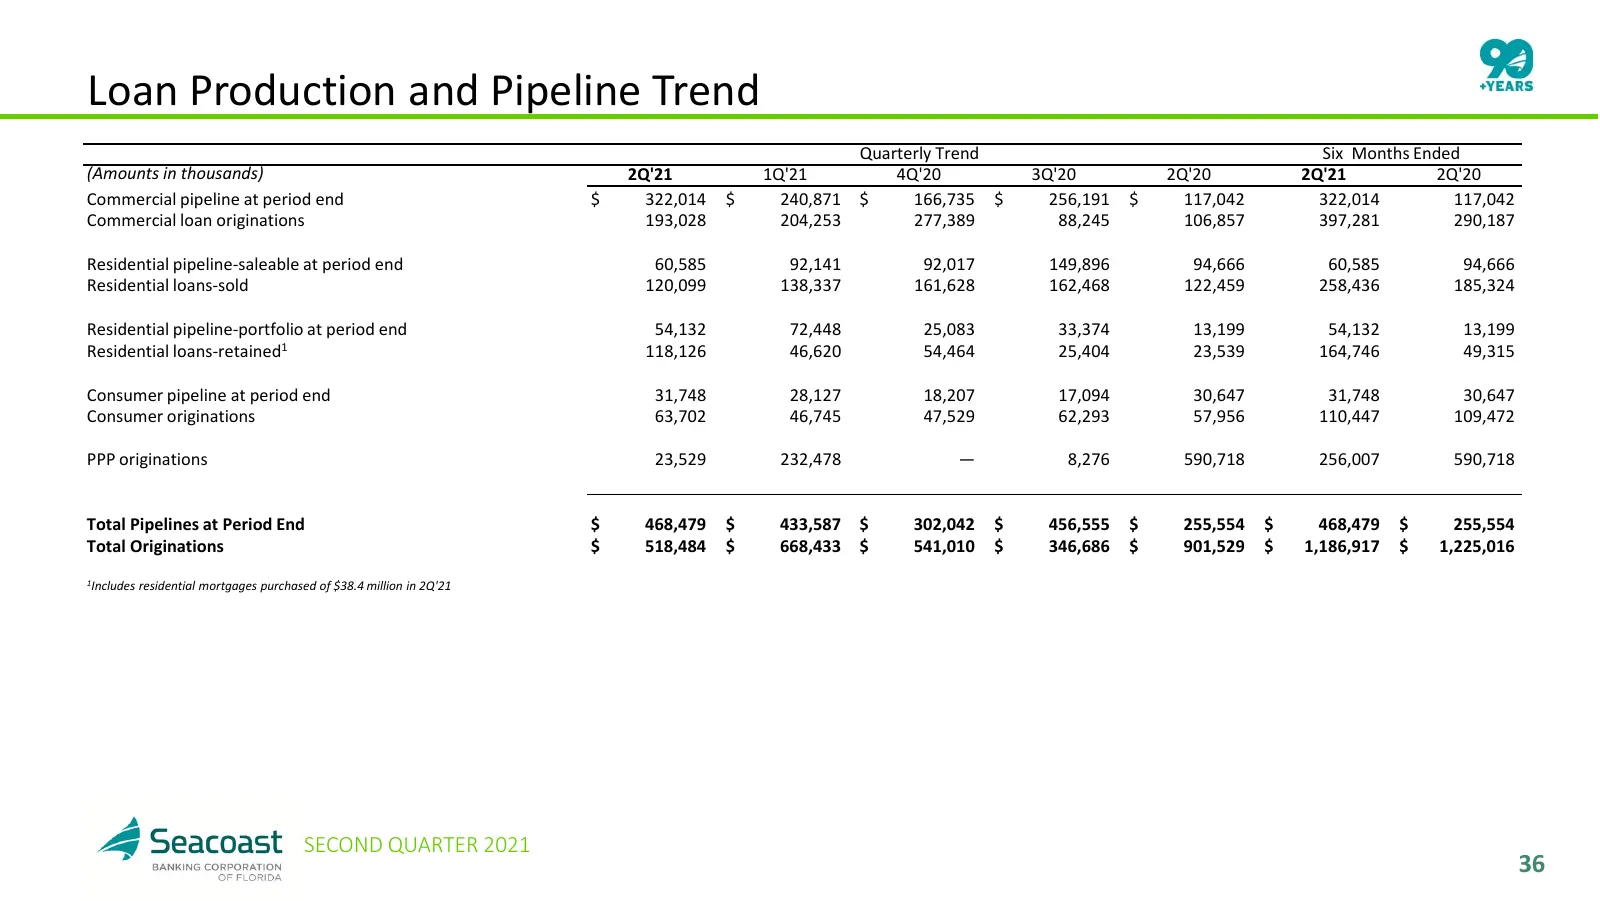
Loan Production and Pipeline Trend Quarterly Trend Six Months Ended (Amounts in thousands) 2Q'21 1Q'21 4Q'20 3Q'20 2Q'20 2Q'21 2Q'20 Commercial pipeline at period end $ 322,014 $ 240,871 $ 166,735 $ 256,191 $ 117,042 322,014 117,042 Commercial loan originations 193,028 204,253 277,389 88,245 106,857
Slide 37: Explanation of Certain Unaudited Non-GAAP Financial Measures
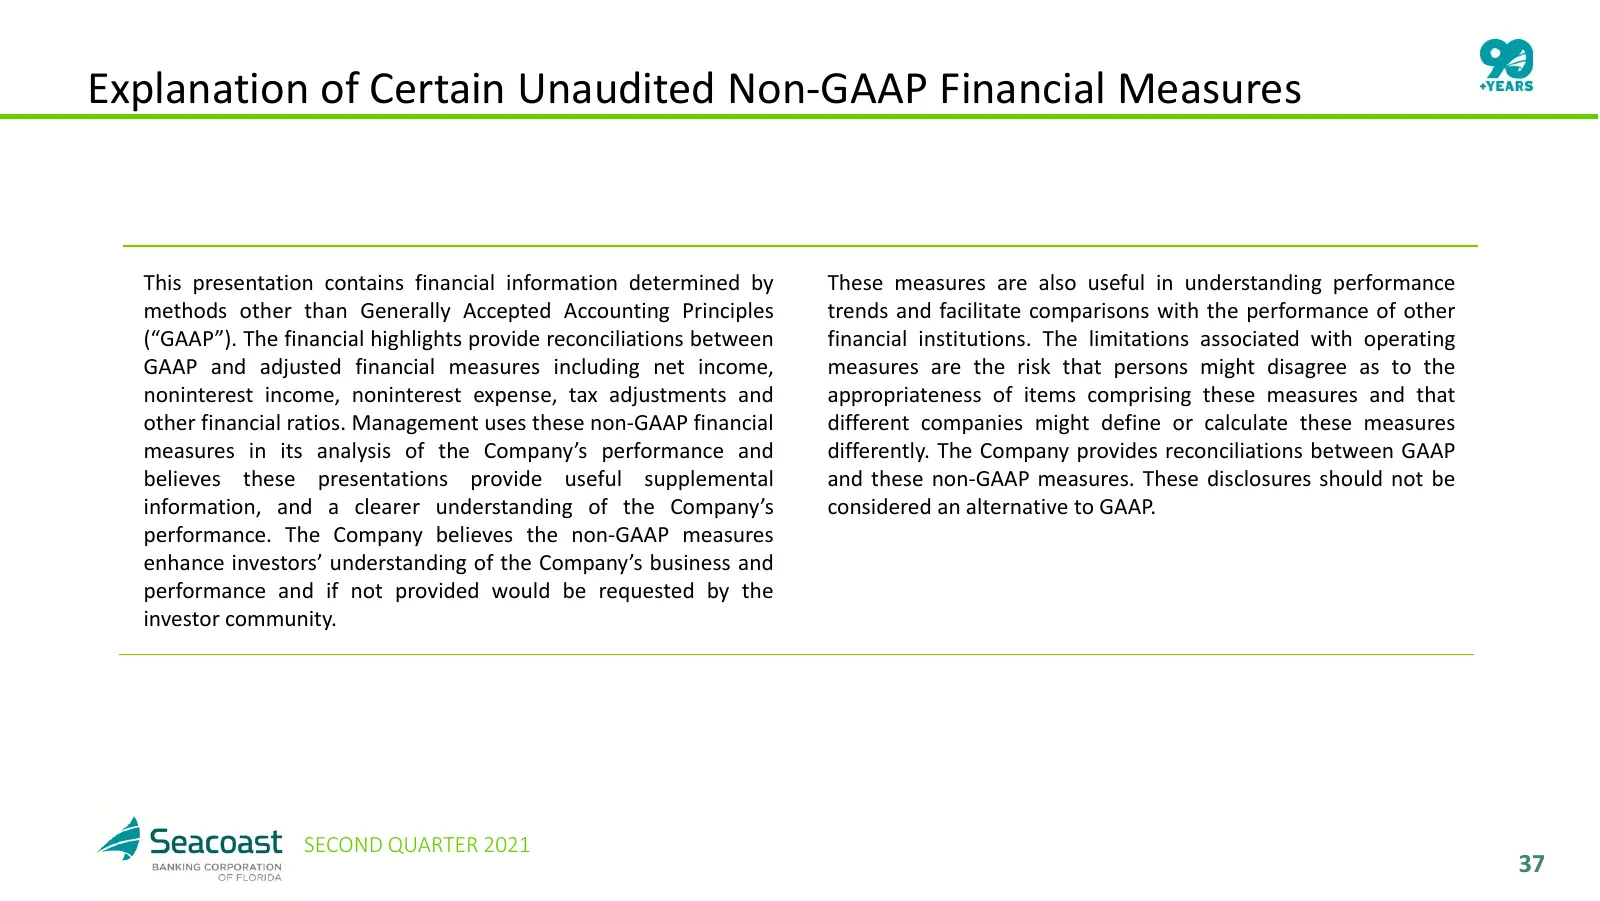
Explanation of Certain Unaudited Non-GAAP Financial Measures This presentation contains financial information determined by These measures are also useful in understanding performance methods other than Generally Accepted Accounting Principles trends and facilitate comparisons with the performance o
Slide 38: GAAP to Non-GAAP Reconciliation
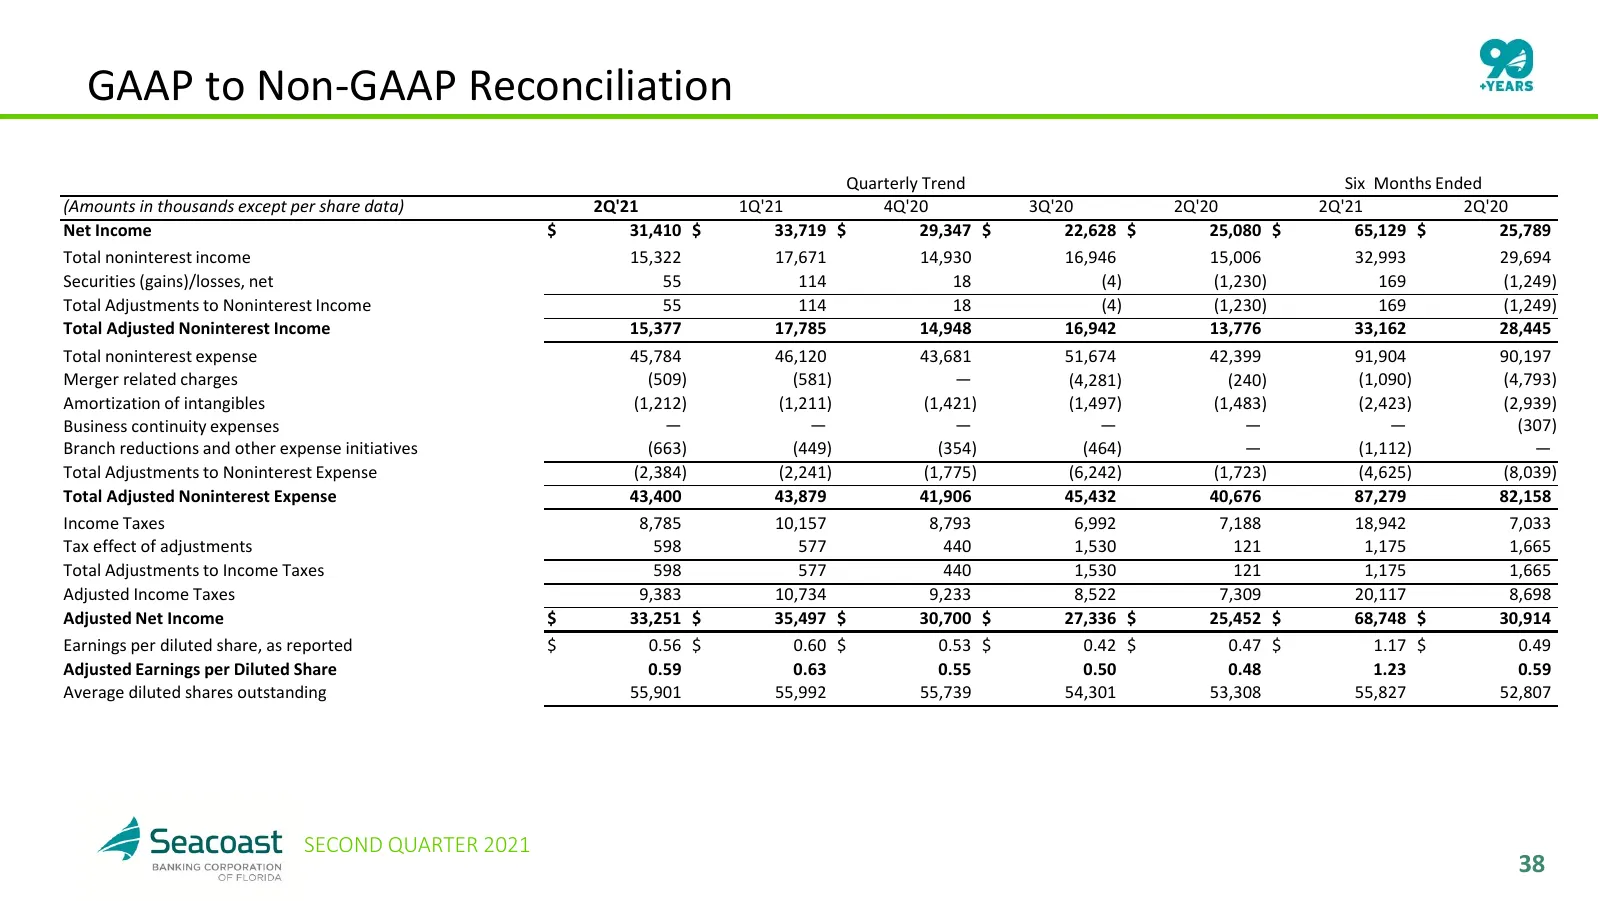
GAAP to Non-GAAP Reconciliation Quarterly Trend Six Months Ended (Amounts in thousands except per share data) 2Q'21 1Q'21 4Q'20 3Q'20 2Q'20 2Q'21 2Q'20 Net Income $ 31,410 $ 33,719 $ 29,347 $ 22,628 $ 25,080 $ 65,129 $ 25,789 Total noninterest income 15,322 17,671 14,930 16,946 15,006 32,993 29,694
Slide 39: GAAP to Non-GAAP Reconciliation
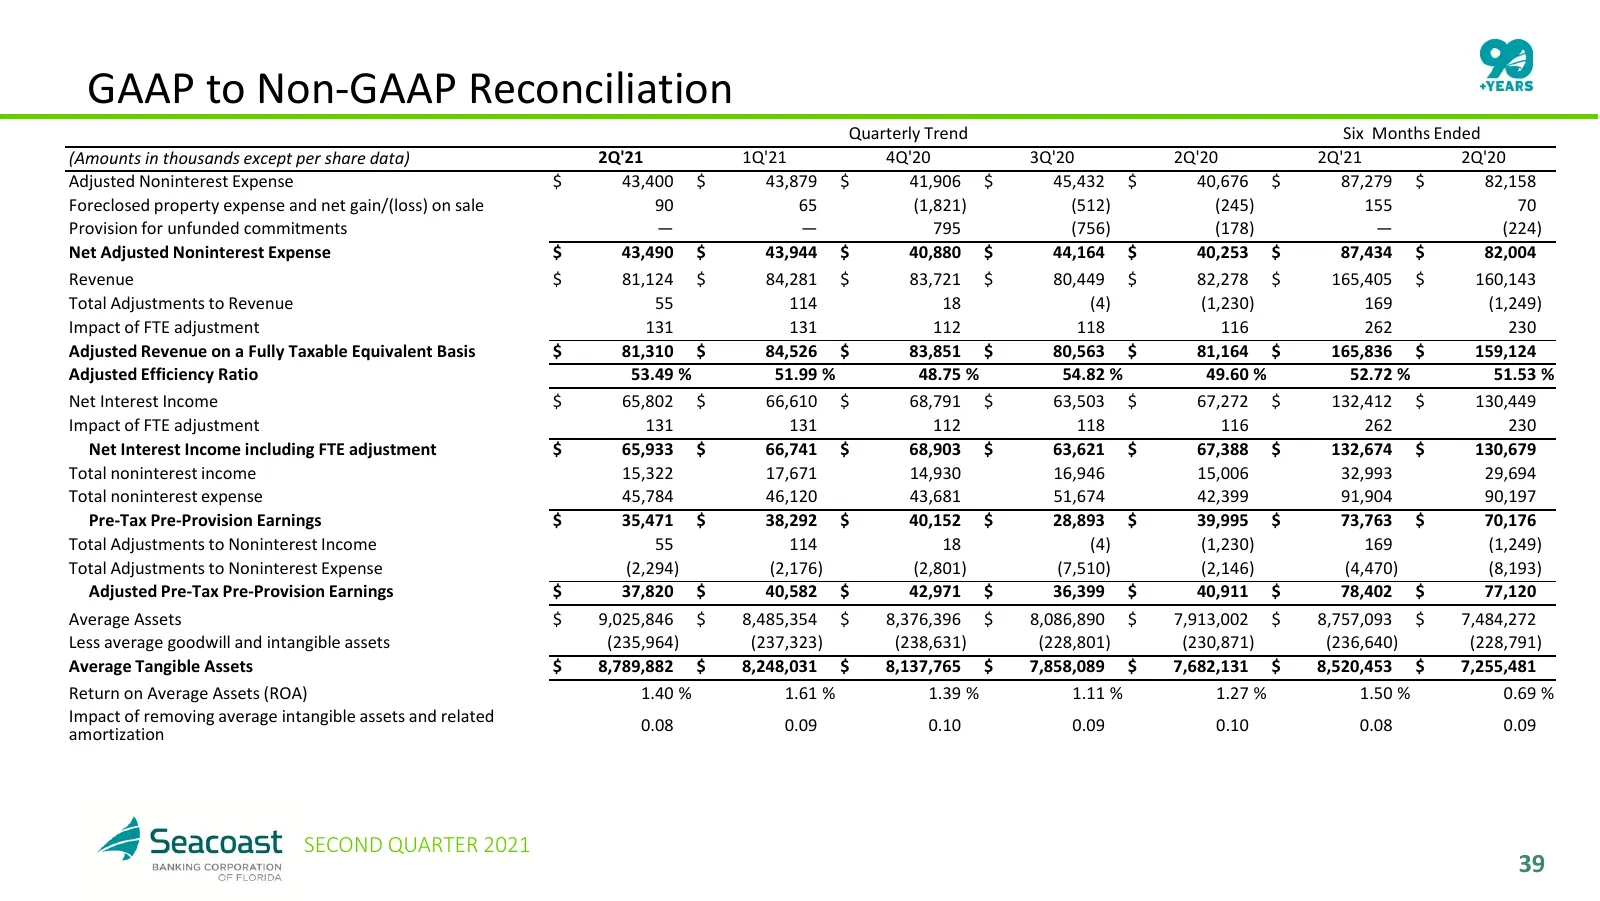
GAAP to Non-GAAP Reconciliation Quarterly Trend Six Months Ended (Amounts in thousands except per share data) 2Q'21 1Q'21 4Q'20 3Q'20 2Q'20 2Q'21 2Q'20 Adjusted Noninterest Expense $ 43,400 $ 43,879 $ 41,906 $ 45,432 $ 40,676 $ 87,279 $ 82,158 Foreclosed property expense and net gain/(loss) on sale
Slide 40: GAAP to Non-GAAP Reconciliation
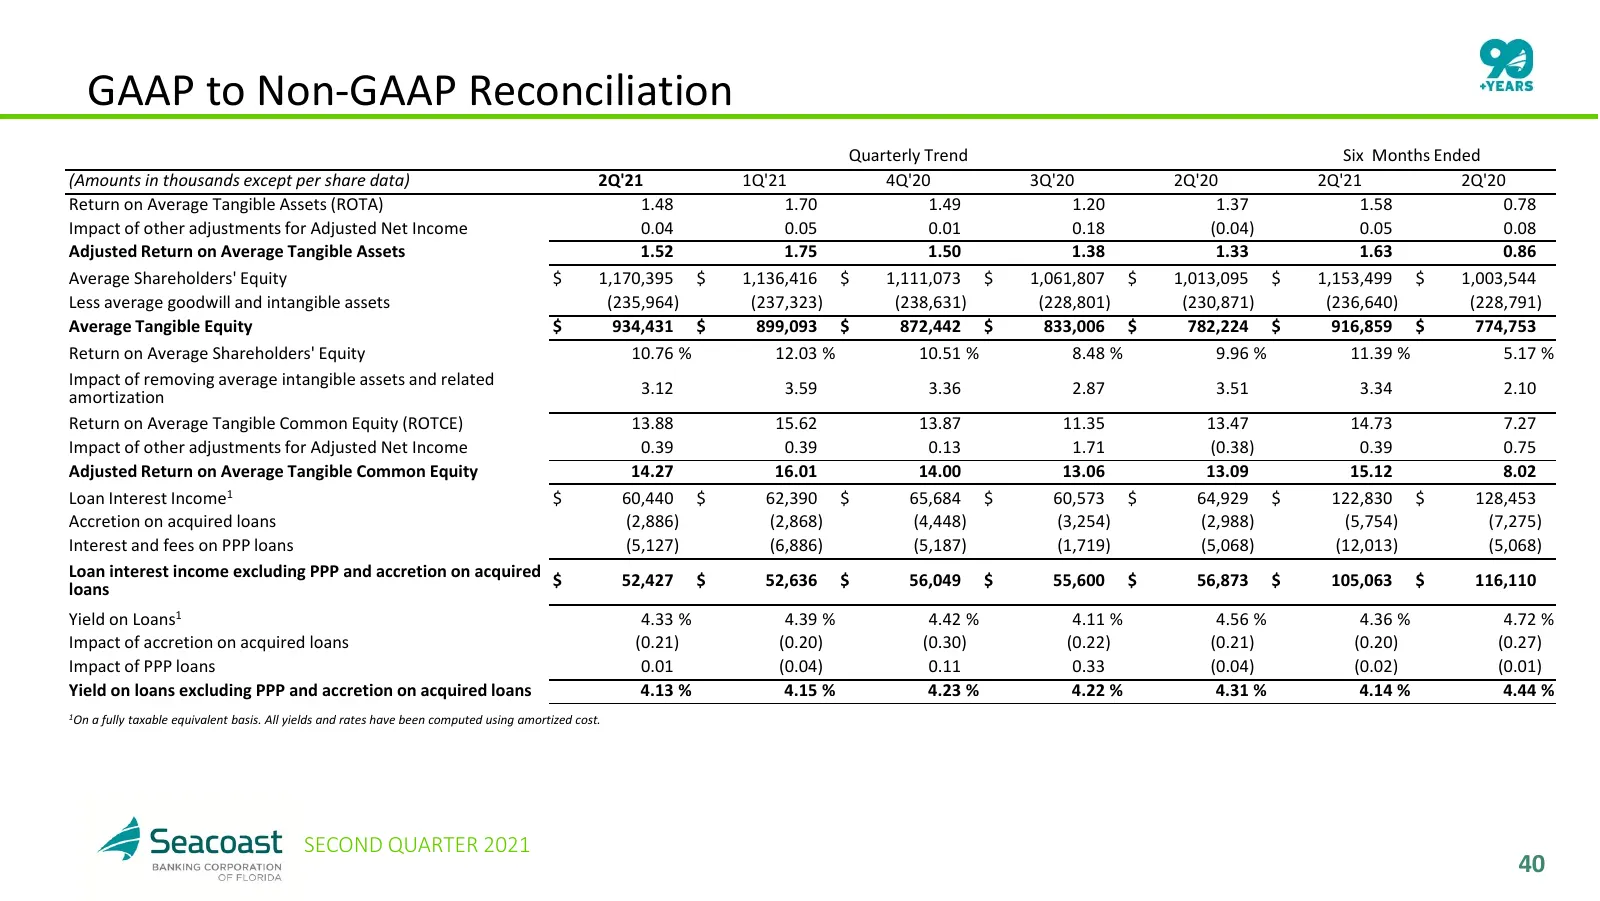
GAAP to Non-GAAP Reconciliation Quarterly Trend Six Months Ended (Amounts in thousands except per share data) 2Q'21 1Q'21 4Q'20 3Q'20 2Q'20 2Q'21 2Q'20 Return on Average Tangible Assets (ROTA) 1.48 1.70 1.49 1.20 1.37 1.58 0.78 Impact of other adjustments for Adjusted Net Income 0.04 0.05 0.01 0.18
Slide 41: GAAP to Non-GAAP Reconciliation
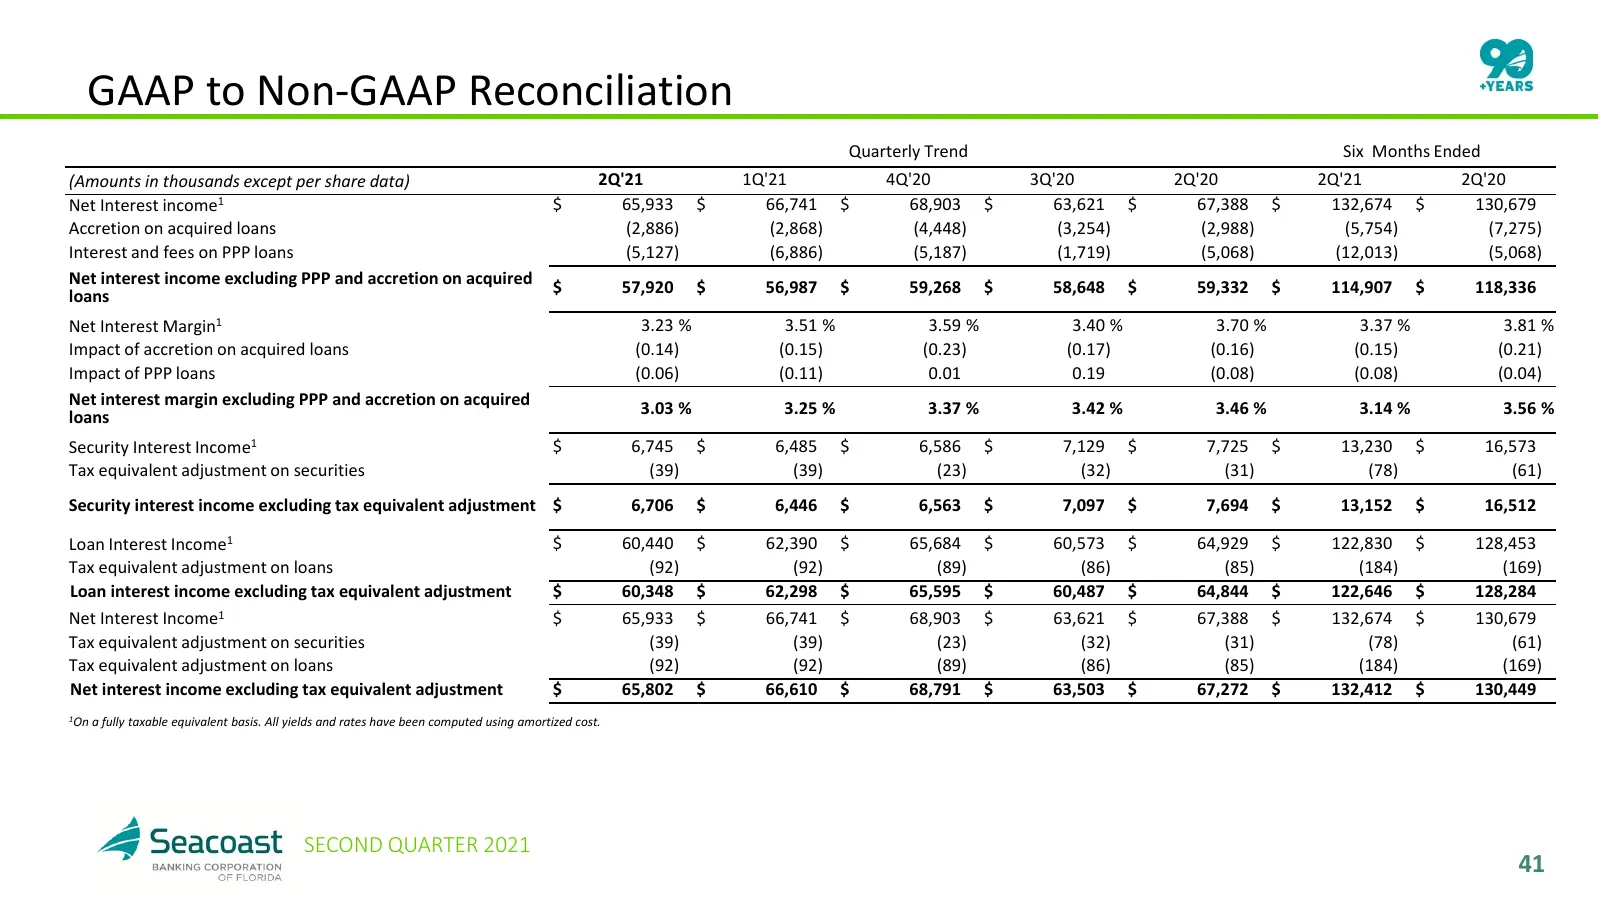
GAAP to Non-GAAP Reconciliation Quarterly Trend Six Months Ended (Amounts in thousands except per share data) 2Q'21 1Q'21 4Q'20 3Q'20 2Q'20 2Q'21 2Q'20 Net Interest income1 $ 65,933 $ 66,741 $ 68,903 $ 63,621 $ 67,388 $ 132,674 $ 130,679 Accretion on acquired loans (2,886) (2,868) (4,448) (3,254) (2
Source: Internet Archive copy of s26.q4cdn.com
More decks from Seacoast Banking Corporation of Florida
 Seacoast Banking Corp of Florida — Q3 2026 Earnings Presentation35 slides · Nov 4, 2026
 Q3 2026 Earnings Presentation27 slides · Oct 27, 2026
 Seacoast Banking Corp of Florida — Q2 2026 Earnings Presentation34 slides · Sep 9, 2026
 Q2 2026 Earnings Presentation26 slides · Jul 29, 2026
 Seacoast Banking Corp of Florida — Investor Presentation (May 2026)34 slides · May 13, 2026
 Q1 2026 Earnings Presentation26 slides · Apr 29, 2026