Mexico Equity & Income Fund Inc · NYSE:MXE
Mexico Equity & Income Fund — Investor Presentation (March 2017)
28 slides from Mexico Equity & Income Fund's investor presentation, March 2017
Slide 1: PAM's Macro Long Term View
Pichardo Asset Management Independent Portfolio Management Firm PAM’s Macro Long Term View Presentation to shareholders of the Fund March 2017 Experience 1 Consistency Vision
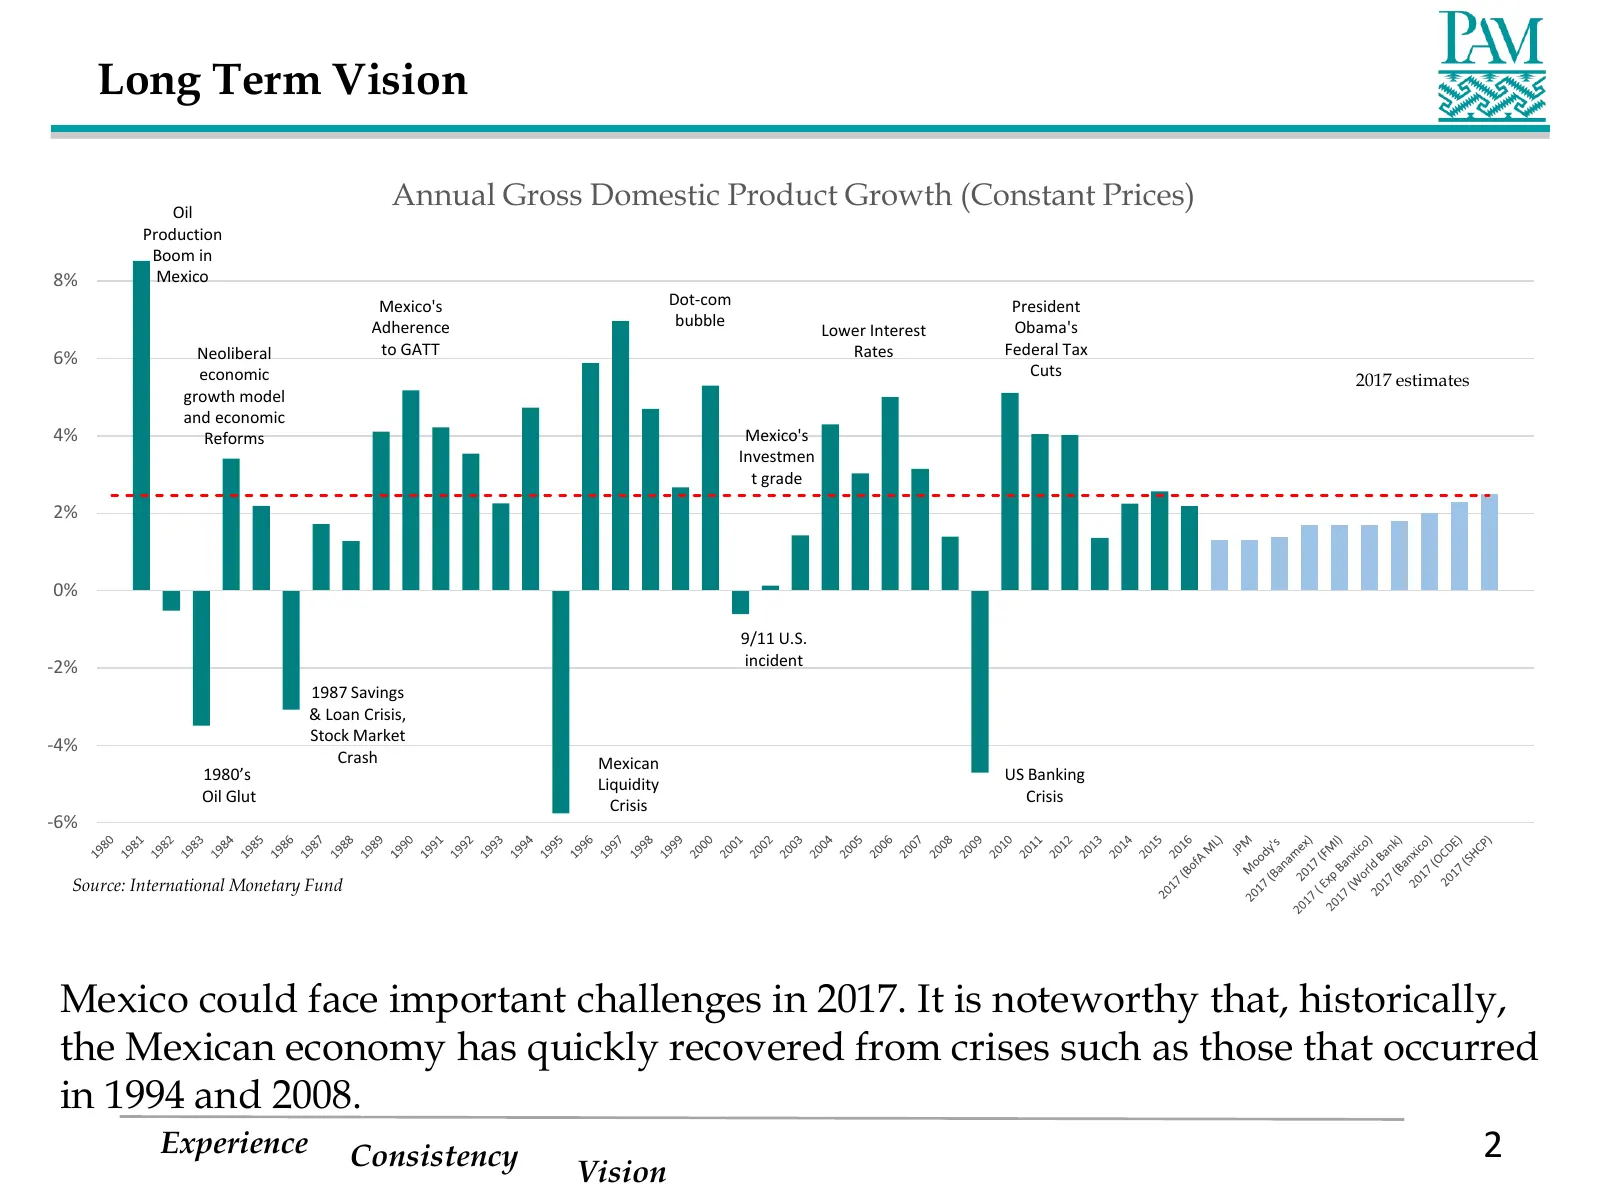
Slide 2: Long Term Vision: Annual GDP Growth
Long Term Vision Oil Annual Gross Domestic Product Growth (Constant Prices) Production Boom in 8% Mexico Mexico's Dot-com President Adherence bubble Obama's Lower Interest 6% Neoliberal to GATT Rates Federal Tax economic Cuts 2017 estimates growth model and economic 4% Reforms Mexico's Investmen t g
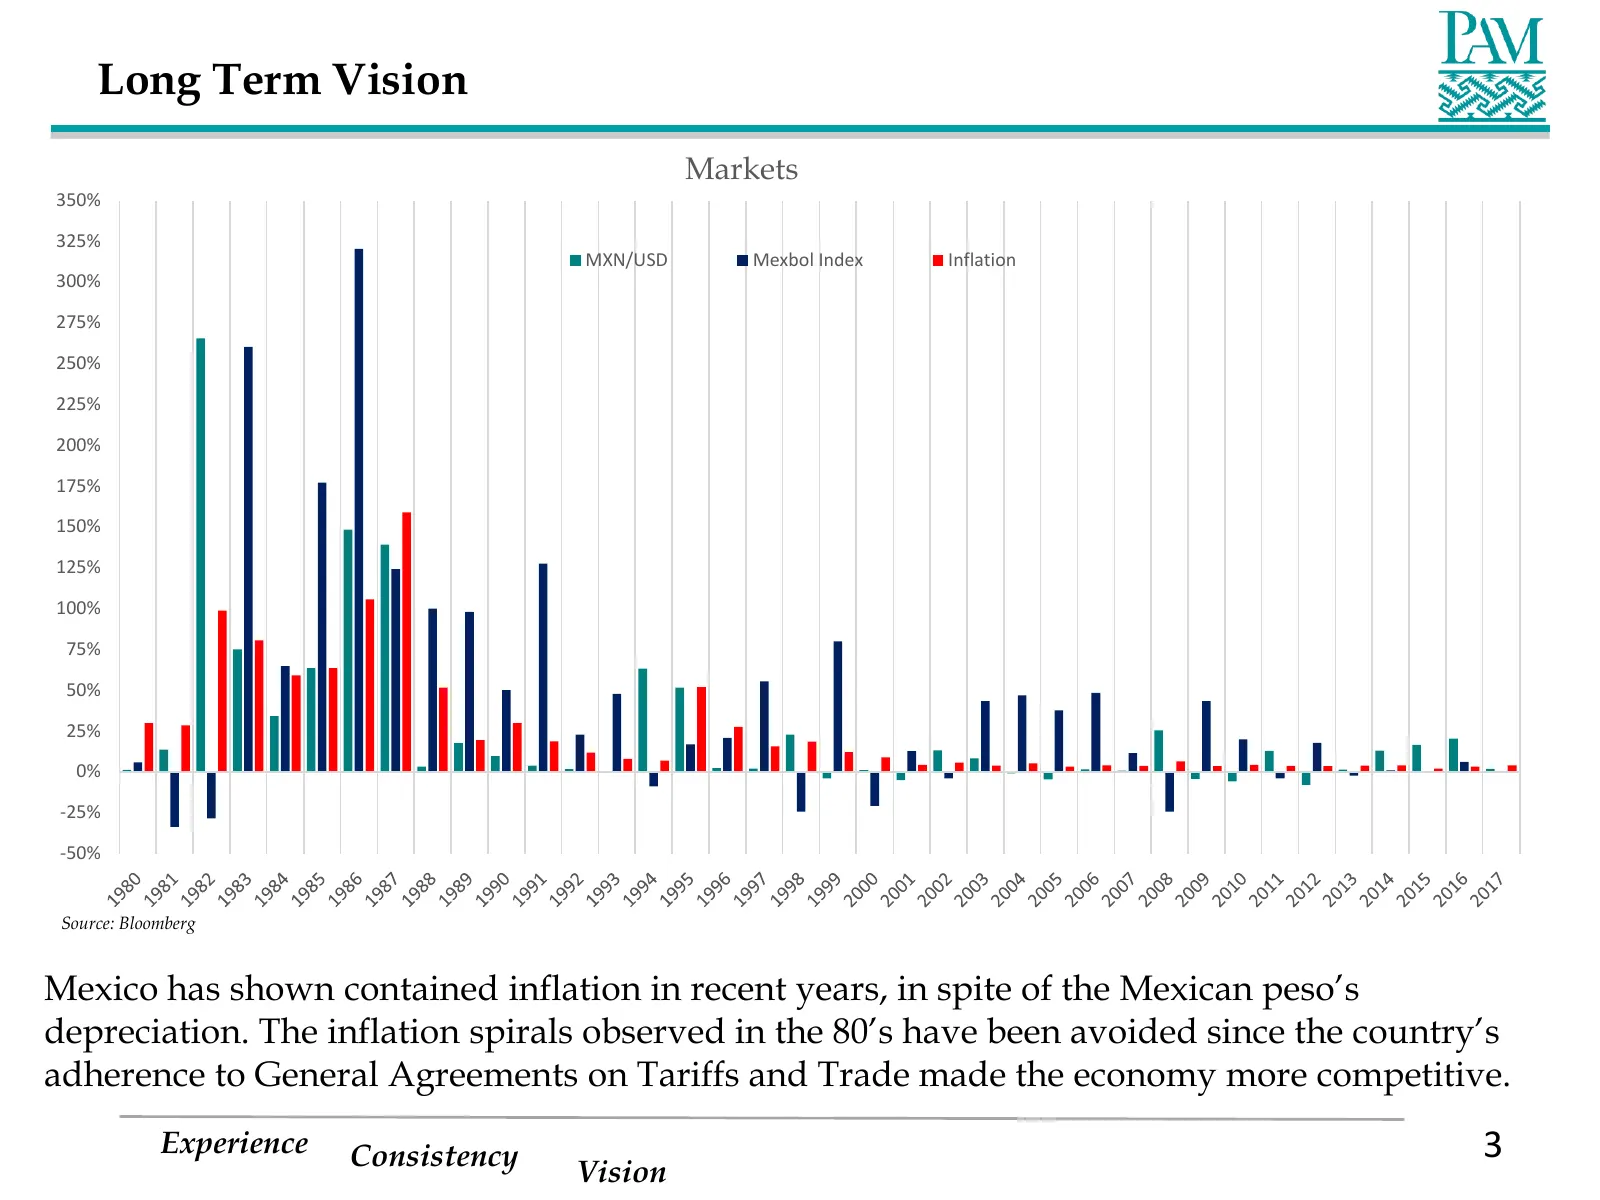
Slide 3: Long Term Vision: Markets
Long Term Vision Markets 350% 325% MXN/USD Mexbol Index Inflation 300% 275% 250% 225% 200% 175% 150% 125% 100% 75% 50% 25% 0% -25% -50% Source: Bloomberg Mexico has shown contained inflation in recent years, in spite of the Mexican peso’s depreciation. The inflation spirals observed in the 80’s have
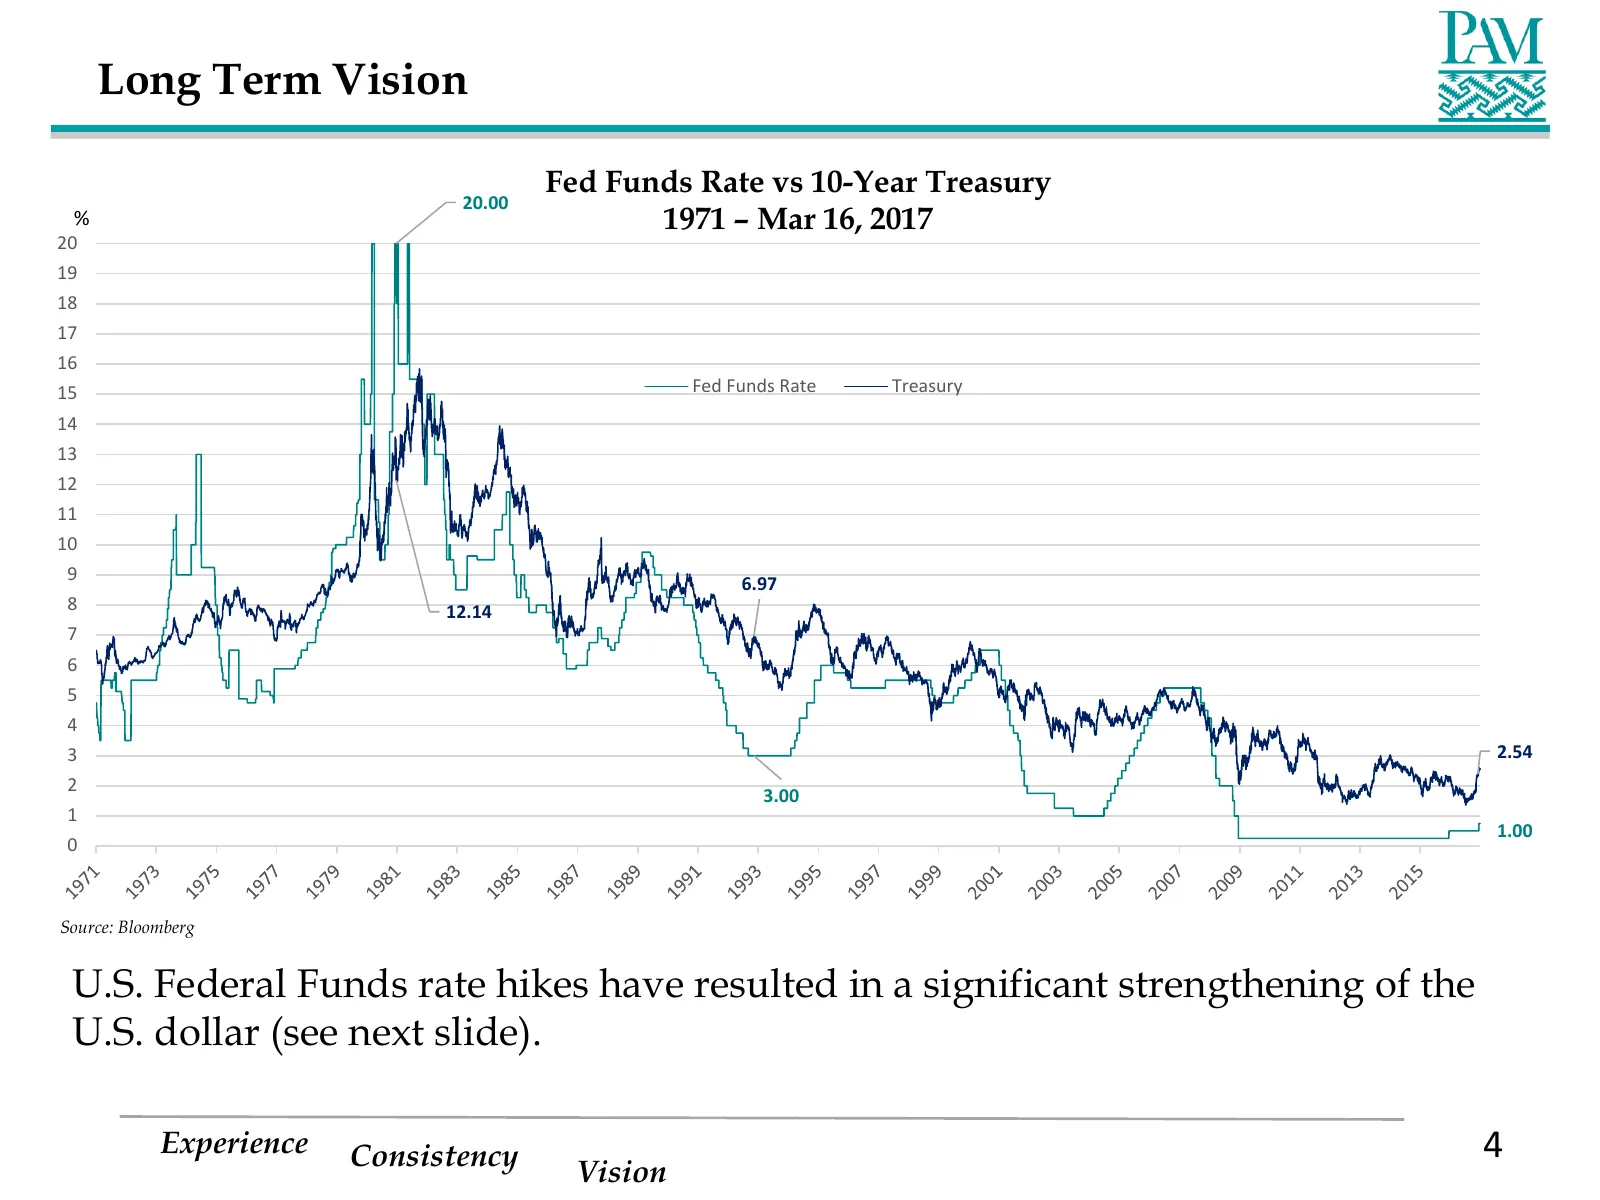
Slide 4: Fed Funds Rate vs 10-Year Treasury
Long Term Vision Fed Funds Rate vs 10-Year Treasury 20.00 % 1971 – Mar 16, 2017 20 19 18 17 16 15 Fed Funds Rate Treasury 14 13 12 11 10 9 6.97 8 12.14 7 6 5 4 3 2.54 2 3.00 1 1.00 0 Source: Bloomberg U.S. Federal Funds rate hikes have resulted in a significant strengthening of the U.S. dollar (see
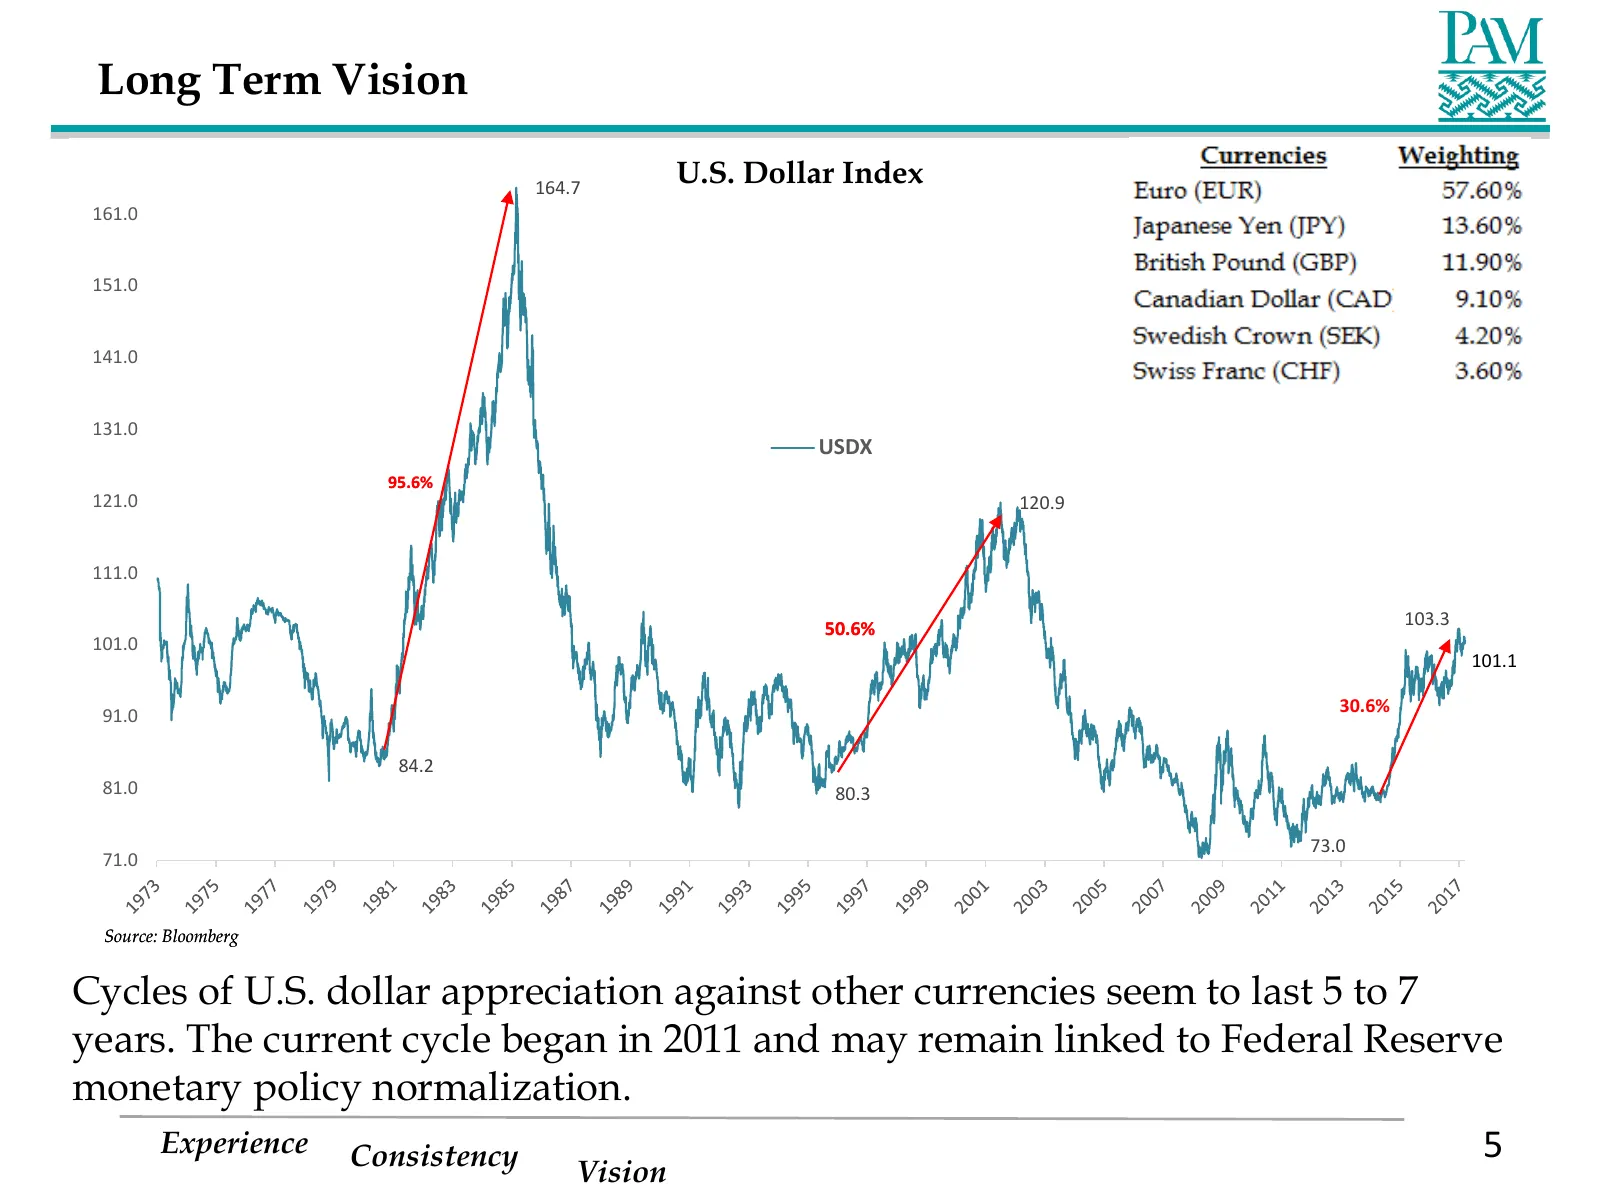
Slide 5: U.S. Dollar Index cycles
Long Term Vision 164.7 U.S. Dollar Index 161.0 151.0 141.0 131.0 USDX 95.6% 121.0 120.9 111.0 50.6% 103.3 101.0 101.1 30.6% 91.0 84.2 81.0 80.3 73.0 71.0 Source: Bloomberg Cycles of U.S. dollar appreciation against other currencies seem to last 5 to 7 years. The current cycle began in 2011 and may r
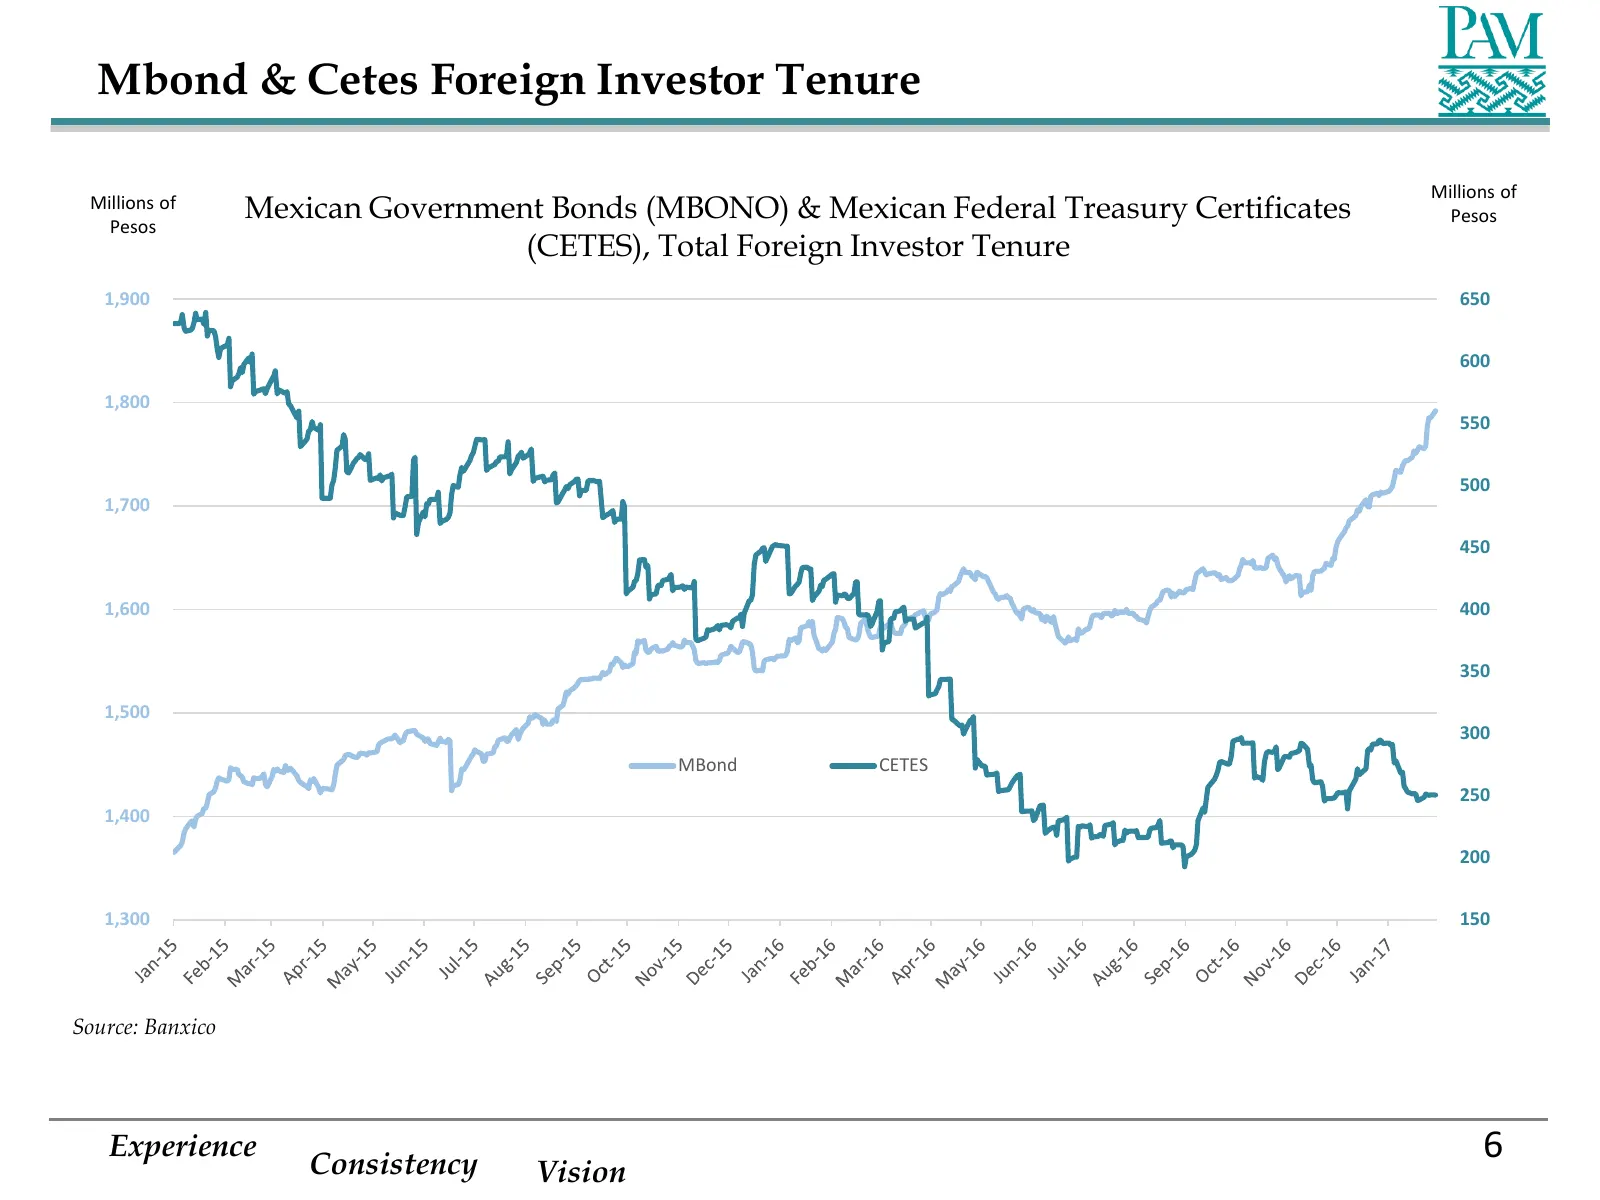
Slide 6: Mbond & Cetes Foreign Investor Tenure
Mbond & Cetes Foreign Investor Tenure Millions of Millions of Pesos Mexican Government Bonds (MBONO) & Mexican Federal Treasury Certificates Pesos (CETES), Total Foreign Investor Tenure 1,900 650 600 1,800 550 500 1,700 450 1,600 400 350 1,500 300 MBond CETES 250 1,400 200 1,300 150 Source: Banxico
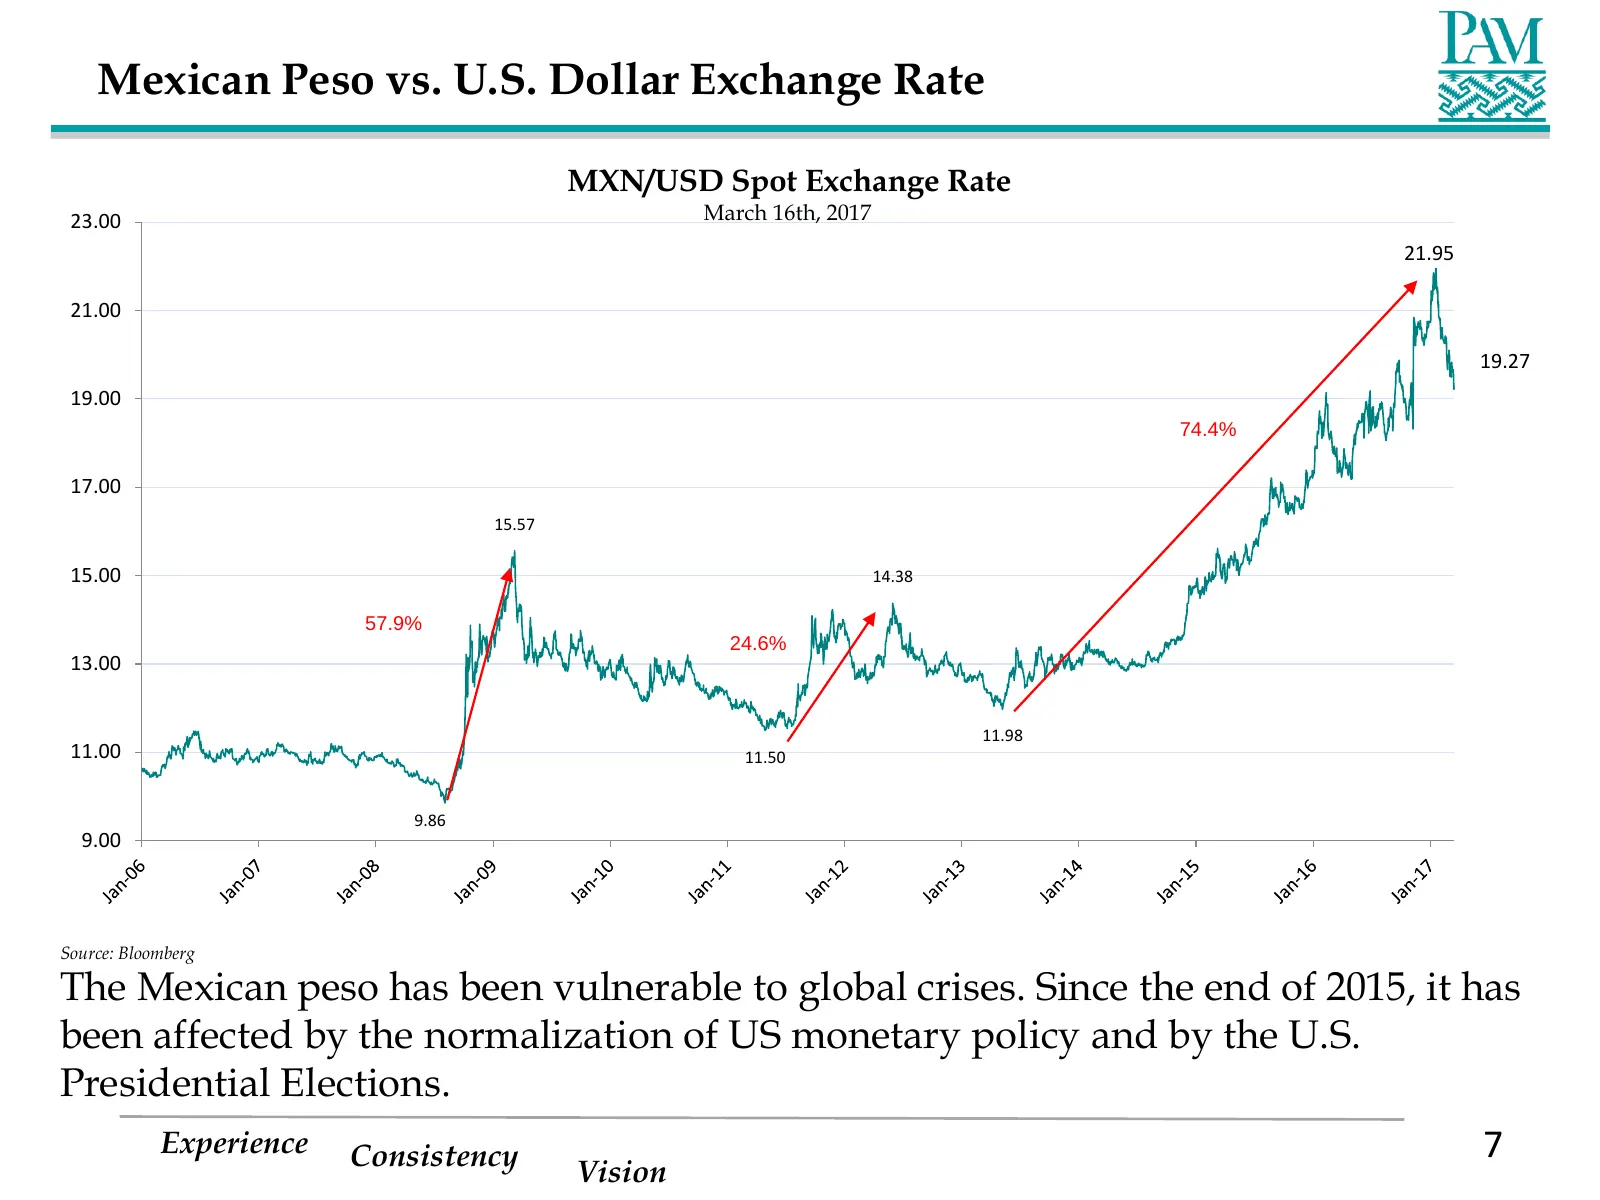
Slide 7: Mexican Peso vs. U.S. Dollar Exchange Rate
Mexican Peso vs. U.S. Dollar Exchange Rate MXN/USD Spot Exchange Rate 23.00 March 16th, 2017 21.95 21.00 19.27 19.00 74.4% 17.00 15.57 15.00 14.38 57.9% 24.6% 13.00 11.98 11.00 11.50 9.86 9.00 Source: Bloomberg The Mexican peso has been vulnerable to global crises. Since the end of 2015, it has been
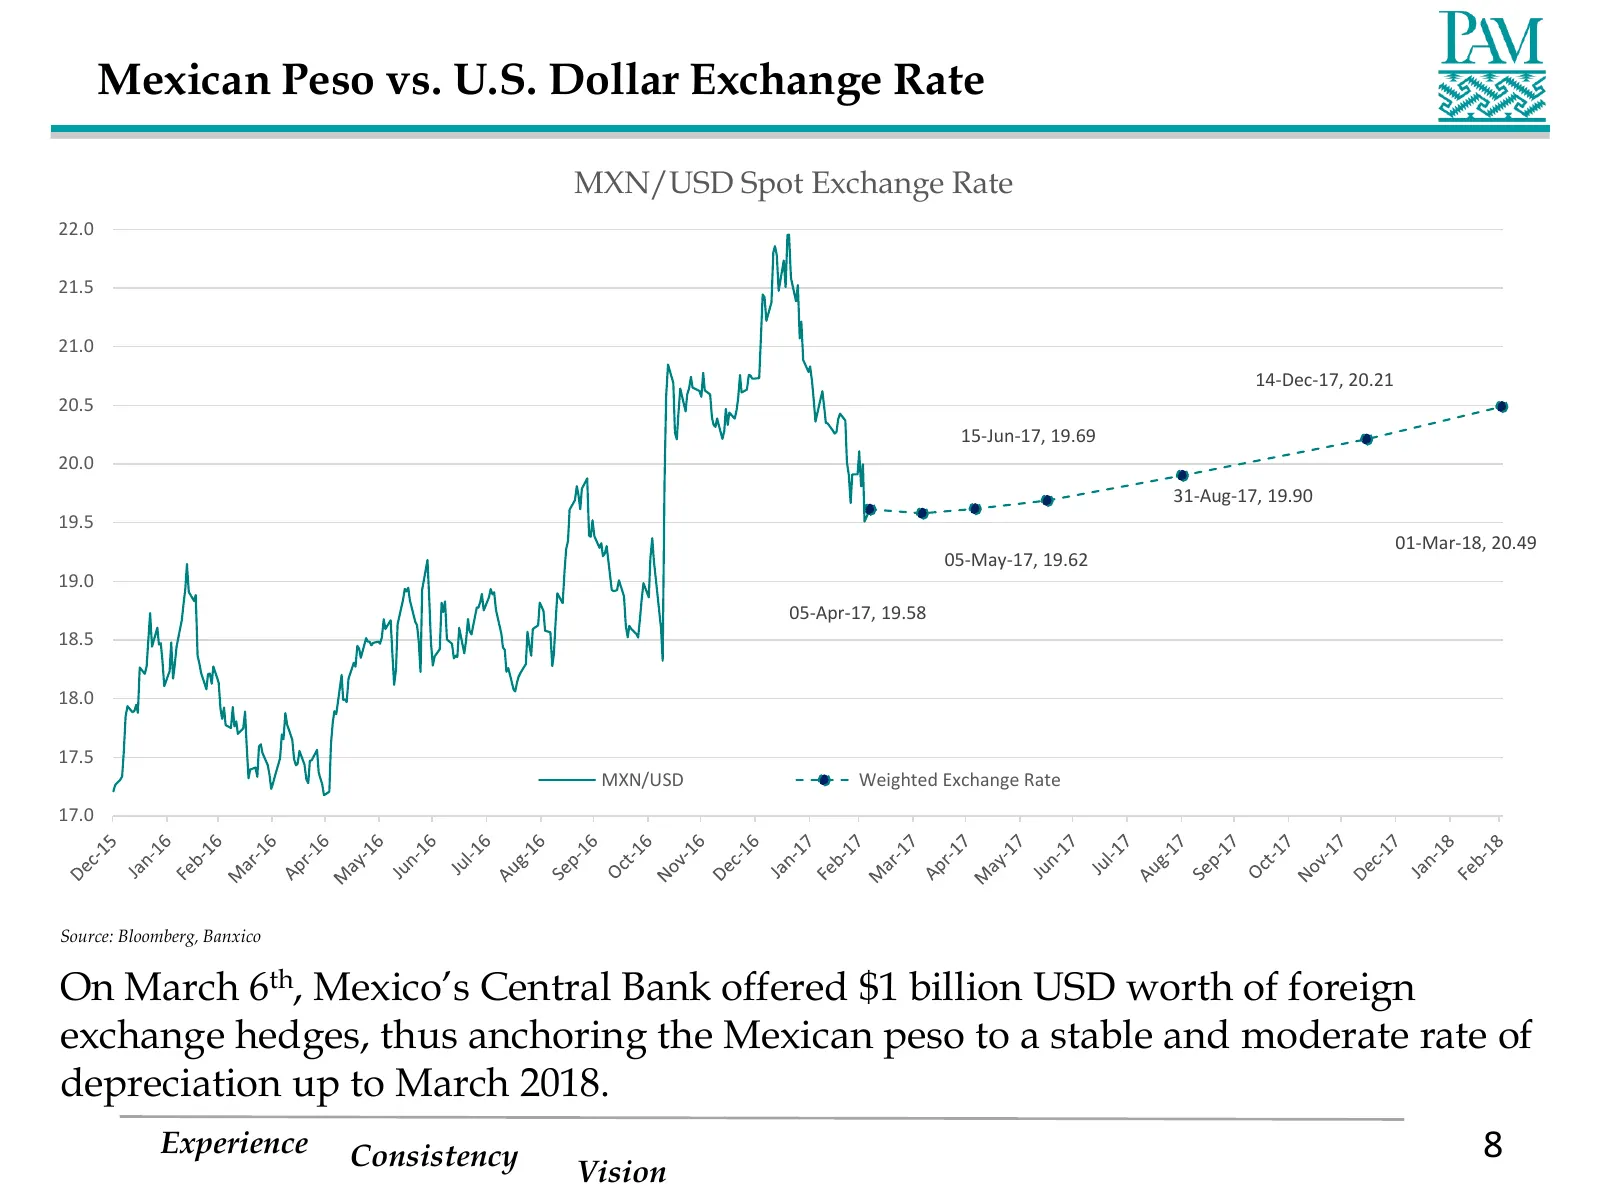
Slide 8: Mexican Peso vs. U.S. Dollar Exchange Rate
Mexican Peso vs. U.S. Dollar Exchange Rate MXN/USD Spot Exchange Rate 22.0 21.5 21.0 14-Dec-17, 20.21 20.5 15-Jun-17, 19.69 20.0 31-Aug-17, 19.90 19.5 01-Mar-18, 20.49 05-May-17, 19.62 19.0 05-Apr-17, 19.58 18.5 18.0 17.5 MXN/USD Weighted Exchange Rate 17.0 Source: Bloomberg, Banxico On March 6th, M
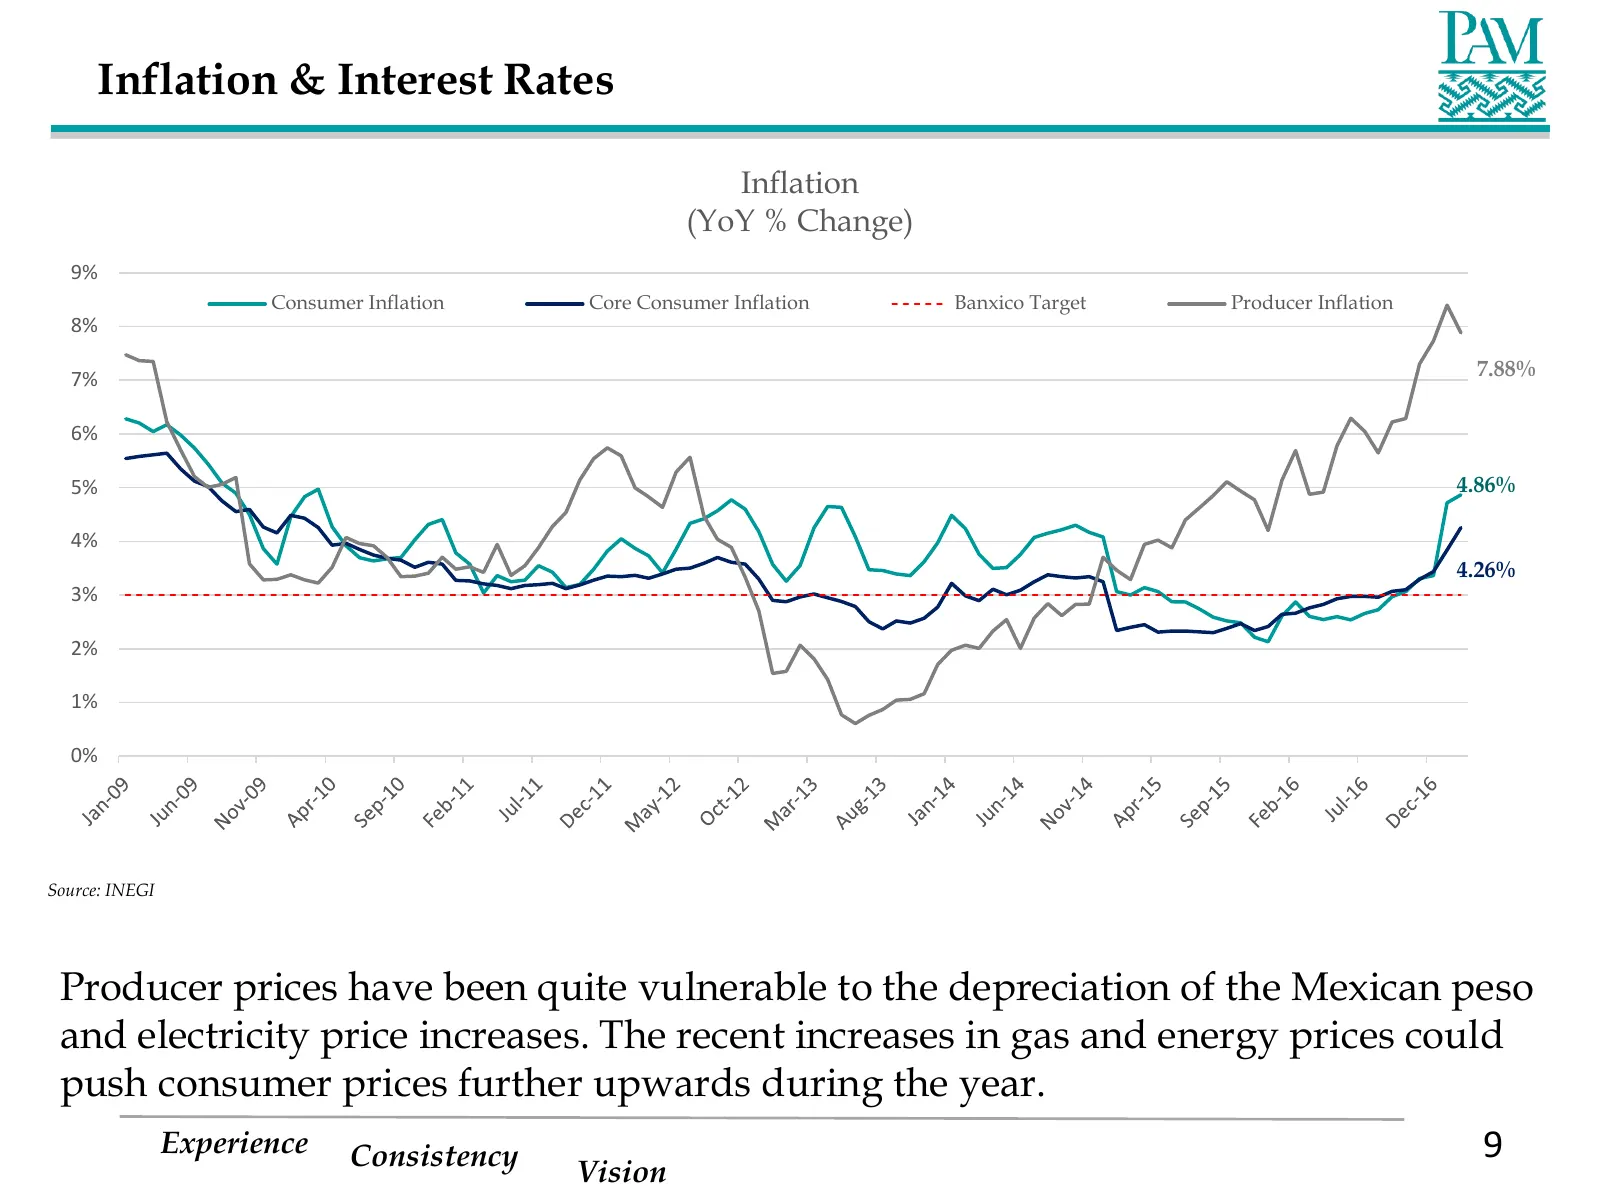
Slide 9: Inflation & Interest Rates: Inflation
Inflation & Interest Rates Inflation (YoY % Change) 9% Consumer Inflation Core Consumer Inflation Banxico Target Producer Inflation 8% 7% 7.88% 6% 5% 4.86% 4% 4.26% 3% 2% 1% 0% Source: INEGI Producer prices have been quite vulnerable to the depreciation of the Mexican peso and electricity price incr
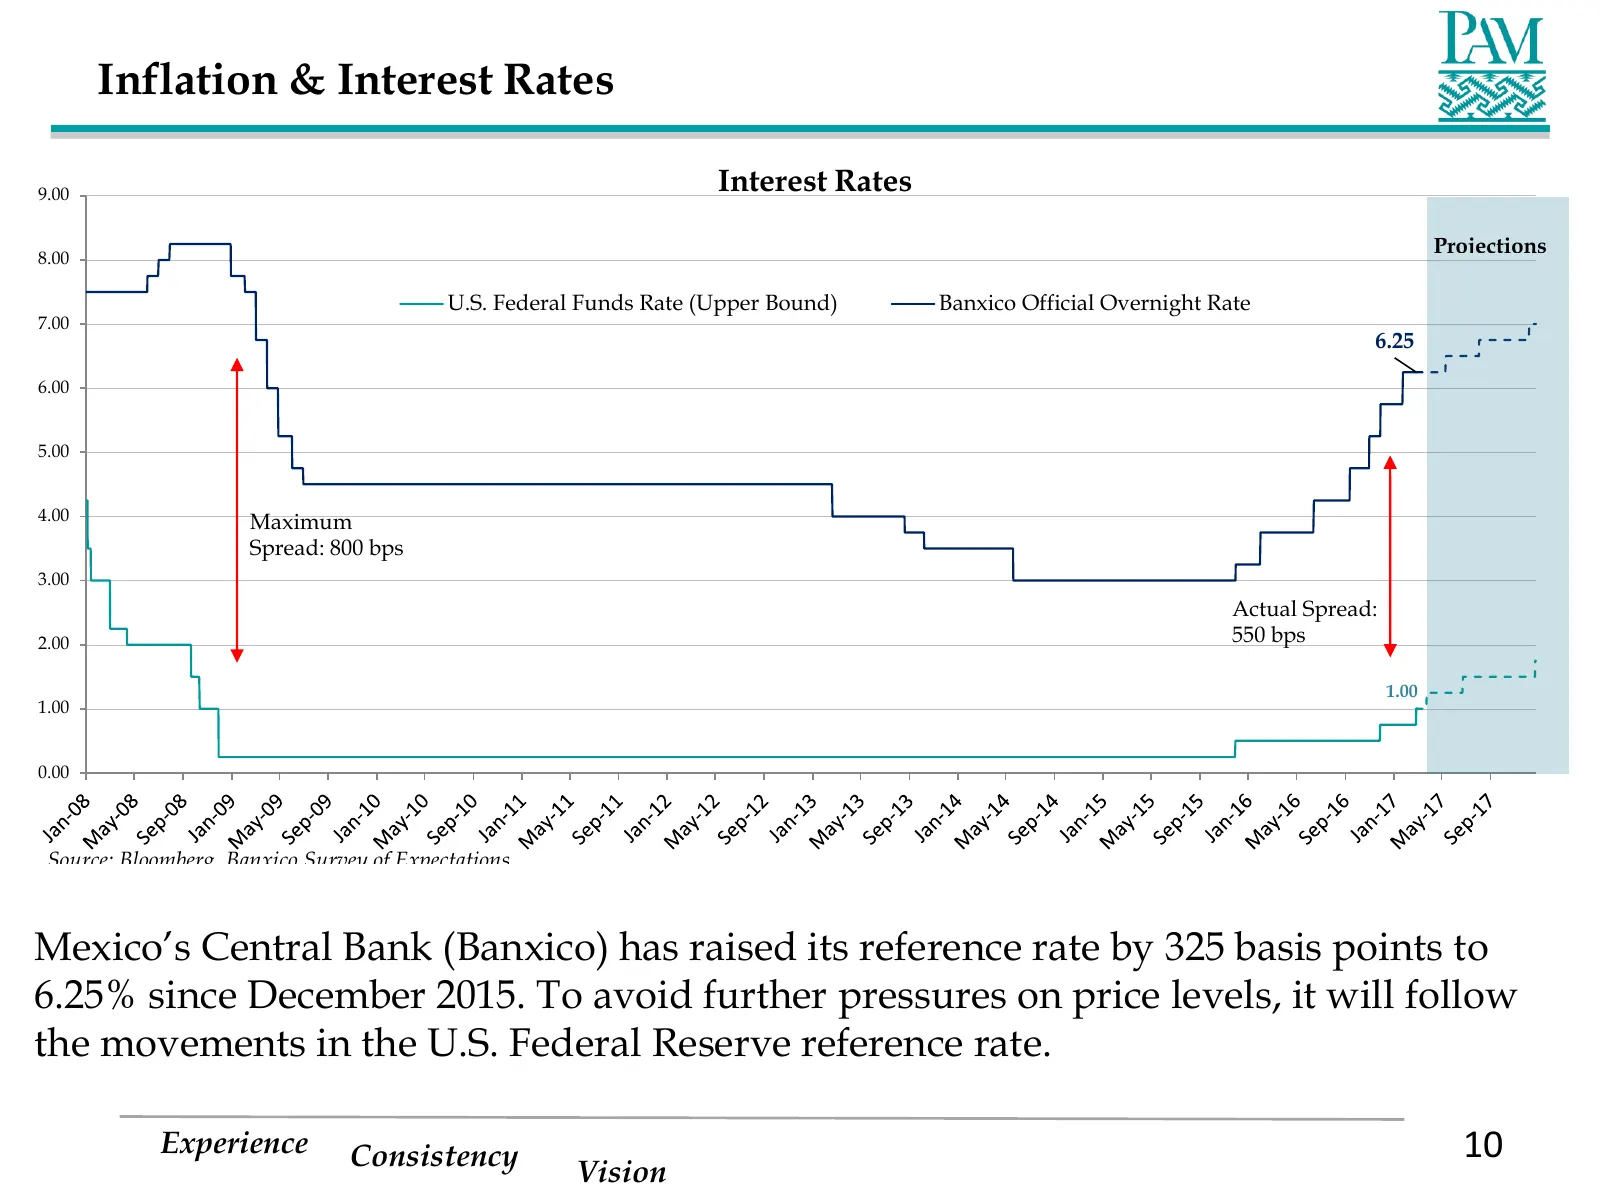
Slide 10: Inflation & Interest Rates: Interest Rates
Inflation & Interest Rates 9.00 Interest Rates Projections 8.00 U.S. Federal Funds Rate (Upper Bound) Banxico Official Overnight Rate 7.00 6.25 6.00 5.00 4.00 Maximum Spread: 800 bps 3.00 Actual Spread: 2.00 550 bps 1.00 1.00 0.00 Source: Bloomberg, Banxico Survey of Expectations Mexico’s Central Ba
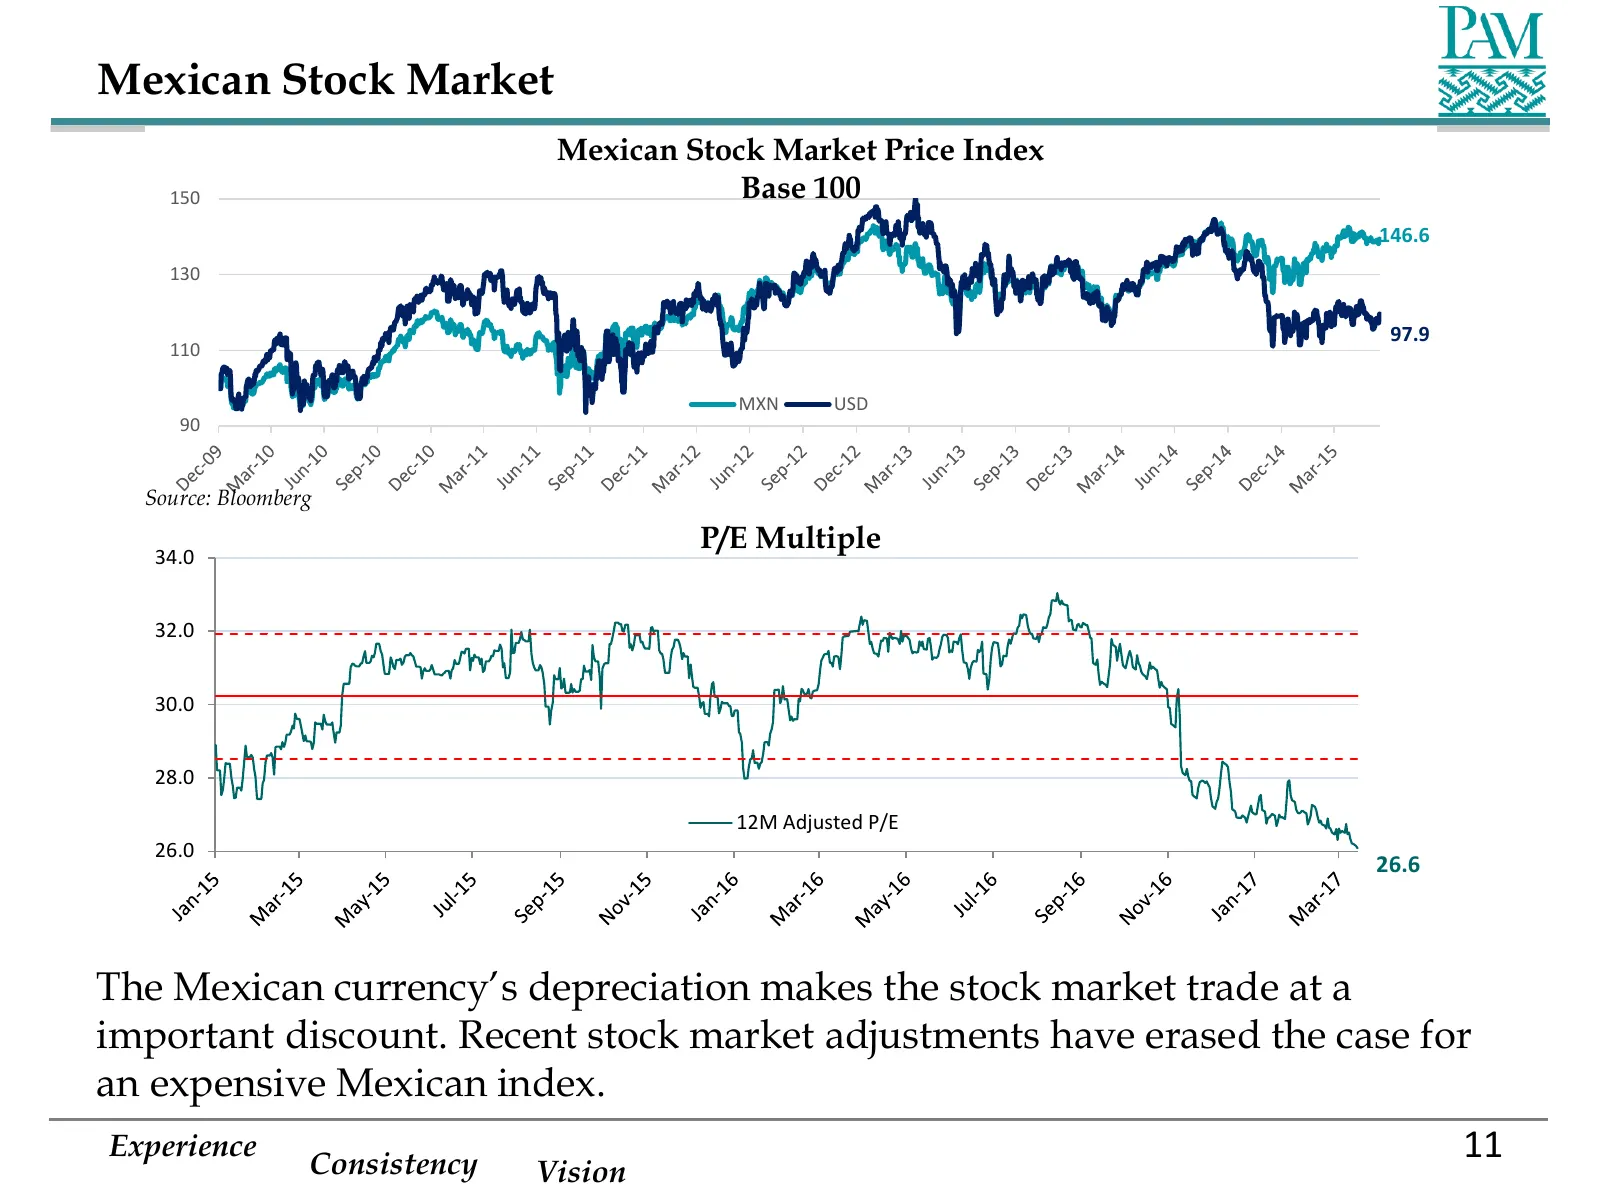
Slide 11: Mexican Stock Market
Mexican Stock Market Mexican Stock Market Price Index 150 Base 100 146.6 130 97.9 110 MXN USD 90 Source: Bloomberg P/E Multiple 34.0 32.0 30.0 28.0 12M Adjusted P/E 26.0 26.6 The Mexican currency’s depreciation makes the stock market trade at a important discount. Recent stock market adjustments hav
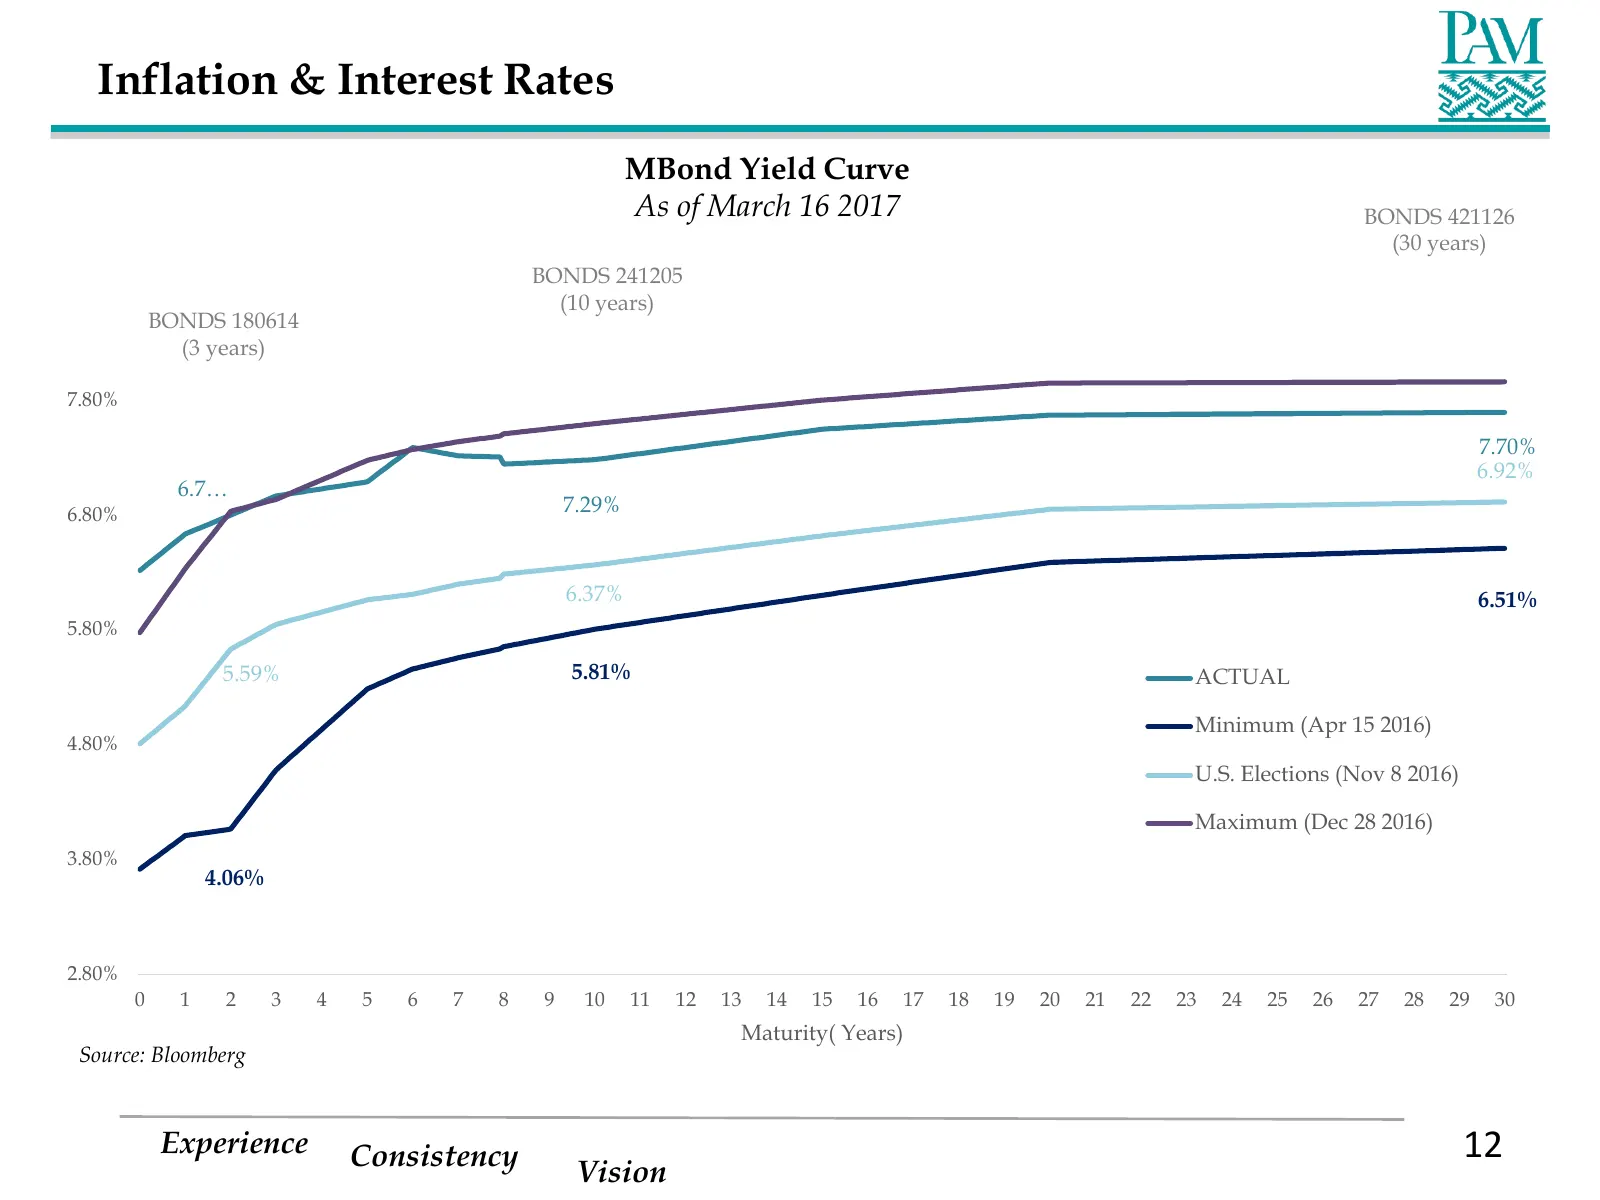
Slide 12: Inflation & Interest Rates: MBond Yield Curve
Inflation & Interest Rates MBond Yield Curve As of March 16 2017 BONDS 421126 (30 years) BONDS 241205 (10 years) BONDS 180614 (3 years) 7.80% 7.70% 6.92% 6.7… 6.80% 7.29% 6.37% 6.51% 5.80% 5.59% 5.81% ACTUAL Minimum (Apr 15 2016) 4.80% U.S. Elections (Nov 8 2016) Maximum (Dec 28 2016) 3.80% 4.06% 2.
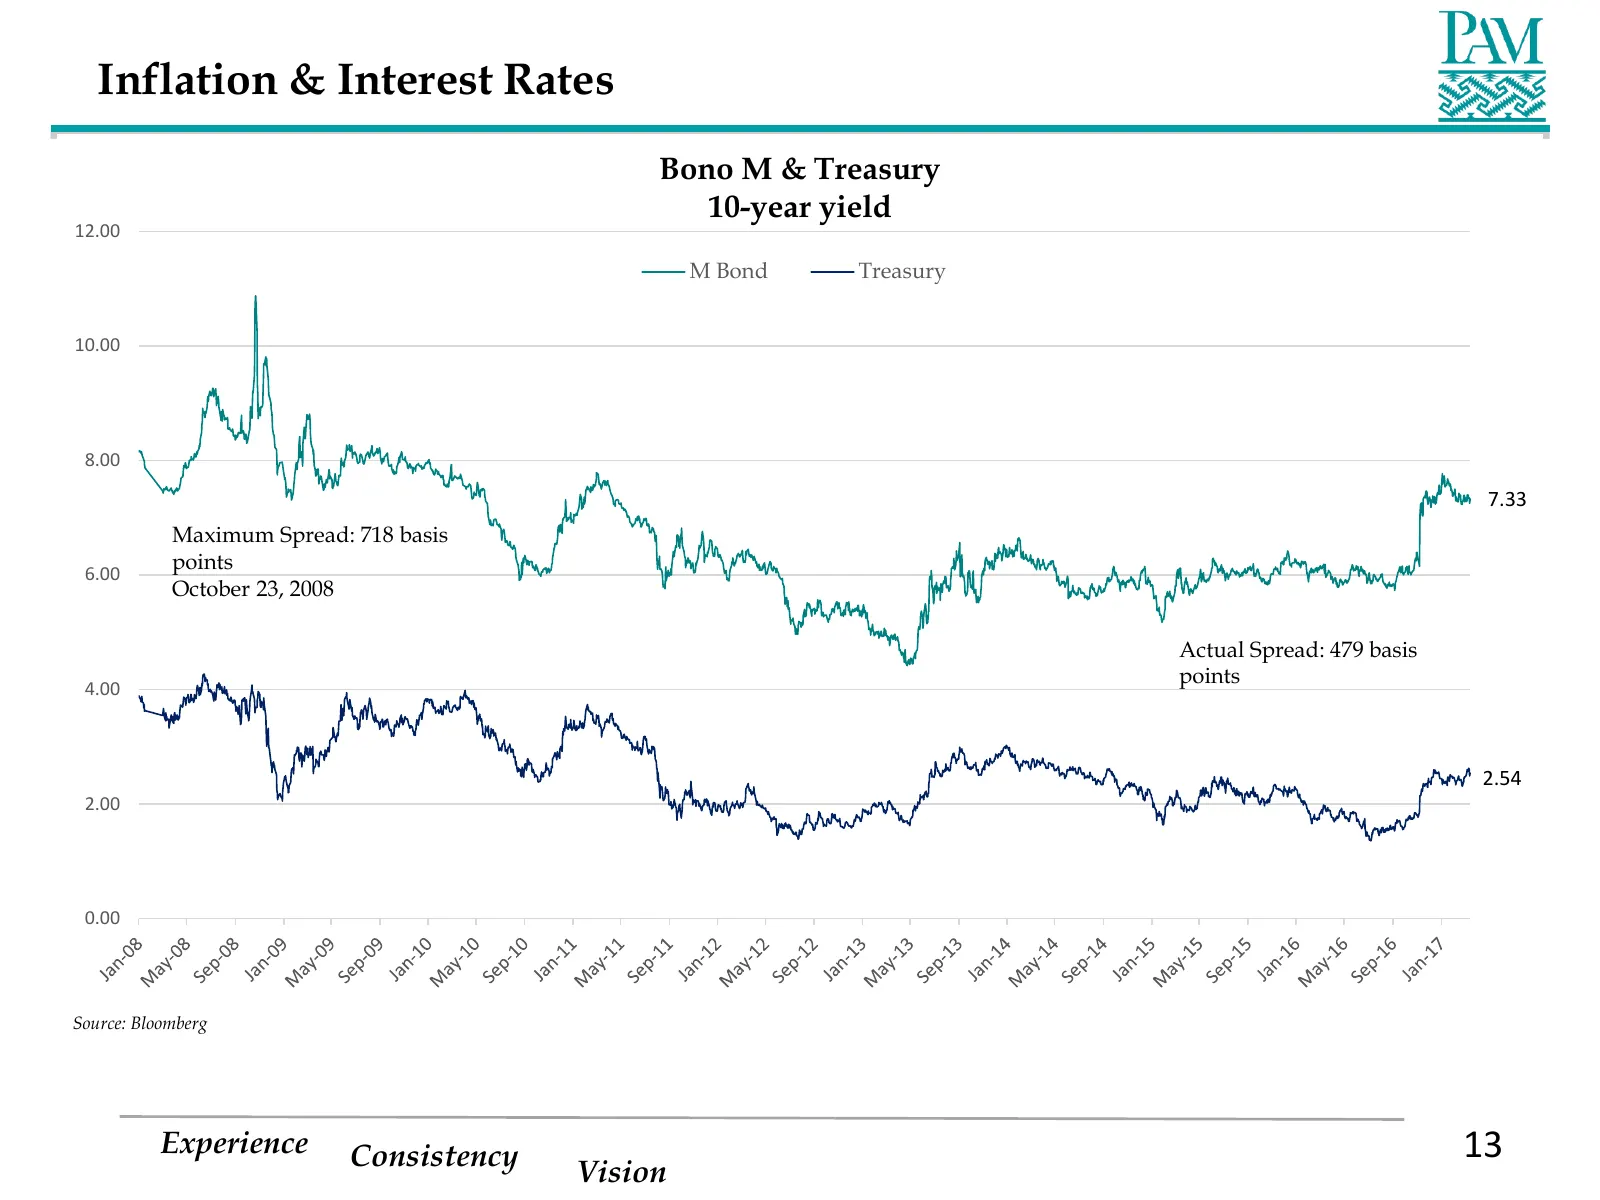
Slide 13: Inflation & Interest Rates: Bono M & Treasury
Inflation & Interest Rates Bono M & Treasury 10-year yield 12.00 M Bond Treasury 10.00 8.00 7.33 Maximum Spread: 718 basis points 6.00 October 23, 2008 Actual Spread: 479 basis points 4.00 2.54 2.00 0.00 Source: Bloomberg Experience Consistency 13 Vision
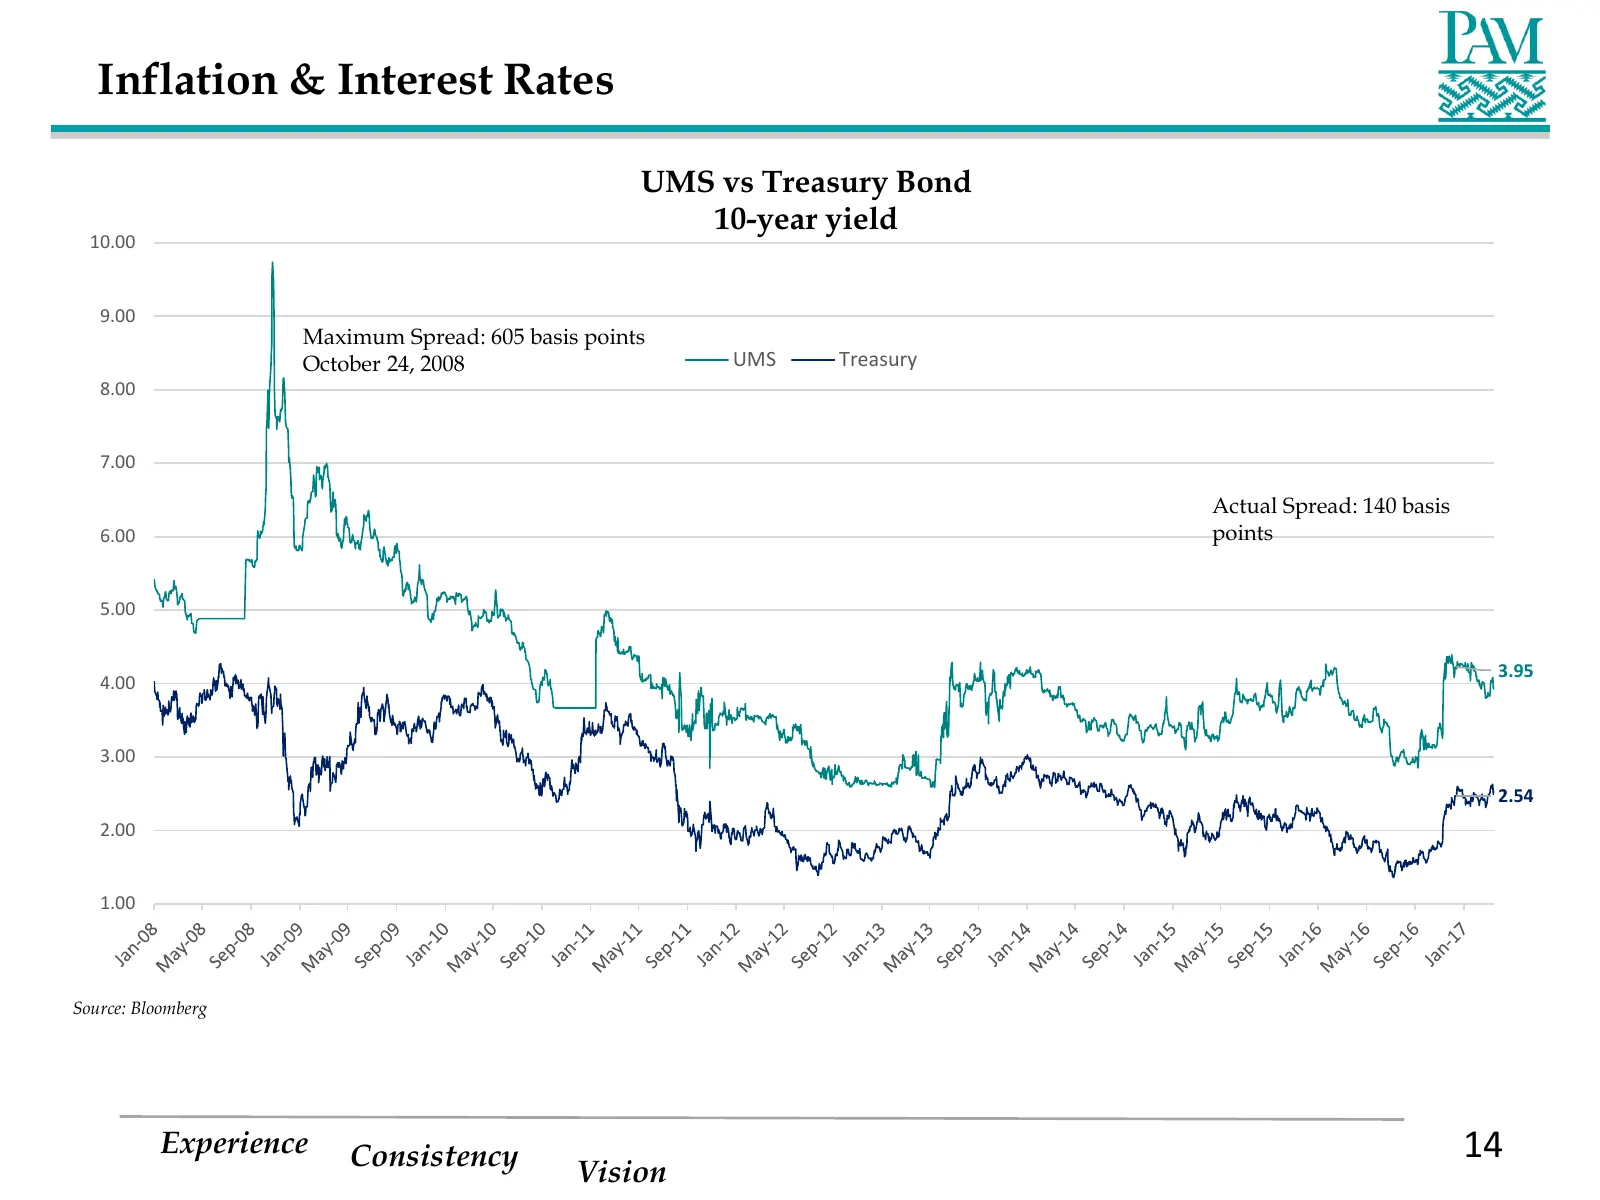
Slide 14: Inflation & Interest Rates: UMS vs Treasury Bond
Inflation & Interest Rates UMS vs Treasury Bond 10-year yield 10.00 9.00 Maximum Spread: 605 basis points October 24, 2008 UMS Treasury 8.00 7.00 Actual Spread: 140 basis 6.00 points 5.00 3.95 4.00 3.00 2.54 2.00 1.00 Source: Bloomberg Experience Consistency 14 Vision
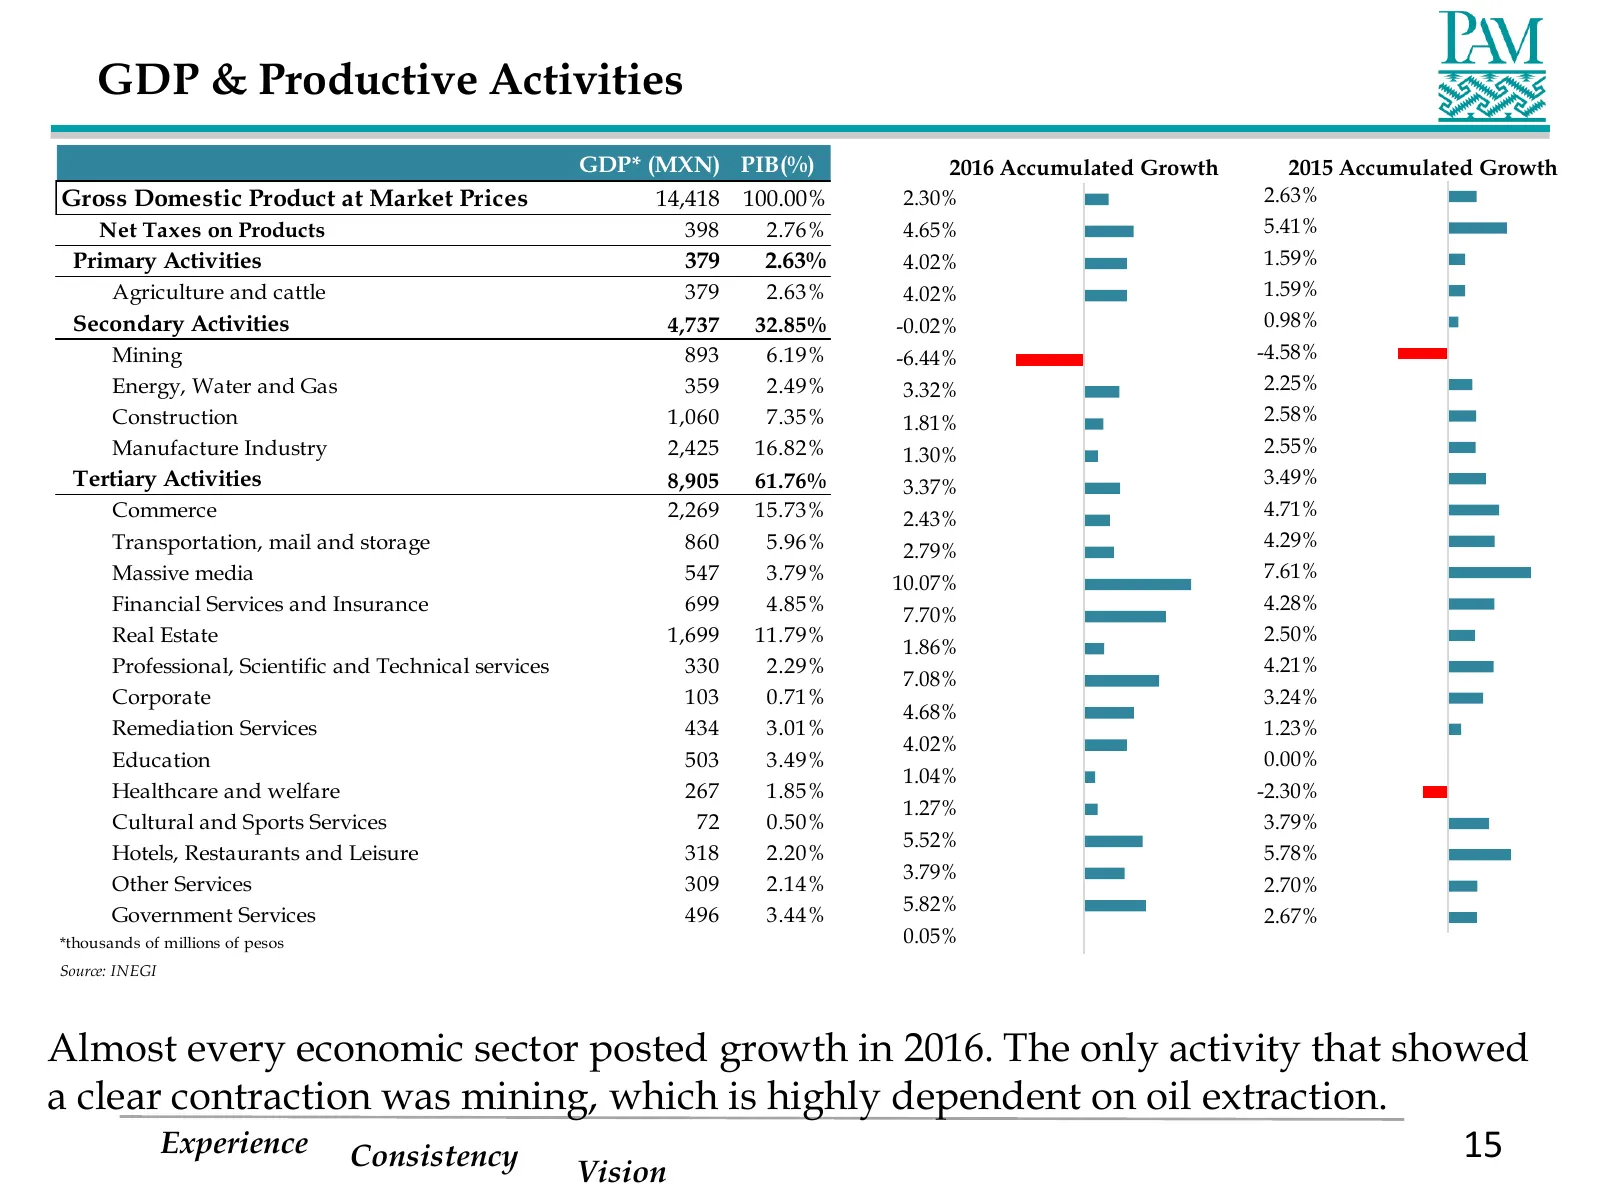
Slide 15: GDP & Productive Activities
GDP & Productive Activities GDP* (MXN) PIB(%) 2016 Accumulated Growth 2015 Accumulated Growth Gross Domestic Product at Market Prices 14,418 100.00% 2.30% 2.63% Net Taxes on Products 398 2.76% 4.65% 5.41% Primary Activities 379 2.63% 4.02% 1.59% Agriculture and cattle 379 2.63% 4.02% 1.59% Secondary
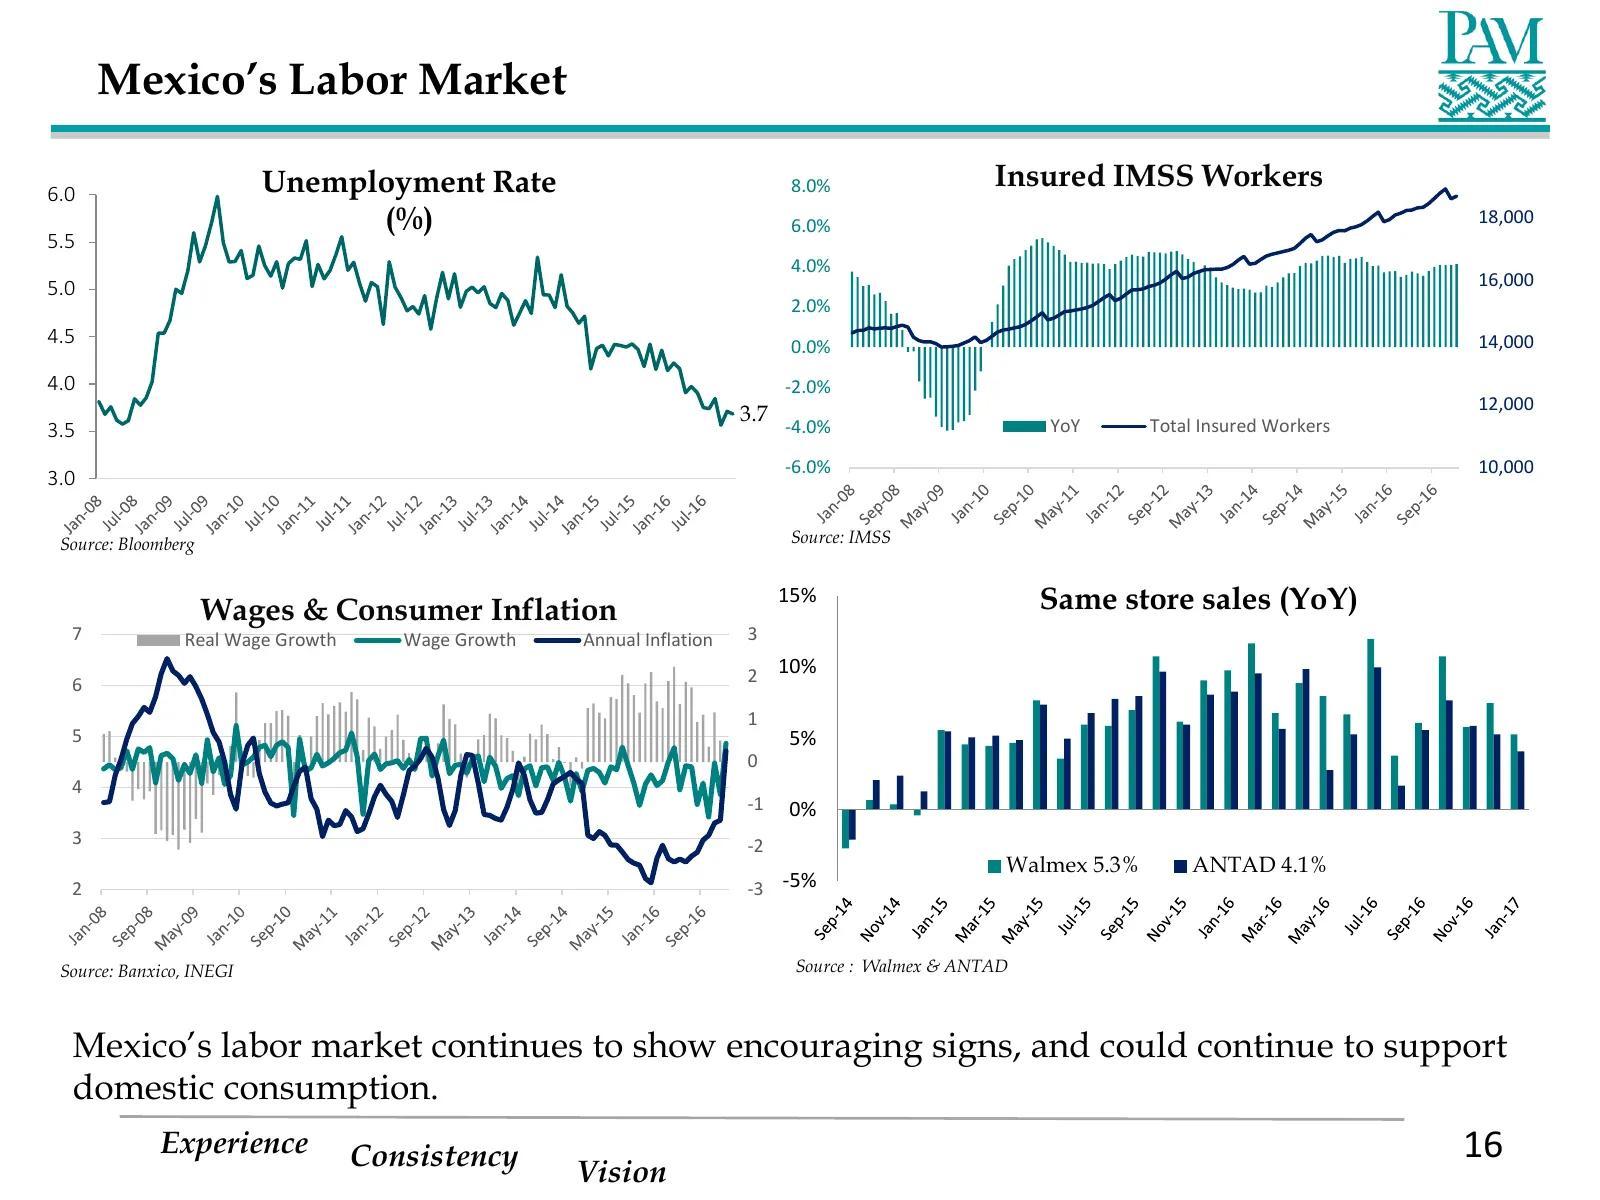
Slide 16: Mexico's Labor Market
Mexico’s Labor Market 6.0 Unemployment Rate 8.0% Insured IMSS Workers (%) 6.0% 18,000 5.5 4.0% 5.0 16,000 2.0% 4.5 0.0% 14,000 4.0 -2.0% 12,000 3.7 YoY Total Insured Workers 3.5 -4.0% -6.0% 10,000 3.0 Source: Bloomberg Source: IMSS Wages & Consumer Inflation 15% Same store sales (YoY) 7 Real Wage Gr
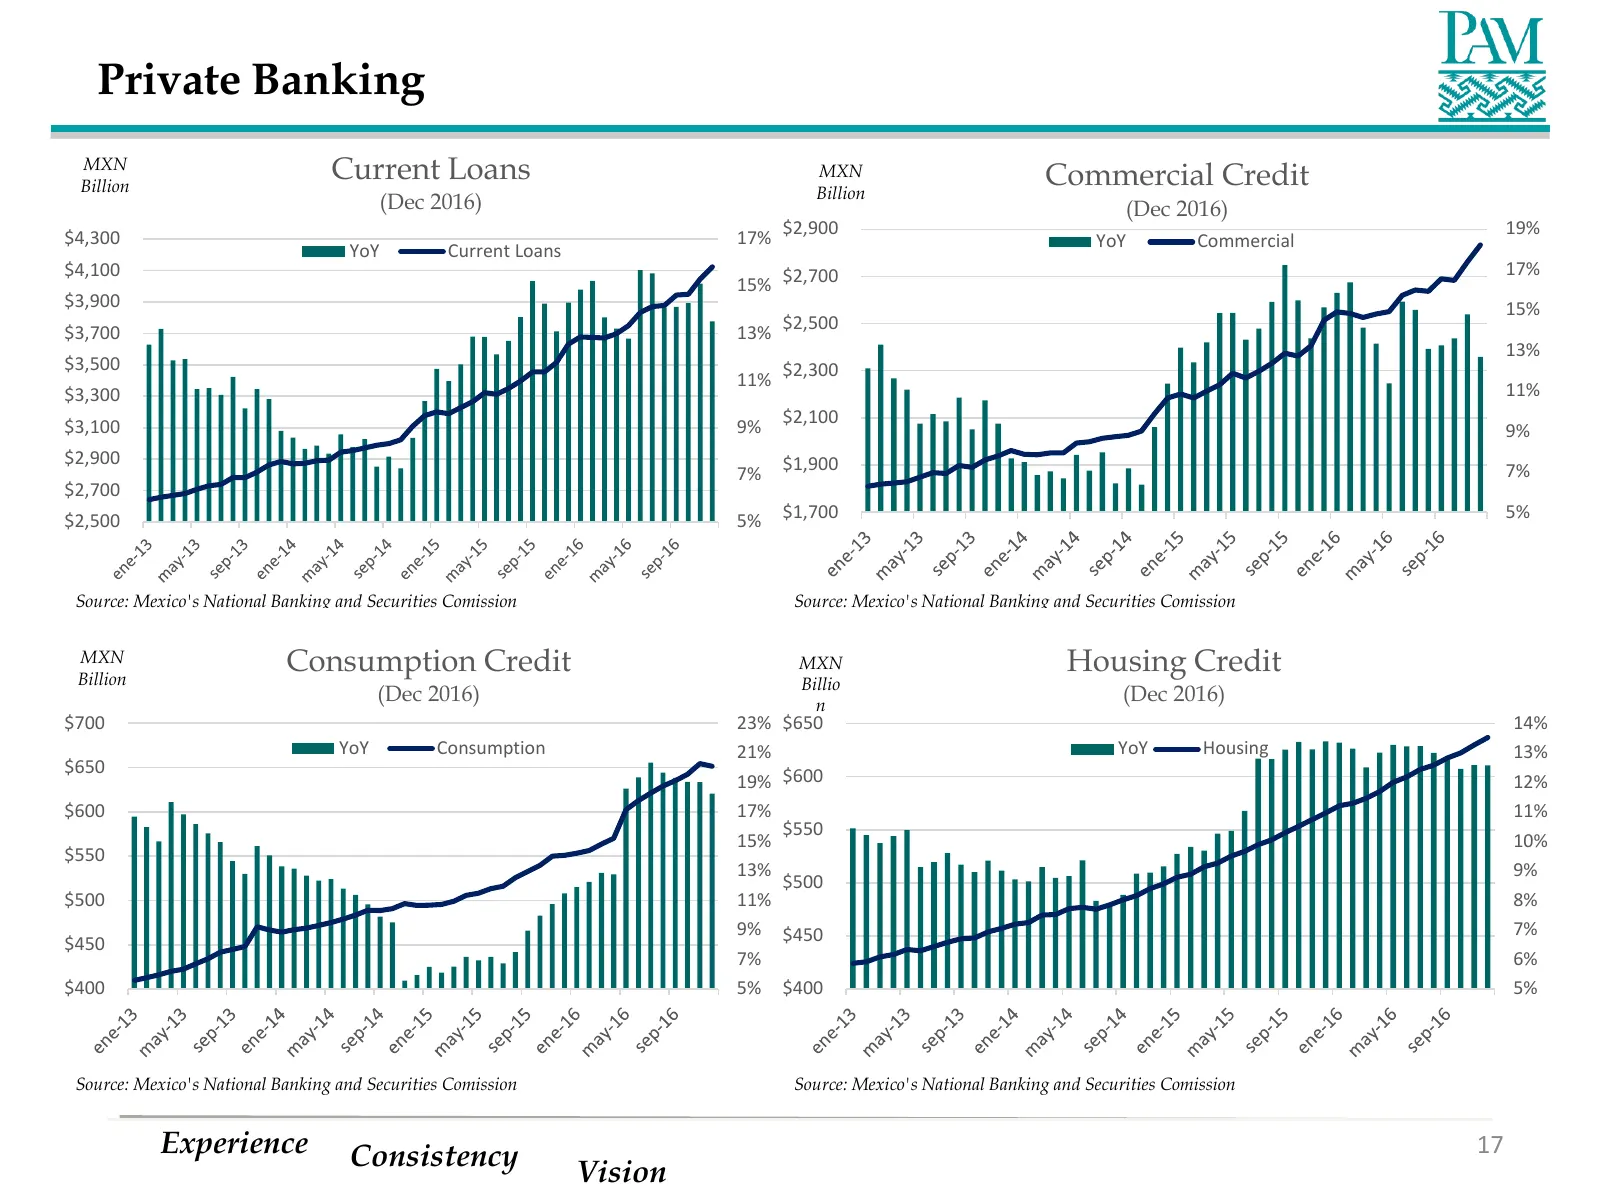
Slide 17: Private Banking
Private Banking MXN Billion Current Loans MXN Commercial Credit Billion (Dec 2016) (Dec 2016) $4,300 17% $2,900 YoY Commercial 19% YoY Current Loans $4,100 17% 15% $2,700 $3,900 15% $3,700 13% $2,500 13% $3,500 11% $2,300 $3,300 11% $3,100 9% $2,100 9% $2,900 $1,900 7% 7% $2,700 $2,500 5% $1,700 5%
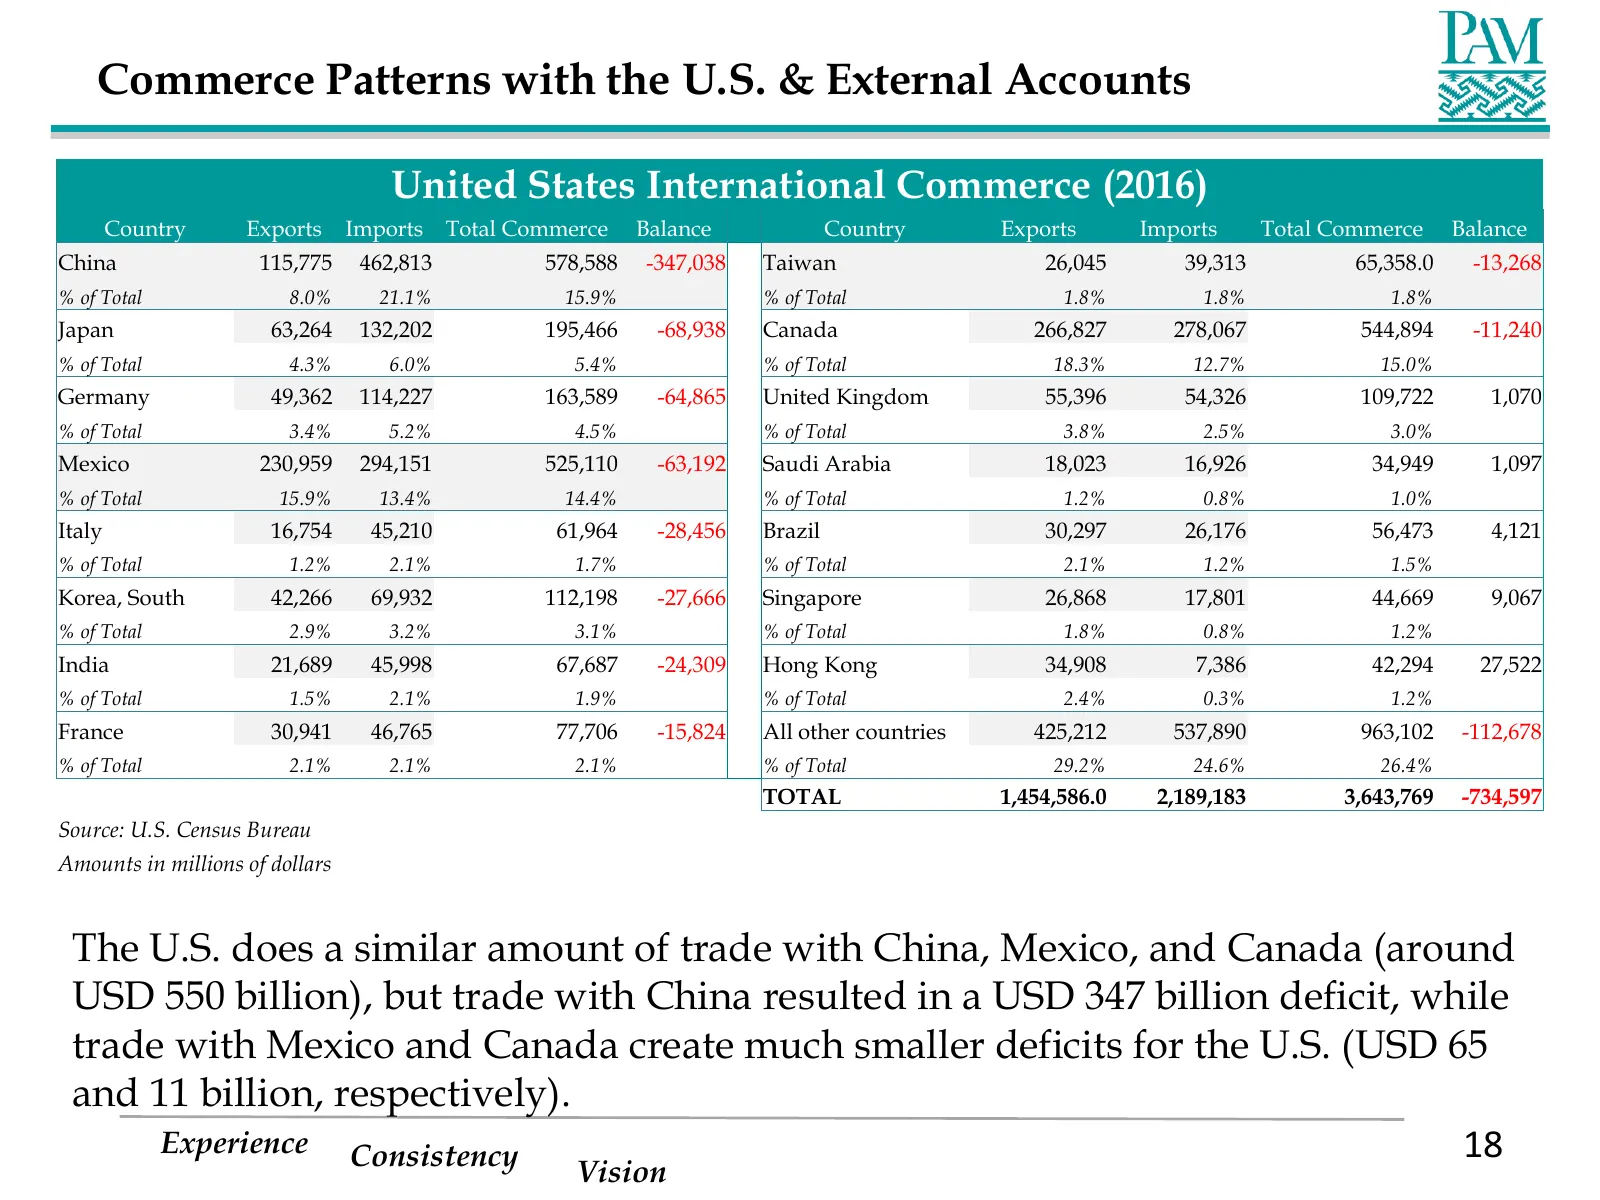
Slide 18: Commerce Patterns with the U.S. & External Accounts
Commerce Patterns with the U.S. & External Accounts United States International Commerce (2016) Country Exports Imports Total Commerce Balance Country Exports Imports Total Commerce Balance China 115,775 462,813 578,588 -347,038 Taiwan 26,045 39,313 65,358.0 -13,268 % of Total 8.0% 21.1% 15.9% % of
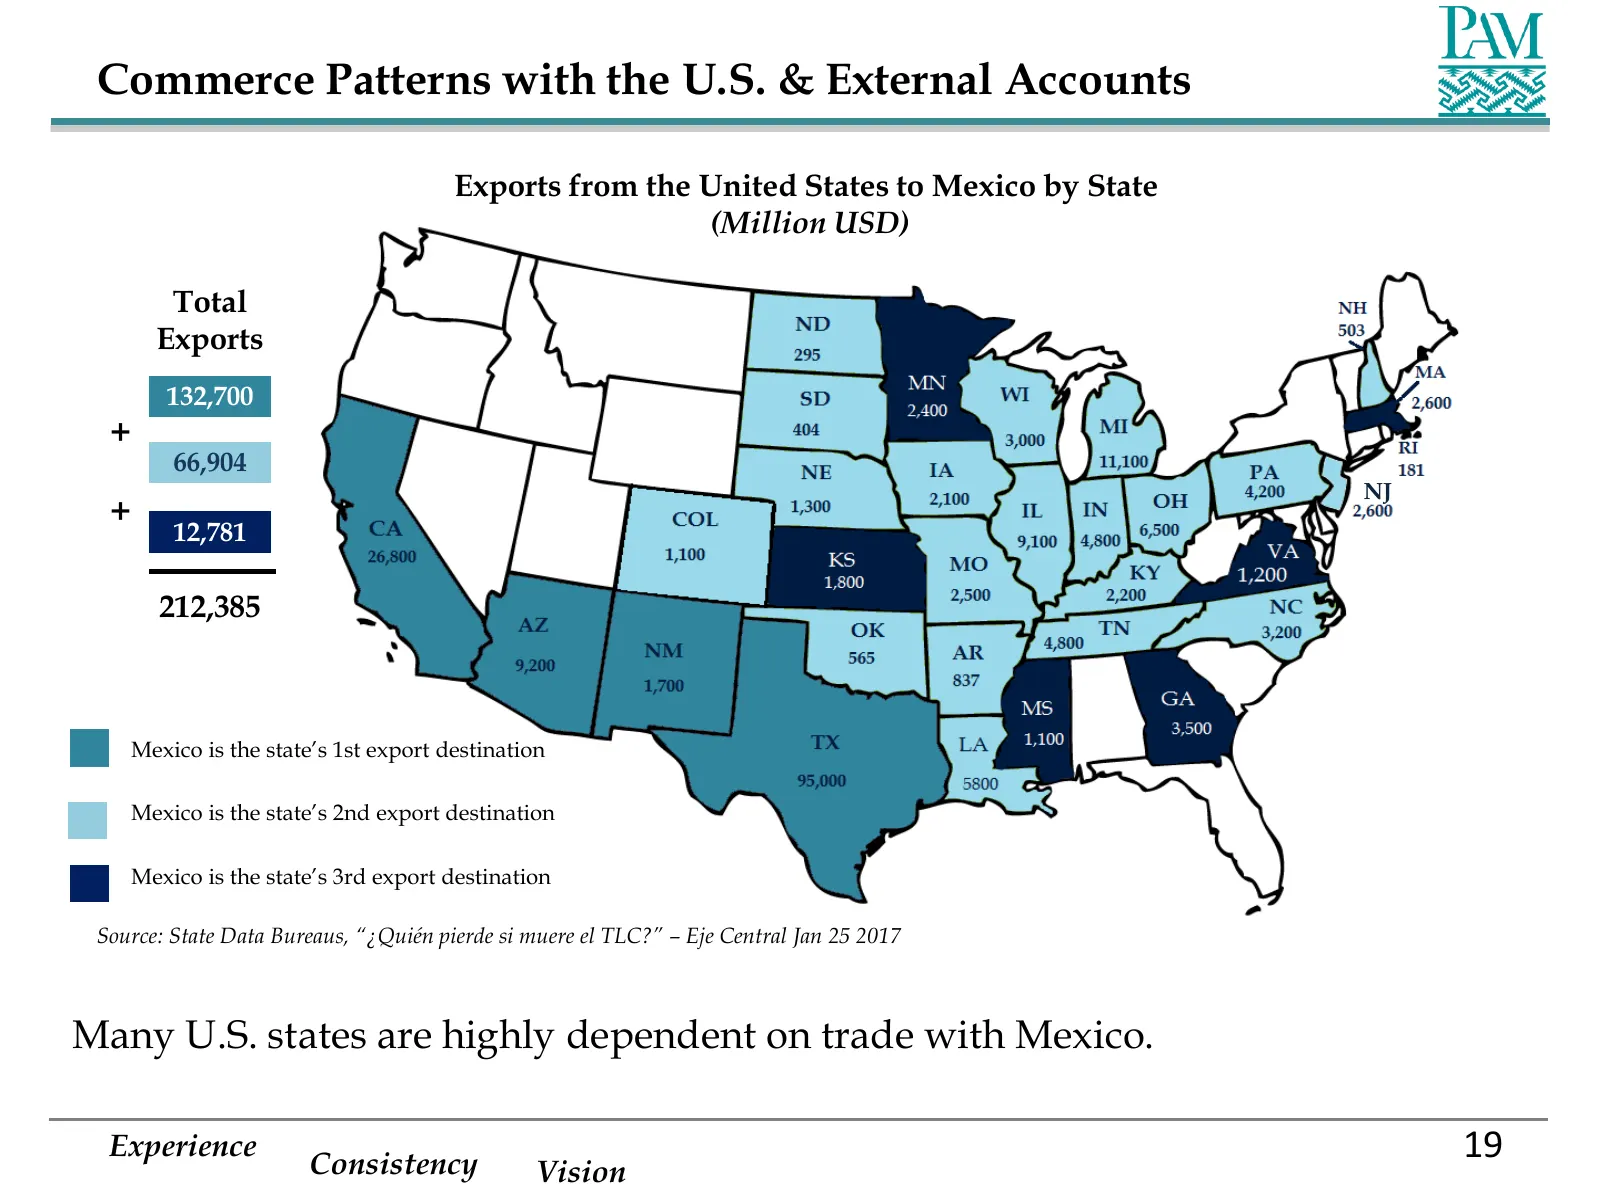
Slide 19: Commerce Patterns with the U.S. & External Accounts
Commerce Patterns with the U.S. & External Accounts Exports from the United States to Mexico by State (Million USD) Total Exports 132,700 + 66,904 NJ + 12,781 212,385 Mexico is the state’s 1st export destination Mexico is the state’s 2nd export destination Mexico is the state’s 3rd export destinatio
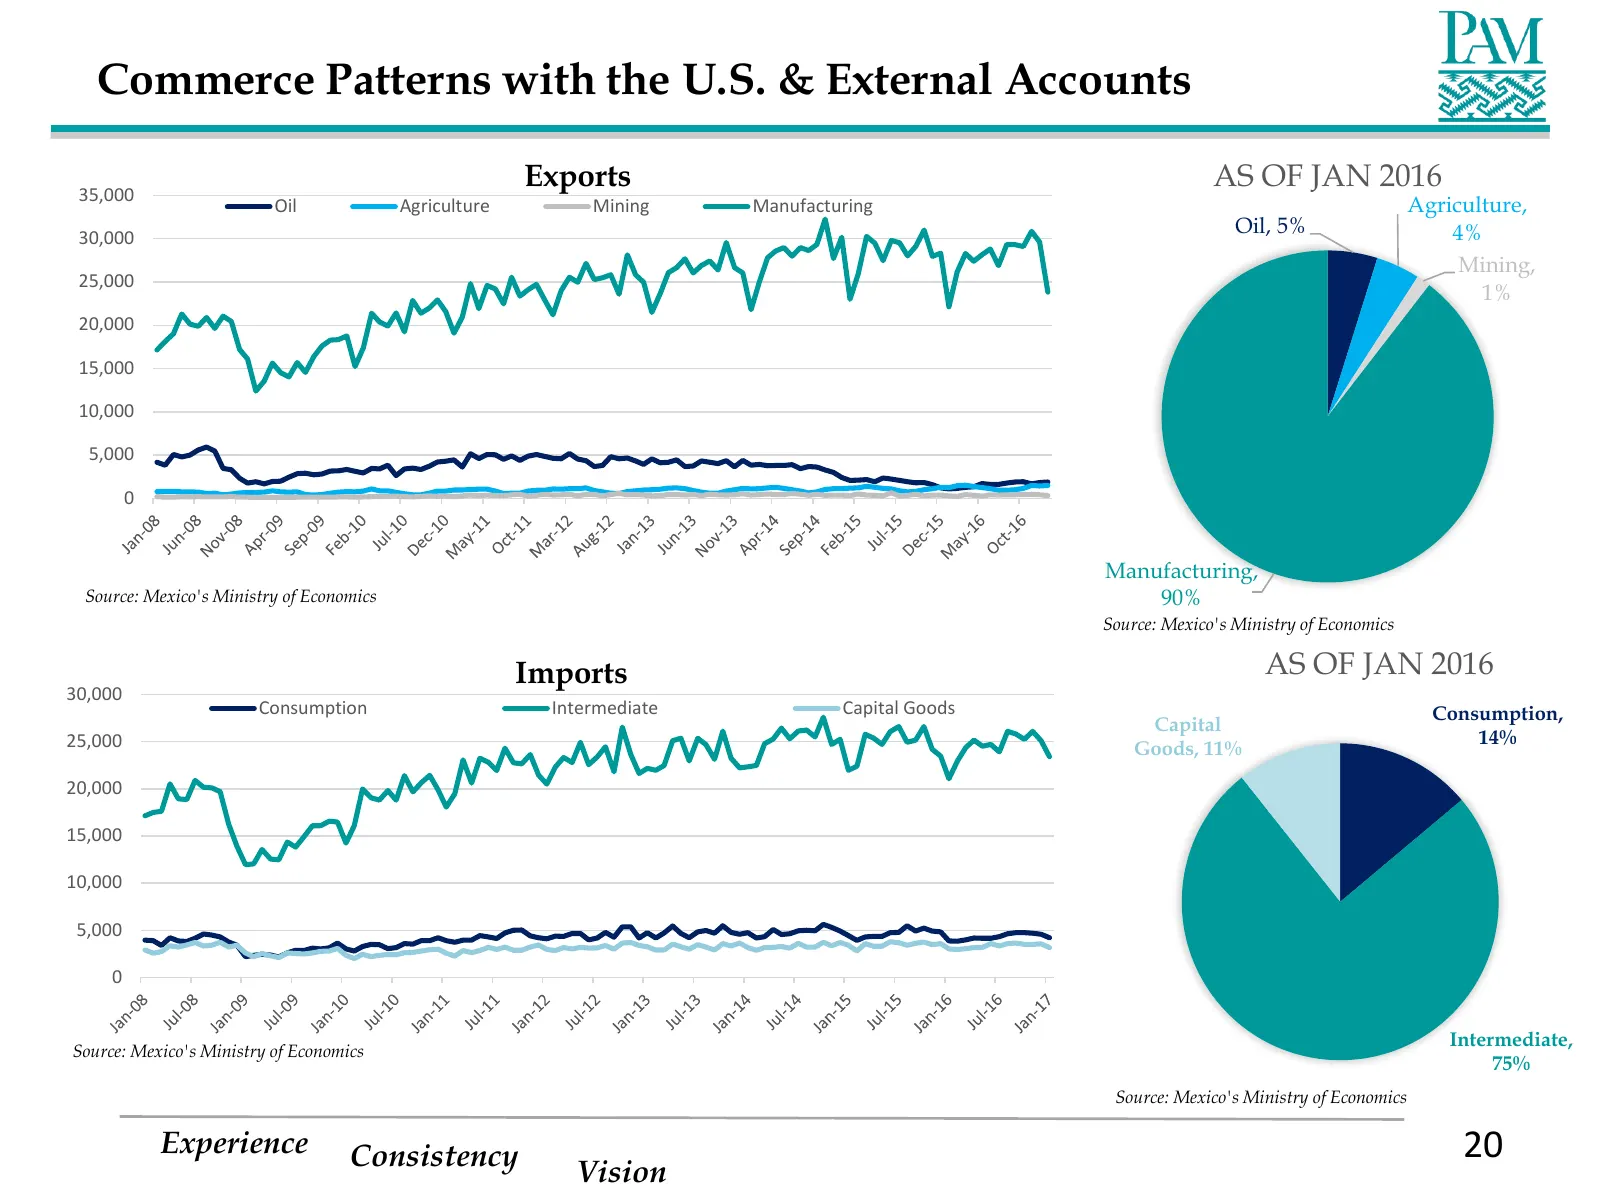
Slide 20: Commerce Patterns with the U.S. & External Accounts
Commerce Patterns with the U.S. & External Accounts 35,000 Exports AS OF JAN 2016 Oil Agriculture Mining Manufacturing Agriculture, 30,000 Oil, 5% 4% Mining, 25,000 1% 20,000 15,000 10,000 5,000 0 Manufacturing, Source: Mexico's Ministry of Economics 90% Source: Mexico's Ministry of Economics Import
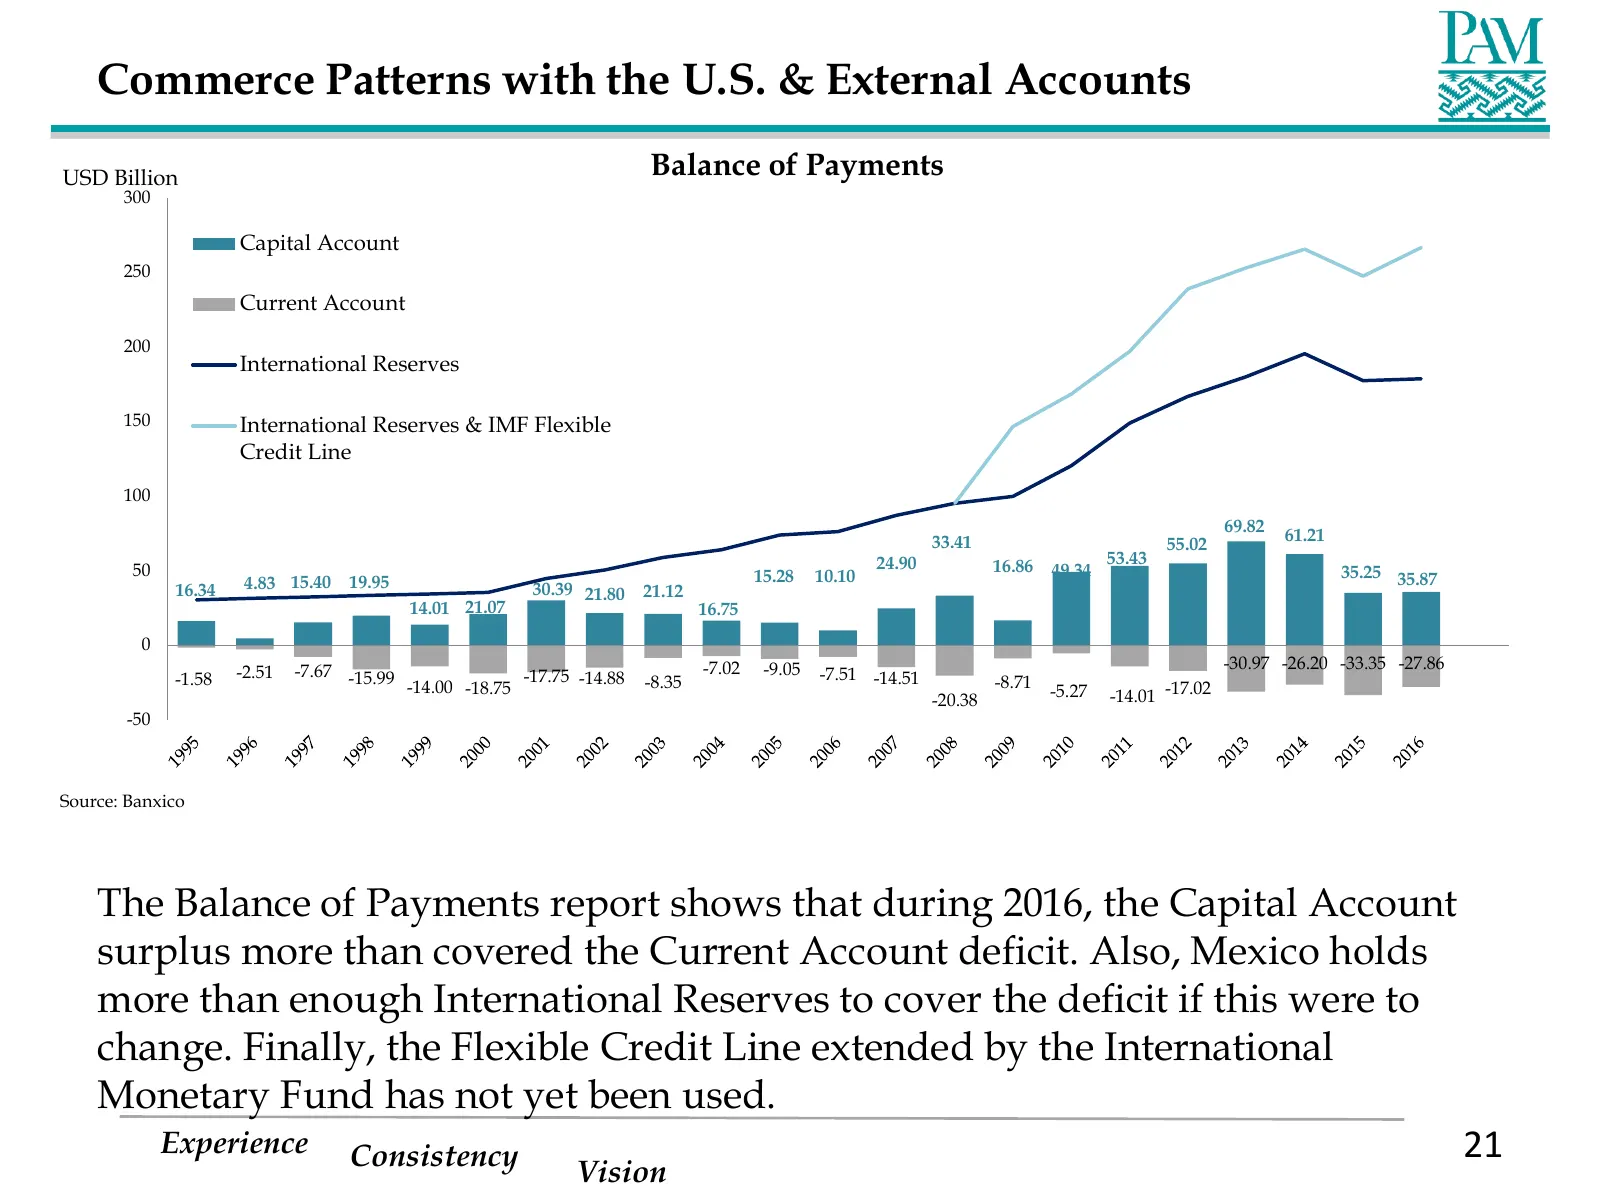
Slide 21: Commerce Patterns: Balance of Payments
Commerce Patterns with the U.S. & External Accounts USD Billion Balance of Payments 300 Capital Account 250 Current Account 200 International Reserves 150 International Reserves & IMF Flexible Credit Line 100 69.82 33.41 55.02 61.21 24.90 16.86 53.43 50 15.28 10.10 49.34 35.25 35.87 16.34 4.83 15.40
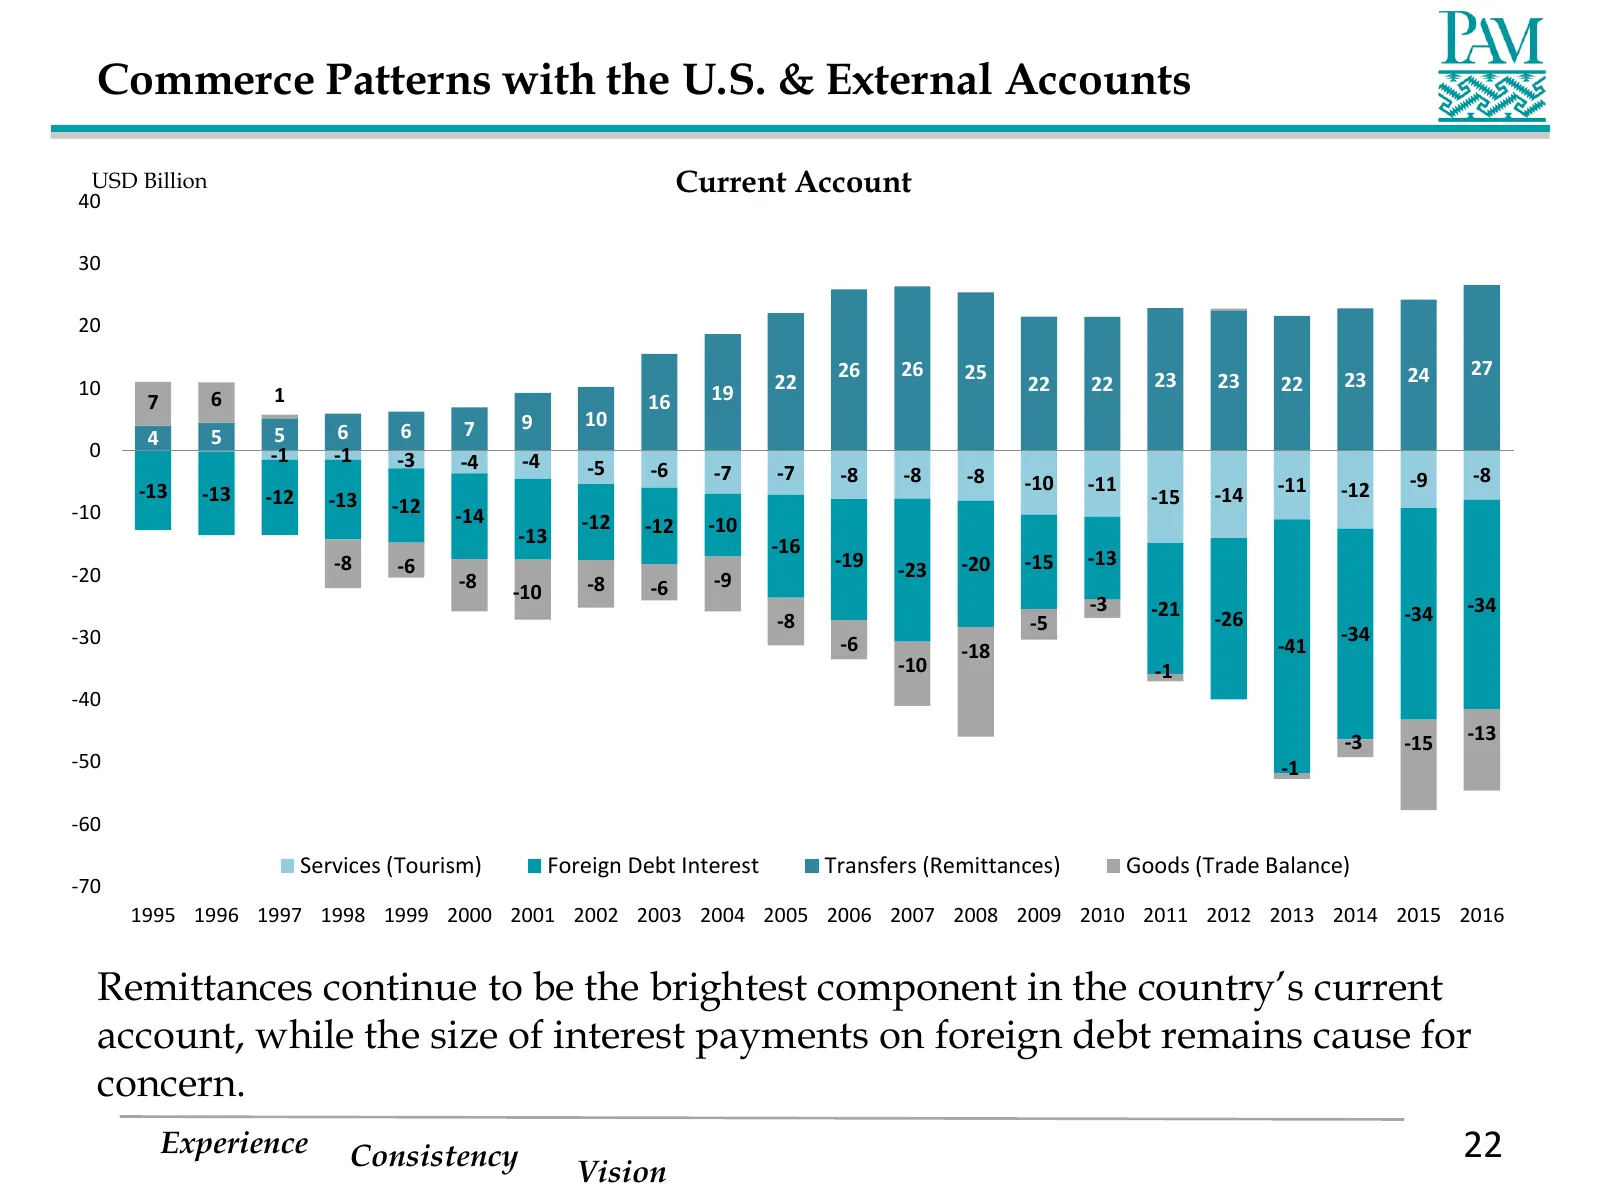
Slide 22: Commerce Patterns: Current Account
Commerce Patterns with the U.S. & External Accounts USD Billion Current Account 40 30 20 26 26 25 24 27 10 22 22 22 23 23 22 23 7 6 1 16 19 7 9 10 4 5 5 6 6 0 -1 -1 -3 -4 -4 -5 -6 -7 -7 -8 -8 -8 -10 -11 -11 -9 -8 -13 -13 -12 -13 -15 -14 -12 -10 -12 -14 -12 -12 -10 -13 -16 -8 -6 -19 -20 -15 -13 -20 -
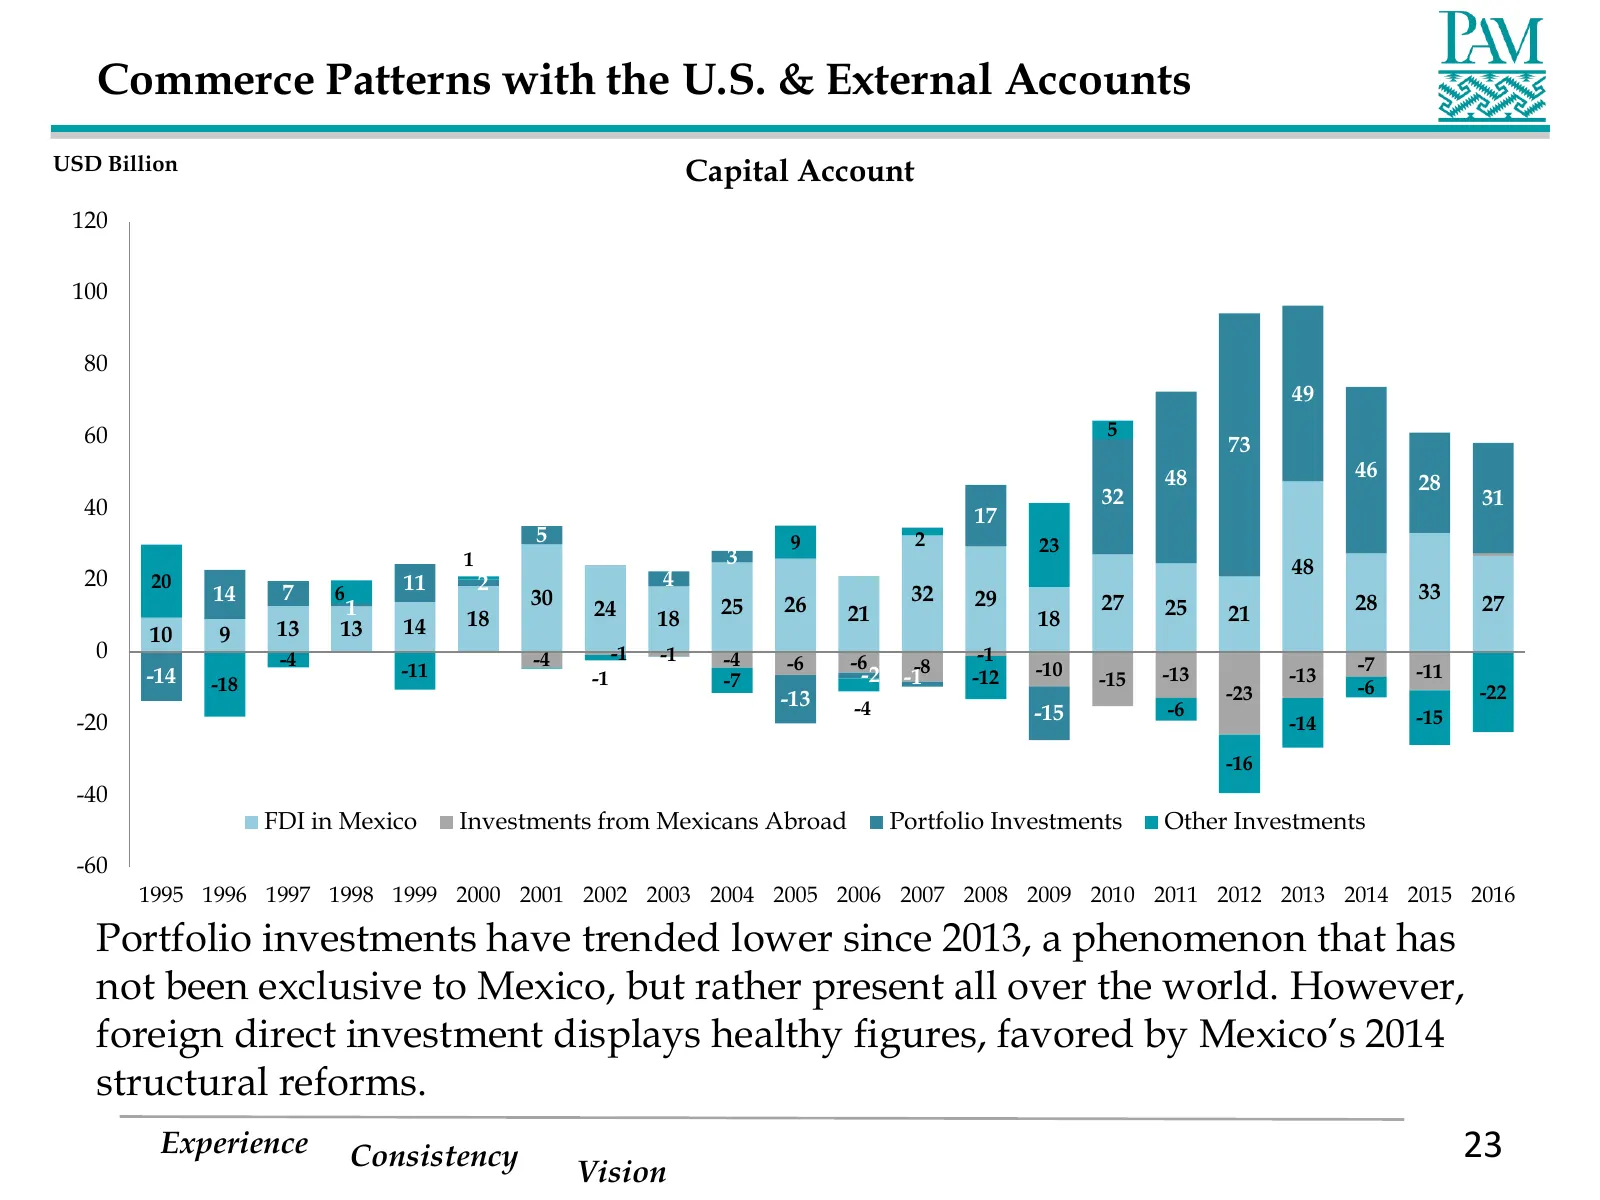
Slide 23: Commerce Patterns: Capital Account
Commerce Patterns with the U.S. & External Accounts USD Billion Capital Account 120 100 80 49 60 5 73 48 46 28 40 32 31 17 5 9 2 23 1 3 48 20 20 11 2 4 14 7 6 30 32 29 27 28 33 1 24 25 26 21 25 21 27 13 13 14 18 18 18 10 9 0 -4 -4 -1 -1 -4 -6 -1 -6 -7 -14 -18 -11 -1 -7 -2 -1-8 -12 -10 -15 -13 -13 -6
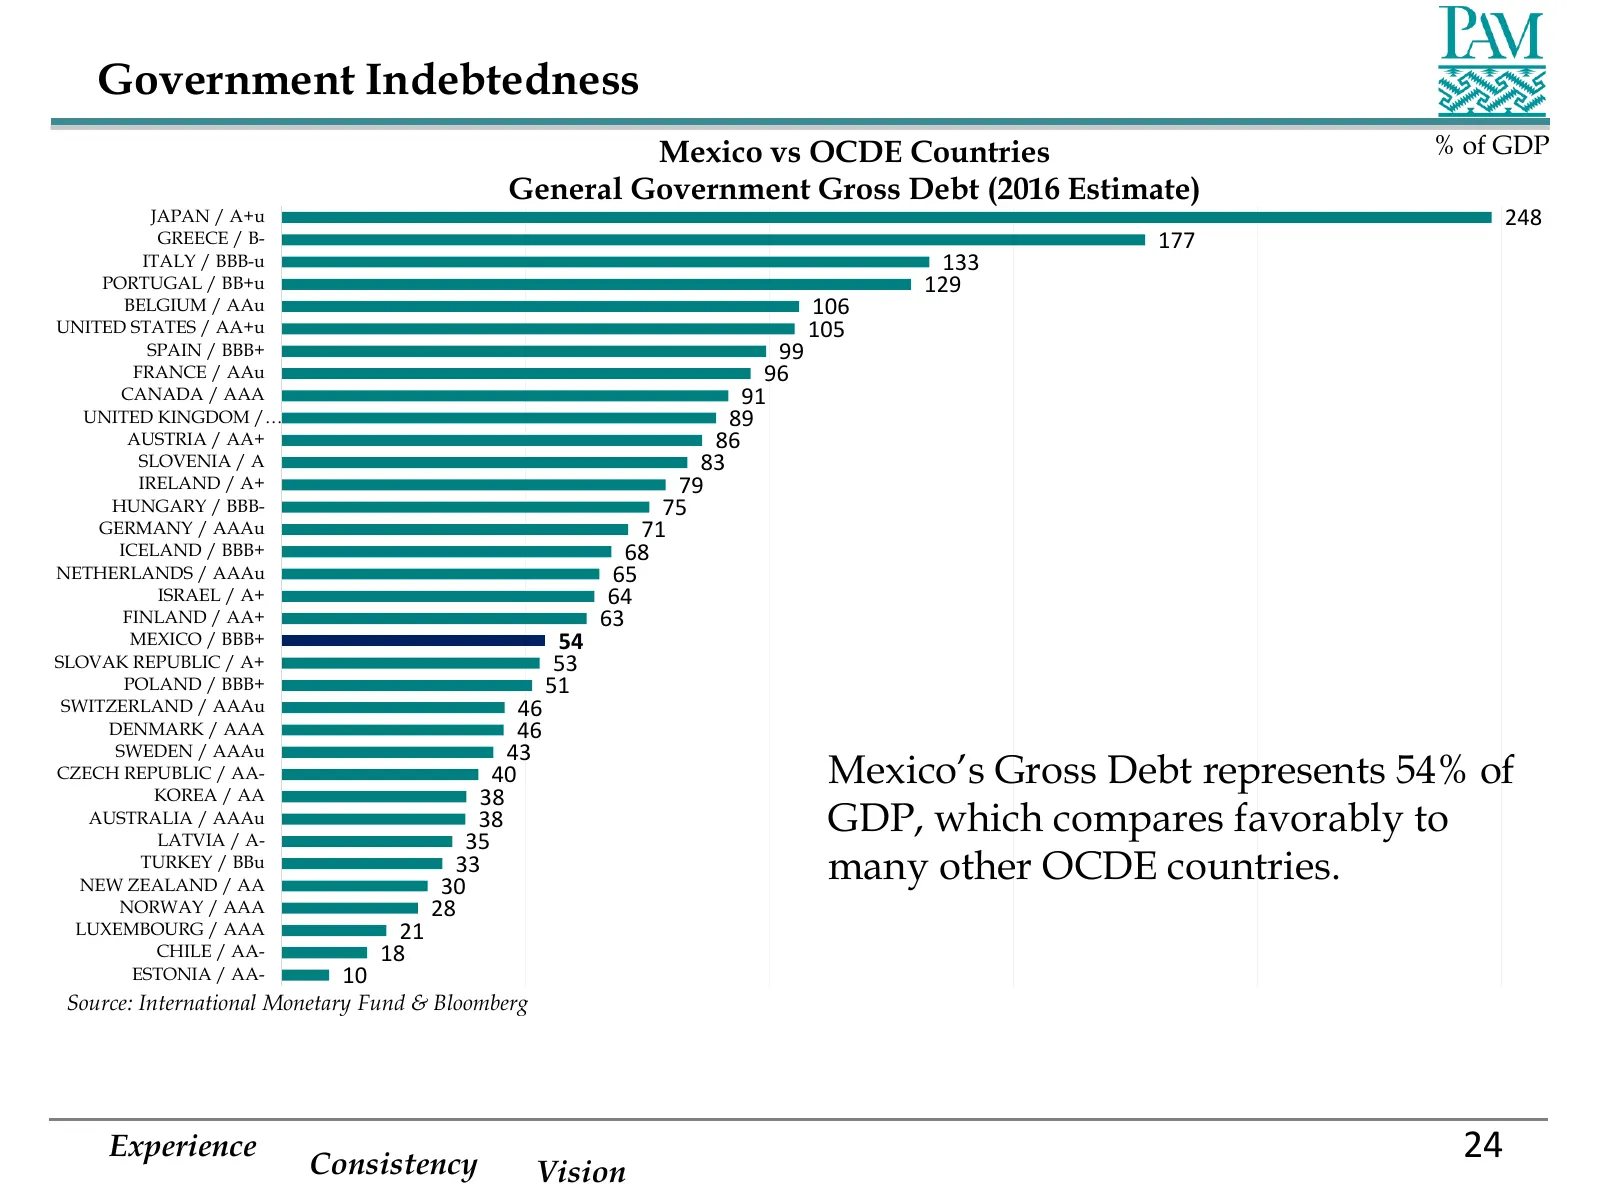
Slide 24: Government Indebtedness
Government Indebtedness Mexico vs OCDE Countries % of GDP General Government Gross Debt (2016 Estimate) JAPAN / A+u 248 GREECE / B- 177 ITALY / BBB-u 133 PORTUGAL / BB+u 129 BELGIUM / AAu 106 UNITED STATES / AA+u 105 SPAIN / BBB+ 99 FRANCE / AAu 96 CANADA / AAA 91 UNITED KINGDOM /… 89 AUSTRIA / AA+
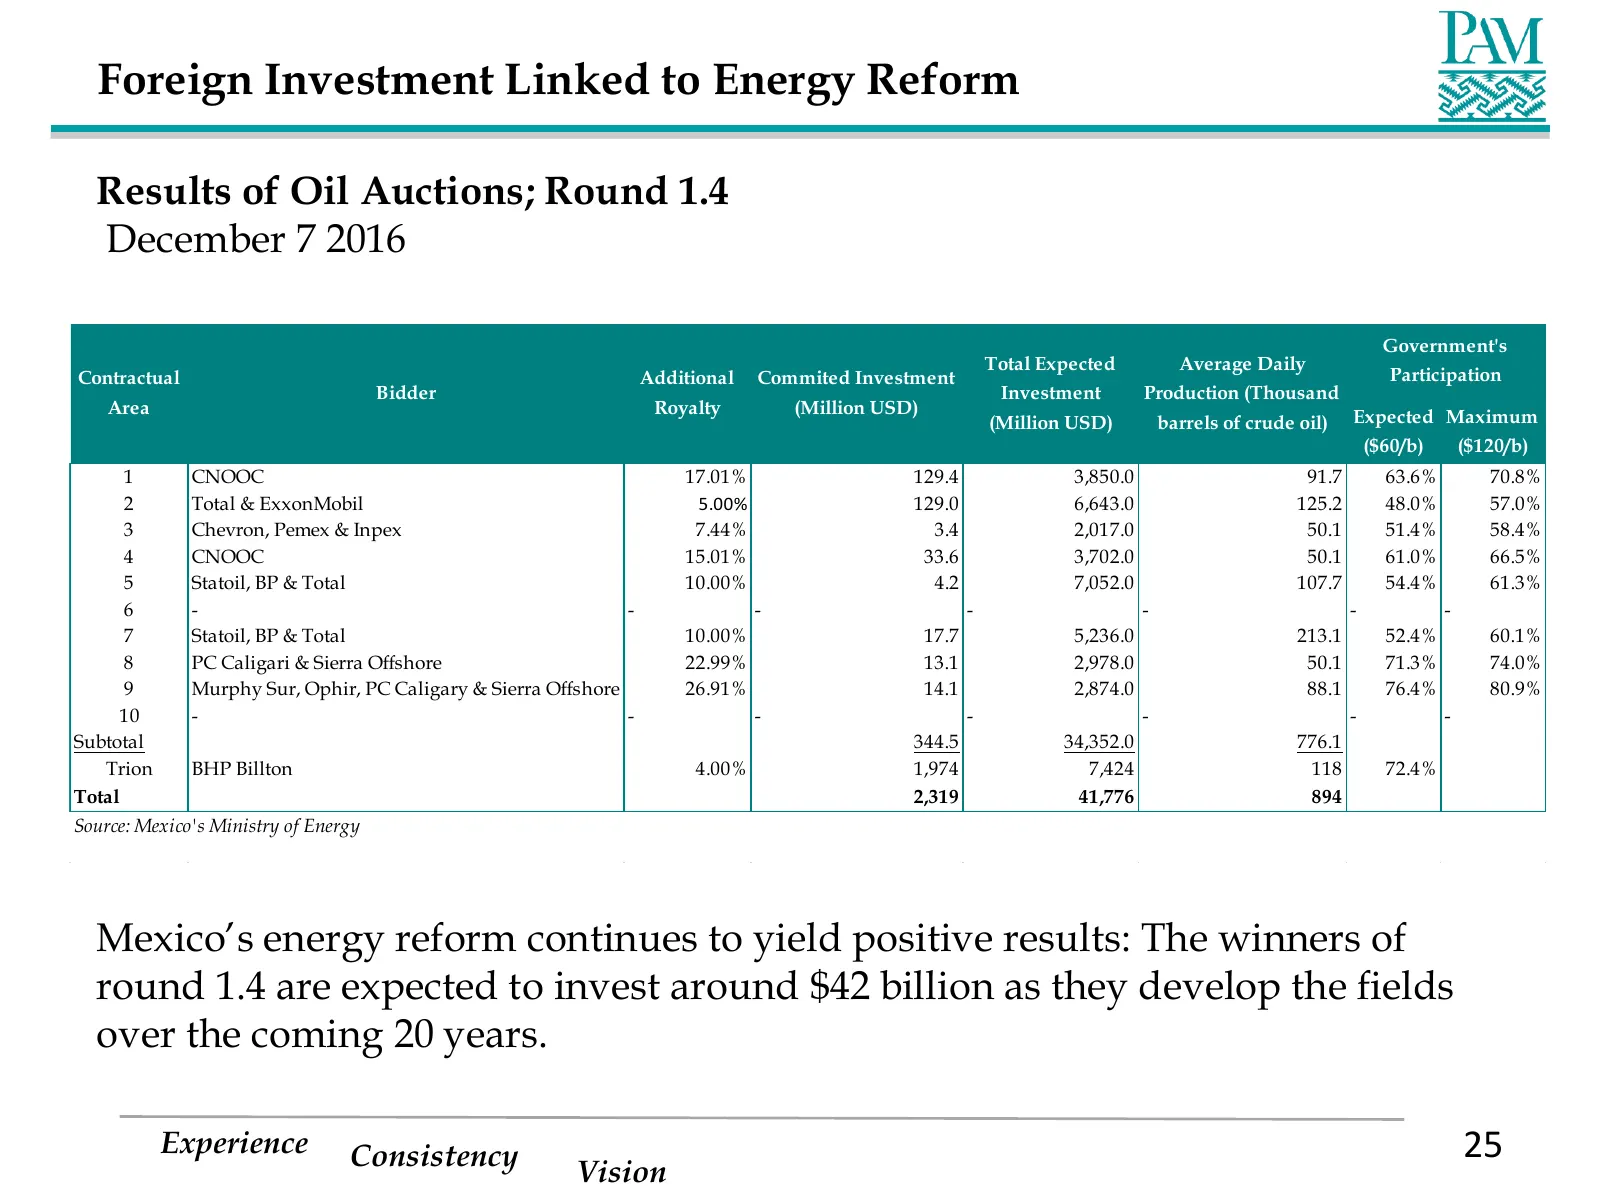
Slide 25: Foreign Investment Linked to Energy Reform
Foreign Investment Linked to Energy Reform Results of Oil Auctions; Round 1.4 December 7 2016 Government's Total Expected Average Daily Contractual Additional Commited Investment Participation Bidder Investment Production (Thousand Area Royalty (Million USD) Expected Maximum (Million USD) barrels of
Slide 26: Definitions
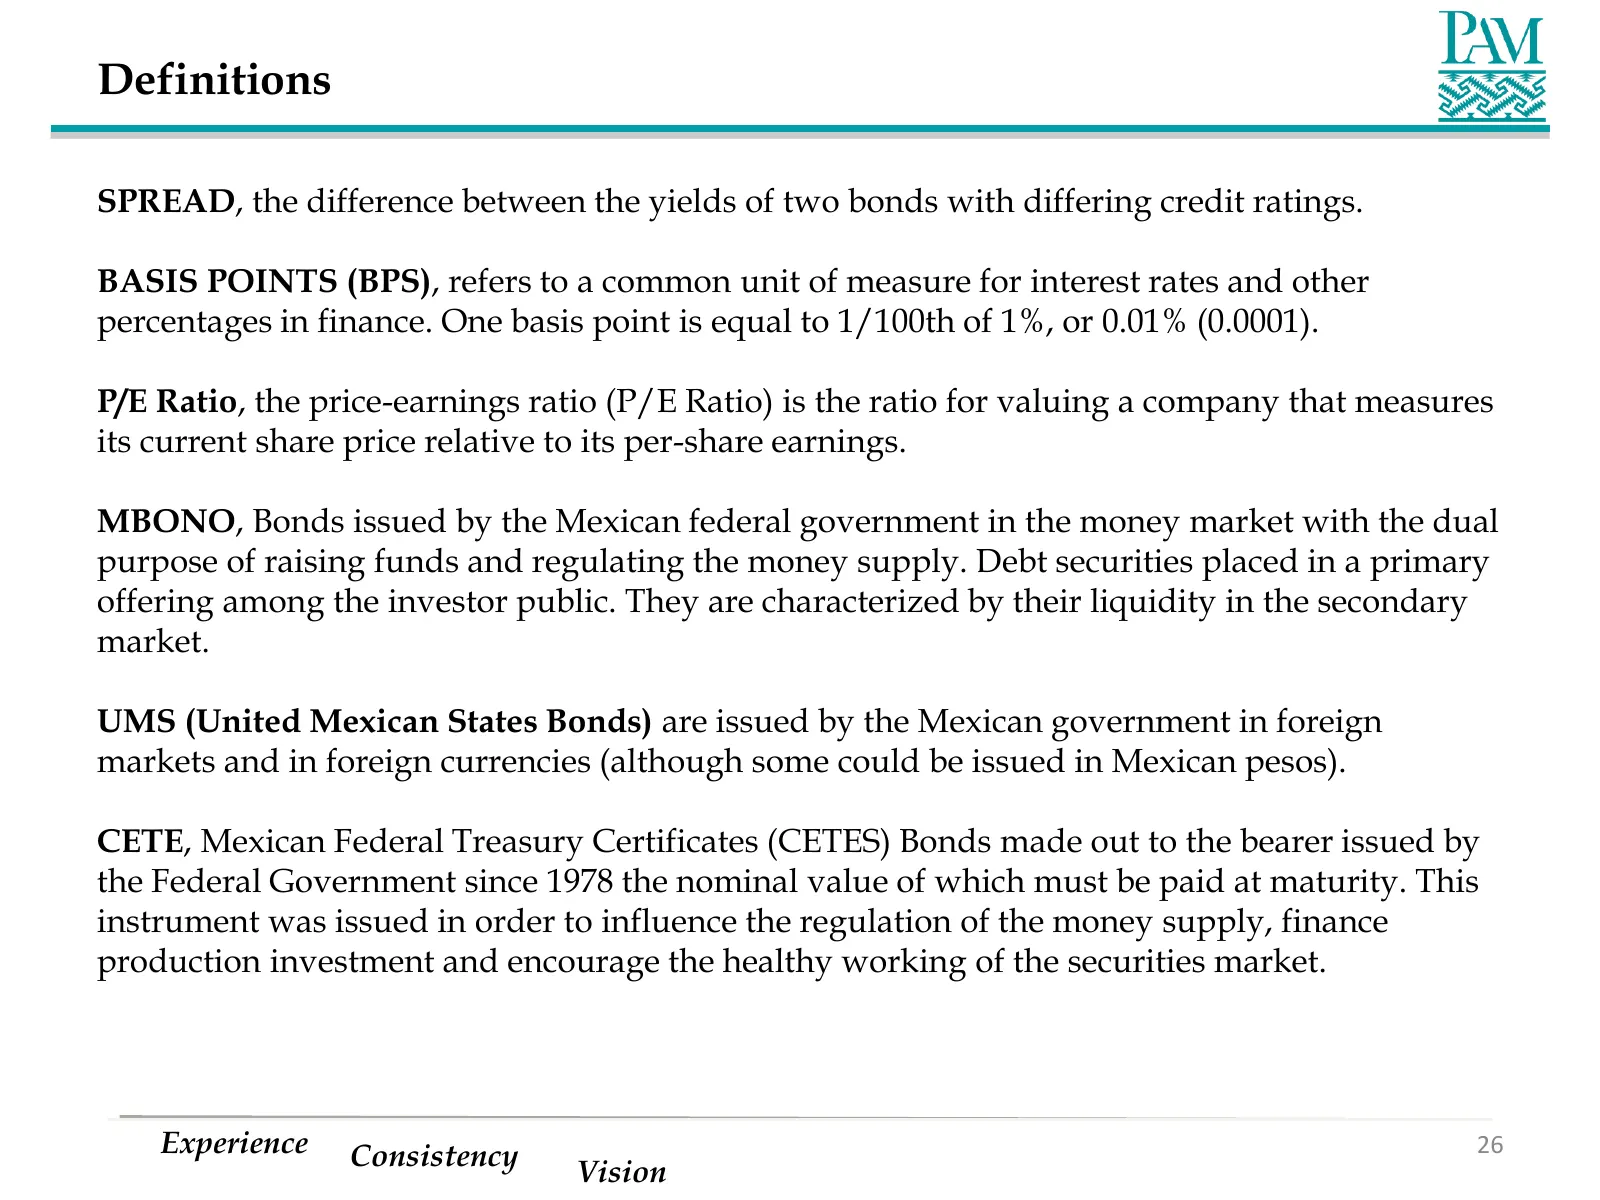
Definitions SPREAD, the difference between the yields of two bonds with differing credit ratings. BASIS POINTS (BPS), refers to a common unit of measure for interest rates and other percentages in finance. One basis point is equal to 1/100th of 1%, or 0.01% (0.0001). P/E Ratio, the price-earnings ra
Slide 27: Disclaimer
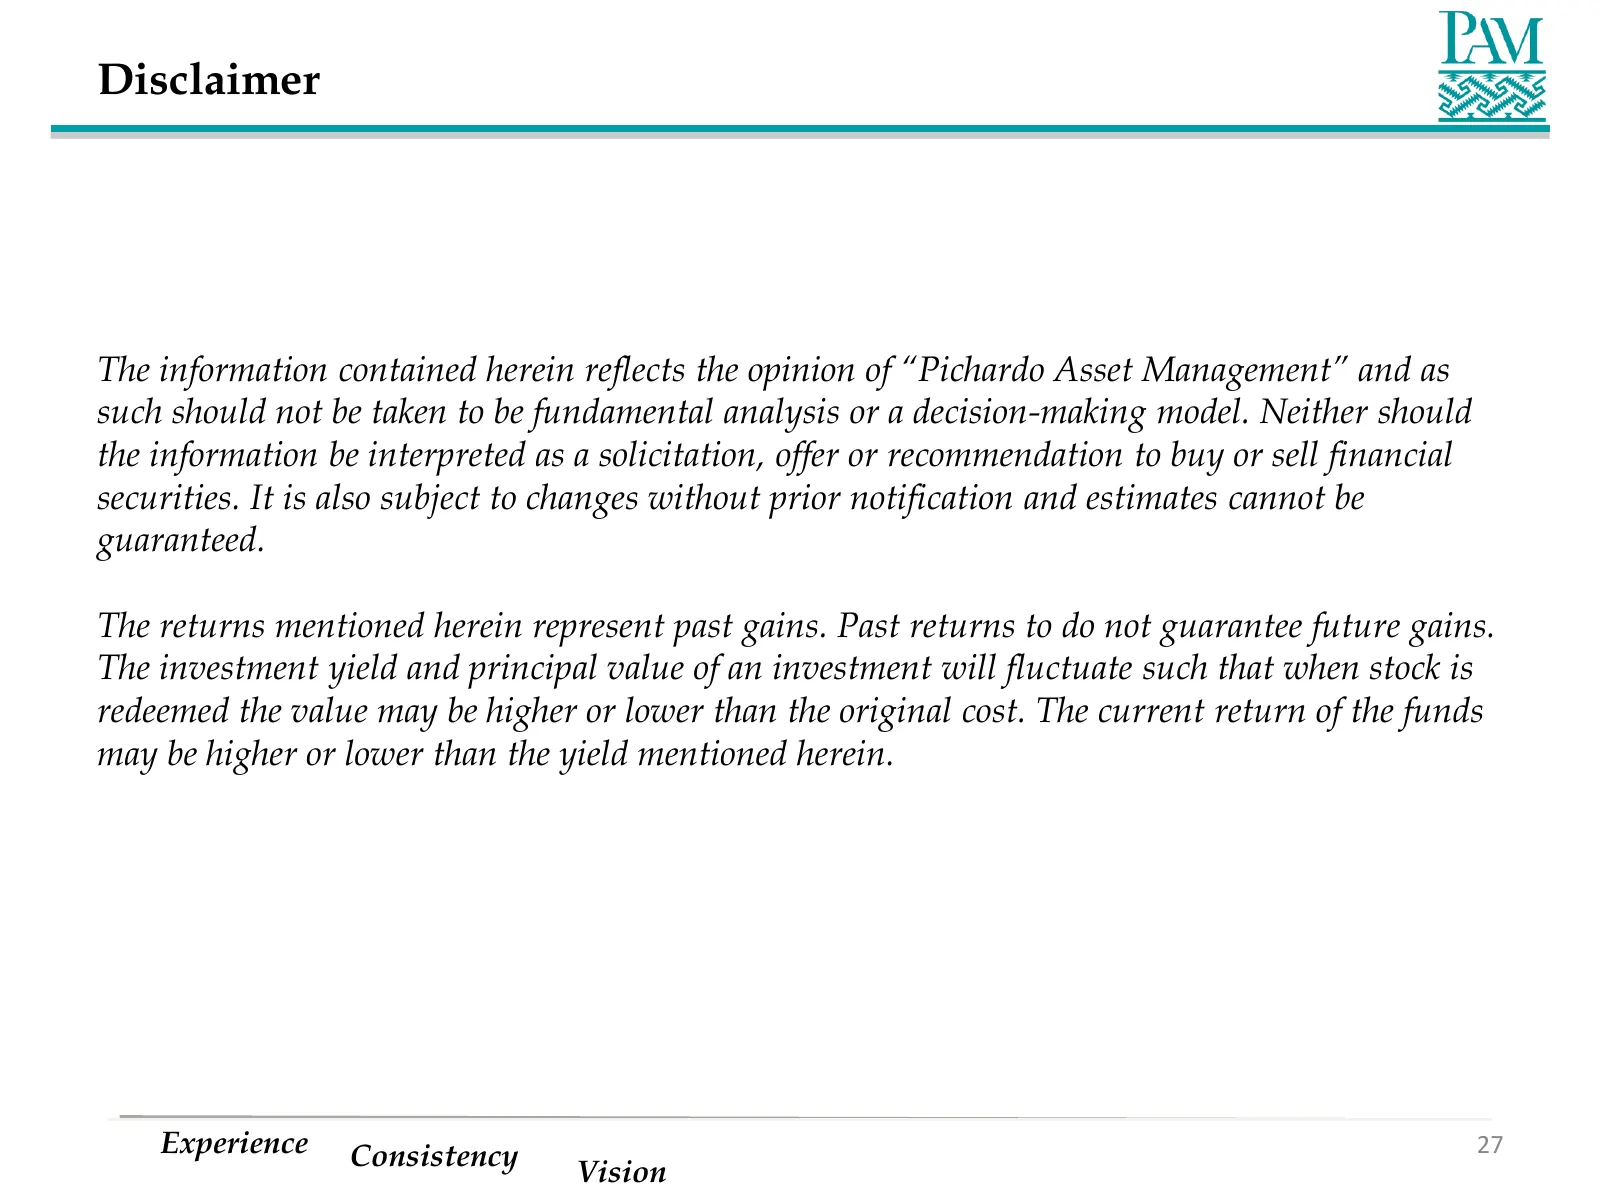
Disclaimer The information contained herein reflects the opinion of “Pichardo Asset Management” and as such should not be taken to be fundamental analysis or a decision-making model. Neither should the information be interpreted as a solicitation, offer or recommendation to buy or sell financial sec
Slide 28: THANK YOU!
THANK YOU! Experience Consistency 28 Vision
Source: Internet Archive copy of mxefund.com
More decks from Mexico Equity & Income Fund Inc
 Investor Presentation (August 2023)37 slides · Aug 31, 2023
 Investor Presentation (January 2019)17 slides · January 2019
 Investor Presentation (June 2018)15 slides · Jun 15, 2018
 The Mexico Equity and Income Fund — Investor Presentation (December 2017)45 slides · Dec 7, 2017
 Investor Presentation (September 2017)43 slides · September 2017
 CEF Capital Link Forum (April 2014)31 slides · April 2014