Bob Evans Farms — Evans BOB Farms — Investor Day (June 2009)
154 slides from Bob Evans Farms's investor day presentation, Jun 3, 2009
Slide 1: Bob Evans Farms Analyst Day
Bob Evaus FARMS® Ge Me ones wih Analyst Day June 3, 2008
Slide 2: Dave Poplar, Vice President Investor Relations
2 Dave Poplar Vice President Investor Relations
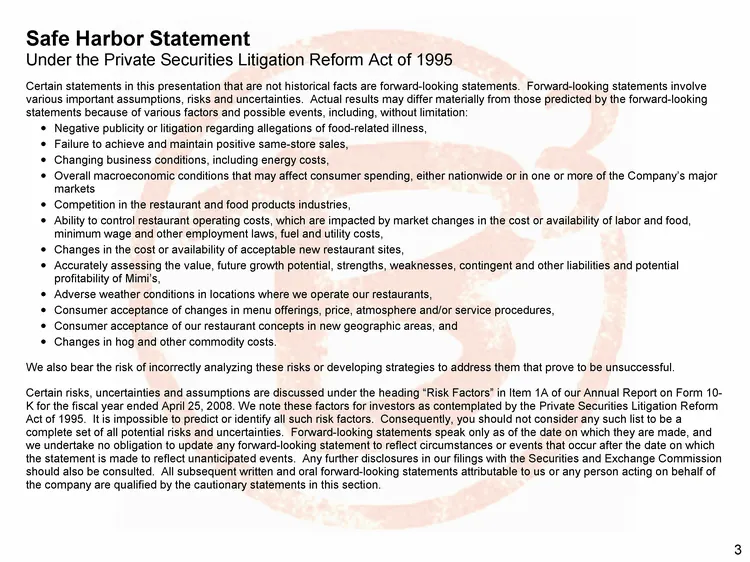
Slide 3: Safe Harbor Statement
Safe Harbor Statement Under the Private Securities Litigation Reform Act of 1995 Certain statements in this presentation that are not historical facts are forward-looking statements. Forward-looking statements involve various important assumptions, risks and uncertainties. Actual results may differ
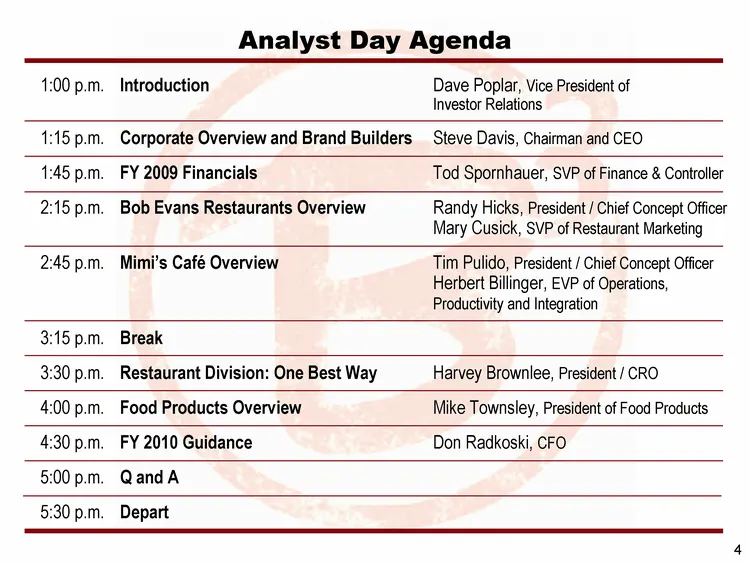
Slide 4: Analyst Day Agenda
Analyst Day Agenda 1:00 p.m. Introduction Dave Poplar, Vice President of Investor Relations 1:15 p.m. Corporate Overview and Brand Builders Steve Davis, Chairman and CEO 1:45 p.m. FY 2009 Financials Tod Spornhauer, SVP of Finance & Controller 2:15 p.m. Bob Evans Restaurants Overview Randy Hicks, Pre
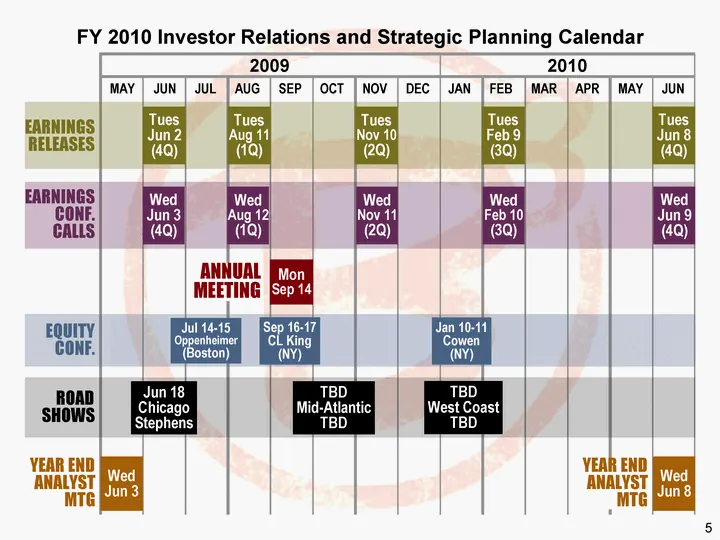
Slide 5: FY 2010 Investor Relations and Strategic Planning Calendar
5 FY 2010 Investor Relations and Strategic Planning Calendar EARNINGS RELEASES EARNINGS CONF. CALLS EQUITY CONF. ROAD SHOWS YEAR END ANALYST MTG JUN JUL AUG SEP OCT NOV DEC JAN FEB MAR APR MAY JUN MAY Tues Aug 11 (1Q) Tues Nov 10 (2Q) Tues Feb 9 (3Q) Tues Jun 8 (4Q) Tues Jun 2 (4Q) Wed Jun 3 (4Q) We
Slide 6: Mary Cusick, Adam Baird, Nancy Cowen
6 Mary Cusick Senior Vice President, Bob Evans Restaurant Marketing Adam Baird Executive Chef, Mimi's Cafe Nancy Cowen Senior Director of Marketing, Food Products
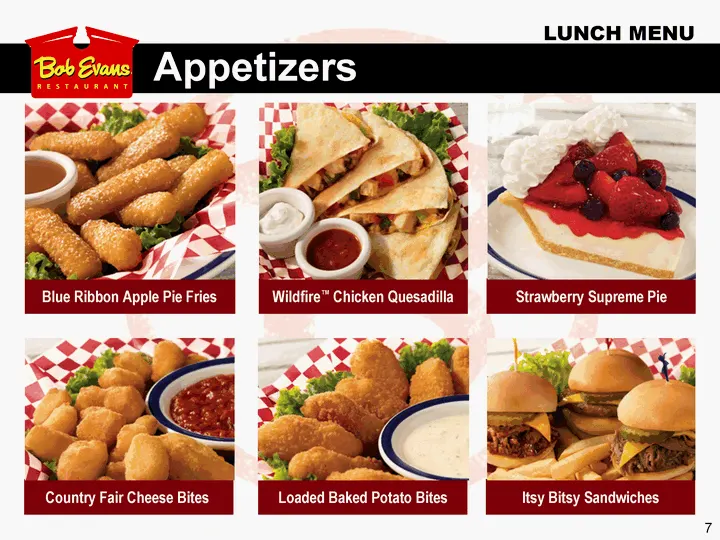
Slide 7: Lunch Menu: Appetizers
7 Appetizers LUNCH MENU Blue Ribbon Apple Pie Fries Country Fair Cheese Bites Strawberry Supreme Pie Itsy Bitsy Sandwiches Wildfire(tm) Chicken Quesadilla Loaded Baked Potato Bites
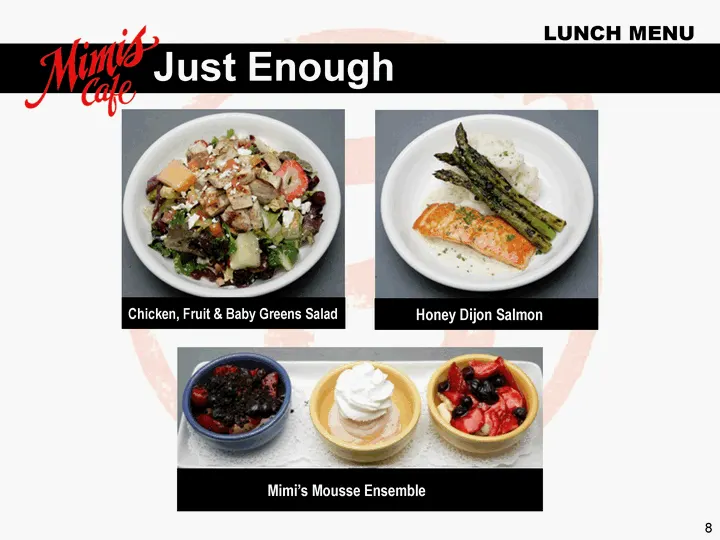
Slide 8: Lunch Menu: Just Enough
8 Just Enough LUNCH MENU Chicken, Fruit & Baby Greens Salad Honey Dijon Salmon Mimi's Mousse Ensemble
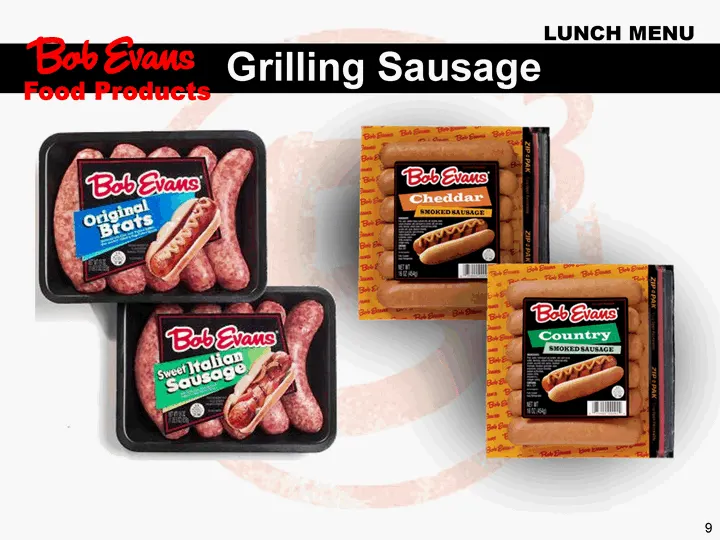
Slide 9: Lunch Menu: Grilling Sausage
9 Grilling Sausage LUNCH MENU Food Products
Slide 10: Steve Davis, Chairman and Chief Executive Officer
10 Steve Davis Chairman and Chief Executive Officer
Slide 11: BEST Brand Builders Company & Segment Overview
11 BEST Brand Builders Company & Segment Overview
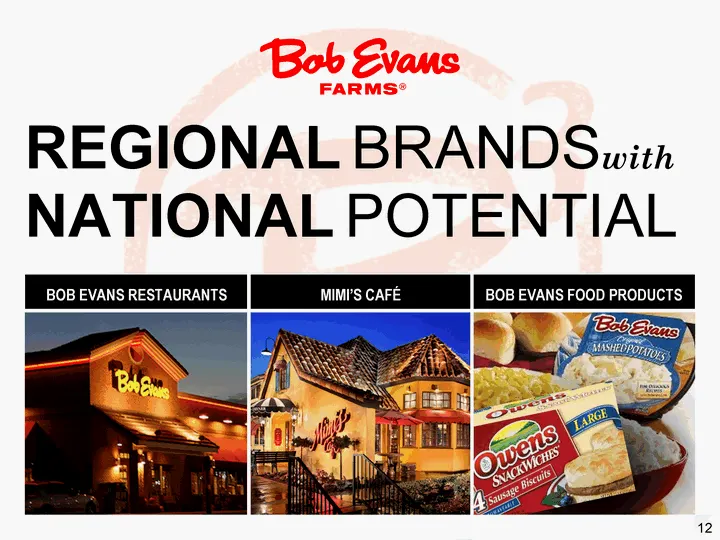
Slide 12: Bob Evans Food Products Regional Brands with National Potential
12 BOB EVANS FOOD PRODUCTS REGIONAL BRANDSwith NATIONAL POTENTIAL
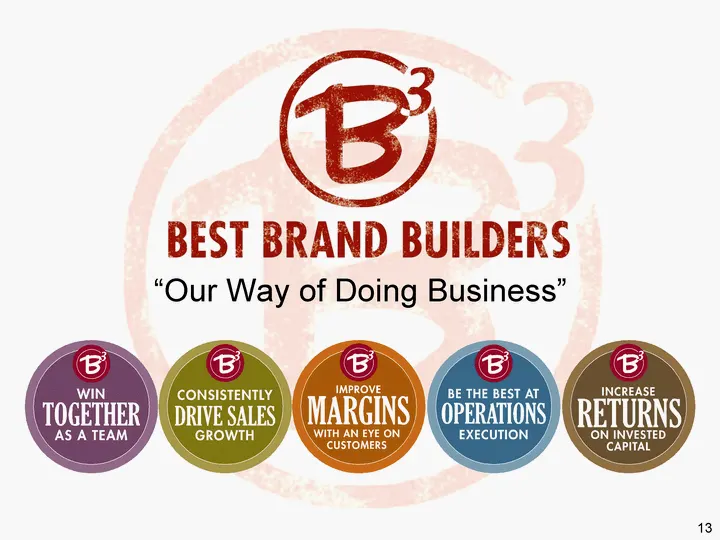
Slide 13: Our Way of Doing Business
13 "Our Way of Doing Business"
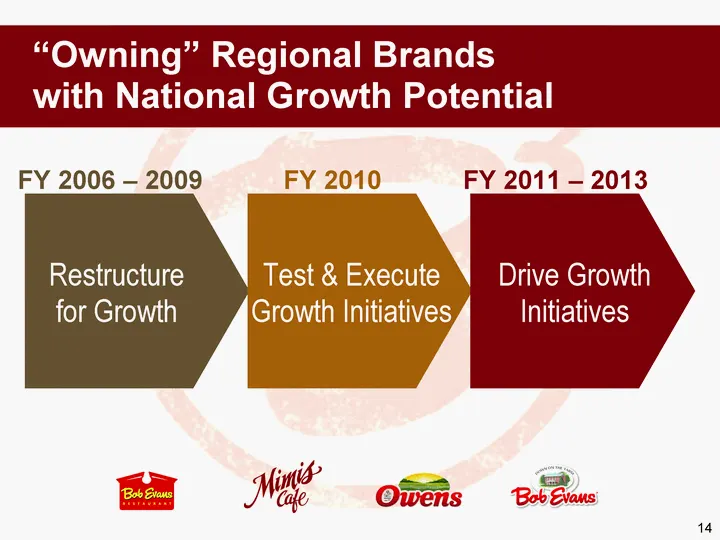
Slide 14: Owning Regional Brands with National Growth Potential
14 "Owning" Regional Brands with National Growth Potential FY 2006 - 2009 Restructure for Growth FY 2010 Test & Execute Growth Initiatives FY 2011 - 2013 Drive Growth Initiatives
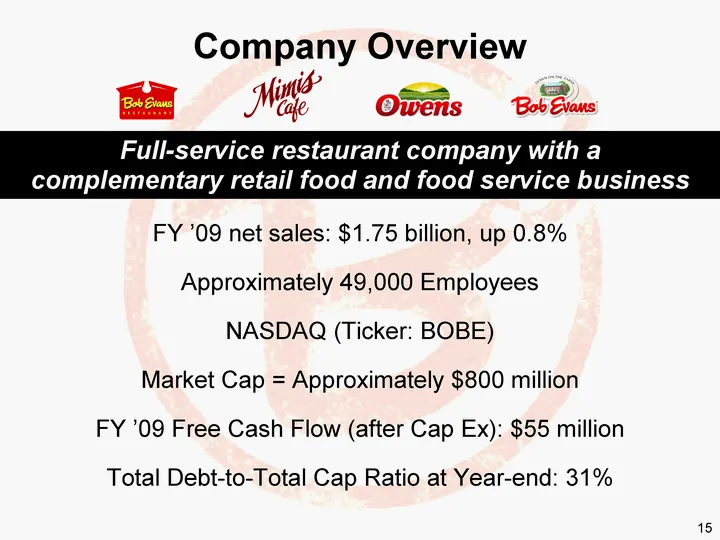
Slide 15: Company Overview
15 Company Overview FY '09 net sales: $1.75 billion, up 0.8% Approximately 49,000 Employees NASDAQ (Ticker: BOBE) Market Cap = Approximately $800 million FY '09 Free Cash Flow (after Cap Ex): $55 million Total Debt-to-Total Cap Ratio at Year-end: 31% Full-service restaurant company with a complement
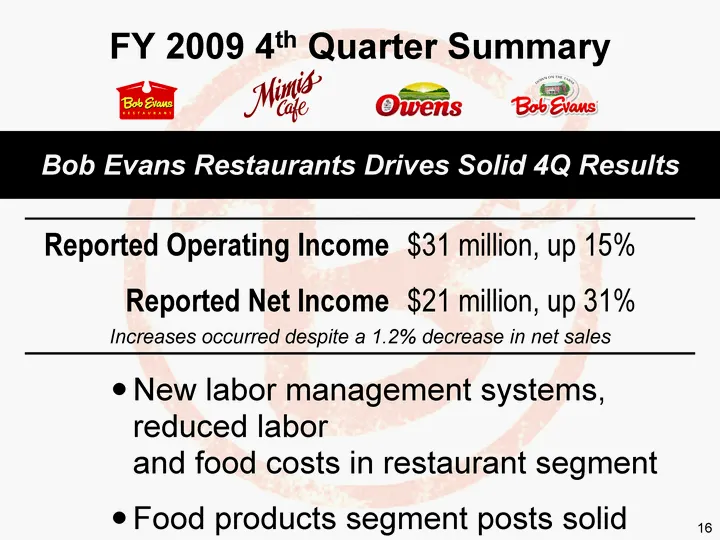
Slide 16: FY 2009 4th Quarter Summary
16 FY 2009 4th Quarter Summary New labor management systems, reduced labor and food costs in restaurant segment Food products segment posts solid results despite significantly higher sow costs Project BestWay productivity initiatives Bob Evans Restaurants Drives Solid 4Q Results Reported Operating I
Slide 17: Restaurants
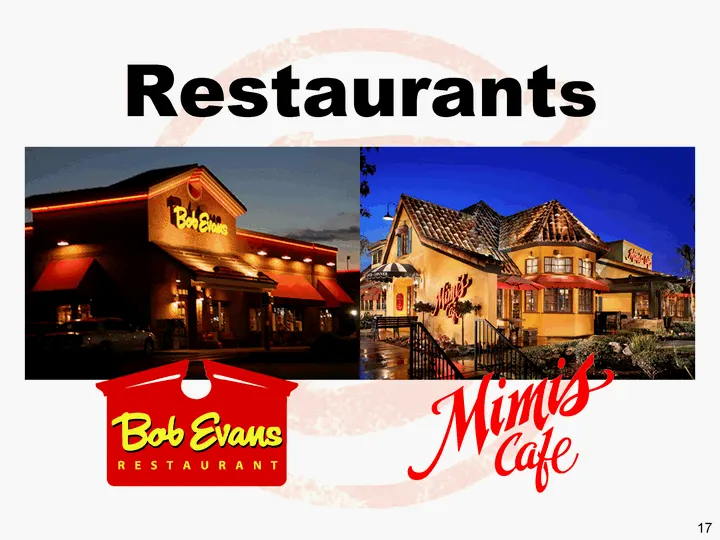
17 Restaurants
Slide 18: FY 2009 Segment Overview
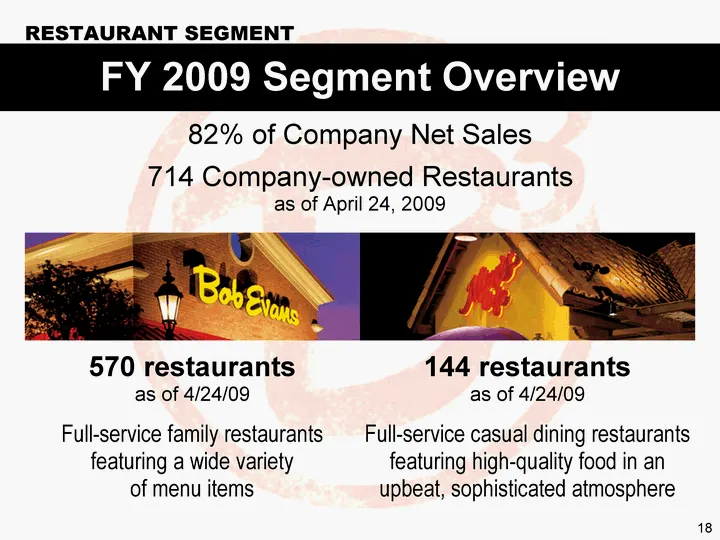
18 FY 2009 Segment Overview 82% of Company Net Sales 714 Company-owned Restaurants as of April 24, 2009 570 restaurants as of 4/24/09 Full-service family restaurants featuring a wide variety of menu items 144 restaurants as of 4/24/09 Full-service casual dining restaurants featuring high-quality foo
Slide 19: Bob Evans Brand Positioning
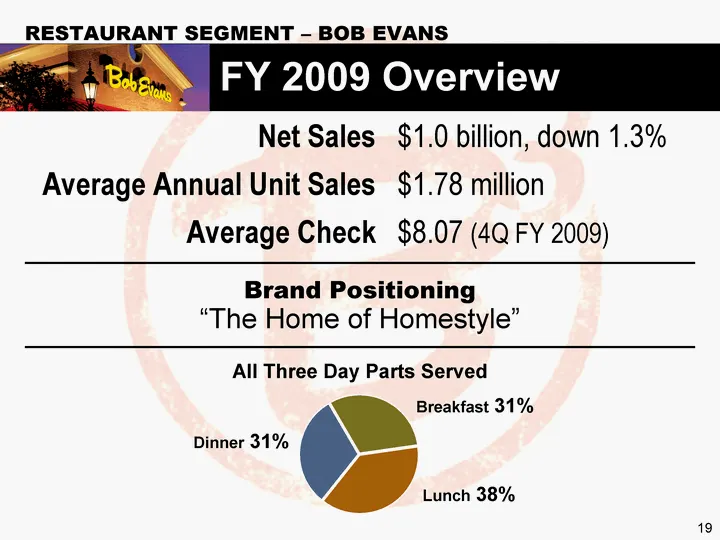
19 Brand Positioning "The Home of Homestyle" Net Sales $1.0 billion, down 1.3% Average Annual Unit Sales $1.78 million Average Check $8.07 (4Q FY 2009) FY 2009 Overview RESTAURANT SEGMENT - BOB EVANS All Three Day Parts Served Breakfast Lunch Dinner 4th Qtr dayparts 31 38 31 20.4 West 30.6 38.6 34.6
Slide 20: Geographic Concentration - Bob Evans
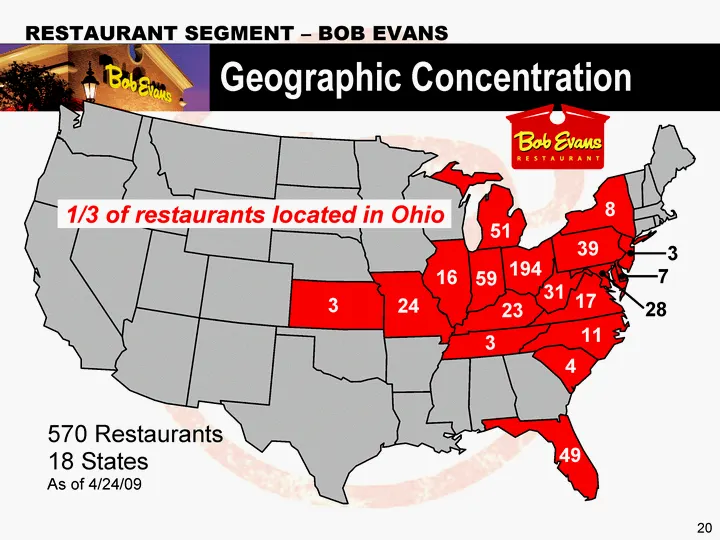
20 Geographic Concentration RESTAURANT SEGMENT - BOB EVANS 194 59 16 24 3 51 31 39 8 3 7 28 23 3 17 11 4 49 570 Restaurants 18 States As of 4/24/09 1/3 of restaurants located in Ohio
Slide 21: Mimi's Cafe FY 2009 Overview
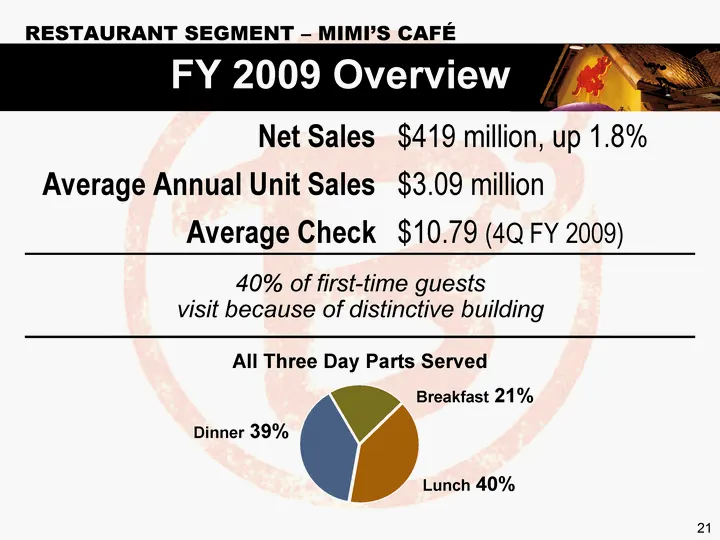
21 40% of first-time guests visit because of distinctive building RESTAURANT SEGMENT - MIMI'S CAFE FY 2009 Overview Net Sales $419 million, up 1.8% Average Annual Unit Sales $3.09 million Average Check $10.79 (4Q FY 2009) All Three Day Parts Served Breakfast Lunch Dinner 4th Qtr dayparts 21 40 39 20
Slide 22: Geographic Concentration - Mimi's Cafe
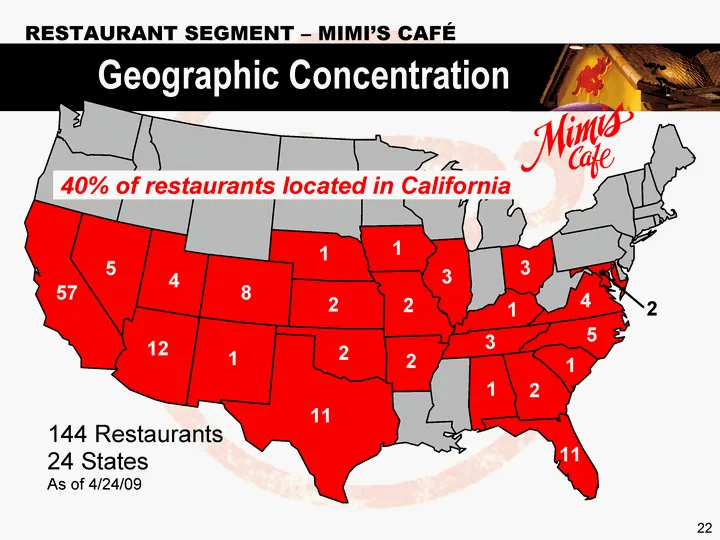
22 RESTAURANT SEGMENT - MIMI'S CAFE Geographic Concentration 3 3 2 2 2 1 3 4 5 1 11 2 2 1 2 11 1 8 4 12 57 5 1 144 Restaurants 24 States As of 4/24/09 40% of restaurants located in California 1
Slide 23: Strategic Rationale and Management Changes
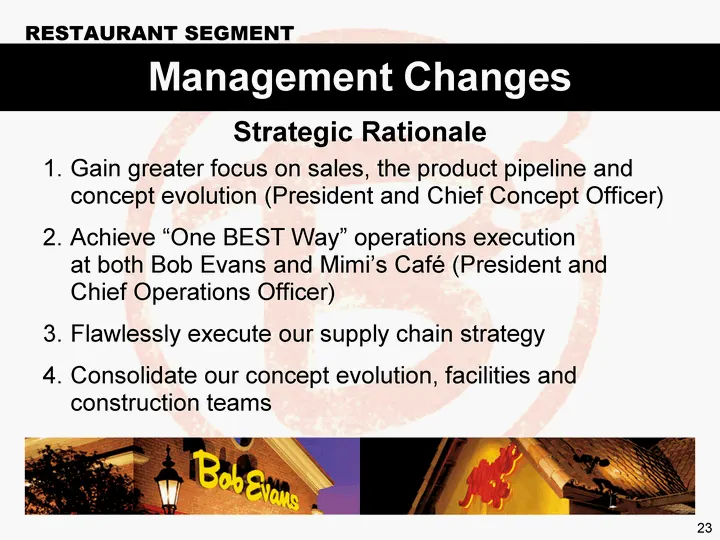
23 Gain greater focus on sales, the product pipeline and concept evolution (President and Chief Concept Officer) Achieve "One BEST Way" operations execution at both Bob Evans and Mimi's Cafe (President and Chief Operations Officer) Flawlessly execute our supply chain strategy Consolidate our concept
Slide 24: Restaurant Segment Management Changes
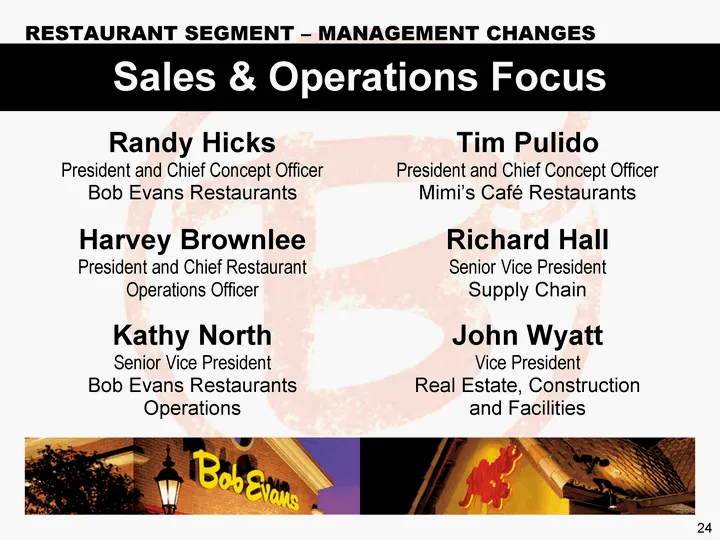
24 Harvey Brownlee President and Chief Restaurant Operations Officer Kathy North Senior Vice President Bob Evans Restaurants Operations Randy Hicks President and Chief Concept Officer Bob Evans Restaurants Tim Pulido President and Chief Concept Officer Mimi's Cafe Restaurants Sales & Operations Focu
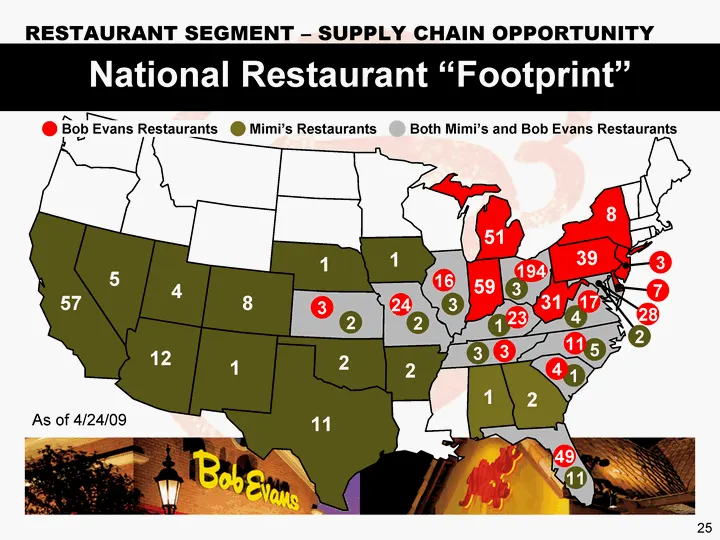
Slide 25: National Restaurant Footprint
25 National Restaurant "Footprint" RESTAURANT SEGMENT - SUPPLY CHAIN OPPORTUNITY As of 4/24/09 2 2 1 2 11 1 8 4 12 57 5 51 59 31 39 8 2 3 2 24 3 16 3 3 1 23 3 194 4 17 5 11 1 4 11 49 2 28 7 3 Mimi's Restaurants Bob Evans Restaurants Both Mimi's and Bob Evans Restaurants 1 1
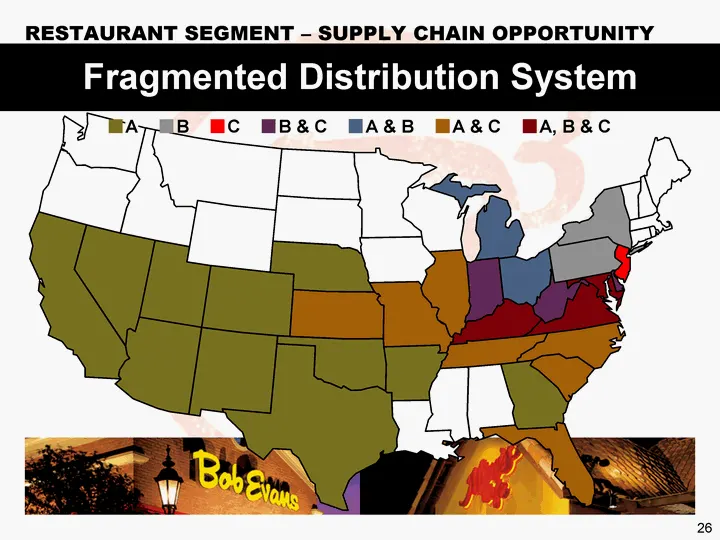
Slide 26: Fragmented Distribution System
26 Fragmented Distribution System RESTAURANT SEGMENT - SUPPLY CHAIN OPPORTUNITY A B C B & C A & B A & C A, B & C
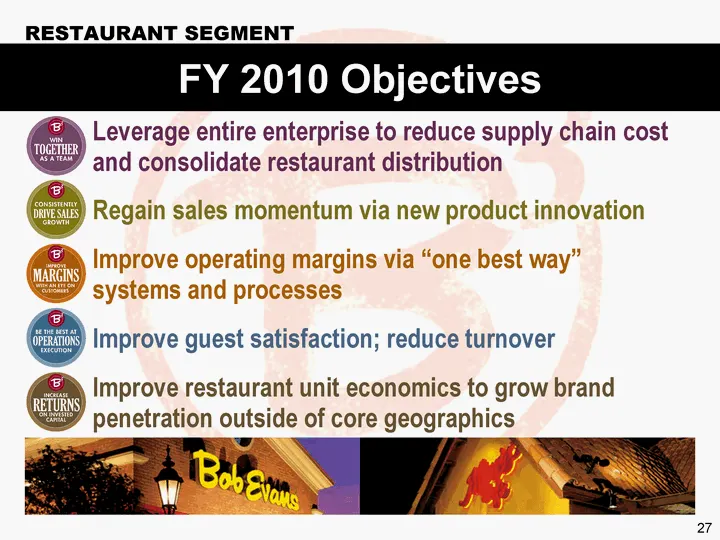
Slide 27: Restaurant Segment FY 2010 Objectives
27 RESTAURANT SEGMENT FY 2010 Objectives Regain sales momentum via new product innovation Improve operating margins via "one best way" systems and processes Improve guest satisfaction; reduce turnover Improve restaurant unit economics to grow brand penetration outside of core geographics Leverage en
Slide 28: Food Products
Bob Evans Food Products Bitte a
Slide 29: Food Products FY 2009 Segment Overview
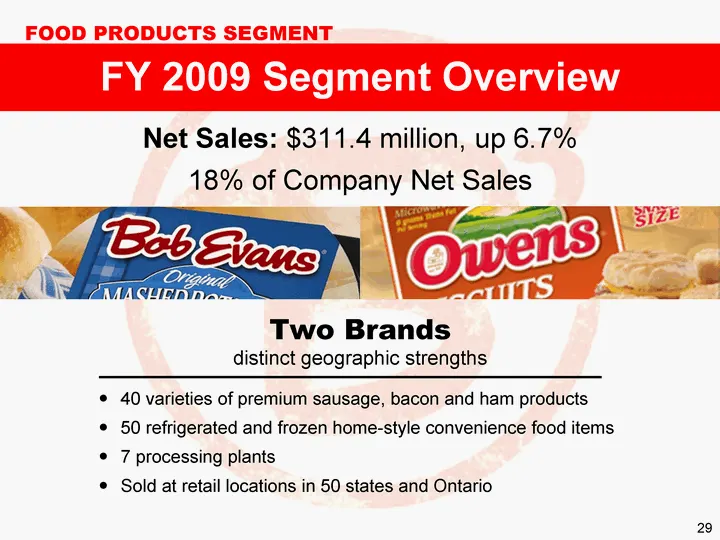
29 Two Brands distinct geographic strengths FY 2009 Segment Overview FOOD PRODUCTS SEGMENT Net Sales: $311.4 million, up 6.7% 18% of Company Net Sales 40 varieties of premium sausage, bacon and ham products 50 refrigerated and frozen home-style convenience food items 7 processing plants Sold at reta
Slide 30: FY 2009 Retail Distribution
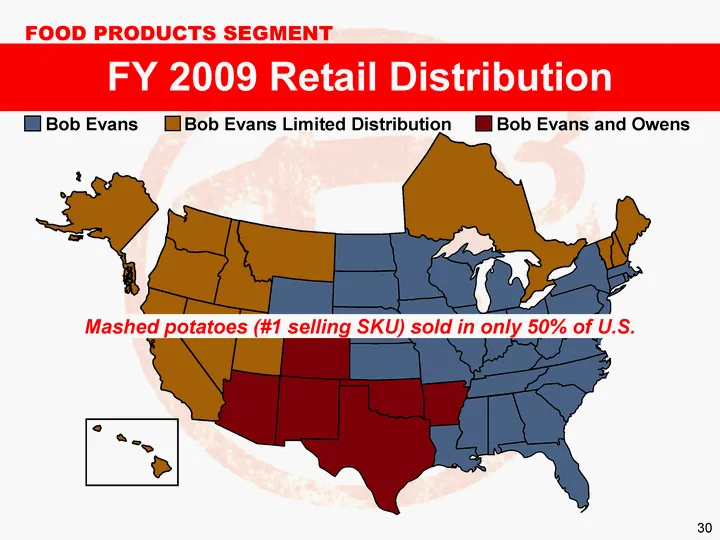
30 FY 2009 Retail Distribution FOOD PRODUCTS SEGMENT Bob Evans Bob Evans and Owens Bob Evans Limited Distribution Mashed potatoes (#1 selling SKU) sold in only 50% of U.S.
Slide 31: Food Products FY 2009 Objectives
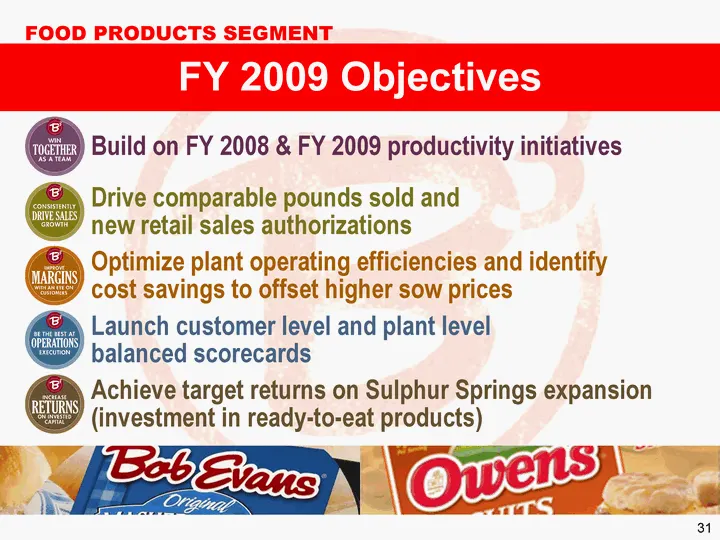
31 FY 2009 Objectives FOOD PRODUCTS SEGMENT Drive comparable pounds sold and new retail sales authorizations Optimize plant operating efficiencies and identify cost savings to offset higher sow prices Launch customer level and plant level balanced scorecards Achieve target returns on Sulphur Springs
Slide 32: Tod Spornhauer, Controller
32 Tod Spornhauer Controller
Slide 33: 4th Quarter and FY 2009 Financial Highlights
33 4th Quarter and FY 2009 Financial Highlights
Slide 34: Restaurants Operating Income 4th Quarter
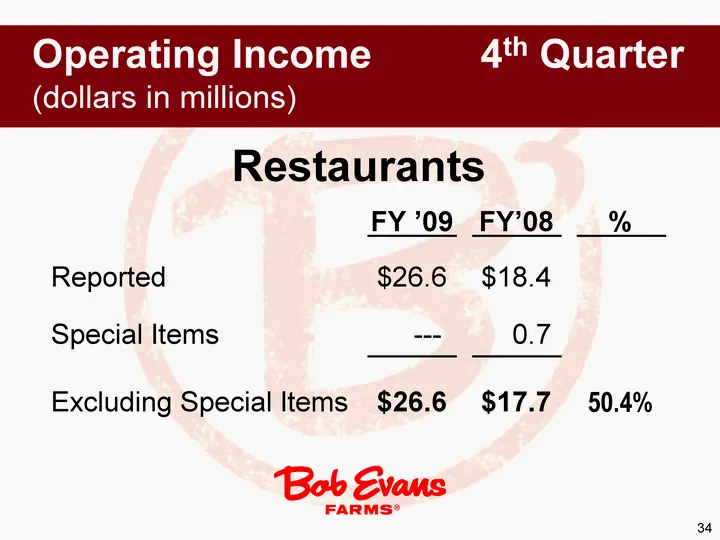
34 Restaurants FY '09 FY'08 % Reported $26.6 $18.4 Special Items --- 0.7 Excluding Special Items $26.6 $17.7 50.4% Operating Income 4th Quarter (dollars in millions)
Slide 35: Food Products Operating Income 4th Quarter
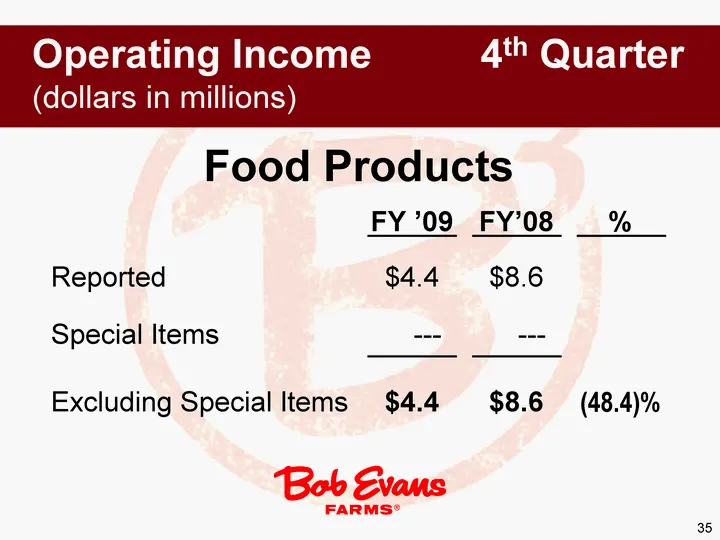
35 Food Products FY '09 FY'08 % Reported $4.4 $8.6 Special Items --- --- Excluding Special Items $4.4 $8.6 (48.4)% Operating Income 4th Quarter (dollars in millions)
Slide 36: Consolidated Operating Income 4th Quarter
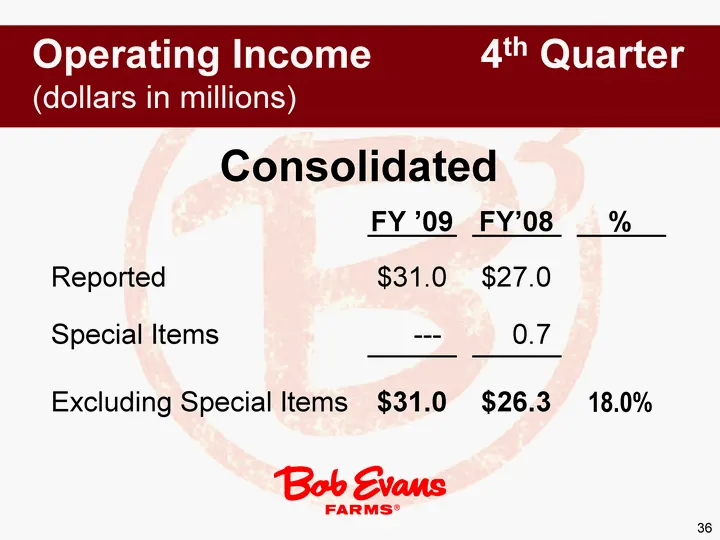
36 Consolidated FY '09 FY'08 % Reported $31.0 $27.0 Special Items --- 0.7 Excluding Special Items $31.0 $26.3 18.0% Operating Income 4th Quarter (dollars in millions)
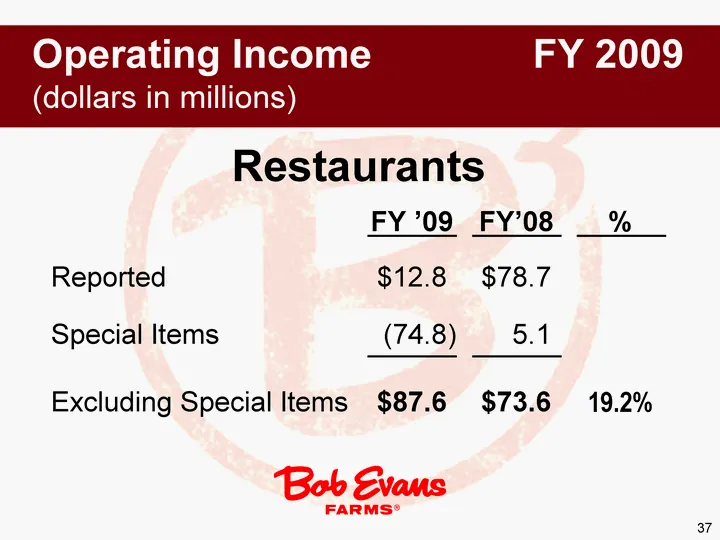
Slide 37: Restaurants Operating Income FY 2009
37 Restaurants FY '09 FY'08 % Reported $12.8 $78.7 Special Items (74.8) 5.1 Excluding Special Items $87.6 $73.6 19.2% Operating Income FY 2009 (dollars in millions)
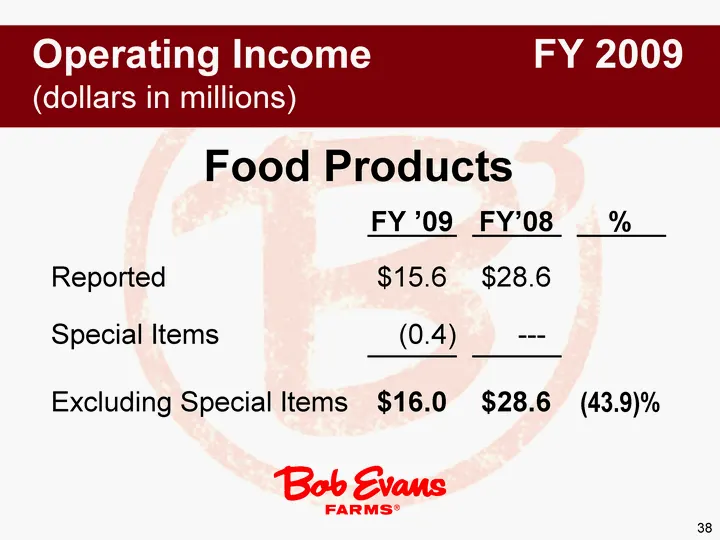
Slide 38: Food Products Operating Income FY 2009
38 Food Products FY '09 FY'08 % Reported $15.6 $28.6 Special Items (0.4) --- Excluding Special Items $16.0 $28.6 (43.9)% Operating Income FY 2009 (dollars in millions)
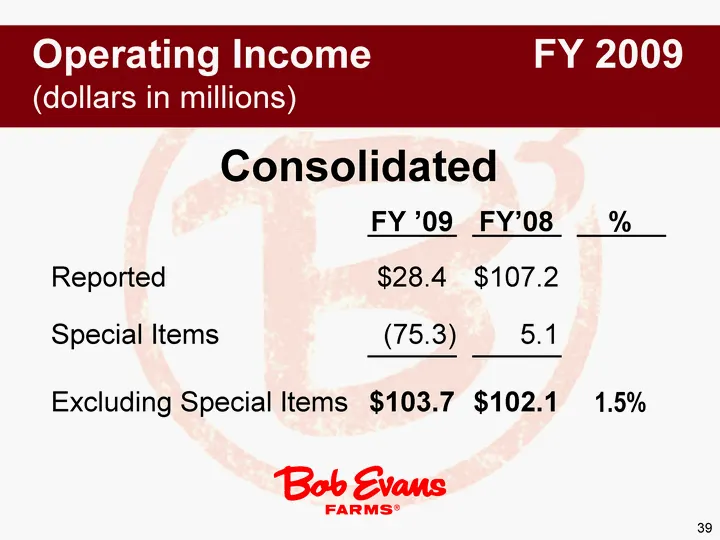
Slide 39: Consolidated Operating Income FY 2009
39 Consolidated FY '09 FY'08 % Reported $28.4 $107.2 Special Items (75.3) 5.1 Excluding Special Items $103.7 $102.1 1.5% Operating Income FY 2009 (dollars in millions)
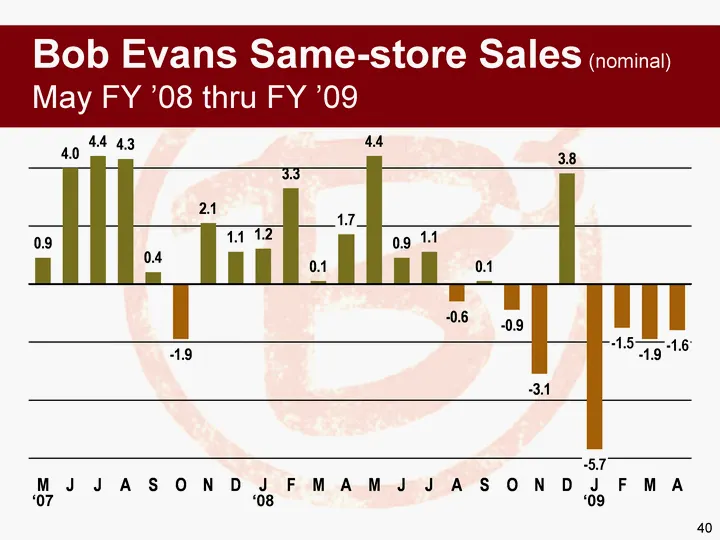
Slide 40: Bob Evans Same-store Sales
40 Bob Evans Same-store Sales (nominal) May FY '08 thru FY '09 M J J A S O N D J F M A M J J A S O N D J F M A BER SSS 0.9 4 4.4 4.3 0.4 -1.9 2.1 1.1 1.2 3.3 0.1 1.7 4.4 0.9 1.1 -0.6 0.1 -0.9 -3.1 3.8 -5.7 -1.5 -1.9 -1.6 '07 '08 '09
Slide 41: Mimi's Cafe Same-store Sales
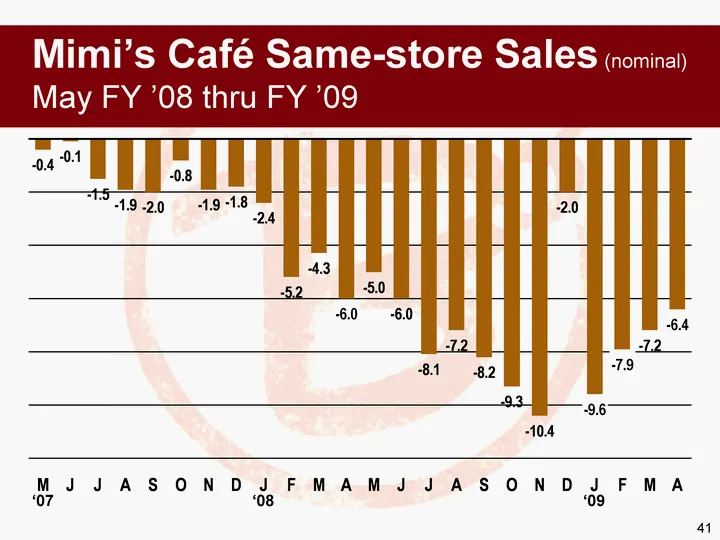
41 Mimi's Cafe Same-store Sales (nominal) May FY '08 thru FY '09 M J J A S O N D J F M A M J J A S O N D J F M A BER SSS -0.4 -0.1 -1.5 -1.9 -2 -0.8 -1.9 -1.8 -2.4 -5.2 -4.3 -6 -5 -6 -8.1 -7.2 -8.2 -9.3 -10.4 -2 -9.6 -7.9 -7.2 -6.4 '07 '08 '09
Slide 42: Average Unit Volumes
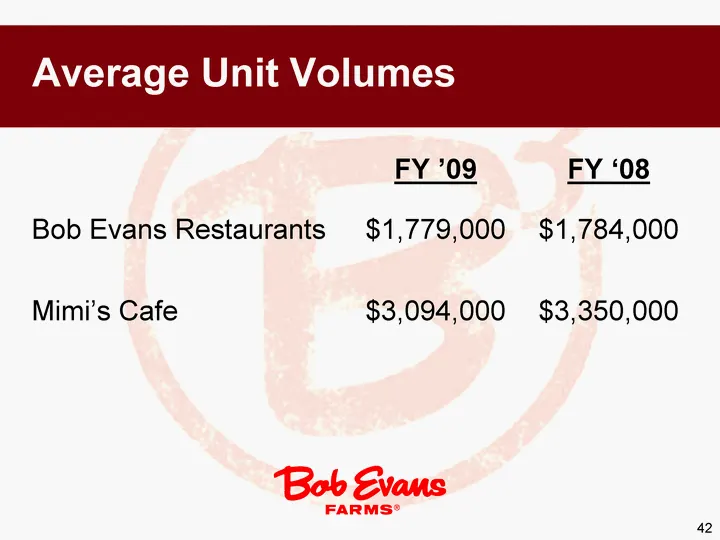
42 FY '09 FY '08 Bob Evans Restaurants $1,779,000 $1,784,000 Mimi's Cafe $3,094,000 $3,350,000 Average Unit Volumes
Slide 43: Food Products Comparable Pounds
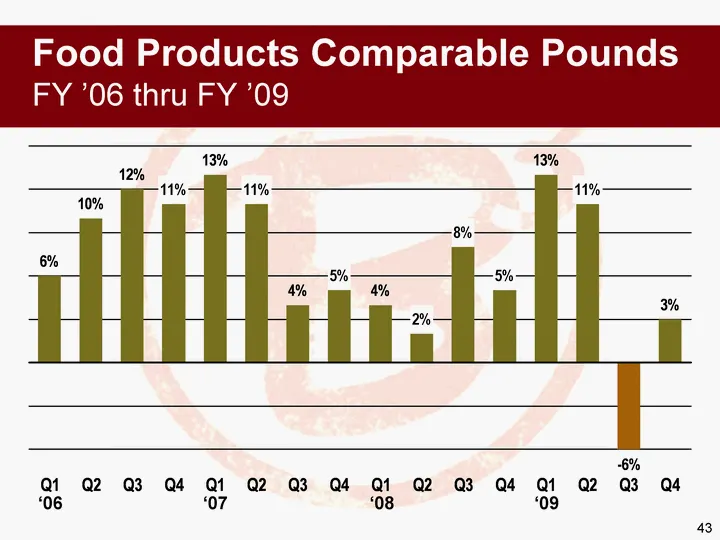
43 Food Products Comparable Pounds FY '06 thru FY '09 Q1 Q2 Q3 Q4 Q1 Q2 Q3 Q4 Q1 Q2 Q3 Q4 Q1 Q2 Q3 Q4 FOOD 0.06 0.1 0.12 0.11 0.13 0.11 0.04 0.05 0.04 0.02 0.08 0.05 0.13 0.11 -0.06 0.03 '06 '07 '09 '08
Slide 44: FY 2009 Sow Cost Plan vs. Actual
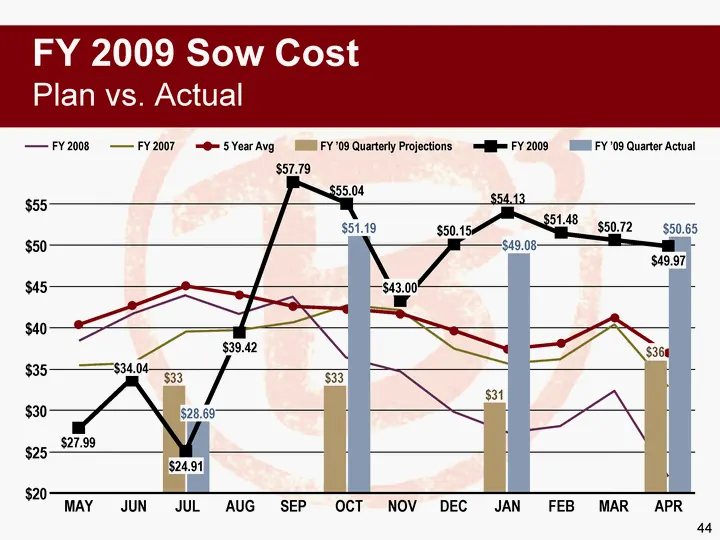
44 FY 2009 Sow Cost Plan vs. Actual $20 $25 $30 $35 $40 $45 $50 $55 MAY JUN JUL AUG SEP OCT NOV DEC JAN FEB MAR APR FY '09 Quarterly Projections FY '09 Quarter Actual FY 2009 FY 2008 FY 2007 $33 $33 $31 $36 $27.99 $34.04 $24.91 $39.42 $57.79 $55.04 $43.00 $50.15 $54.13 $51.48 $50.72 $49.97 $28.69 $5
Slide 45: Food Products Cost of Sales
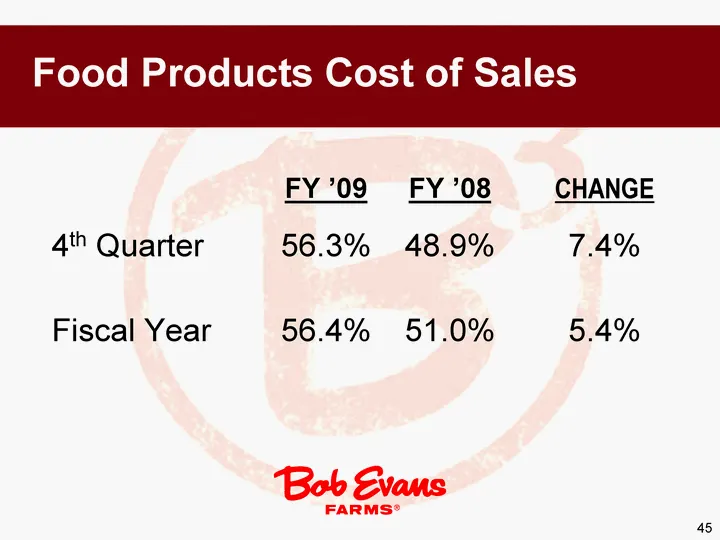
45 FY '09 FY '08 CHANGE 4th Quarter 56.3% 48.9% 7.4% Fiscal Year 56.4% 51.0% 5.4% Food Products Cost of Sales
Slide 46: Balance Sheet Comments
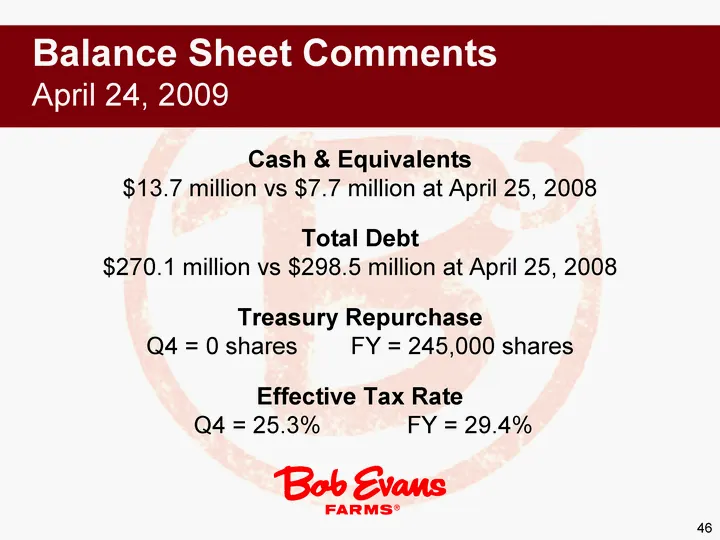
46 Cash & Equivalents $13.7 million vs $7.7 million at April 25, 2008 Total Debt $270.1 million vs $298.5 million at April 25, 2008 Treasury Repurchase Q4 = 0 shares FY = 245,000 shares Effective Tax Rate Q4 = 25.3% FY = 29.4% Balance Sheet Comments April 24, 2009
Slide 47: Total Debt - Comparison
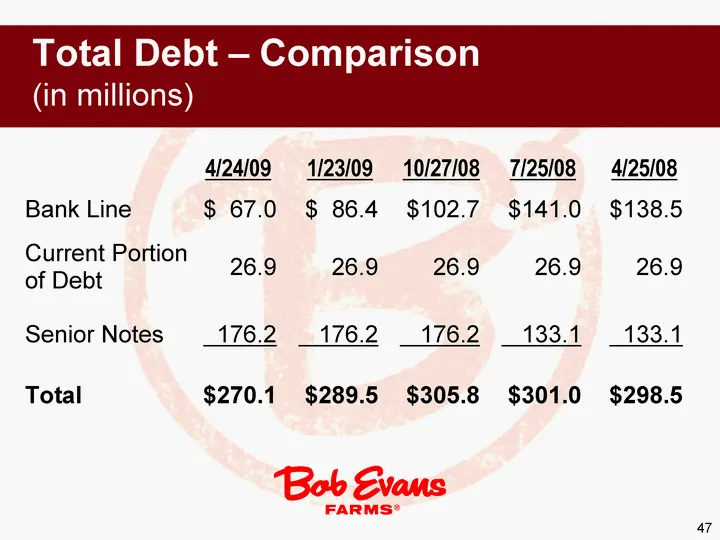
47 4/24/09 1/23/09 10/27/08 7/25/08 4/25/08 Bank Line $ 67.0 $ 86.4 $102.7 $141.0 $138.5 Current Portion of Debt 26.9 26.9 26.9 26.9 26.9 Senior Notes 176.2 176.2 176.2 133.1 133.1 Total $270.1 $289.5 $305.8 $301.0 $298.5 Total Debt - Comparison (in millions)
Slide 48: Bank Lines of Credit
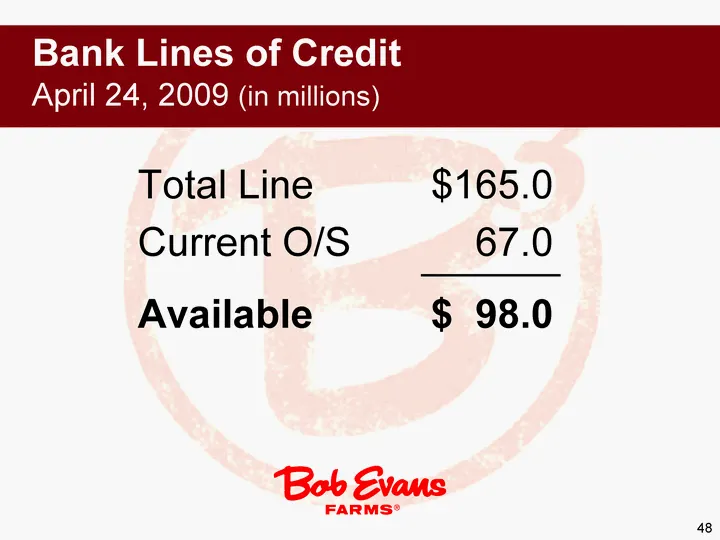
48 Bank Lines of Credit April 24, 2009 (in millions) Total Line $165.0 Current O/S 67.0 Available $ 98.0
Slide 49: FY 2009 Summary
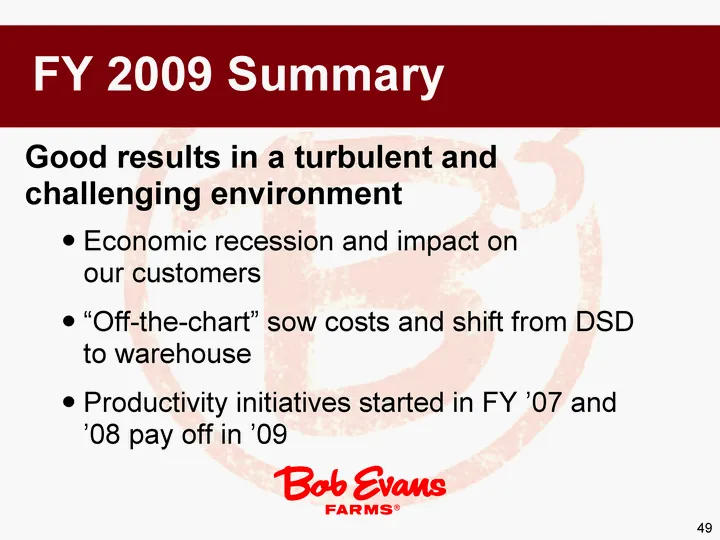
49 FY 2009 Summary Good results in a turbulent and challenging environment Economic recession and impact on our customers "Off-the-chart" sow costs and shift from DSD to warehouse Productivity initiatives started in FY '07 and '08 pay off in '09
Slide 50: Randy Hicks and Mary Cusick
50 Randy Hicks President and Chief Concept Officer Mary Cusick Senior Vice President of Marketing
Slide 51: FY '09 Review
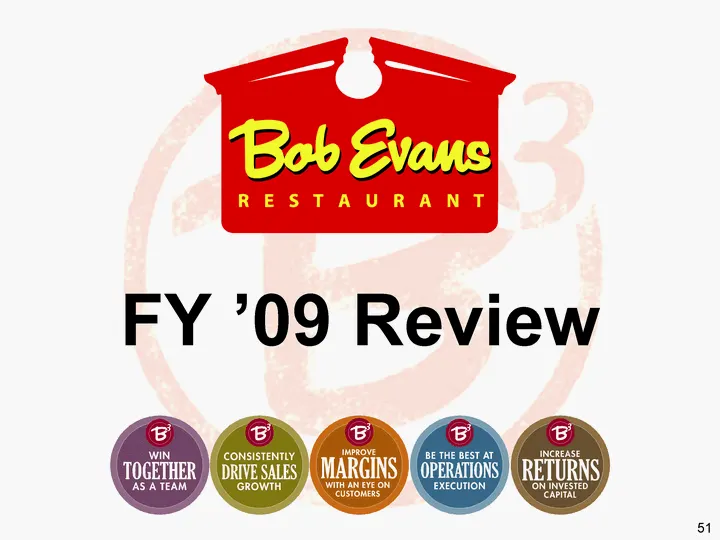
FY ’09 Review Be Be TOGETHER |) DRivesites | MARGINS | OPERATIONS)| RETURNS ‘ON INVESTED. AS ATEAM ‘GROWTH TH AN EYE ON EXECUTION CUsOMERS ‘caPaL 51
Slide 52: Core Store Performance
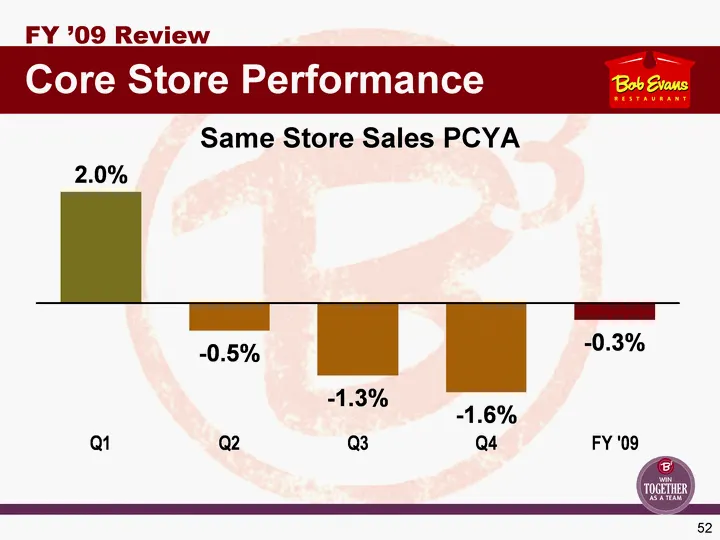
52 Core Store Performance FY '09 Review Same Store Sales PCYA Q1 Q2 Q3 Q4 FY '09 SSS 0.02 -0.005 -0.013 -0.016 -0.003
Slide 53: Same Store Sales vs. Family Style Peers
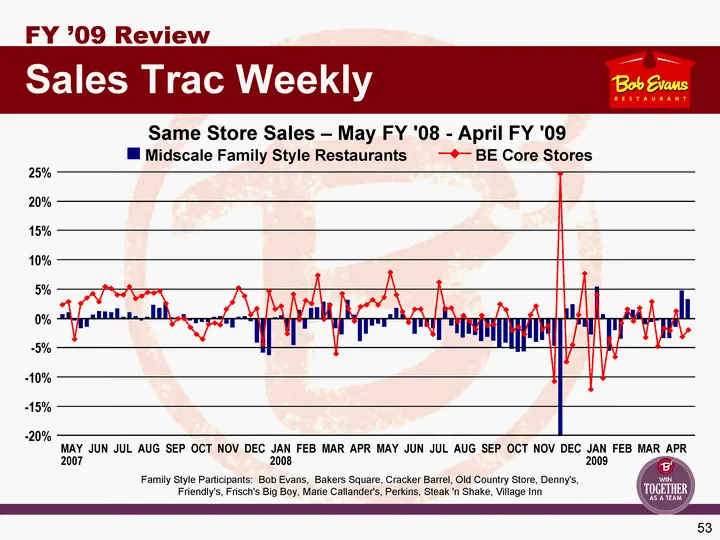
53 Same Store Sales - May FY '08 - April FY '09 Family Style Participants: Bob Evans, Bakers Square, Cracker Barrel, Old Country Store, Denny's, Friendly's, Frisch's Big Boy, Marie Callander's, Perkins, Steak 'n Shake, Village Inn Sales Trac Weekly FY '09 Review - -20% - -15% - -10% - -5% 0% 5% 10%
Slide 54: Consistent Operations Drives Sales
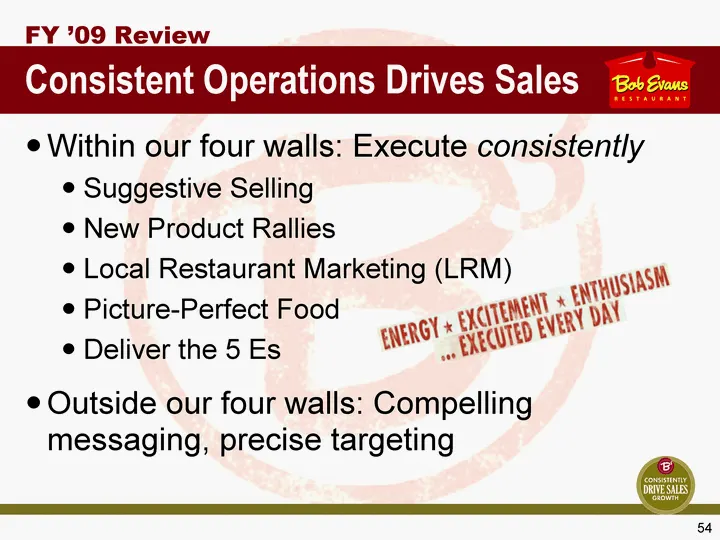
54 Within our four walls: Execute consistently Suggestive Selling New Product Rallies Local Restaurant Marketing (LRM) Picture-Perfect Food Deliver the 5 Es Outside our four walls: Compelling messaging, precise targeting Consistent Operations Drives Sales FY '09 Review
Slide 55: Pricing Management Strategy
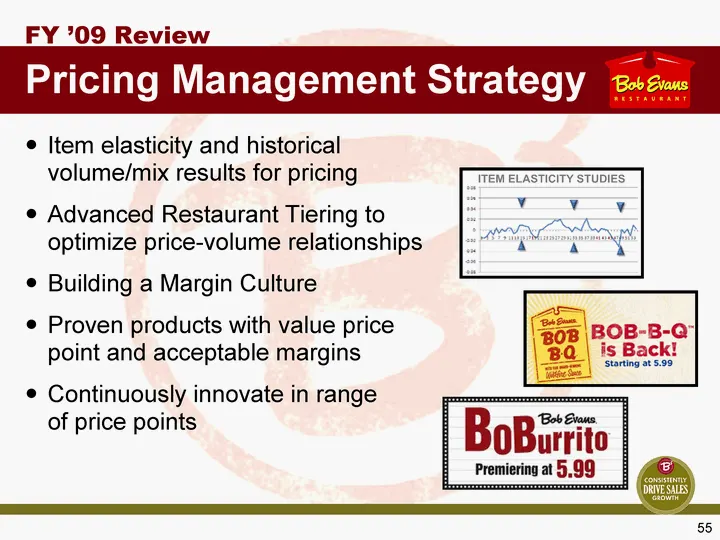
55 Pricing Management Strategy FY '09 Review Item elasticity and historical volume/mix results for pricing Advanced Restaurant Tiering to optimize price-volume relationships Building a Margin Culture Proven products with value price point and acceptable margins Continuously innovate in range of pric
Slide 56: Major Marketing Programs
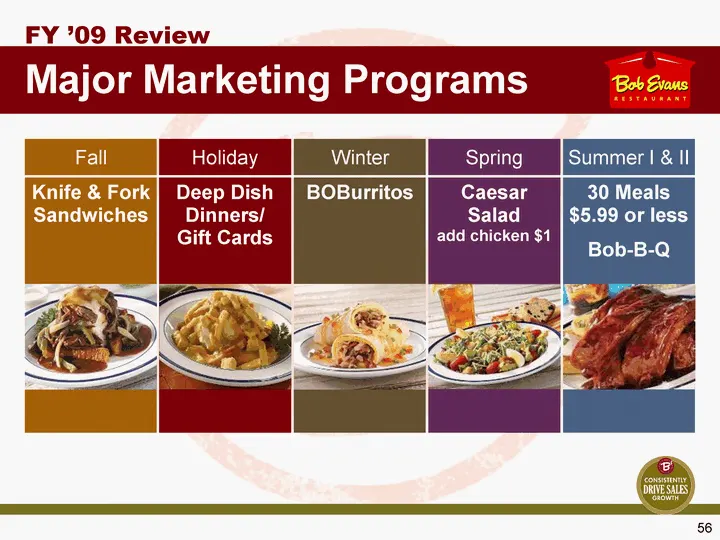
56 Major Marketing Programs FY '09 Review Holiday Deep Dish Dinners/ Gift Cards Winter BOBurritos Spring Caesar Salad add chicken $1 Summer I & II 30 Meals $5.99 or less Bob-B-Q Fall Knife & Fork Sandwiches
Slide 57: Systems, Processes, Disciplines
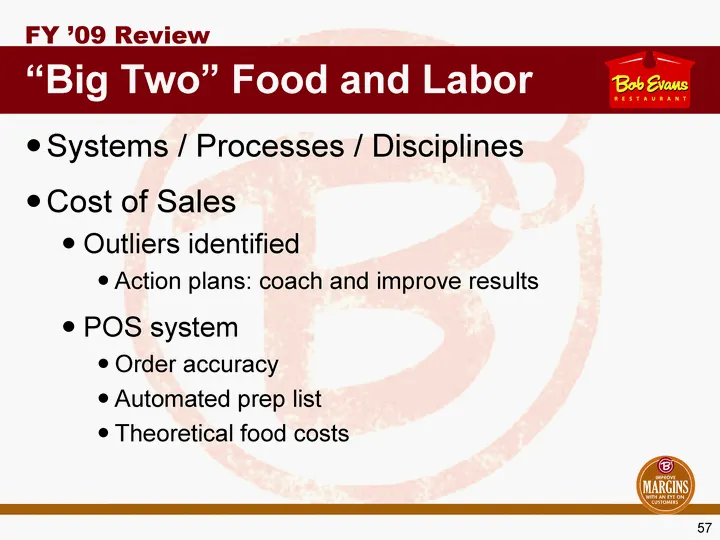
57 Systems / Processes / Disciplines Cost of Sales Outliers identified Action plans: coach and improve results POS system Order accuracy Automated prep list Theoretical food costs "Big Two" Food and Labor FY '09 Review
Slide 58: Productivity Initiatives: Supply Chain
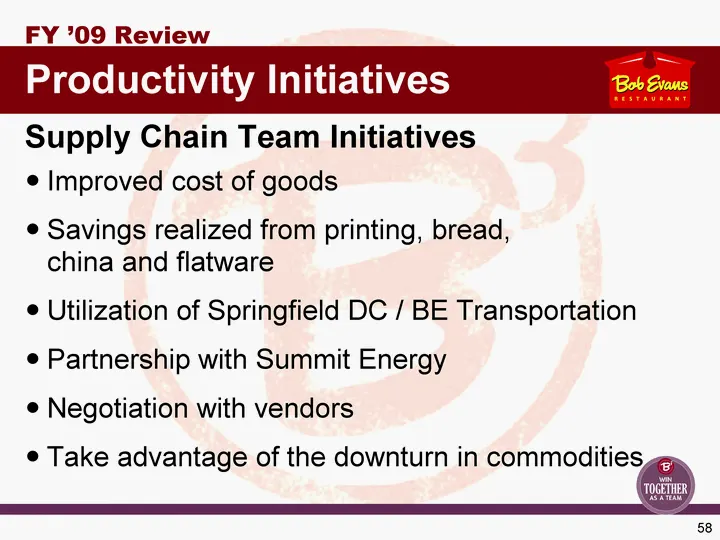
58 Improved cost of goods Savings realized from printing, bread, china and flatware Utilization of Springfield DC / BE Transportation Partnership with Summit Energy Negotiation with vendors Take advantage of the downturn in commodities Productivity Initiatives FY '09 Review Supply Chain Team Initiat
Slide 59: Labor Productivity
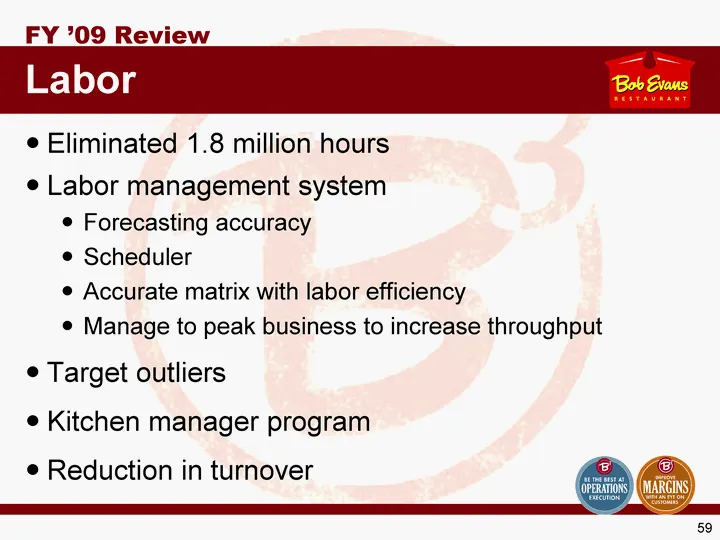
59 Eliminated 1.8 million hours Labor management system Forecasting accuracy Scheduler Accurate matrix with labor efficiency Manage to peak business to increase throughput Target outliers Kitchen manager program Reduction in turnover Labor FY '09 Review
Slide 60: Employee Turnover (hourly)
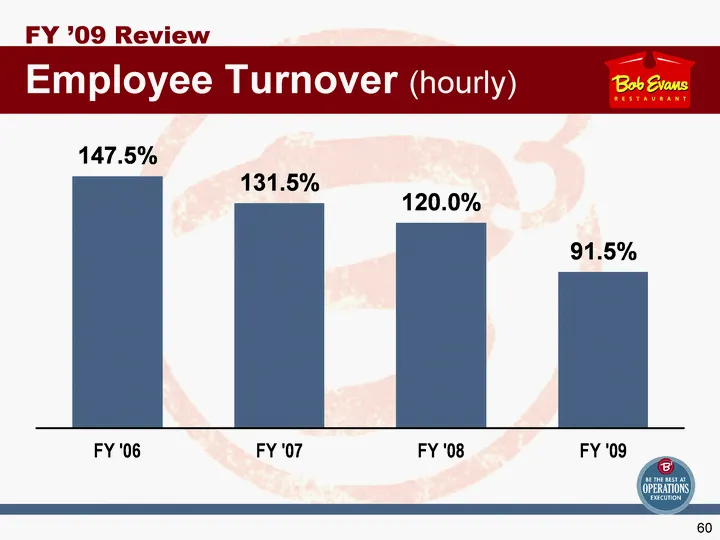
60 Employee Turnover (hourly) FY '09 Review FY '06 FY '07 FY '08 FY '09 Turnover 1.475 1.315 1.2 0.915
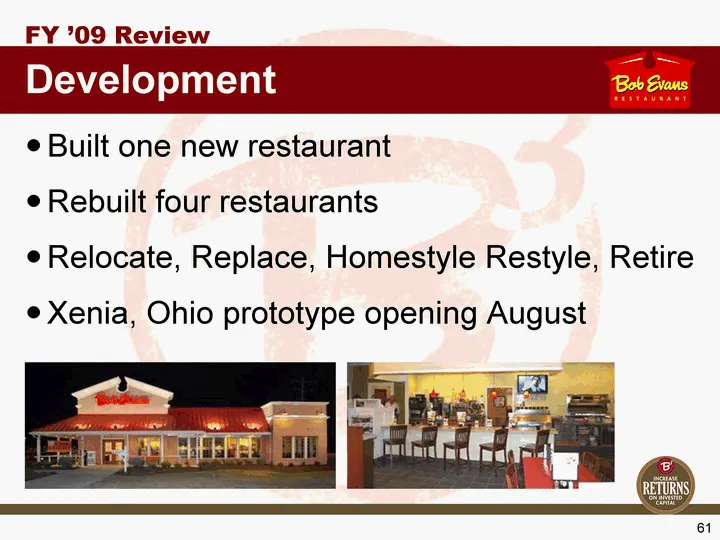
Slide 61: Development
61 Built one new restaurant Rebuilt four restaurants Relocate, Replace, Homestyle Restyle, Retire Xenia, Ohio prototype opening August Development FY '09 Review
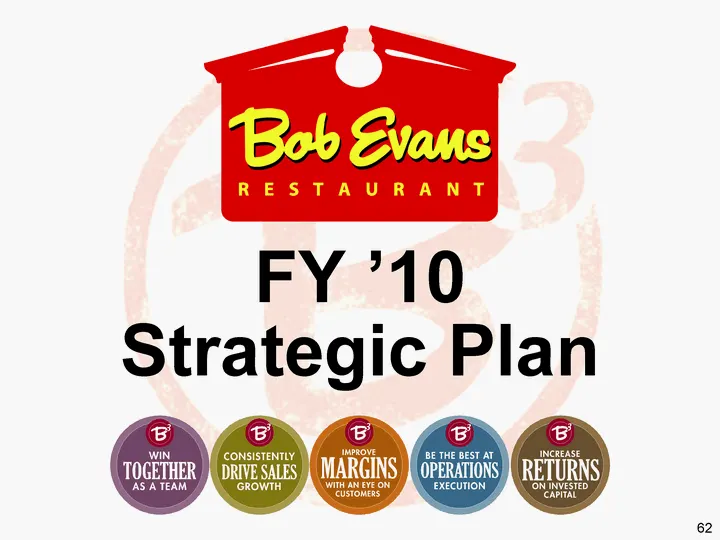
Slide 62: Strategic Plan
FY 10 Strategic Pl B win consis TOGETHER || DRIVE AS/ATEAM GRO an S
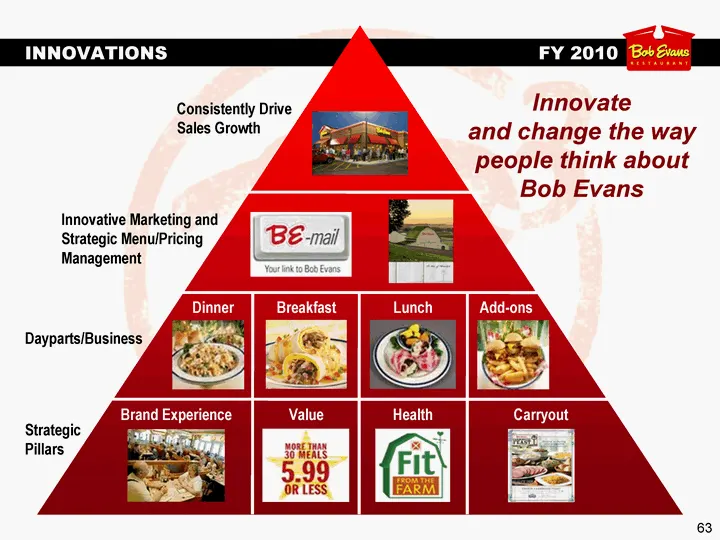
Slide 63: FY 2010 Strategic Pillars
63 INNOVATIONS FY 2010 Brand Experience Value Health Dinner Breakfast Lunch Carryout Add-ons Consistently Drive Sales Growth Innovative Marketing and Strategic Menu/Pricing Management Dayparts/Business Strategic Pillars Innovate and change the way people think about Bob Evans
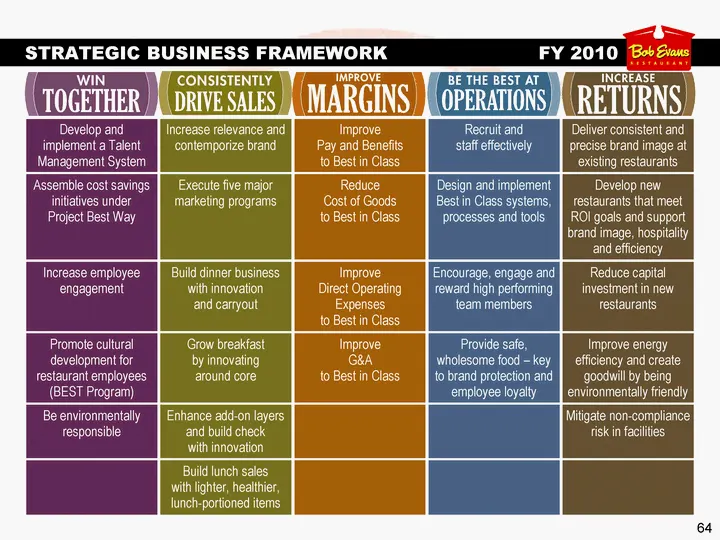
Slide 64: FY 2010 Strategic Plan Initiatives
64 Develop and implement a Talent Management System Increase relevance and contemporize brand Improve Pay and Benefits to Best in Class Recruit and staff effectively Deliver consistent and precise brand image at existing restaurants Assemble cost savings initiatives under Project Best Way Execute fi
Slide 65: FY 2010 Strategic Plan Initiatives
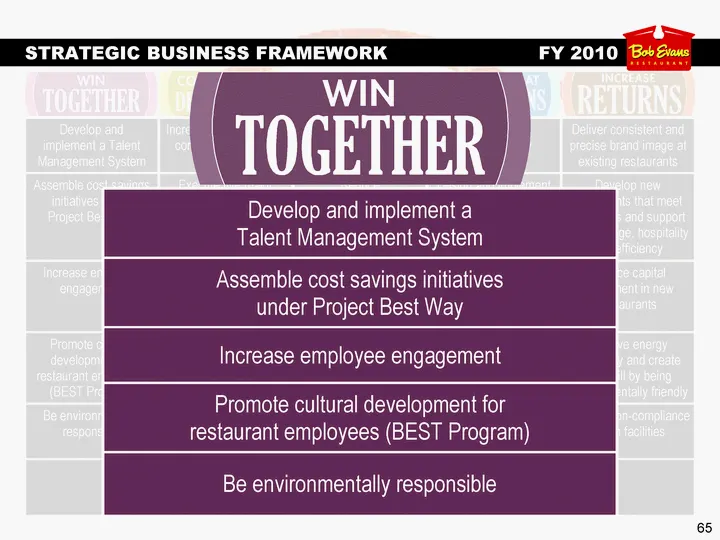
65 Develop and implement a Talent Management System Increase relevance and contemporize brand Improve Pay and Benefits to Best in Class Recruit and staff effectively Deliver consistent and precise brand image at existing restaurants Assemble cost savings initiatives under Project Best Way Execute fi
Slide 66: FY 2010 Strategic Plan Initiatives
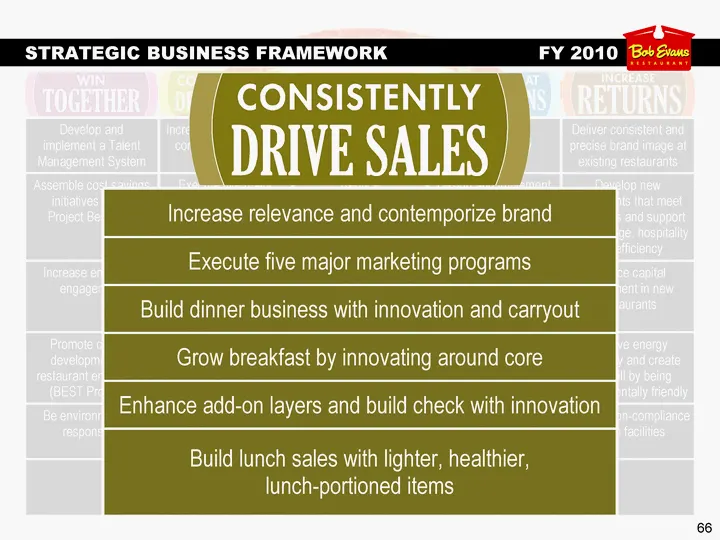
66 Develop and implement a Talent Management System Increase relevance and contemporize brand Improve Pay and Benefits to Best in Class Recruit and staff effectively Deliver consistent and precise brand image at existing restaurants Assemble cost savings initiatives under Project Best Way Execute fi
Slide 67: FY 2010 Strategic Plan Initiatives
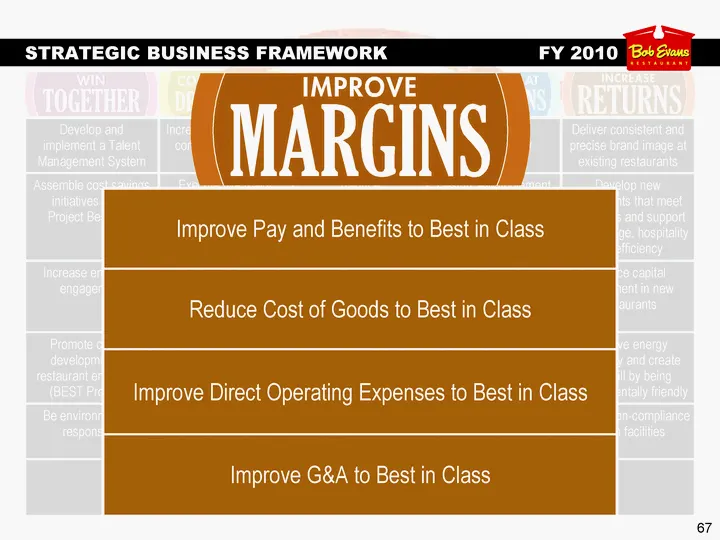
67 Develop and implement a Talent Management System Increase relevance and contemporize brand Improve Pay and Benefits to Best in Class Recruit and staff effectively Deliver consistent and precise brand image at existing restaurants Assemble cost savings initiatives under Project Best Way Execute fi
Slide 68: FY 2010 Strategic Plan Initiatives
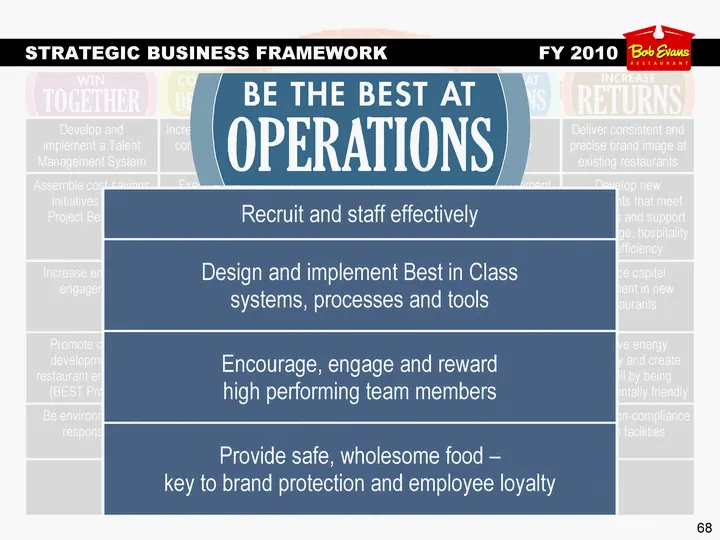
68 Develop and implement a Talent Management System Increase relevance and contemporize brand Improve Pay and Benefits to Best in Class Recruit and staff effectively Deliver consistent and precise brand image at existing restaurants Assemble cost savings initiatives under Project Best Way Execute fi
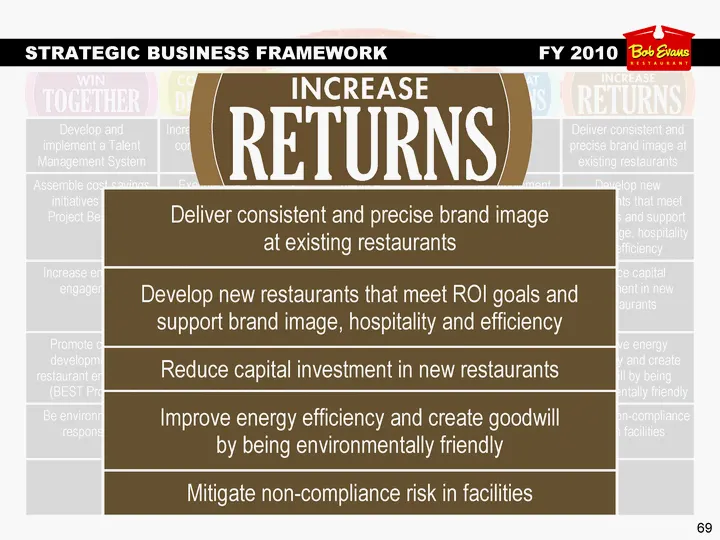
Slide 69: FY 2010 Strategic Plan Initiatives
69 Develop and implement a Talent Management System Increase relevance and contemporize brand Improve Pay and Benefits to Best in Class Recruit and staff effectively Deliver consistent and precise brand image at existing restaurants Assemble cost savings initiatives under Project Best Way Execute fi
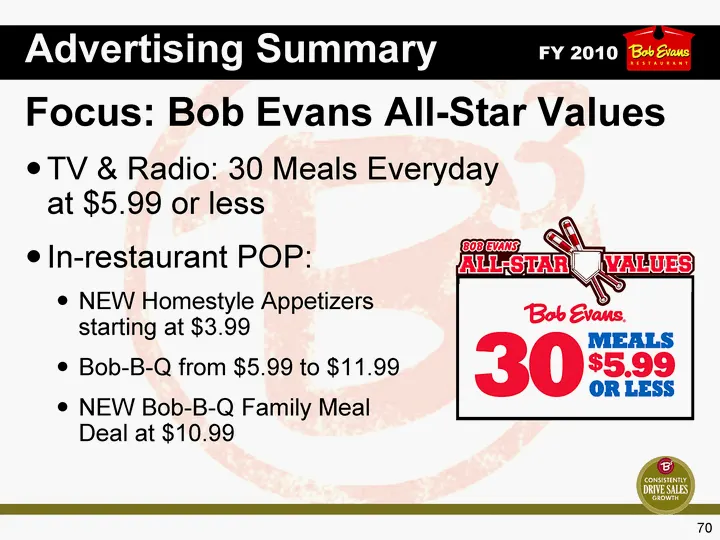
Slide 70: FY 2010 Advertising Summary
70 TV & Radio: 30 Meals Everyday at $5.99 or less In-restaurant POP: NEW Homestyle Appetizers starting at $3.99 Bob-B-Q from $5.99 to $11.99 NEW Bob-B-Q Family Meal Deal at $10.99 Focus: Bob Evans All-Star Values FY 2010 Advertising Summary
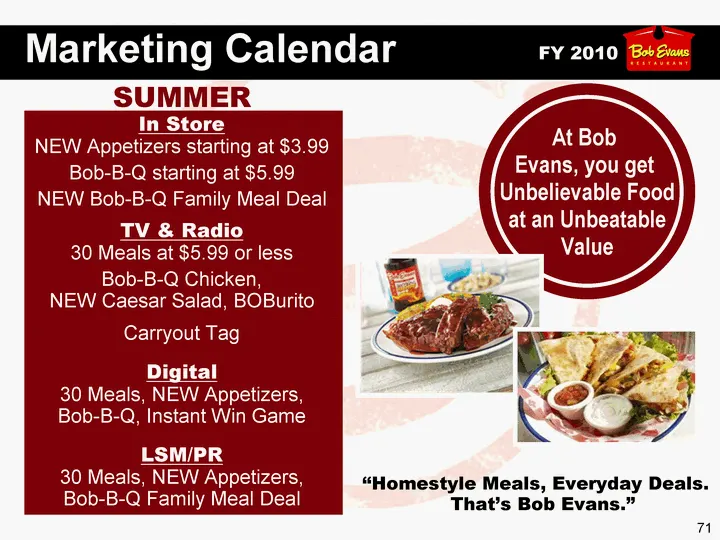
Slide 71: Summer Marketing Calendar
71 FY 2010 In Store NEW Appetizers starting at $3.99 Bob-B-Q starting at $5.99 NEW Bob-B-Q Family Meal Deal TV & Radio 30 Meals at $5.99 or less Bob-B-Q Chicken, NEW Caesar Salad, BOBurito Carryout Tag Digital 30 Meals, NEW Appetizers, Bob-B-Q, Instant Win Game LSM/PR 30 Meals, NEW Appetizers, Bob-B
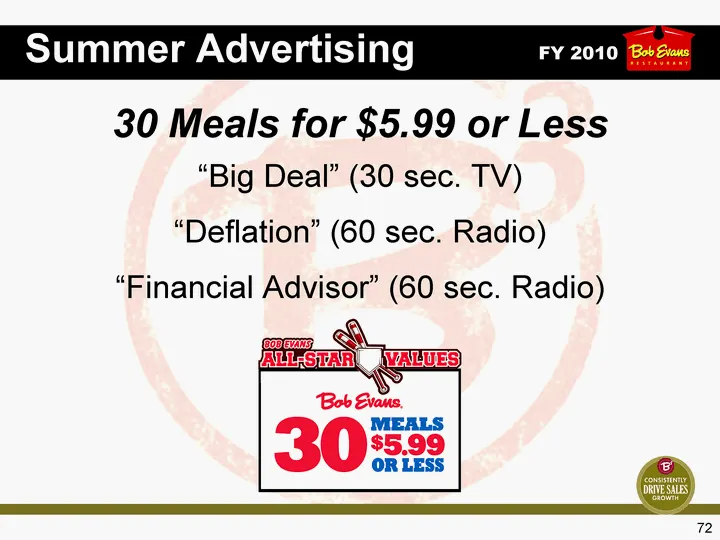
Slide 72: FY 2010 Summer Advertising
72 30 Meals for $5.99 or Less "Big Deal" (30 sec. TV) "Deflation" (60 sec. Radio) "Financial Advisor" (60 sec. Radio) FY 2010 Summer Advertising
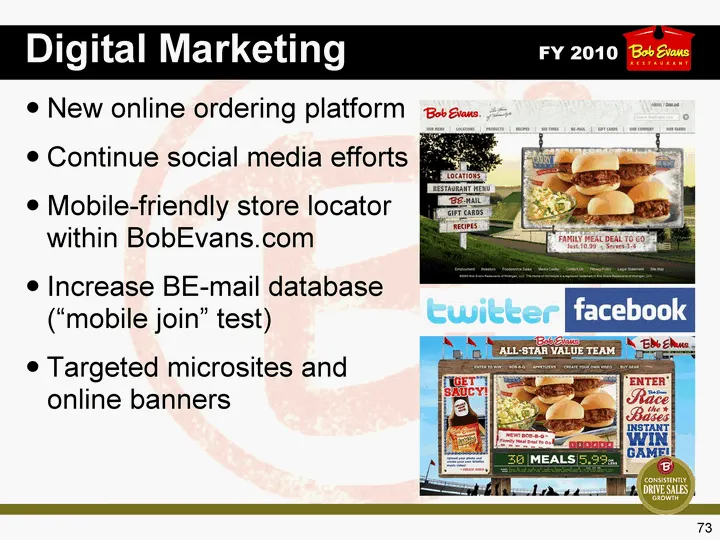
Slide 73: FY 2010 Digital Marketing
73 New online ordering platform Continue social media efforts Mobile-friendly store locator within BobEvans.com Increase BE-mail database ("mobile join" test) Targeted microsites and online banners FY 2010 Digital Marketing
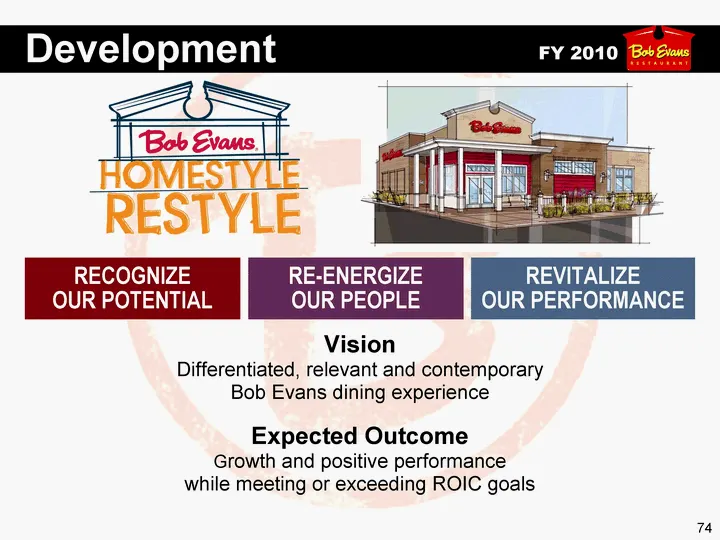
Slide 74: FY 2010 Development
74 REVITALIZE OUR PERFORMANCE RE-ENERGIZE OUR PEOPLE RECOGNIZE OUR POTENTIAL Vision Differentiated, relevant and contemporary Bob Evans dining experience Expected Outcome Growth and positive performance while meeting or exceeding ROIC goals FY 2010 Development
Slide 75: FY 2010 Imperatives
75 Imperatives FY 2010 Drive same store sales Value and innovation Deployment and alignment of resources Continue margin excellence Supply chain savings Labor management system Fix top customer concerns Deliver Homestyle Restyle design and remodel to meet ROIC goals Identify future development DMAs
Slide 76: 76
76
Slide 77: Tim Pulido and Herbert Billinger
77 Tim Pulido President and Chief Concept Officer Herbert Billinger EVP of Operations, Productivity and Integration
Slide 78: FY '09 Review / FY '10 Strategic Plan
78 FY '09 Review FY '10 Strategic Plan
Slide 79: Three Major Forces Impacting Business
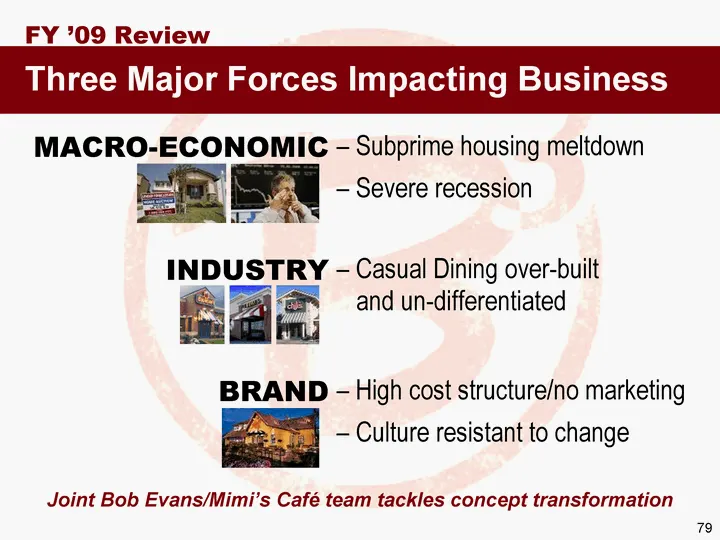
79 Three Major Forces Impacting Business Joint Bob Evans/Mimi's Cafe team tackles concept transformation FY '09 Review MACRO-ECONOMIC - - Subprime housing meltdown - - Severe recession INDUSTRY - - Casual Dining over-built and un-differentiated BRAND - - High cost structure/no marketing - - Culture
Slide 80: Business Transformation Vision
80 Re-engineer Cost Structure Drive P&L improvements Focus on prime costs/Keep eye on the Guest Re-invest one point back into Marketing Re-vitalize Concept Rebuild guest traffic and frequency Renovate legacy stores Define "Cafe of the Future" and growth Business Transformation Vision FY '09 Review
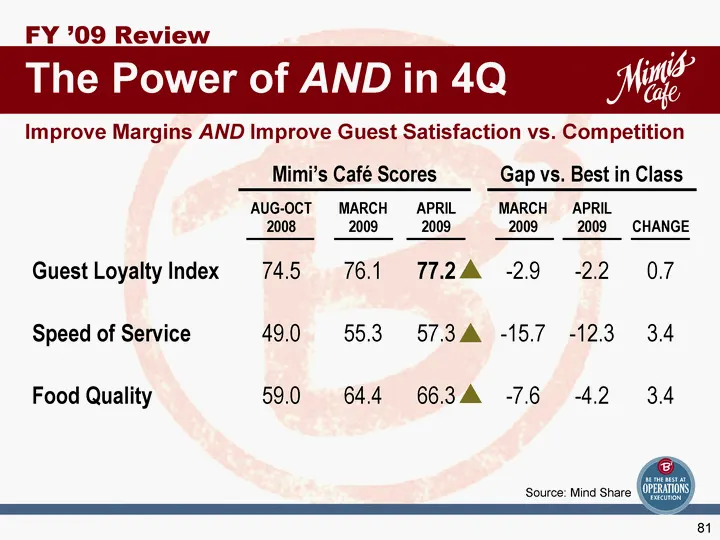
Slide 81: Improve Margins and Guest Satisfaction vs. Competition
81 Improve Margins AND Improve Guest Satisfaction vs. Competition The Power of AND in 4Q FY '09 Review Source: Mind Share Mimi's Cafe Scores Mimi's Cafe Scores Mimi's Cafe Scores Gap vs. Best in Class Gap vs. Best in Class Gap vs. Best in Class AUG-OCT 2008 MARCH 2009 APRIL 2009 MARCH 2009 APRIL 200
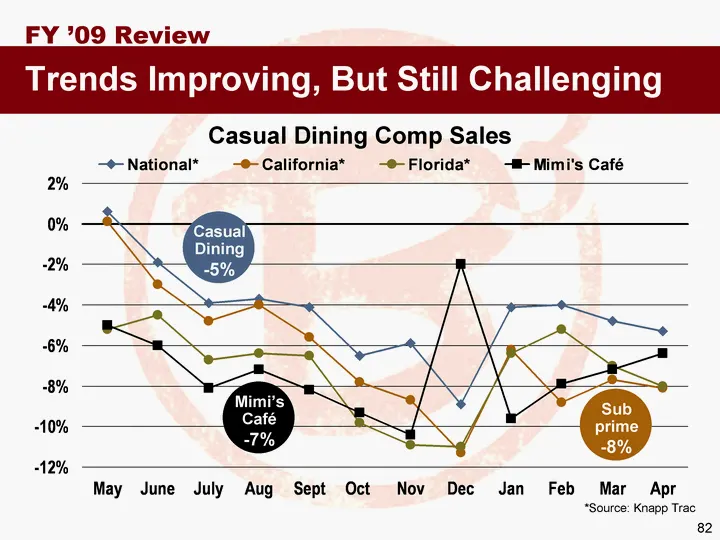
Slide 82: Casual Dining Comp Sales Trends
82 *Source: Knapp Trac May June July Aug Sept Oct Nov Dec Jan Feb Mar Apr National* 0.006 -0.019 -0.039 -0.037 -0.041 -0.065 -0.059 -0.089 -0.041 -0.04 -0.048 -0.053 California* 0.001 -0.03 -0.048 -0.04 -0.056 -0.078 -0.087 -0.113 -0.062 -0.088 -0.077 -0.081 Florida* -0.052 -0.045 -0.067 -0.064 -0.0
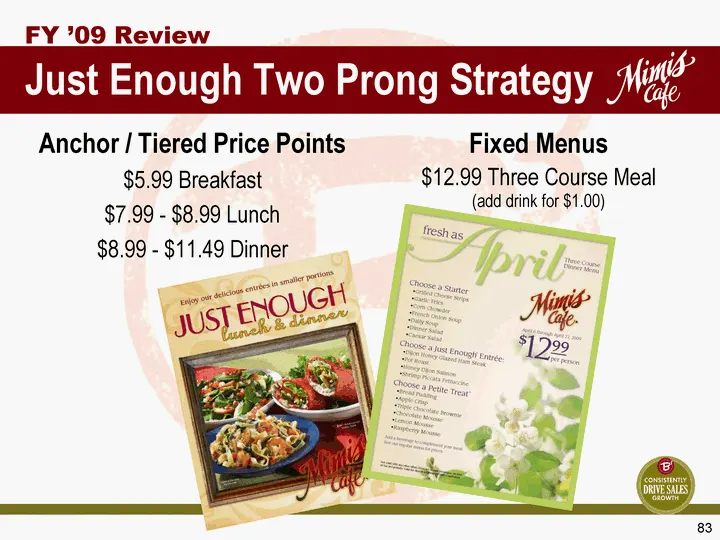
Slide 83: Just Enough Two Prong Strategy
83 Just Enough Two Prong Strategy FY '09 Review Anchor / Tiered Price Points $5.99 Breakfast $7.99 - $8.99 Lunch $8.99 - $11.49 Dinner Fixed Menus $12.99 Three Course Meal (add drink for $1.00)
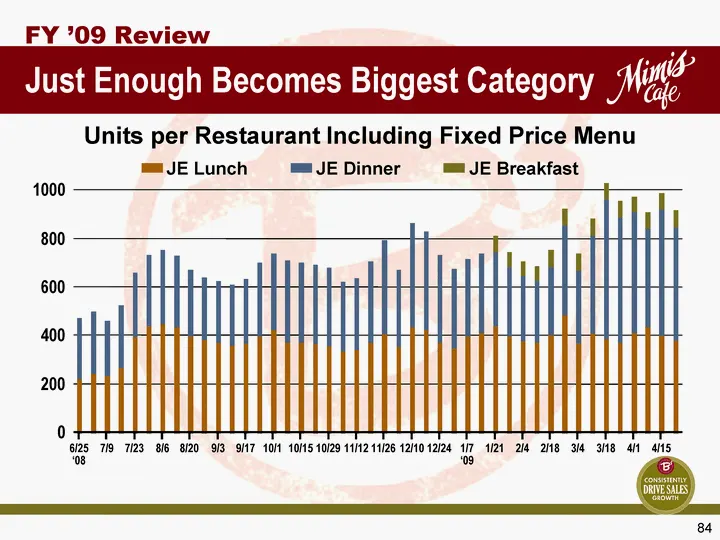
Slide 84: Just Enough Becomes Biggest Category
84 Just Enough Becomes Biggest Category FY '09 Review Units per Restaurant Including Fixed Price Menu 6/25 '08 7/9 7/23 8/6 8/20 9/3 9/17 10/1 10/15 10/29 11/12 11/26 12/10 12/24 1/7 '09 1/21 2/4 2/18 3/4 3/18 4/1 4/15 JE Lunch JE Dinner JE Breakfast 0 200 400 600 800 1000
Slide 85: Just Enough In-store Merchandising
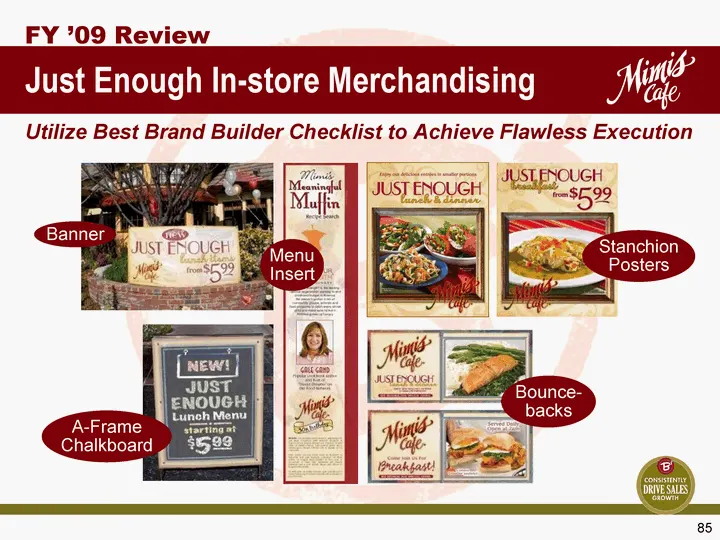
85 Just Enough In-store Merchandising FY '09 Review Utilize Best Brand Builder Checklist to Achieve Flawless Execution Banner A-Frame Chalkboard Menu Insert Stanchion Posters Bounce- backs
Slide 86: Just Enough Fixed Three Course Menus
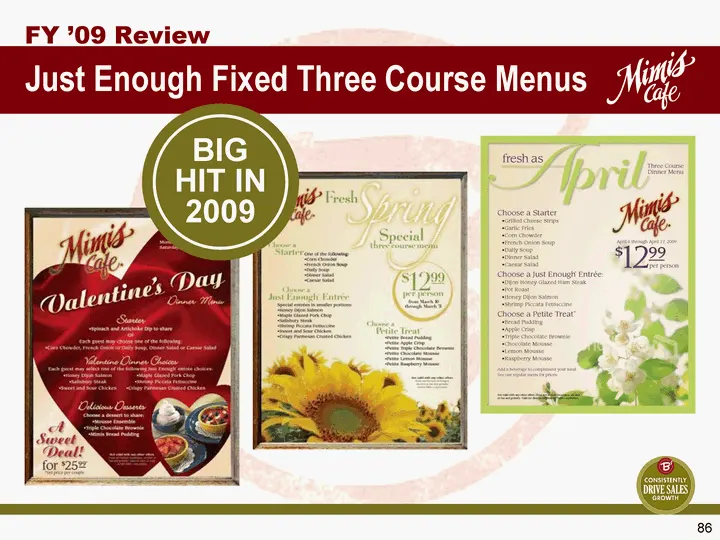
86 Just Enough Fixed Three Course Menus FY '09 Review BIG HIT IN 2009
Slide 87: Digital Marketing & Social Networking
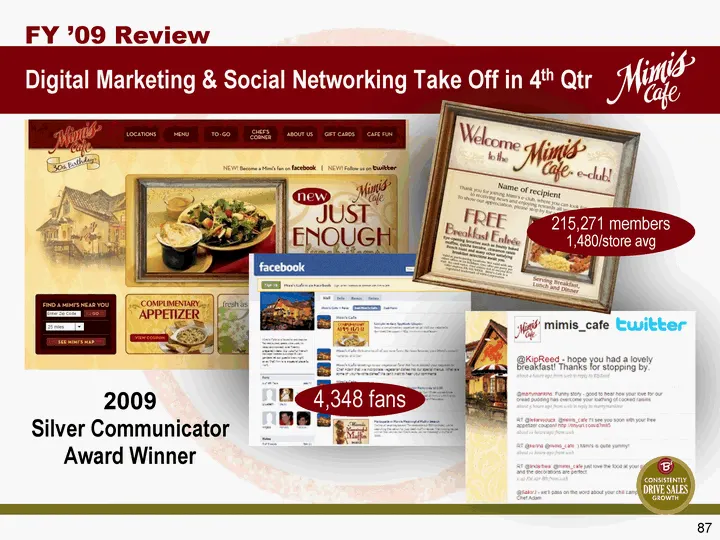
87 FY '09 Review 4,348 fans 215,271 members 1,480/store avg Digital Marketing & Social Networking Take Off in 4th Qtr 2009 Silver Communicator Award Winner
Slide 88: FY 2010 Brand Re-launch
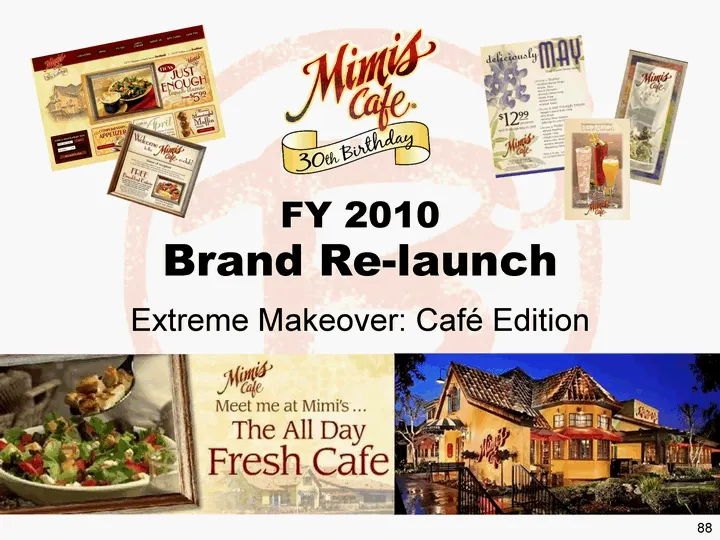
88 FY 2010 Brand Re-launch Extreme Makeover: Cafe Edition
Slide 89: FY 2010 Strategic Pillars
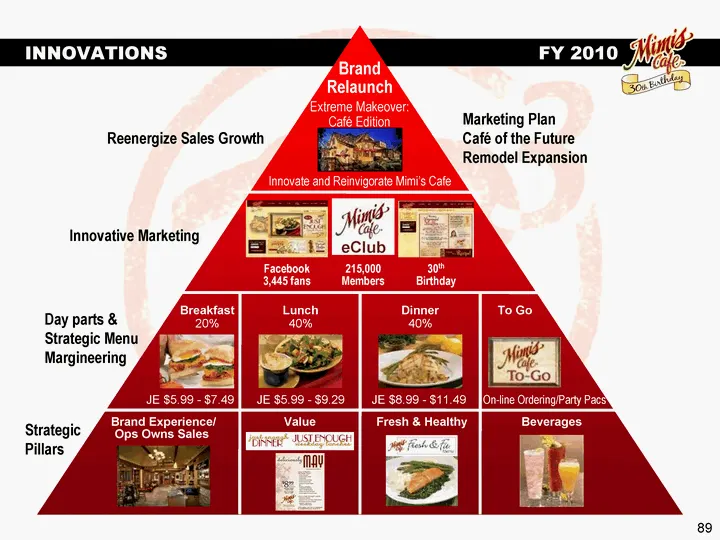
89 INNOVATIONS FY 2010 Brand Experience/ Ops Owns Sales Value Fresh & Healthy Breakfast Lunch Dinner Beverages To Go Reenergize Sales Growth Innovative Marketing Day parts & Strategic Menu Margineering Strategic Pillars Innovate and Reinvigorate Mimi's Cafe Brand Relaunch Marketing Plan Cafe of the
Slide 90: Integrate Supply Chain Communicate "Meet me at Mimi's the all day fresh cafe." Re-engineer
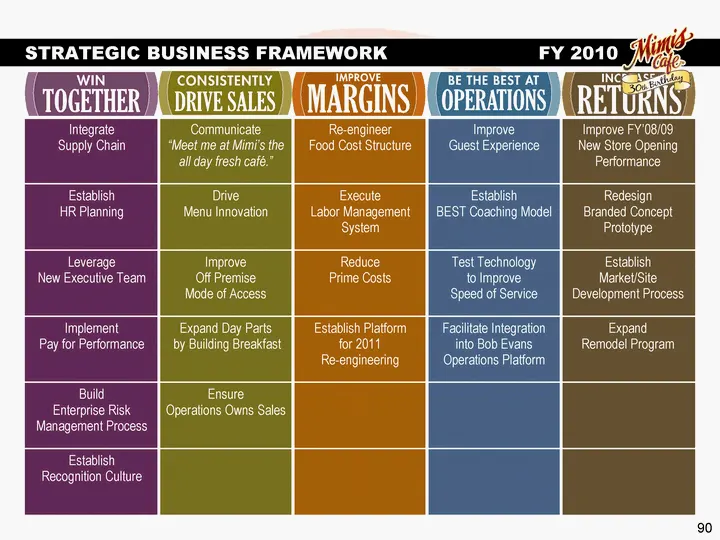
90 Integrate Supply Chain Communicate "Meet me at Mimi's the all day fresh cafe." Re-engineer Food Cost Structure Improve Guest Experience Improve FY'08/09 New Store Opening Performance Establish HR Planning Drive Menu Innovation Execute Labor Management System Establish BEST Coaching Model Redesign
Slide 91: Integrate Supply Chain Communicate "Meet me at Mimi's the all day fresh cafe." Re-engineer
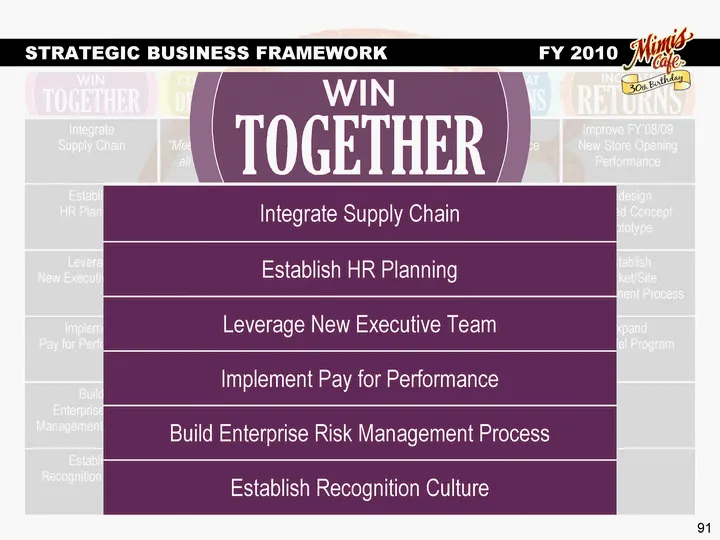
91 Integrate Supply Chain Communicate "Meet me at Mimi's the all day fresh cafe." Re-engineer Food Cost Structure Improve Guest Experience Improve FY'08/09 New Store Opening Performance Establish HR Planning Drive Menu Innovation Execute Labor Management System Establish BEST Coaching Model Redesign
Slide 92: Integrate Supply Chain Communicate "Meet me at Mimi's the all day fresh cafe." Re-engineer
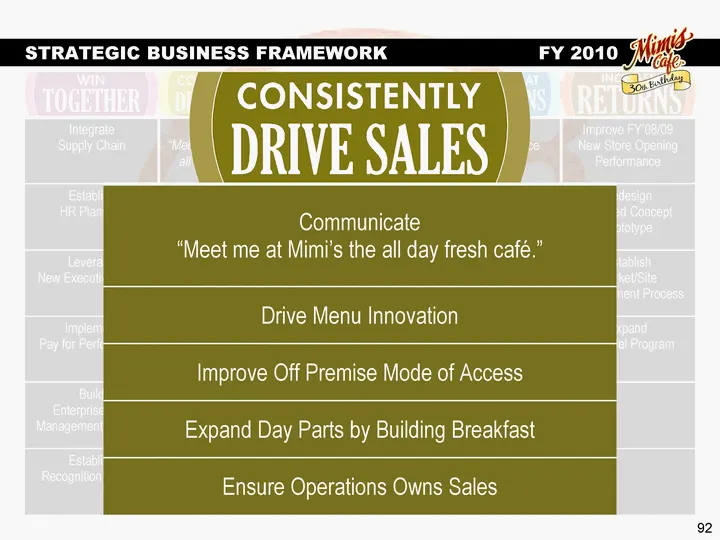
92 Integrate Supply Chain Communicate "Meet me at Mimi's the all day fresh cafe." Re-engineer Food Cost Structure Improve Guest Experience Improve FY'08/09 New Store Opening Performance Establish HR Planning Drive Menu Innovation Execute Labor Management System Establish BEST Coaching Model Redesign
Slide 93: Integrate Supply Chain Communicate "Meet me at Mimi's the all day fresh cafe." Re-engineer
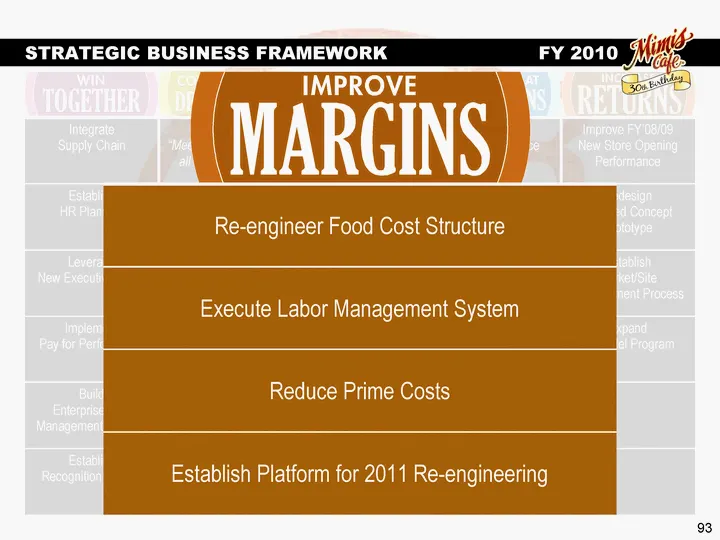
93 Integrate Supply Chain Communicate "Meet me at Mimi's the all day fresh cafe." Re-engineer Food Cost Structure Improve Guest Experience Improve FY'08/09 New Store Opening Performance Establish HR Planning Drive Menu Innovation Execute Labor Management System Establish BEST Coaching Model Redesign
Slide 94: Integrate Supply Chain Communicate "Meet me at Mimi's the all day fresh cafe." Re-engineer
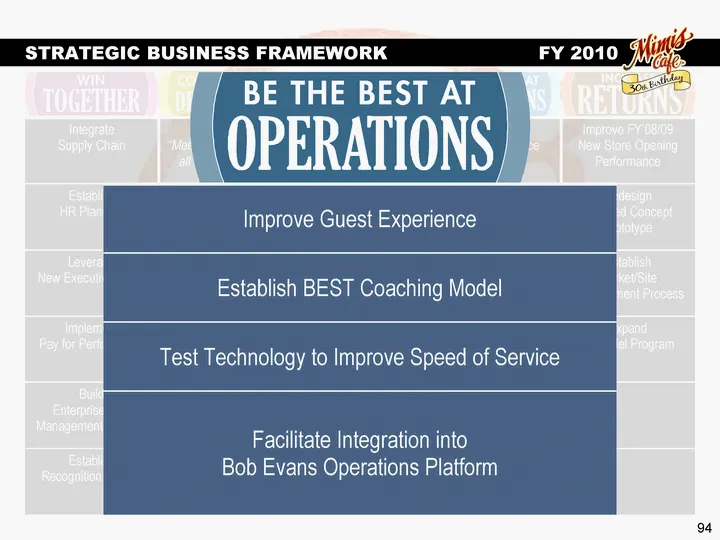
94 Integrate Supply Chain Communicate "Meet me at Mimi's the all day fresh cafe." Re-engineer Food Cost Structure Improve Guest Experience Improve FY'08/09 New Store Opening Performance Establish HR Planning Drive Menu Innovation Execute Labor Management System Establish BEST Coaching Model Redesign
Slide 95: Integrate Supply Chain Communicate "Meet me at Mimi's the all day fresh cafe." Re-engineer
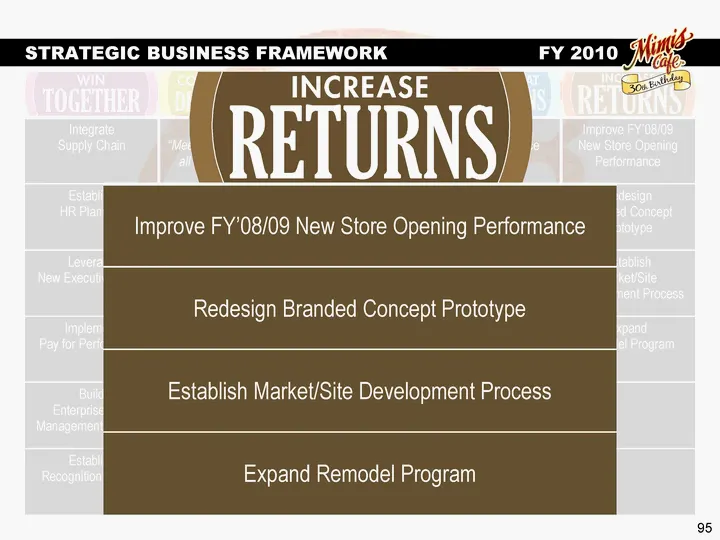
95 Integrate Supply Chain Communicate "Meet me at Mimi's the all day fresh cafe." Re-engineer Food Cost Structure Improve Guest Experience Improve FY'08/09 New Store Opening Performance Establish HR Planning Drive Menu Innovation Execute Labor Management System Establish BEST Coaching Model Redesign
Slide 96: Menu Innovation Platforms FY 2010
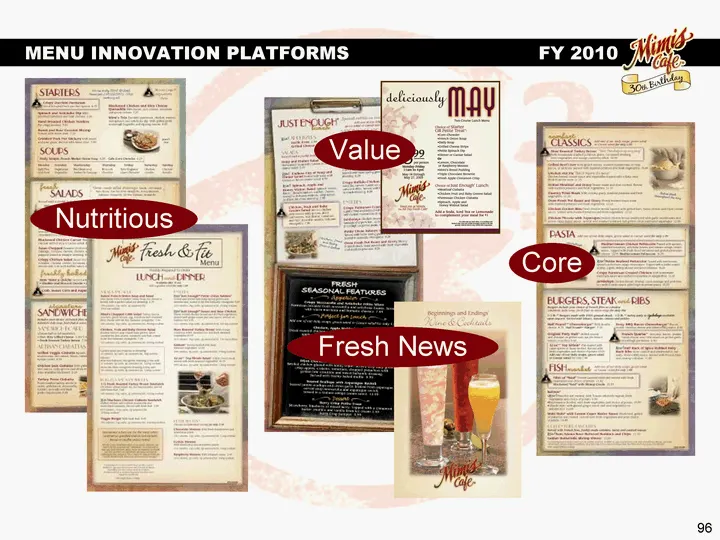
96 Nutritious Value Fresh News Core MENU INNOVATION PLATFORMS FY 2010
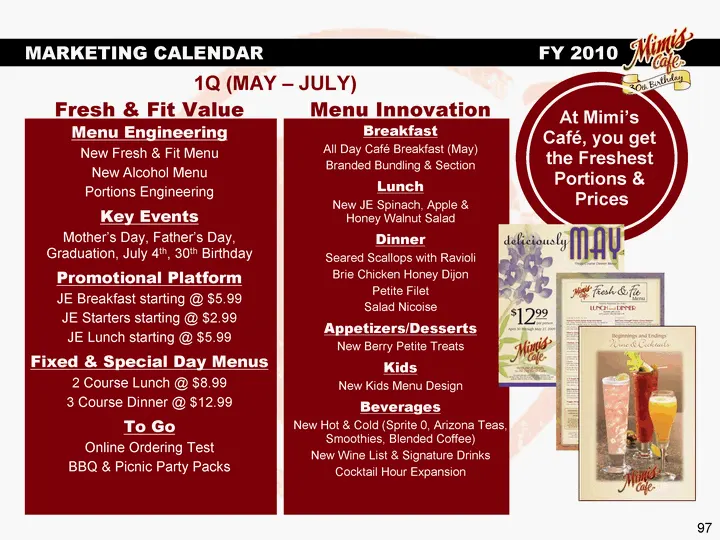
Slide 97: Menu Engineering and Promotional Platform
97 Menu Engineering New Fresh & Fit Menu New Alcohol Menu Portions Engineering Key Events Mother's Day, Father's Day, Graduation, July 4th, 30th Birthday Promotional Platform JE Breakfast starting @ $5.99 JE Starters starting @ $2.99 JE Lunch starting @ $5.99 Fixed & Special Day Menus 2 Course Lunch
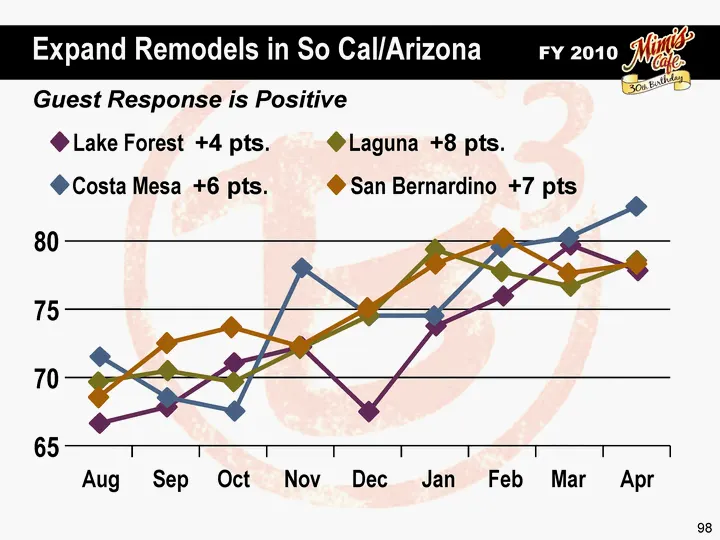
Slide 98: Guest Response is Positive
98 65 75 80 70 Guest Response is Positive FY 2010 Expand Remodels in So Cal/Arizona Aug Sep Oct Nov Dec Jan Feb Mar Apr Lake Forest +4 pts. Costa Mesa +6 pts. Laguna +8 pts. San Bernardino +7 pts
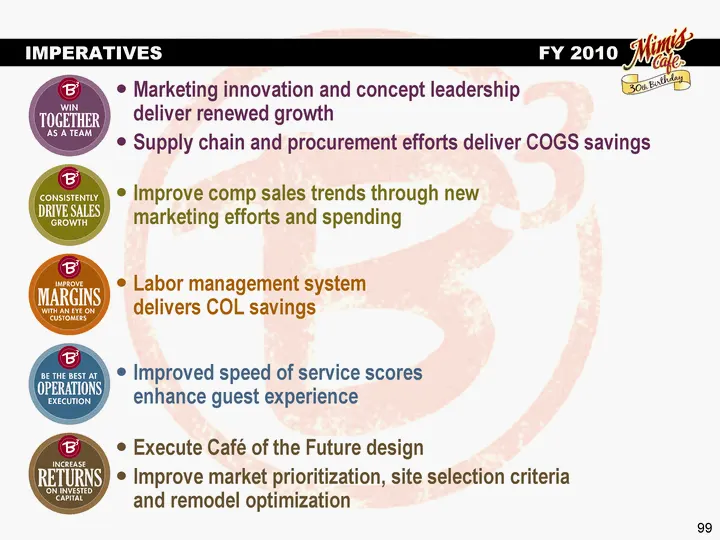
Slide 99: Imperatives FY 2010
99 IMPERATIVES FY 2010 Improve comp sales trends through new marketing efforts and spending Labor management system delivers COL savings Improved speed of service scores enhance guest experience Execute Cafe of the Future design Improve market prioritization, site selection criteria and remodel opti
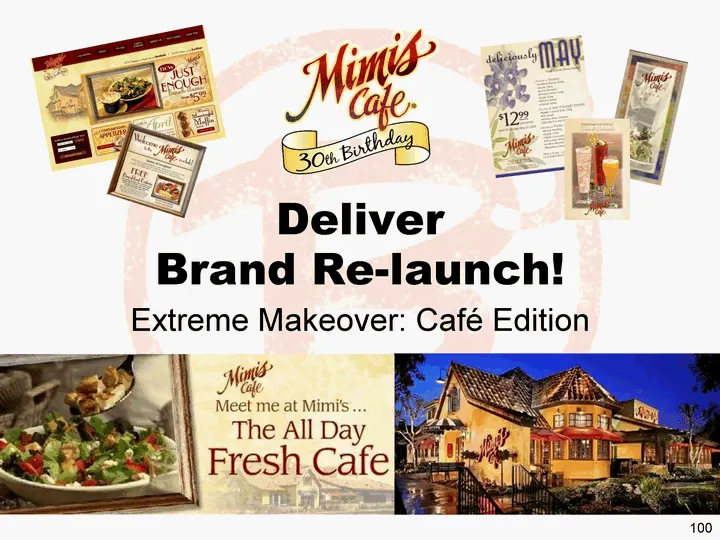
Slide 100: Deliver Brand Re-launch! Extreme Makeover: Cafe Edition
100 Deliver Brand Re-launch! Extreme Makeover: Cafe Edition
Slide 101: Bob Evans Farms Analyst Day
Bob Evaus FARMS® A Analyst Day June 3, 2008
Slide 102: Harvey Brownlee, President and Chief Restaurant Operations Officer
102 Harvey Brownlee President and Chief Restaurant Operations Officer
Slide 103: 103
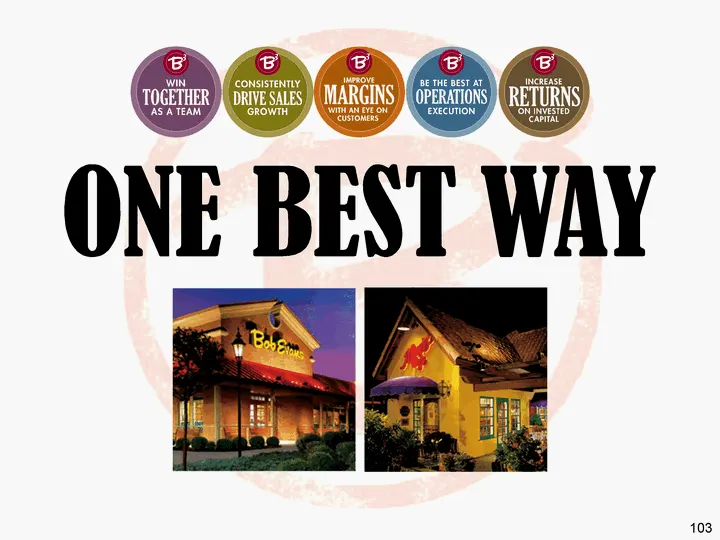
103
Slide 104: Our Plan to Go From Good to Great
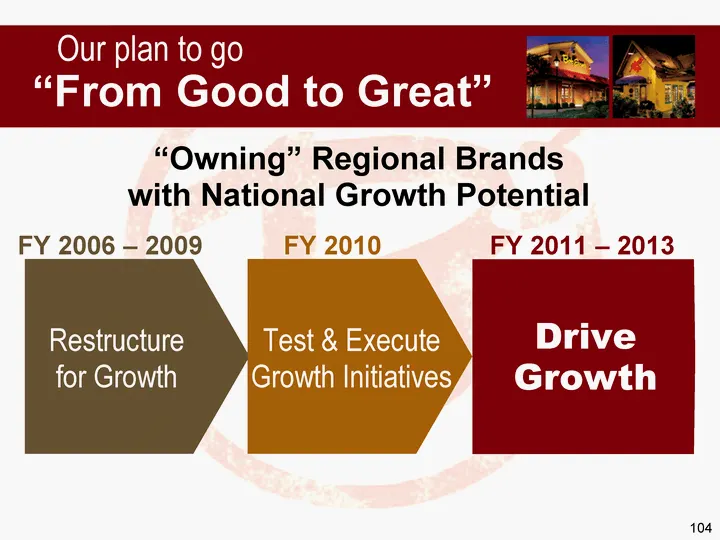
104 Our plan to go "From Good to Great" "Owning" Regional Brands with National Growth Potential FY 2006 - 2009 Restructure for Growth FY 2010 Test & Execute Growth Initiatives FY 2011 - 2013 Drive Growth
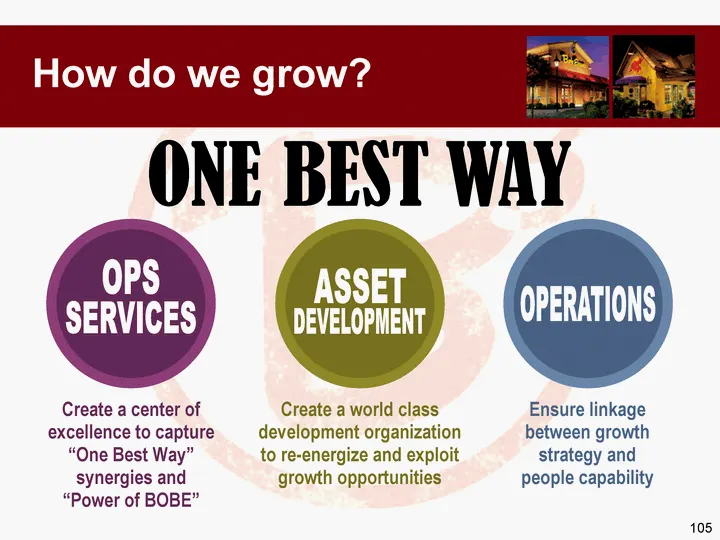
Slide 105: How Do We Grow?
105 Create a center of excellence to capture "One Best Way" synergies and "Power of BOBE" How do we grow? OPSSERVICESASSETDEVELOPMENTOPERATIONS Create a world class development organization to re-energize and exploit growth opportunities Ensure linkage between growth strategy and people capability
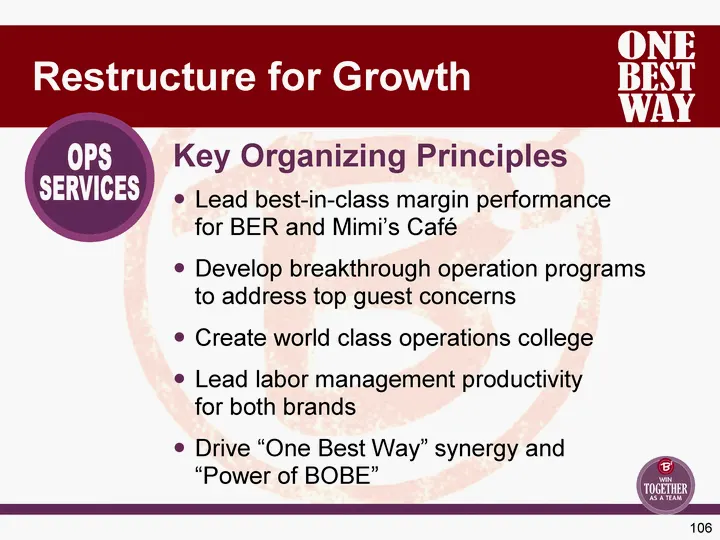
Slide 106: Restructure for Growth Key Organizing Principles
106 Lead best-in-class margin performance for BER and Mimi's Cafe Develop breakthrough operation programs to address top guest concerns Create world class operations college Lead labor management productivity for both brands Drive "One Best Way" synergy and "Power of BOBE" OPSSERVICES Restructure fo
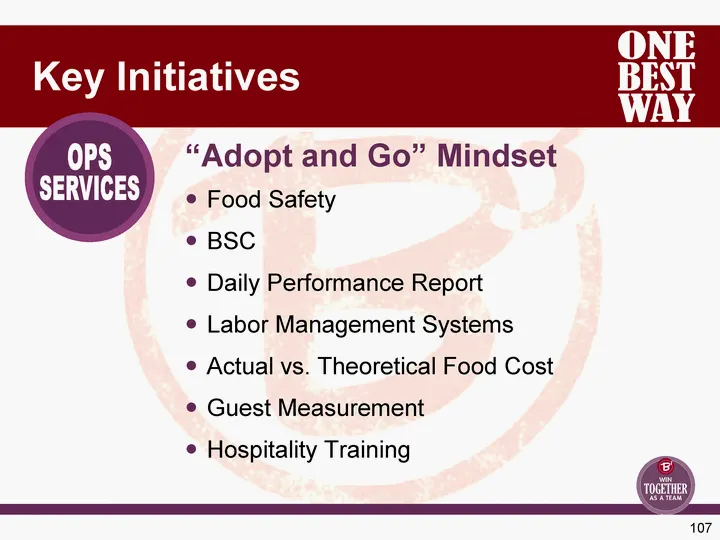
Slide 107: Operations Services Key Initiatives
107 Food Safety BSC Daily Performance Report Labor Management Systems Actual vs. Theoretical Food Cost Guest Measurement Hospitality Training Key Initiatives "Adopt and Go" Mindset OPSSERVICES
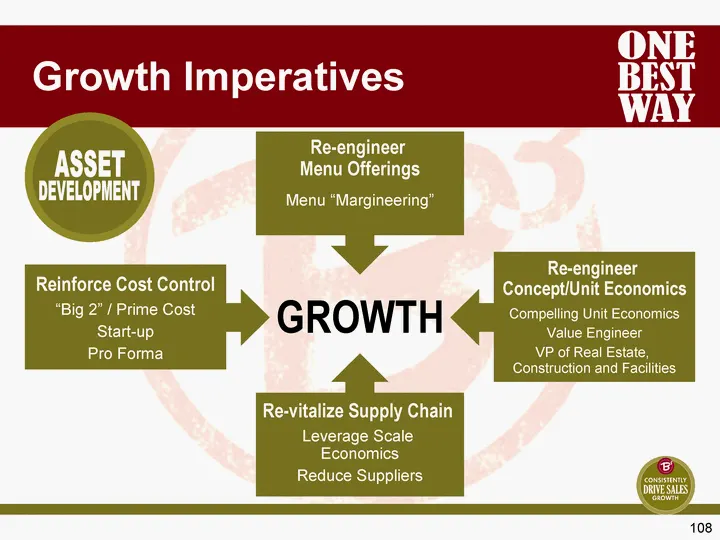
Slide 108: Growth Imperatives
108 Growth Imperatives GROWTH Re-engineer Menu Offerings Menu "Margineering" Reinforce Cost Control "Big 2" / Prime Cost Start-up Pro Forma Re-vitalize Supply Chain Leverage Scale Economics Reduce Suppliers Re-engineer Concept/Unit Economics Compelling Unit Economics Value Engineer VP of Real Estate
Slide 109: Asset Development Key Initiatives
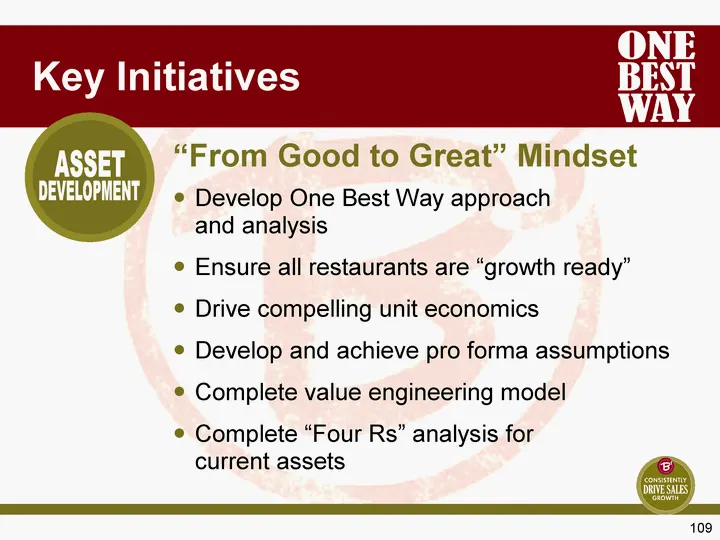
109 Develop One Best Way approach and analysis Ensure all restaurants are "growth ready" Drive compelling unit economics Develop and achieve pro forma assumptions Complete value engineering model Complete "Four Rs" analysis for current assets Key Initiatives "From Good to Great" Mindset ASSETDEVELOP
Slide 110: Restaurant Restructuring Strategy: Operations
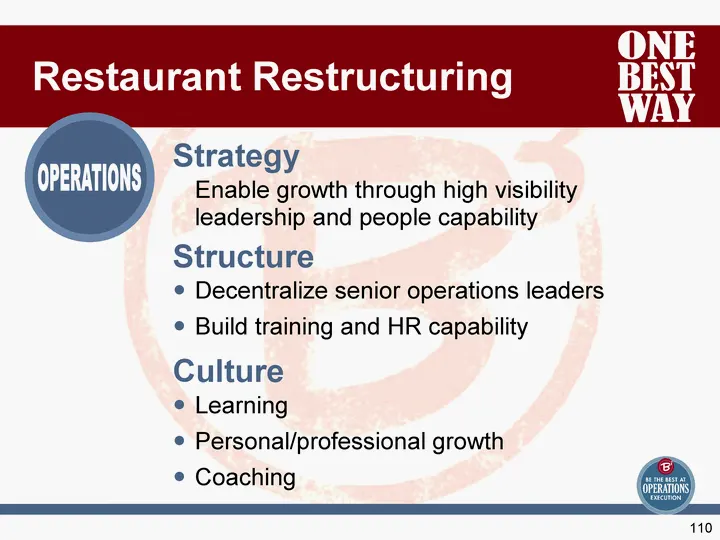
110 Enable growth through high visibility leadership and people capability Restaurant Restructuring Strategy OPERATIONS Decentralize senior operations leaders Build training and HR capability Structure Learning Personal/professional growth Coaching Culture
Slide 111: Ops Vision
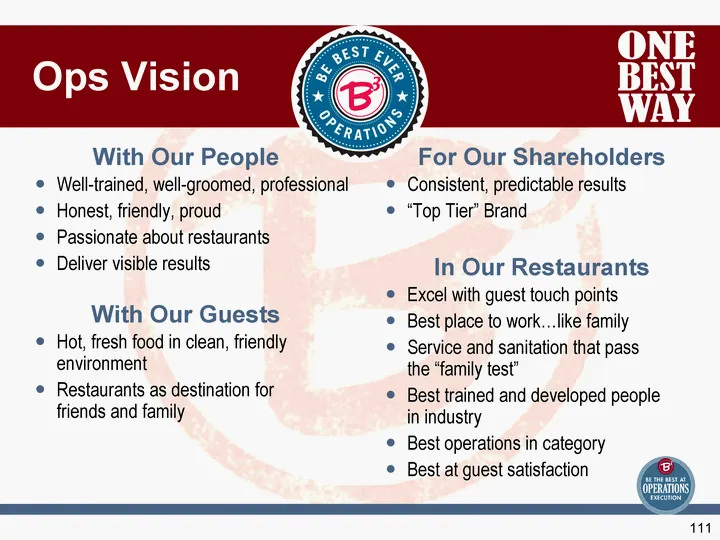
111 Ops Vision Well-trained, well-groomed, professional Honest, friendly, proud Passionate about restaurants Deliver visible results With Our People Hot, fresh food in clean, friendly environment Restaurants as destination for friends and family With Our Guests Consistent, predictable results "Top T
Slide 112: Ops Must Haves
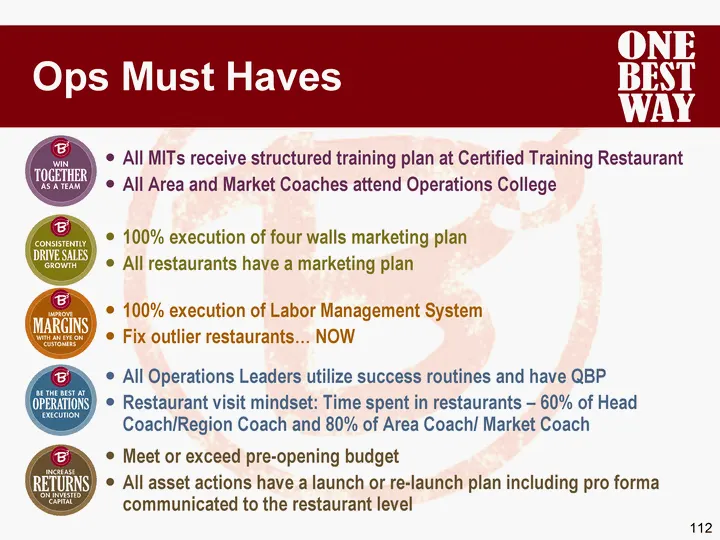
112 Ops Must Haves All MITs receive structured training plan at Certified Training Restaurant All Area and Market Coaches attend Operations College 100% execution of four walls marketing plan All restaurants have a marketing plan 100% execution of Labor Management System Fix outlier restaurants... N
Slide 113: Drive Operations Excellence
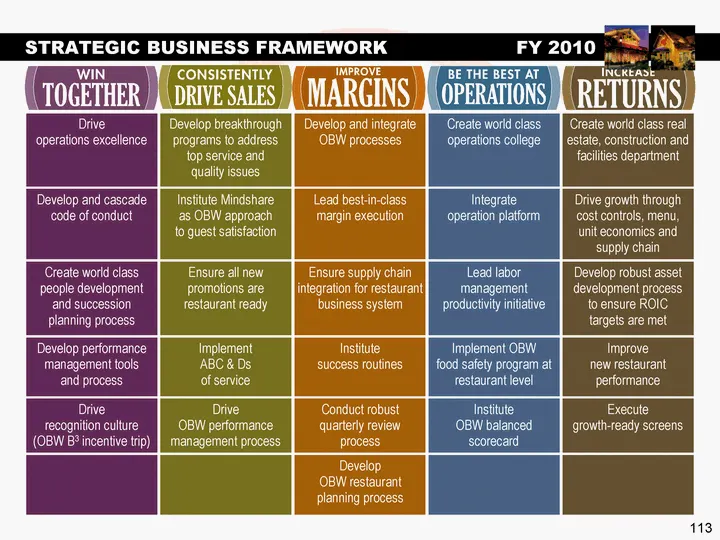
113 Drive operations excellence Develop breakthrough programs to address top service and quality issues Develop and integrate OBW processes Create world class operations college Create world class real estate, construction and facilities department Develop and cascade code of conduct Institute Minds
Slide 114: Drive Operations Excellence
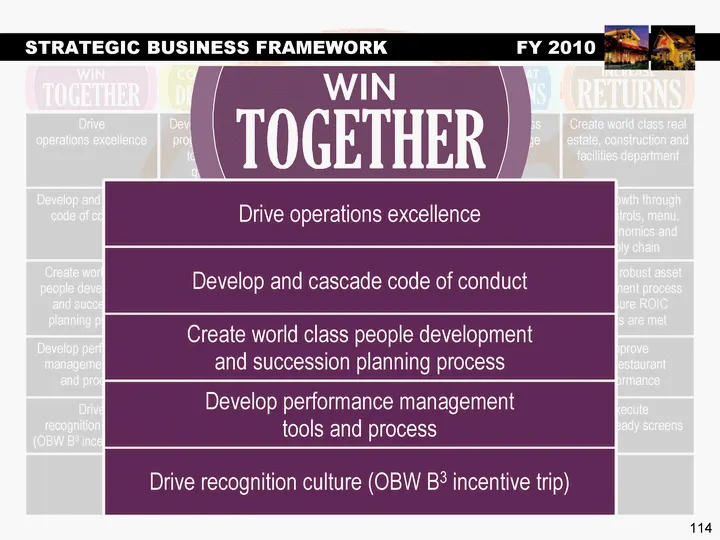
114 Drive operations excellence Develop breakthrough programs to address top service and quality issues Develop and integrate OBW processes Create world class operations college Create world class real estate, construction and facilities department Develop and cascade code of conduct Institute Minds
Slide 115: Drive Operations Excellence
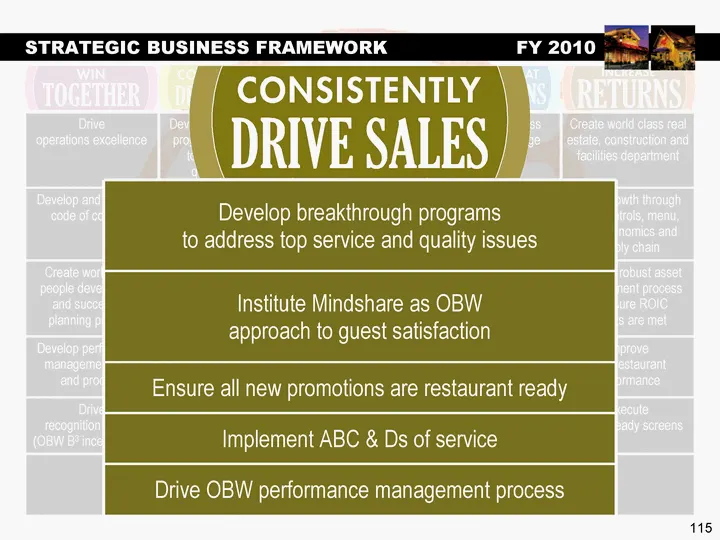
115 Drive operations excellence Develop breakthrough programs to address top service and quality issues Develop and integrate OBW processes Create world class operations college Create world class real estate, construction and facilities department Develop and cascade code of conduct Institute Minds
Slide 116: Drive Operations Excellence
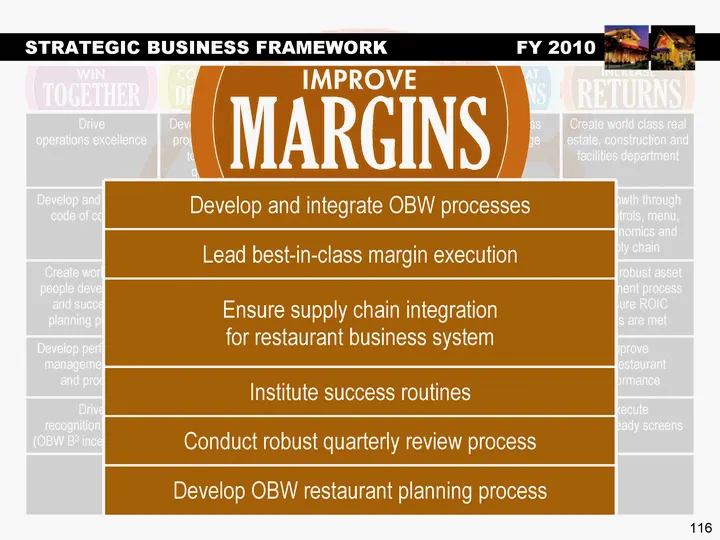
116 Drive operations excellence Develop breakthrough programs to address top service and quality issues Develop and integrate OBW processes Create world class operations college Create world class real estate, construction and facilities department Develop and cascade code of conduct Institute Minds
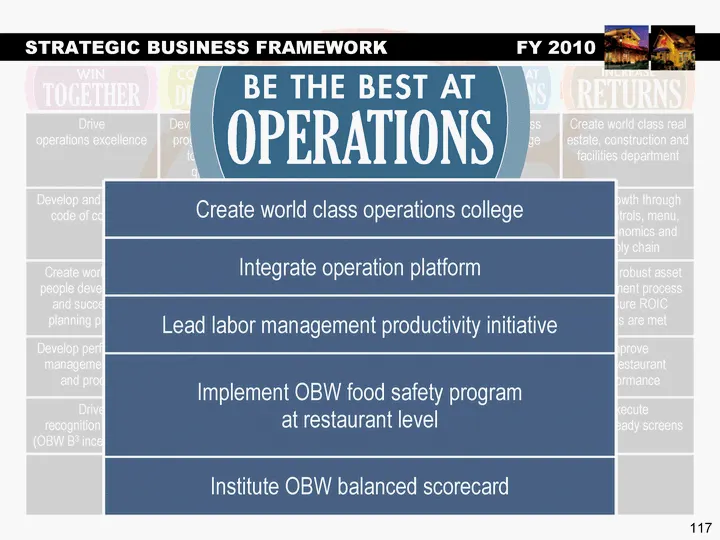
Slide 117: Drive Operations Excellence
117 Drive operations excellence Develop breakthrough programs to address top service and quality issues Develop and integrate OBW processes Create world class operations college Create world class real estate, construction and facilities department Develop and cascade code of conduct Institute Minds
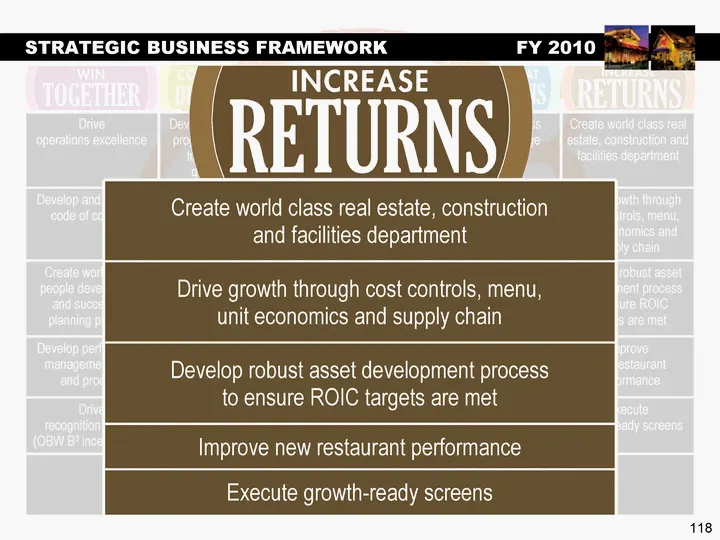
Slide 118: Drive Operations Excellence
118 Drive operations excellence Develop breakthrough programs to address top service and quality issues Develop and integrate OBW processes Create world class operations college Create world class real estate, construction and facilities department Develop and cascade code of conduct Institute Minds
Slide 119: Thank you!
119 Thank you!
Slide 120: Mike Townsley, President, Food Products
120 Mike Townsley President, Food Products Food Products
Slide 121: FY '09 Review Food Products
121 FY '09 Review Food Products
Slide 122: Key Metrics and Market Share
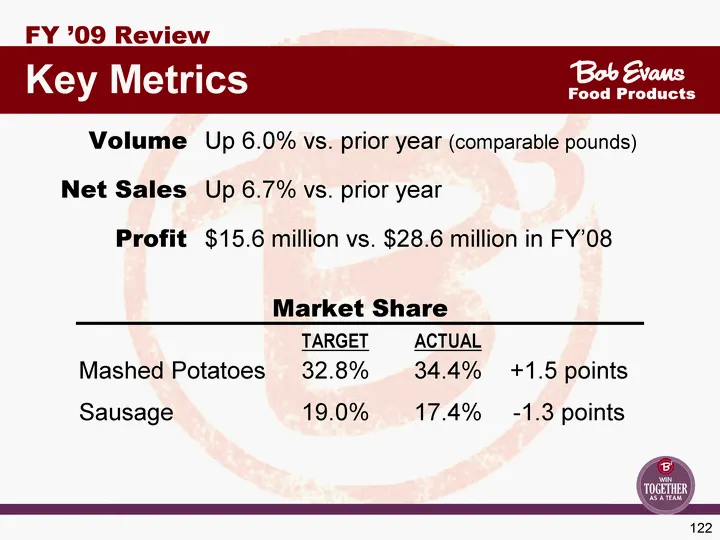
122 Key Metrics FY '09 Review Volume Up 6.0% vs. prior year (comparable pounds) Net Sales Up 6.7% vs. prior year Profit $15.6 million vs. $28.6 million in FY'08 Food Products Market Share TARGET ACTUAL Mashed Potatoes 32.8% 34.4% +1.5 points Sausage 19.0% 17.4% -1.3 points
Slide 123: Key Accomplishments
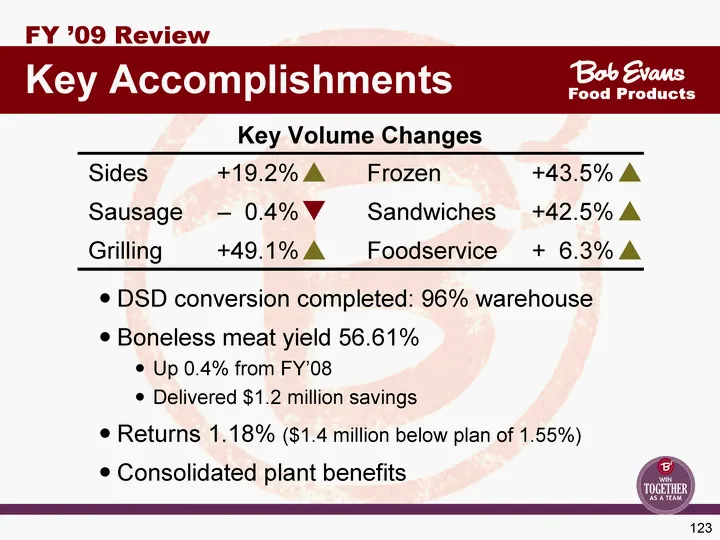
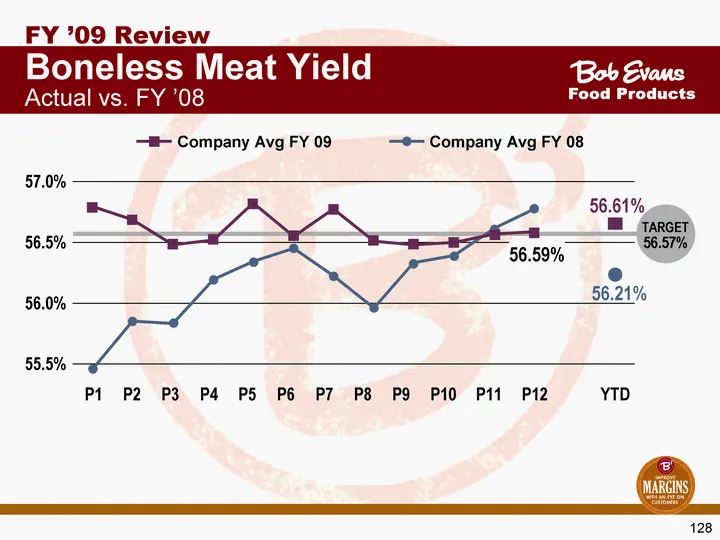
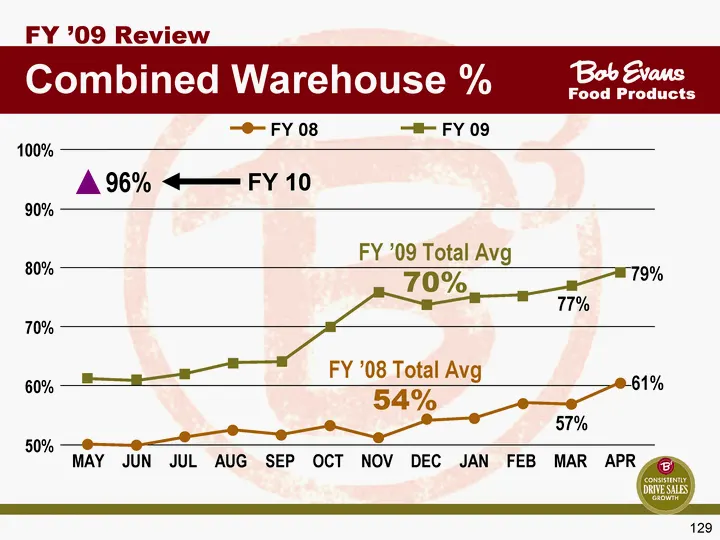
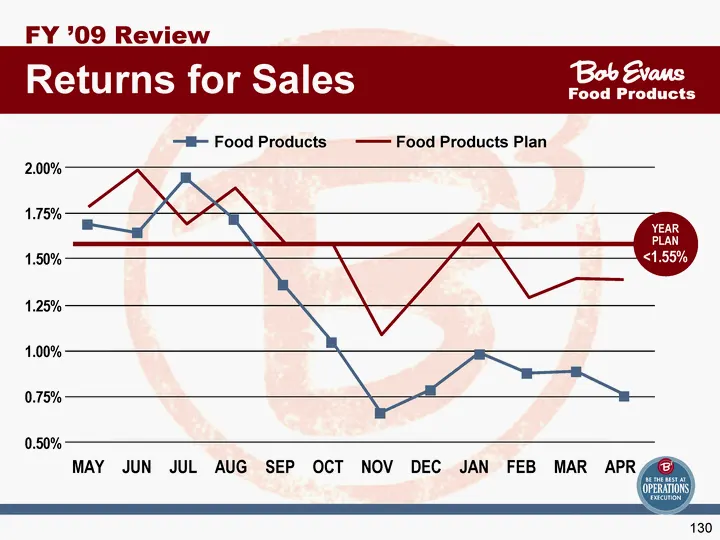
123 Key Accomplishments FY '09 Review Food Products DSD conversion completed: 96% warehouse Boneless meat yield 56.61% Up 0.4% from FY'08 Delivered $1.2 million savings Returns 1.18% ($1.4 million below plan of 1.55%) Consolidated plant benefits Key Volume Changes Sides +19.2% Frozen +43.5% Sausage
Slide 124: Business Challenges
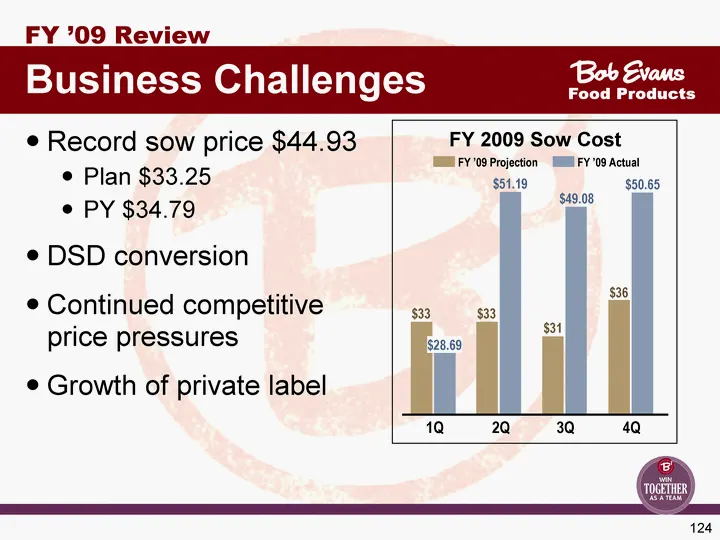
124 Business Challenges FY '09 Review Food Products Record sow price $44.93 Plan $33.25 PY $34.79 DSD conversion Continued competitive price pressures Growth of private label FY '09 Actual 1Q $33 $28.69 2Q $51.19 $33 3Q $49.08 $31 4Q $50.65 $36 FY 2009 Sow Cost
Slide 125: Distribution Map
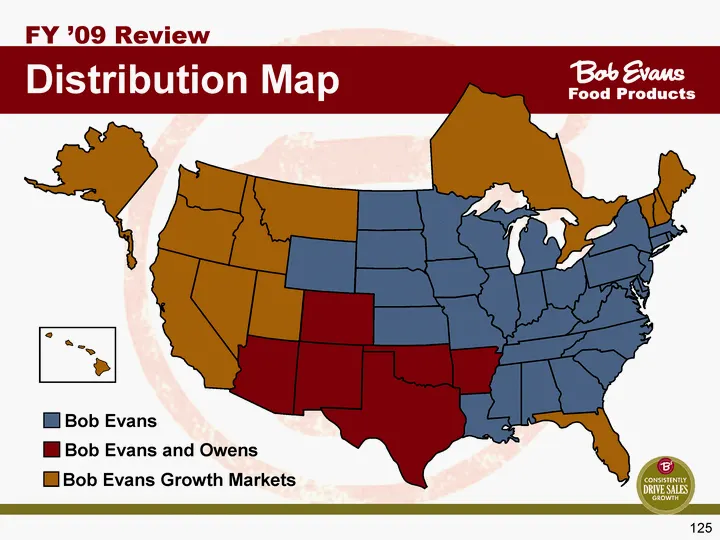
125 Distribution Map FY '09 Review Food Products Bob Evans Bob Evans and Owens Bob Evans Growth Markets
Slide 126: Business Profile
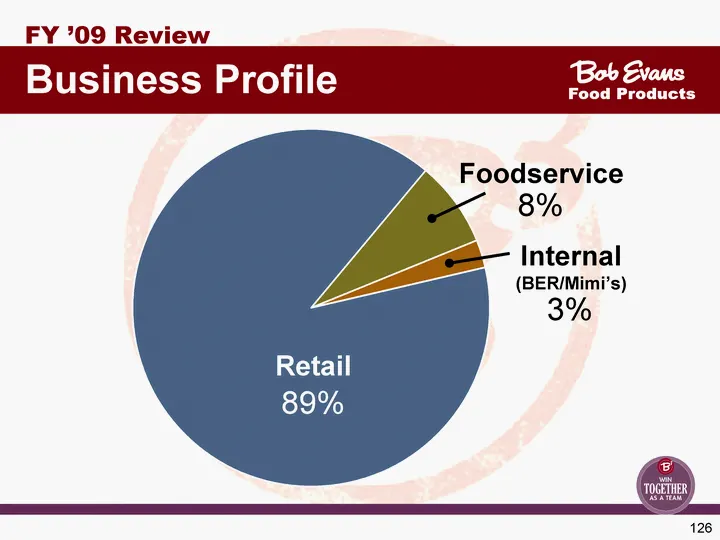
126 Foodservice Internal Retail 4th Qtr East 0.076 0.025 0.879582524271845 20.4 West 30.6 38.6 34.6 31.6 North 45.9 46.9 45 43.9 Retail 89% Foodservice 8% Internal (BER/Mimi's) 3% Business Profile FY '09 Review Food Products
Slide 127: FY 2009 New Authorizations
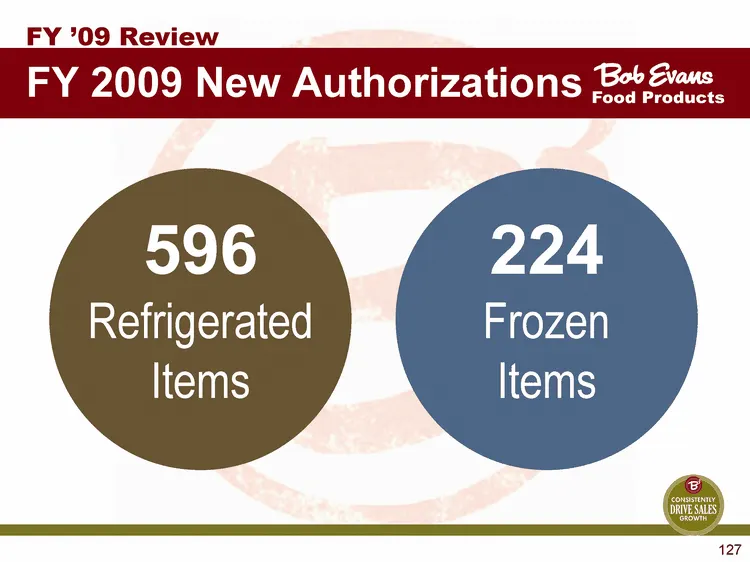
FY 2009 New Authorizations FY '09 Review Food Products 596 Refrigerated Items 224 Frozen Items
Slide 128: Boneless Meat Yield
128 FY '09 Review Food Products Boneless Meat Yield Actual vs. FY '08 P1 P2 P3 P4 P5 P6 P7 P8 P9 P10 P11 P12 YTD 56.21% 56.61% 55.5% 56.0% 56.5% 57.0% TARGET 56.57% 56.59% Company Avg FY 09
Slide 129: Combined Warehouse Percentage
129 MAY JUN JUL AUG SEP OCT NOV DEC JAN FEB MAR APR 61% 57% FY '08 Total Avg 54% FY '09 Total Avg 70% Combined Warehouse % FY '09 Review Food Products 96% 79% 77% FY 08 FY 09 FY 10
Slide 130: Returns for Sales
130 Returns for Sales FY '09 Review Food Products Food Products 0.50% 1.00% 1.50% 2.00% MAY JUN JUL AUG SEP OCT NOV DEC JAN FEB MAR APR 1.75% 1.25% 0.75% YEAR PLAN <1.55%
Slide 131: FY '10 Strategic Plan Food Products
131 FY '10 Strategic Plan Food Products
Slide 132: FY 2010 Innovations and Strategic Pillars
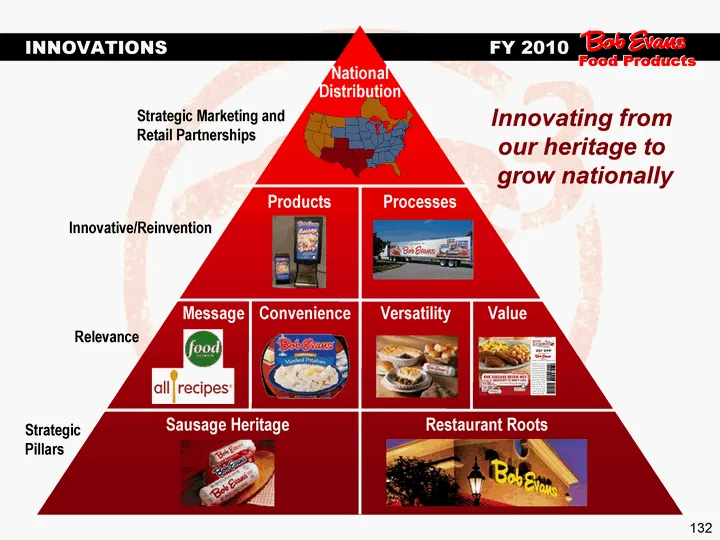
132 INNOVATIONS FY 2010 Message Convenience Versatility Value Strategic Marketing and Retail Partnerships Innovative/Reinvention Relevance Strategic Pillars Innovating from our heritage to grow nationally Products Processes Sausage Heritage Restaurant Roots National Distribution Food Products
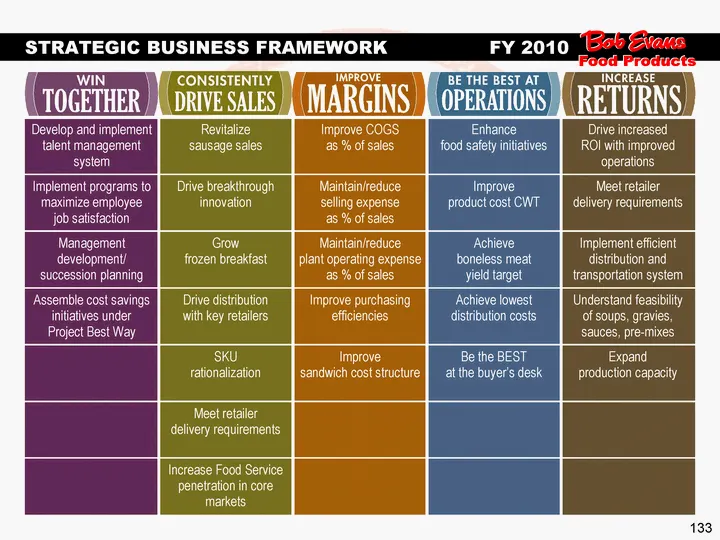
Slide 133: Food Products Strategic Initiatives
133 Develop and implement talent management system Revitalize sausage sales Improve COGS as % of sales Enhance food safety initiatives Drive increased ROI with improved operations Implement programs to maximize employee job satisfaction Drive breakthrough innovation Maintain/reduce selling expense a
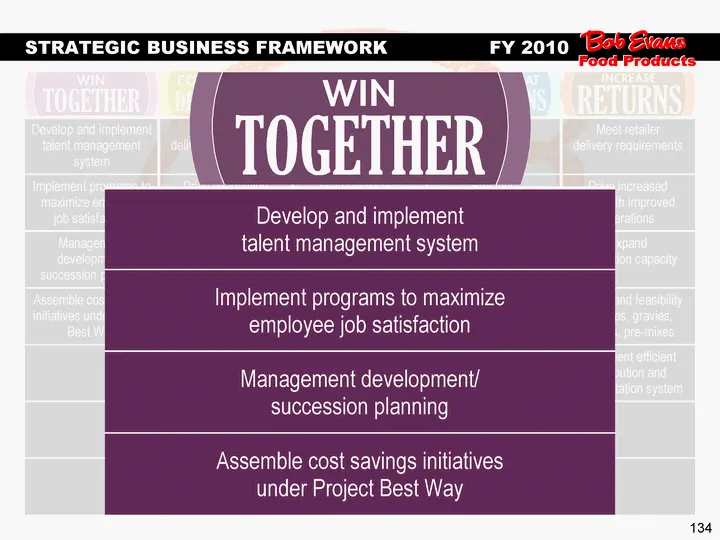
Slide 134: Food Products Strategic Initiatives
134 Develop and implement talent management system Meet retailer delivery requirements Improve COGS as % of sales Improve product CWT Meet retailer delivery requirements Implement programs to maximize employee job satisfaction Drive distribution with key retailers Maintain/reduce selling expense as
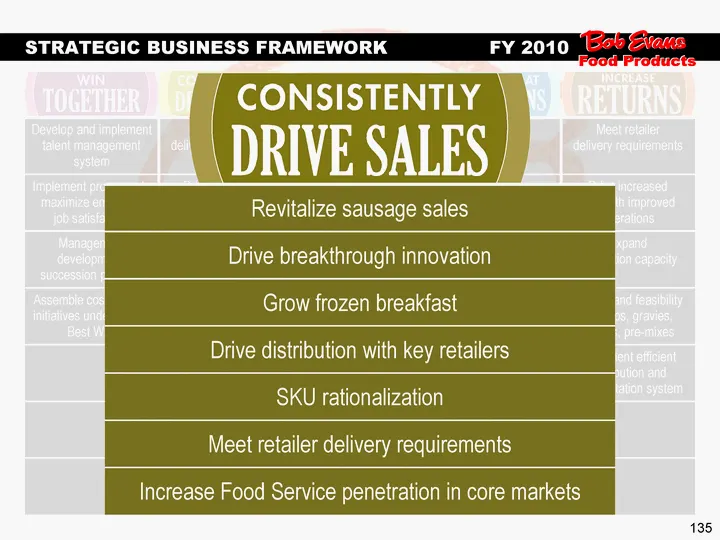
Slide 135: Food Products Strategic Initiatives
135 Develop and implement talent management system Meet retailer delivery requirements Improve COGS as % of sales Improve product CWT Meet retailer delivery requirements Implement programs to maximize employee job satisfaction Drive distribution with key retailers Maintain/reduce selling expense as
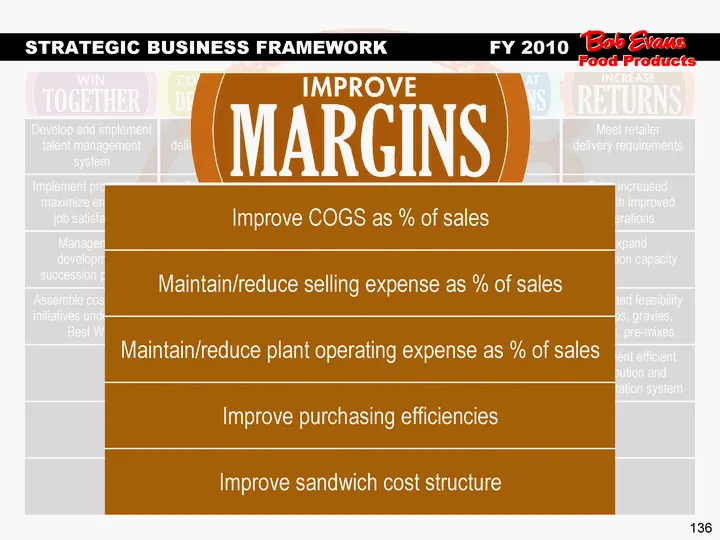
Slide 136: Food Products Strategic Initiatives
136 Develop and implement talent management system Meet retailer delivery requirements Improve COGS as % of sales Improve product CWT Meet retailer delivery requirements Implement programs to maximize employee job satisfaction Drive distribution with key retailers Maintain/reduce selling expense as
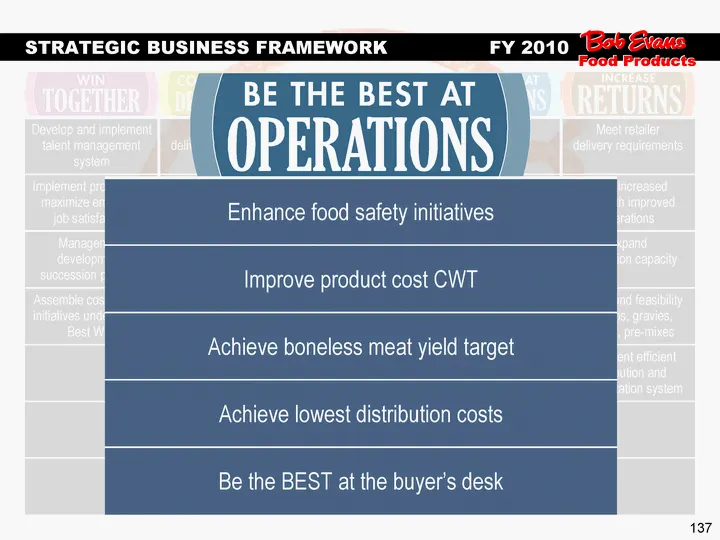
Slide 137: Food Products Strategic Initiatives
137 Develop and implement talent management system Meet retailer delivery requirements Improve COGS as % of sales Improve product CWT Meet retailer delivery requirements Implement programs to maximize employee job satisfaction Drive distribution with key retailers Maintain/reduce selling expense as
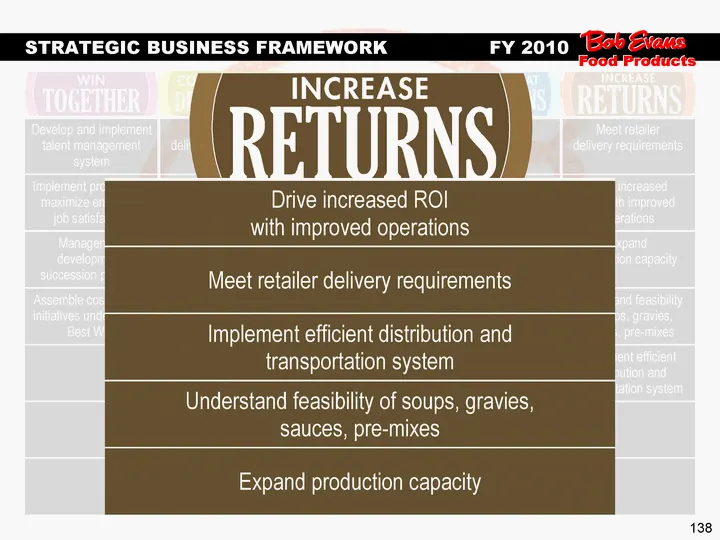
Slide 138: Food Products Strategic Initiatives
138 Develop and implement talent management system Meet retailer delivery requirements Improve COGS as % of sales Improve product CWT Meet retailer delivery requirements Implement programs to maximize employee job satisfaction Drive distribution with key retailers Maintain/reduce selling expense as
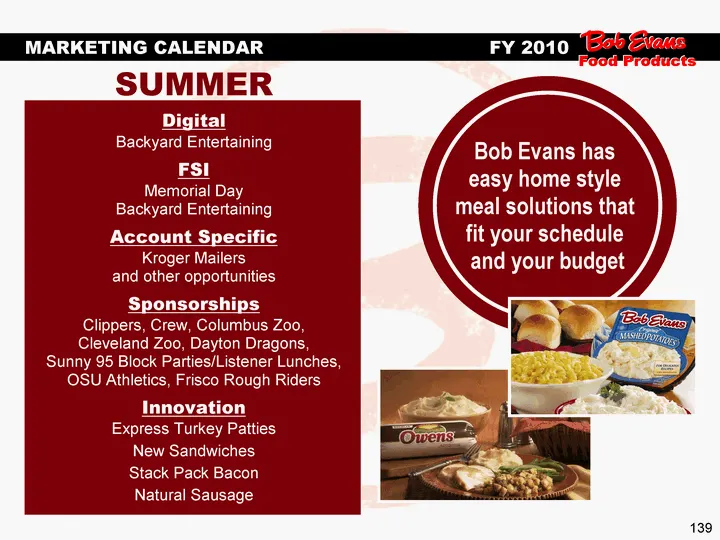
Slide 139: Summer Marketing Calendar FY 2010
139 Digital Backyard Entertaining FSI Memorial Day Backyard Entertaining Account Specific Kroger Mailers and other opportunities Sponsorships Clippers, Crew, Columbus Zoo, Cleveland Zoo, Dayton Dragons, Sunny 95 Block Parties/Listener Lunches, OSU Athletics, Frisco Rough Riders Innovation Express Tu
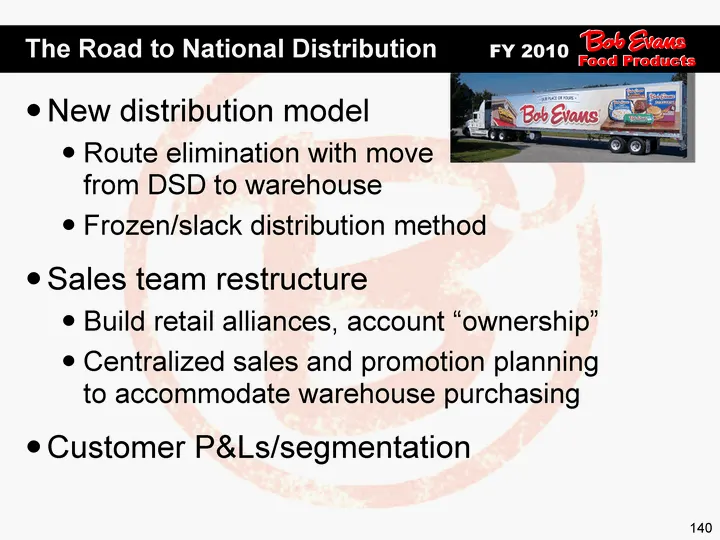
Slide 140: The Road to National Distribution
140 New distribution model Route elimination with move from DSD to warehouse Frozen/slack distribution method Sales team restructure Build retail alliances, account "ownership" Centralized sales and promotion planning to accommodate warehouse purchasing Customer P&Ls/segmentation The Road to Nationa
Slide 141: Imperatives FY 2010 Food Products
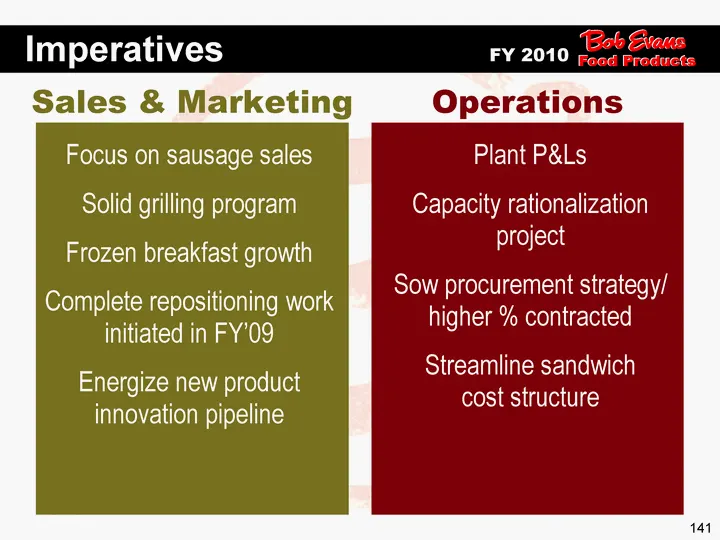
141 Focus on sausage sales Solid grilling program Frozen breakfast growth Complete repositioning work initiated in FY'09 Energize new product innovation pipeline Plant P&Ls Capacity rationalization project Sow procurement strategy/ higher % contracted Streamline sandwich cost structure Sales & Marke
Slide 142: Don Radkoski, Chief Financial Officer
142 Don Radkoski Chief Financial Officer
Slide 143: FY 2010 Outlook
FY 2010 Outlook Bob Evaus FARMS® Be We ORs able
Slide 144: Reported Results Will Include 53rd Week
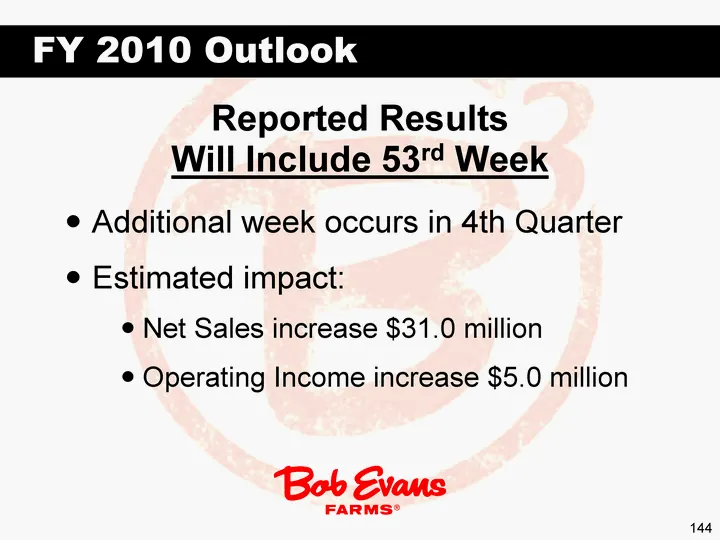
144 FY 2010 Outlook Reported Results Will Include 53rd Week Additional week occurs in 4th Quarter Estimated impact: Net Sales increase $31.0 million Operating Income increase $5.0 million
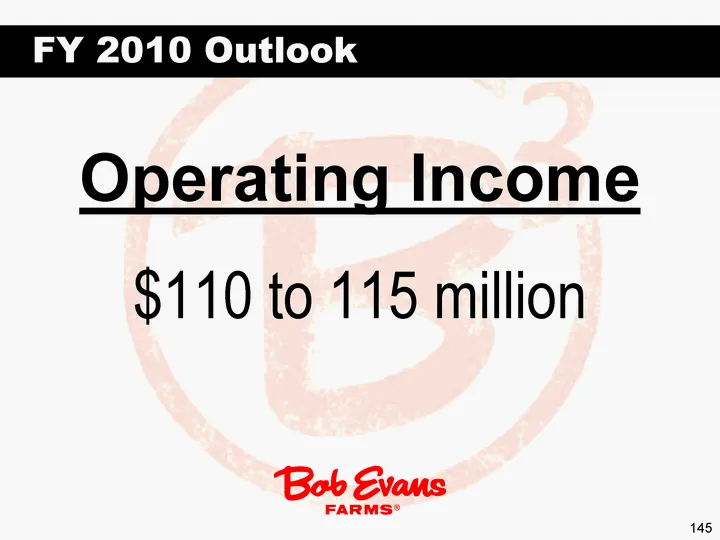
Slide 145: Operating Income Outlook
145 $110 to 115 million Operating Income FY 2010 Outlook
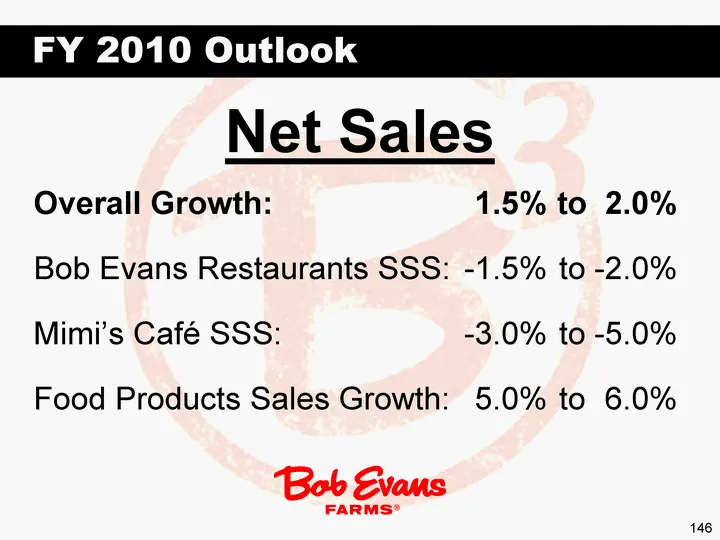
Slide 146: Net Sales Outlook
146 Net Sales FY 2010 Outlook Overall Growth: 1.5% to 2.0% Bob Evans Restaurants SSS: -1.5% to -2.0% Mimi's Cafe SSS: -3.0% to -5.0% Food Products Sales Growth: 5.0% to 6.0%
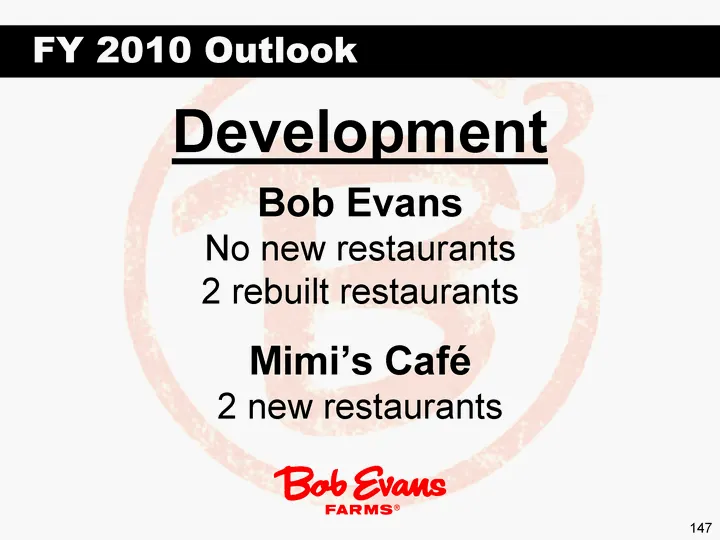
Slide 147: Development Outlook
147 FY 2010 Outlook Development Bob Evans No new restaurants 2 rebuilt restaurants Mimi's Cafe 2 new restaurants
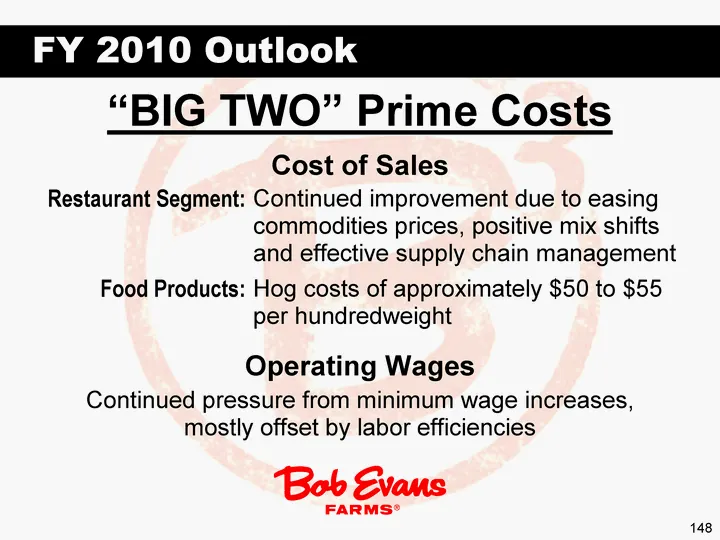
Slide 148: Prime Costs Outlook
148 "BIG TWO" Prime Costs Cost of Sales Hog costs of approximately $50 to $55 per hundredweight Food Products: Continued improvement due to easing commodities prices, positive mix shifts and effective supply chain management Restaurant Segment: Operating Wages Continued pressure from minimum wage in
Slide 149: Depreciation & Amortization
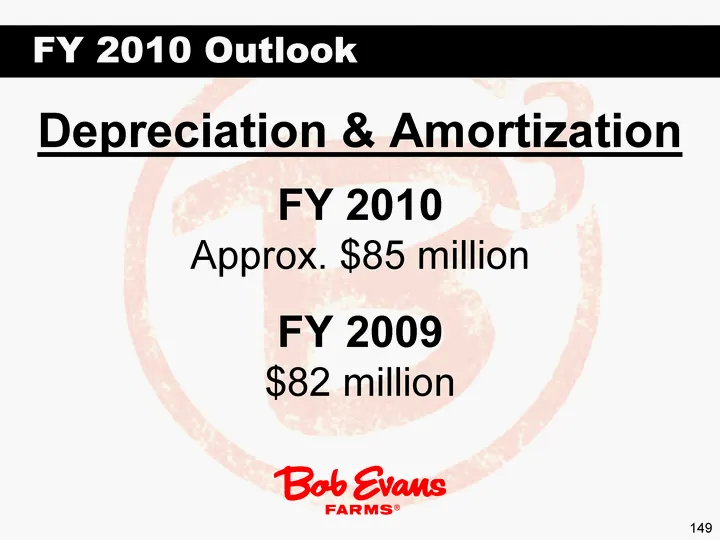
149 Depreciation & Amortization FY 2010 Outlook FY 2010 Approx. $85 million FY 2009 $82 million
Slide 150: Operating Margins
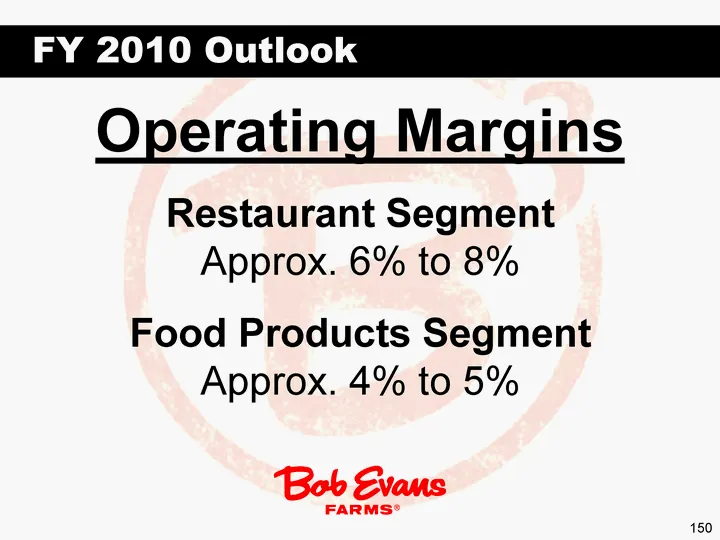
150 FY 2010 Outlook Operating Margins Restaurant Segment Approx. 6% to 8% Food Products Segment Approx. 4% to 5%
Slide 151: Net Interest Expense and Tax Rate
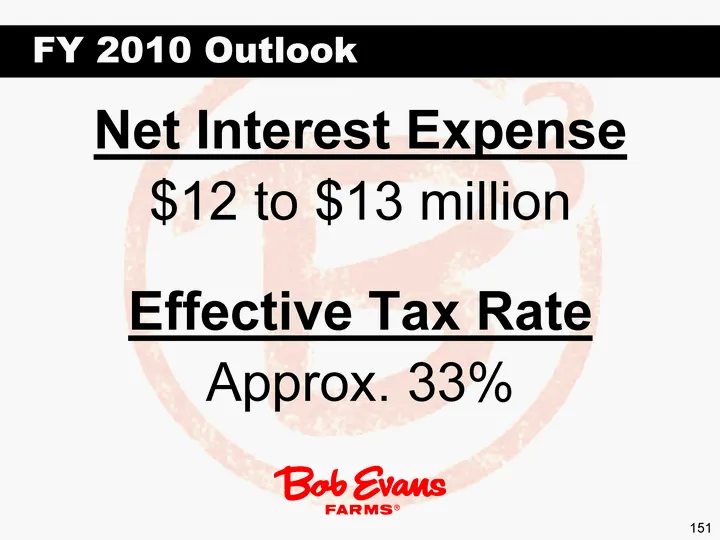
151 FY 2010 Outlook Net Interest Expense $12 to $13 million Effective Tax Rate Approx. 33%
Slide 152: Diluted Shares and Capital Expenditures
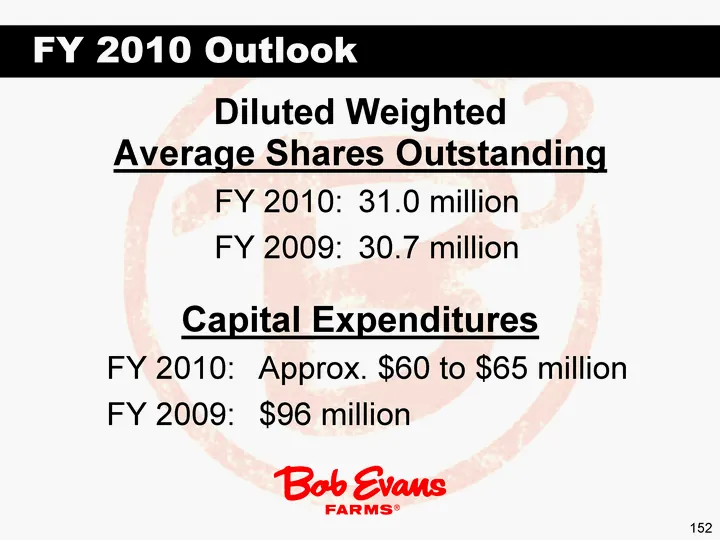
152 FY 2010 Outlook Diluted Weighted Average Shares Outstanding FY 2010: 31.0 million FY 2009: 30.7 million Capital Expenditures FY 2010: Approx. $60 to $65 million FY 2009: $96 million
Slide 153: Questions & Answers
Questions & Answers Bob Evaus FARMS® i a
Slide 154: Thank you!
154 Thank you!
Source: SEC EDGAR · 8-K filed Jun 3, 2009
More decks from Bob Evans Farms Inc
 Merger or Acquisition (September 2017)18 slides · Sep 28, 2017
 Merger or Acquisition (September 2017)12 slides · Sep 19, 2017
 Merger or Acquisition (September 2017)17 slides · Sep 19, 2017
 Merger or Acquisition (September 2017)10 slides · Sep 19, 2017
 Investor Presentation (September 2017)32 slides · Sep 14, 2017
 Investor Presentation (June 2017)30 slides · Jun 15, 2017