Altra Industrial Motion — Q4 2014 Earnings Presentation
13 slides from Altra Industrial Motion's earnings presentation, Feb 20, 2015

Slide 1: Fourth-Quarter 2014 Results
Fourth-Quarter 2014 Results February 18, 2015 5:00 PM ET Dial In Number 877-407-8293 Domestic 201-689-8349 International Webcast at www.altramotion.com Replay Number Through March 4, 2015 877-660-6853 Domestic 201-612-7415 International Conference ID: # 13601322 Webcast Replay at www.altramotion.com

Slide 2: Safe Harbor Statement
Safe Harbor Statement Cautionary Statement Regarding Forward Looking Statements • All statements, other than statements of historical fact included in this release are forward-looking statements, as that term is defined in the Private Securities Litigation Reform Act of 1995. These statements includ
Slide 3: Fourth-Quarter 2014 Highlights
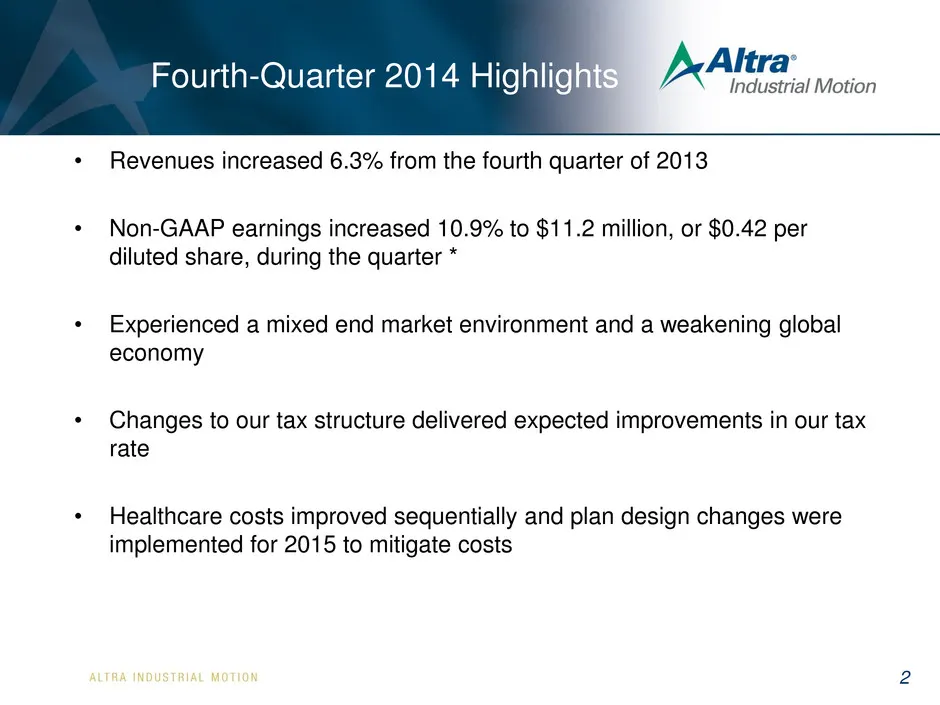
Fourth-Quarter 2014 Highlights • Revenues increased 6.3% from the fourth quarter of 2013 • Non-GAAP earnings increased 10.9% to $11.2 million, or $0.42 per diluted share, during the quarter * • Experienced a mixed end market environment and a weakening global economy • Changes to our tax structure d
Slide 4: End Market Review
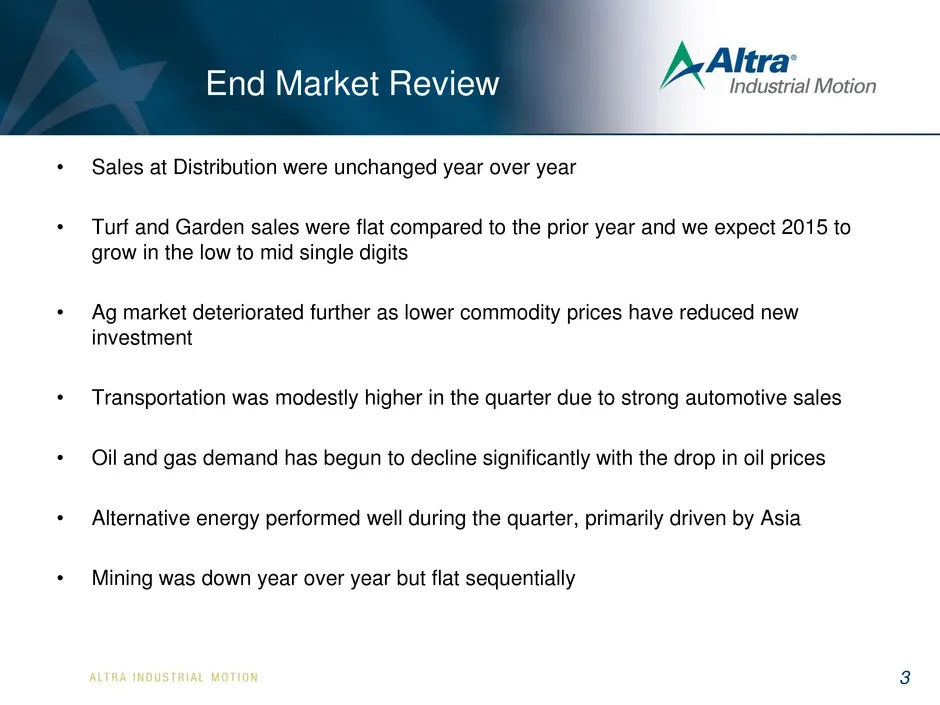
End Market Review • Sales at Distribution were unchanged year over year • Turf and Garden sales were flat compared to the prior year and we expect 2015 to grow in the low to mid single digits • Ag market deteriorated further as lower commodity prices have reduced new investment • Transportation was
Slide 5: Financial Highlights
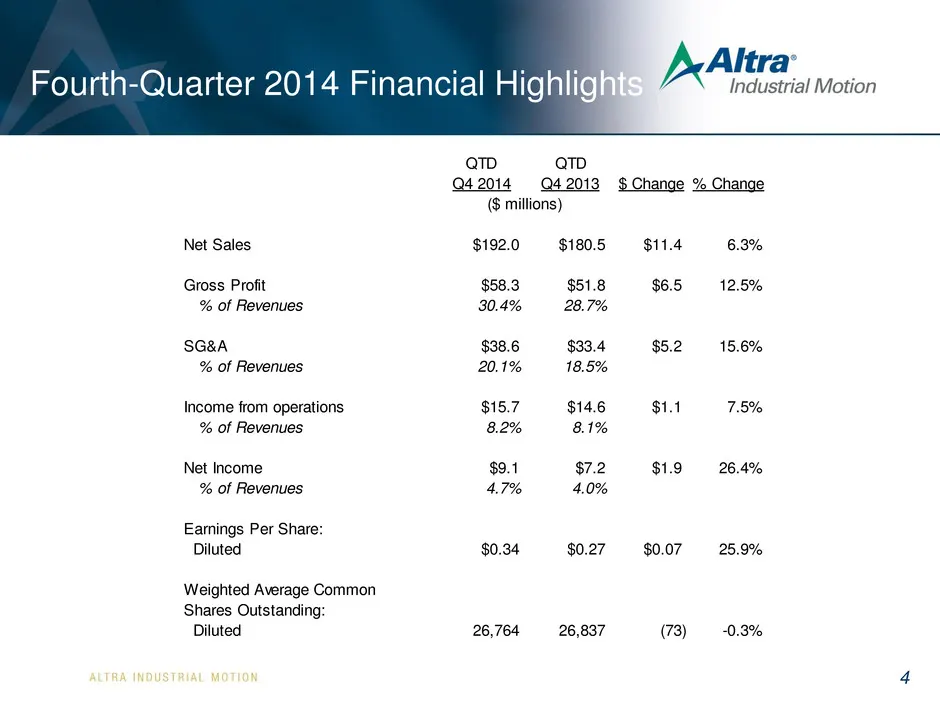
Fourth-Quarter 2014 Financial Highlights QTD QTD Q4 2014 Q4 2013 $ Change % Change Net Sales $192.0 $180.5 $11.4 6.3% Gross Profit $58.3 $51.8 $6.5 12.5% % of Revenues 30.4% 28.7% SG&A $38.6 $33.4 $5.2 15.6% % of Revenues 20.1% 18.5% Income from operations $15.7 $14.6 $1.1 7.5% % of Revenues 8.2% 8.
Slide 6: Selected Segment Data
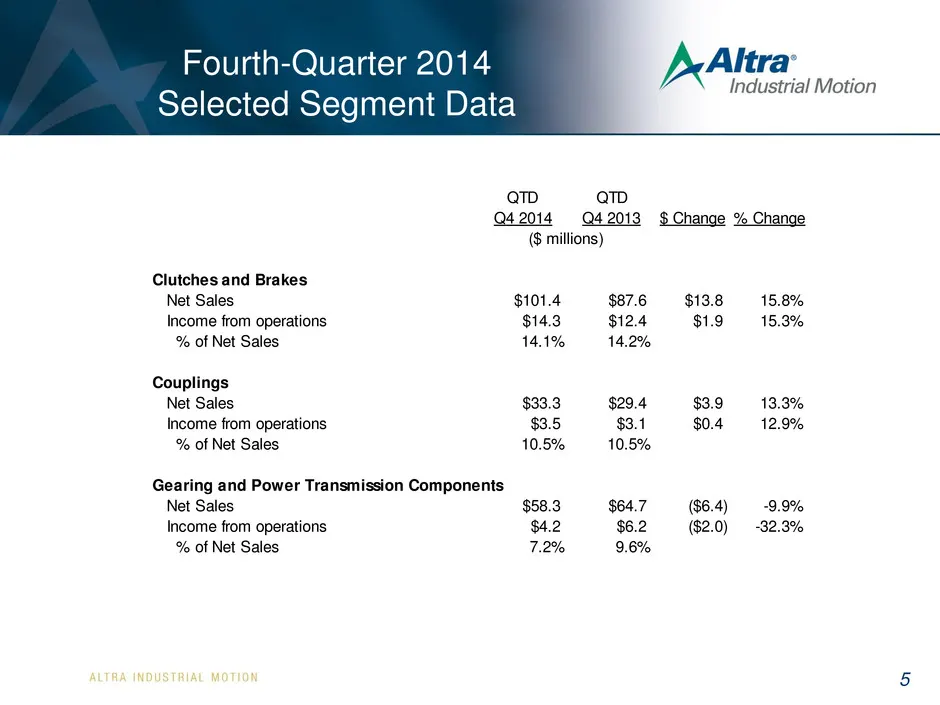
Fourth-Quarter 2014 Selected Segment Data QTD QTD Q4 2014 Q4 2013 $ Change % Change Clutches and Brakes Net Sales $101.4 $87.6 $13.8 15.8% Income from operations $14.3 $12.4 $1.9 15.3% % of Net Sales 14.1% 14.2% Couplings Net Sales $33.3 $29.4 $3.9 13.3% Income from operations $3.5 $3.1 $0.4 12.9% %
Slide 7: Non-GAAP Measures
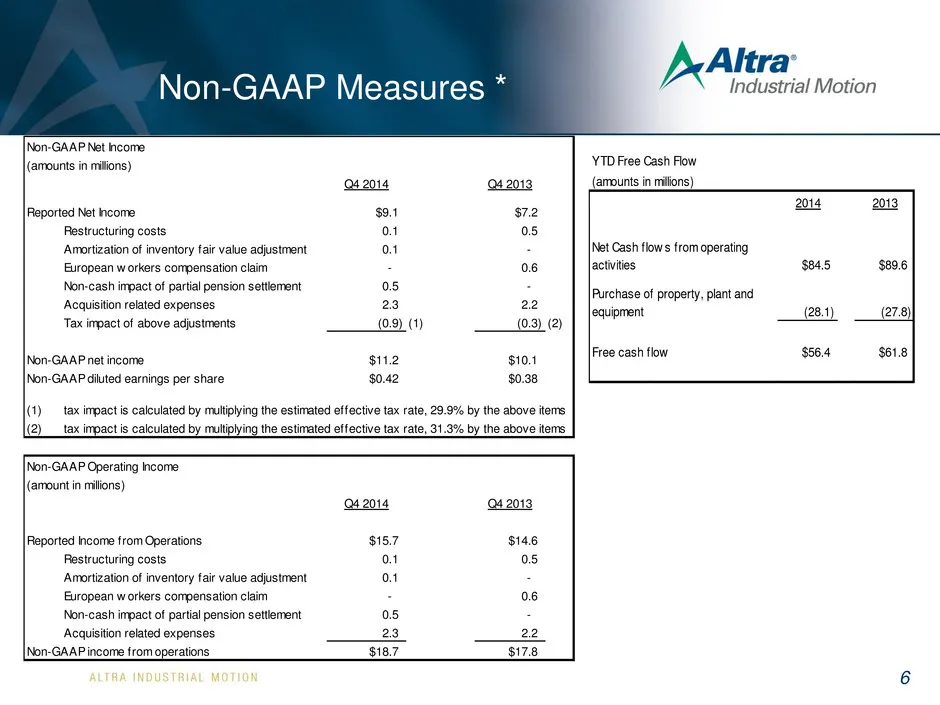
Non-GAAP Measures * Non-GAAP Net Income (amounts in millions) Q4 2014 Q4 2013 Reported Net Income $9.1 $7.2 Restructuring costs 0.1 0.5 Amortization of inventory fair value adjustment 0.1 - European w orkers compensation claim - 0.6 Non-cash impact of partial pension settlement 0.5 - Acquisition rel
Slide 8: Balance Sheet Highlights
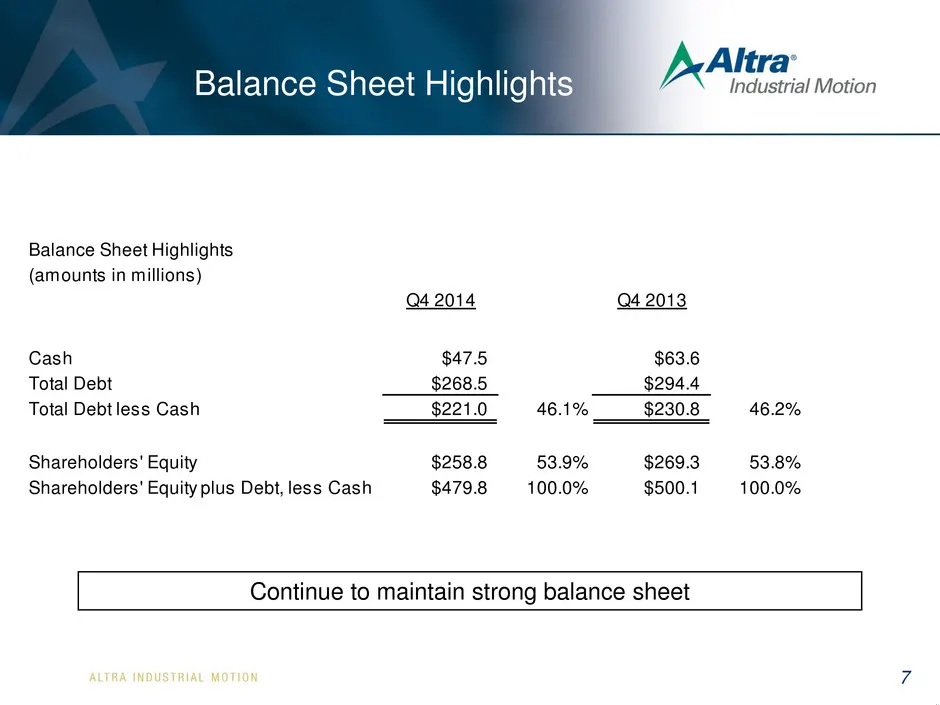
Balance Sheet Highlights Balance Sheet Highlights (amounts in millions) Q4 2014 Q4 2013 Cash $47.5 $63.6 Total Debt $268.5 $294.4 Total Debt less Cash $221.0 46.1% $230.8 46.2% Shareholders' Equity $258.8 53.9% $269.3 53.8% Shareholders' Equity plus Debt, less Cash $479.8 100.0% $500.1 100.0% 7 Cont
Slide 9: Operating Working Capital
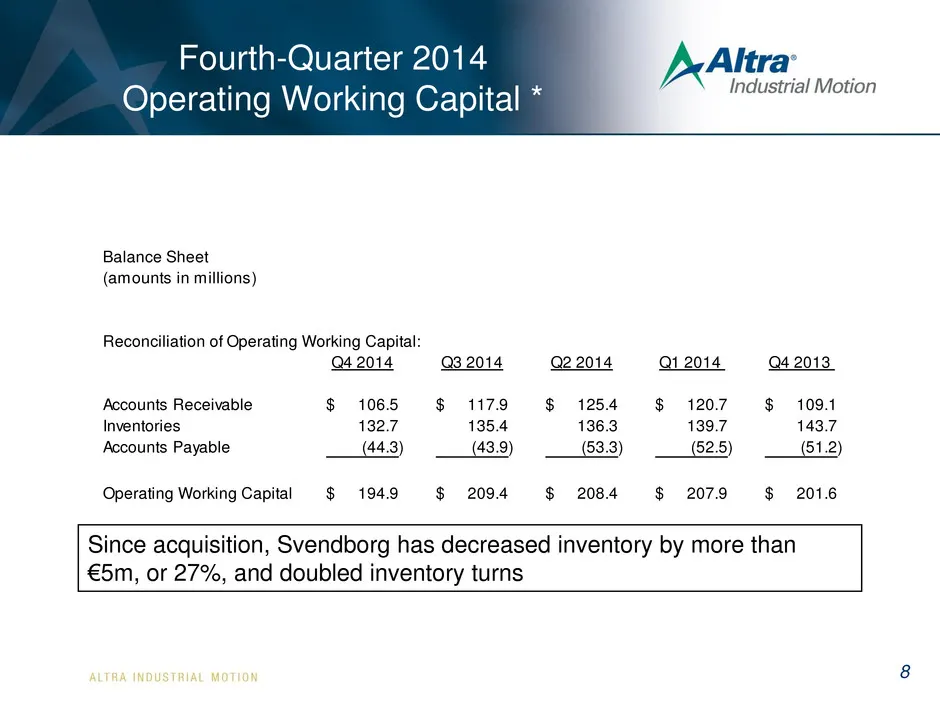
Fourth-Quarter 2014 Operating Working Capital * Balance Sheet (amounts in millions) Reconciliation of Operating Working Capital: Q4 2014 Q3 2014 Q2 2014 Q1 2014 Q4 2013 Accounts Receivable 106.5$ 117.9$ 125.4$ 120.7$ 109.1$ Inventories 132.7 135.4 136.3 139.7 143.7 Accounts Payable (44.3) (43.9) (53
Slide 10: 2015 Outlook
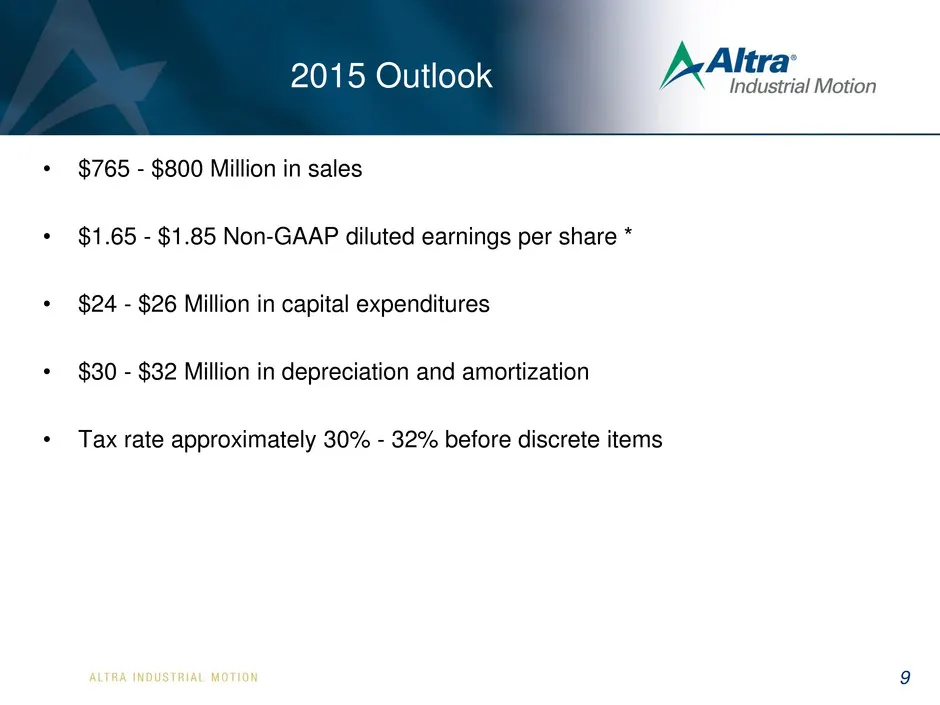
2015 Outlook • $765 - $800 Million in sales • $1.65 - $1.85 Non-GAAP diluted earnings per share * • $24 - $26 Million in capital expenditures • $30 - $32 Million in depreciation and amortization • Tax rate approximately 30% - 32% before discrete items 9
Slide 11: Guidance Assumptions
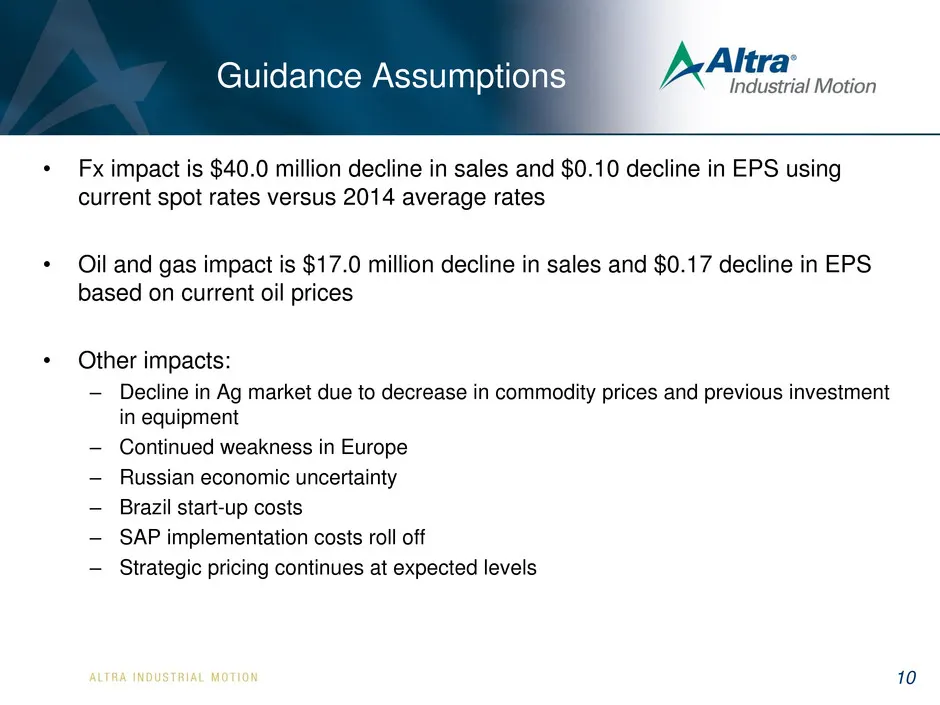
Guidance Assumptions • Fx impact is $40.0 million decline in sales and $0.10 decline in EPS using current spot rates versus 2014 average rates • Oil and gas impact is $17.0 million decline in sales and $0.17 decline in EPS based on current oil prices • Other impacts: – Decline in Ag market due to de
Slide 12: Summary
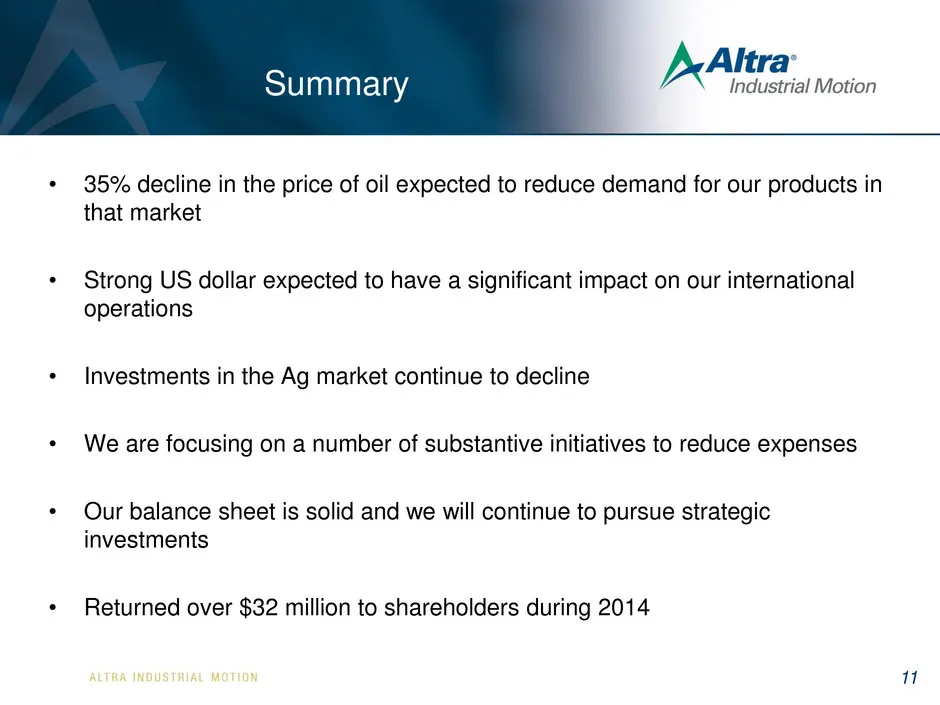
Summary • 35% decline in the price of oil expected to reduce demand for our products in that market • Strong US dollar expected to have a significant impact on our international operations • Investments in the Ag market continue to decline • We are focusing on a number of substantive initiatives to
Slide 13: Discussion of Non-GAAP Measures
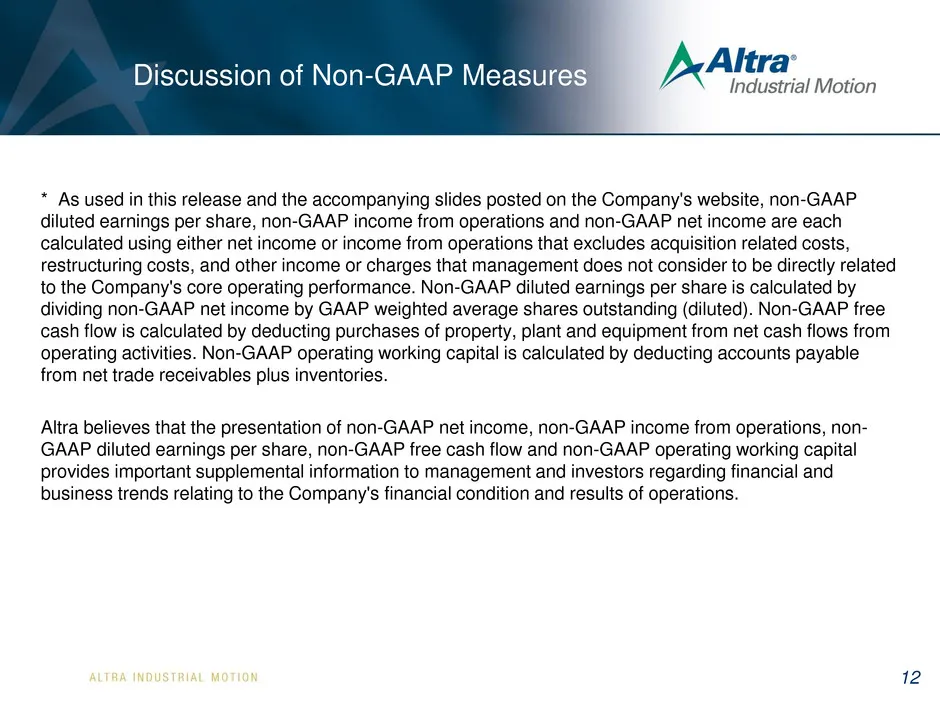
Discussion of Non-GAAP Measures * As used in this release and the accompanying slides posted on the Company's website, non-GAAP diluted earnings per share, non-GAAP income from operations and non-GAAP net income are each calculated using either net income or income from operations that excludes acqu
Source: SEC EDGAR · 8-K/A filed Feb 20, 2015
More decks from Altra Industrial Motion Corp
 Q2 2022 Earnings Presentation25 slides · Jul 28, 2022
 Q1 2022 Earnings Presentation25 slides · Apr 28, 2022
 Investor Day (March 2022)135 slides · Mar 11, 2022
 Q4 2021 Earnings Presentation17 slides · Feb 16, 2022
 Q3 2021 Earnings Presentation16 slides · Oct 22, 2021
 Q2 2021 Earnings Presentation16 slides · Jul 23, 2021