DEX ONE — R.H. Donnelley — Goldman Sachs Communacopia XVII Conference 2008
23 slides from DEX ONE's conference presentation, Sep 18, 2008
Slide 1: Goldman Sachs Communacopia XVII Conference
Goldman Sachs Communacopia XVII Conference September 18, 2008
Slide 2: Safe Harbor Statement
Safe Harbor Statement Certain statements contained in this presentation regarding RHD's future operating results or performance or business plans or prospects and any other statements not constituting historical fact are "forward-looking statements" subject to the safe harbor created by the Private
Slide 3: R.H. Donnelley - A Leader In Local Search
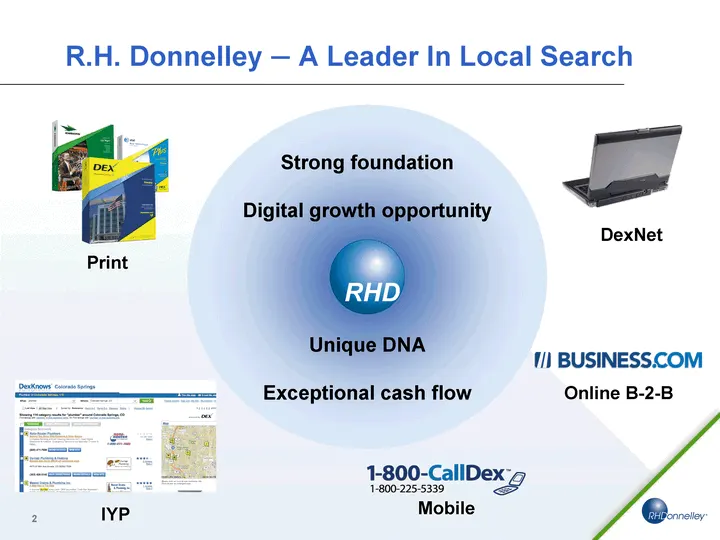
R.H. Donnelley - A Leader In Local Search Print IYP Mobile Online B-2-B DexNet Strong foundation Digital growth opportunity Unique DNA Exceptional cash flow
Slide 4: Advertising Solutions For Small Business
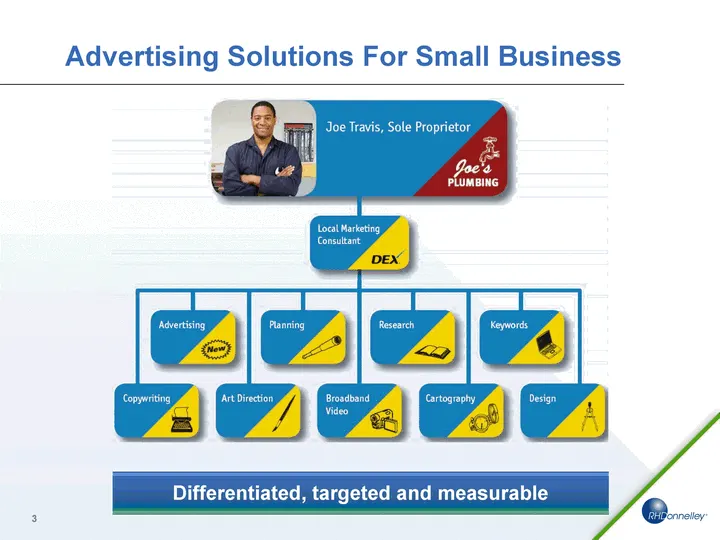
Advertising Solutions For Small Business Differentiated, targeted and measurable
Slide 5: Triple Play Extends Advertisers' Reach
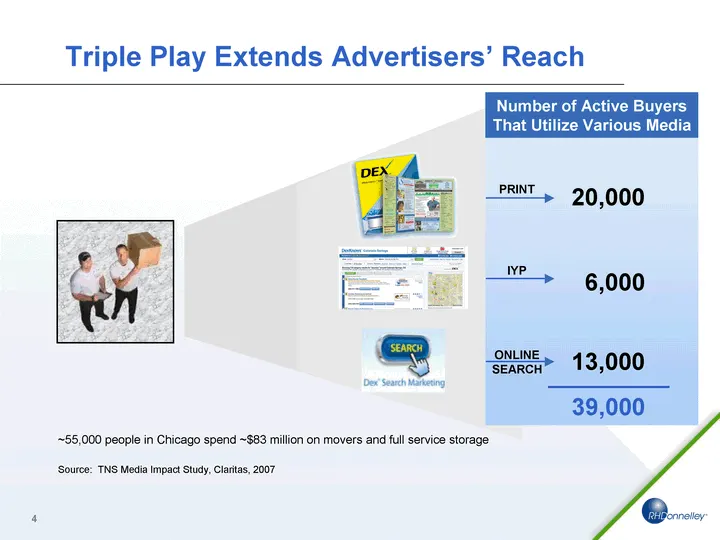
20,000 6,000 13,000 39,000 Number of Active Buyers That Utilize Various Media PRINT IYP ONLINE SEARCH Source: TNS Media Impact Study, Claritas, 2007 Triple Play Extends Advertisers' Reach ~55,000 people in Chicago spend ~$83 million on movers and full service storage
Slide 6: Triple Play Delivers Superior Value
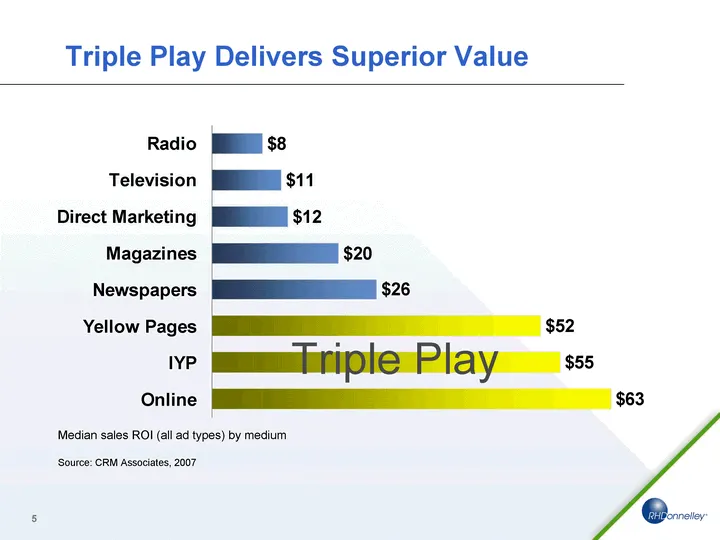
Triple Play Delivers Superior Value Annual Revenue Radio 8 Television 11 Direct Marketing 12 Magazines 20 Newspapers 26 Yellow Pages 52 IYP 55 Online 63 Median sales ROI (all ad types) by medium Source: CRM Associates, 2007 Triple Play
Slide 7: Strong Conversion To Customers
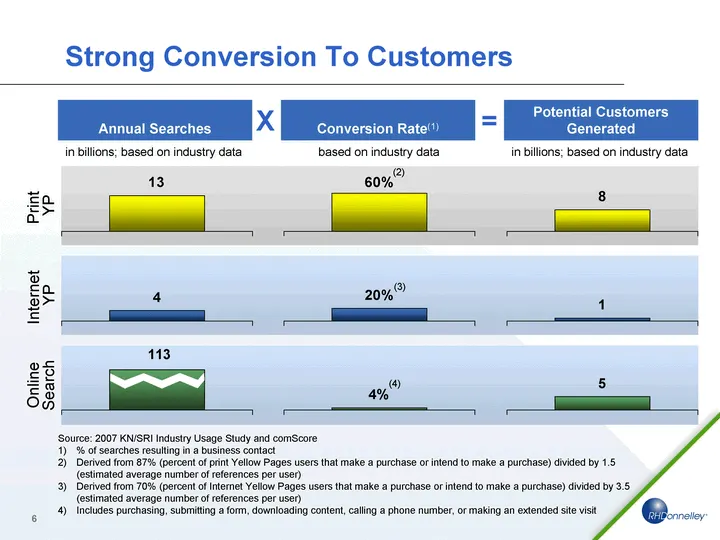
Strong Conversion To Customers Source: 2007 KN/SRI Industry Usage Study and comScore % of searches resulting in a business contact Derived from 87% (percent of print Yellow Pages users that make a purchase or intend to make a purchase) divided by 1.5 (estimated average number of references per user)
Slide 8: Triple Play Consumers Continue To Use Yellow Pages
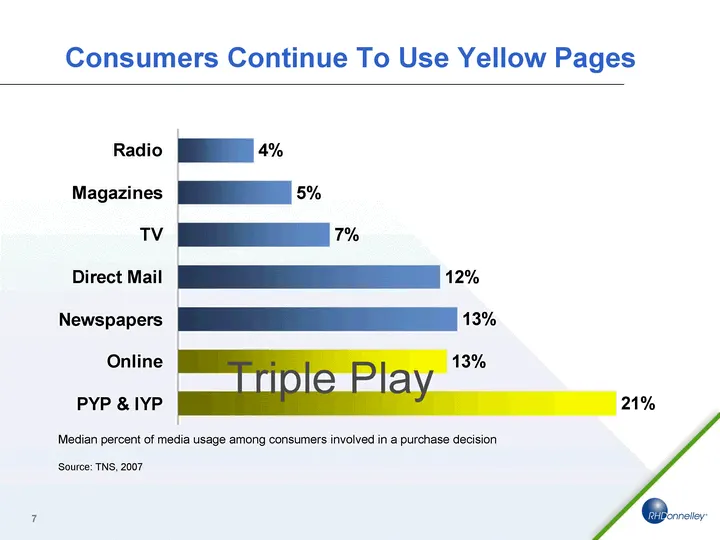
% of active market using media - 2007 Radio 0.036 Magazines 0.054 TV 0.072 Direct Mail 0.124 Newspapers 0.132 Online 0.127 PYP & IYP 0.207 Median percent of media usage among consumers involved in a purchase decision Source: TNS, 2007 Triple Play Consumers Continue To Use Yellow Pages
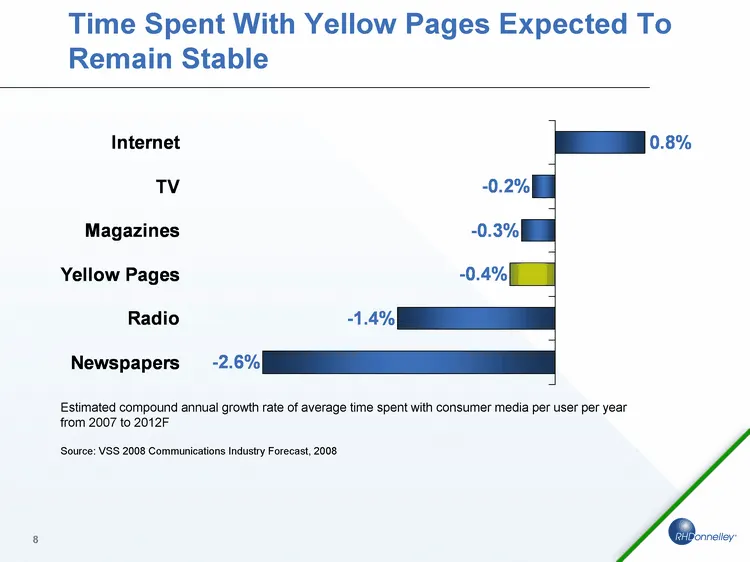
Slide 9: Time Spent With Yellow Pages Expected To Remain Stable
2007 - 2012 Newspapers -0.026 Radio -0.014 Yellow Pages -0.004 Magazines -0.003 TV -0.002 Internet 0.008 Estimated compound annual growth rate of average time spent with consumer media per user per year from 2007 to 2012F Source: VSS 2008 Communications Industry Forecast, 2008 Time Spent With Yellow
Slide 10: Our Fundamental Advantages
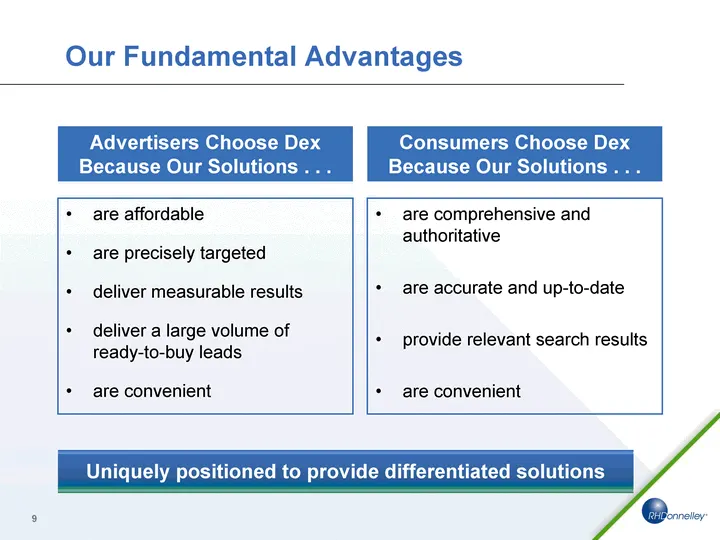
Our Fundamental Advantages Advertisers Choose Dex Because Our Solutions . . . are affordable are precisely targeted deliver measurable results deliver a large volume of ready-to-buy leads are convenient Consumers Choose Dex Because Our Solutions . . . are comprehensive and authoritative are accurate
Slide 11: Sales Force - A Competitive Advantage
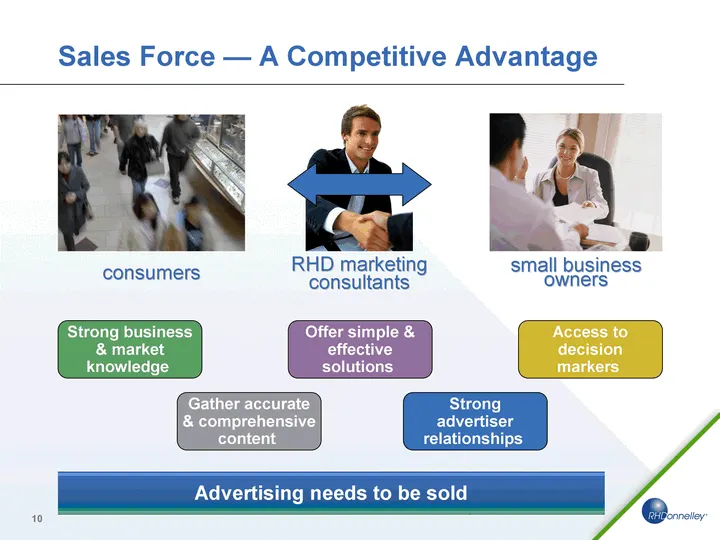
Sales Force - A Competitive Advantage Strong advertiser relationships Strong business & market knowledge Access to decision markers Offer simple & effective solutions Gather accurate & comprehensive content Advertising needs to be sold consumers small business owners RHD marketing consultants

Slide 12: Financial Highlights
Financial Highlights
Slide 13: Exceptional Cash Flow
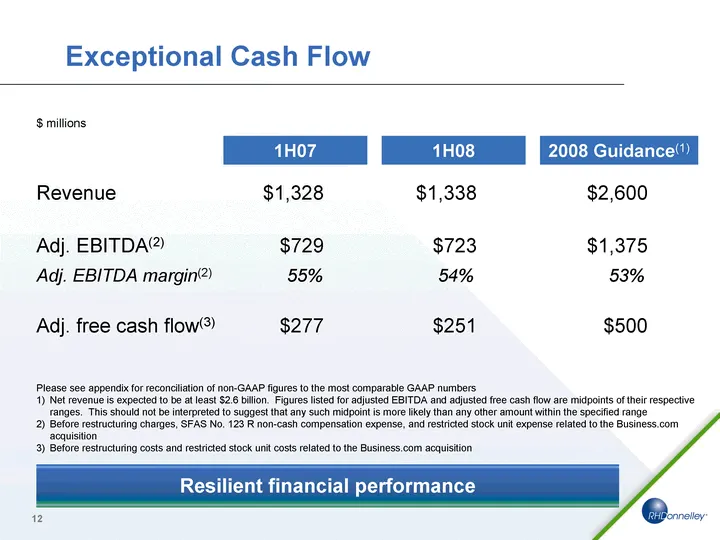
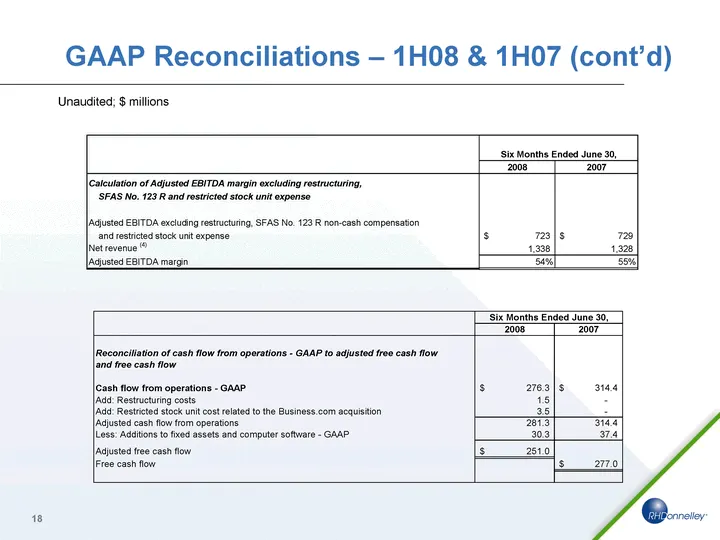
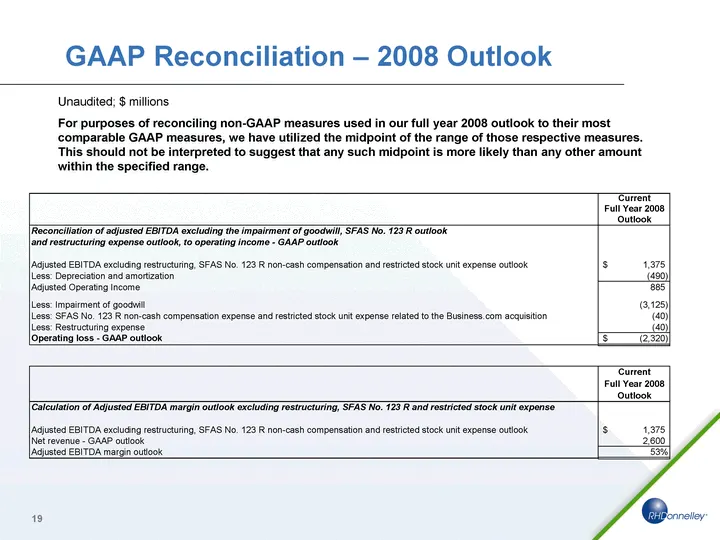
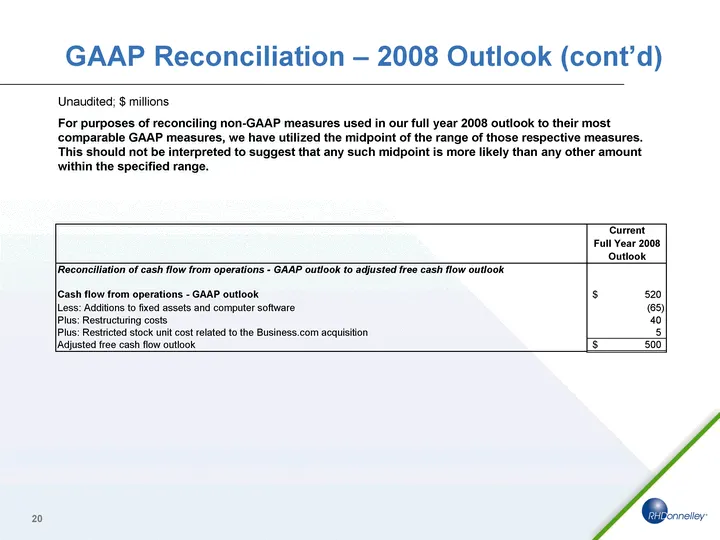
Exceptional Cash Flow Revenue $1,328 $1,338 $2,600 Adj. EBITDA(2) $729 $723 $1,375 Adj. EBITDA margin(2) 55% 54% 53% Adj. free cash flow(3) $277 $251 $500 1H07 1H08 2008 Guidance(1) Please see appendix for reconciliation of non-GAAP figures to the most comparable GAAP numbers Net revenue is expected
Slide 14: Valuable Tax Benefits
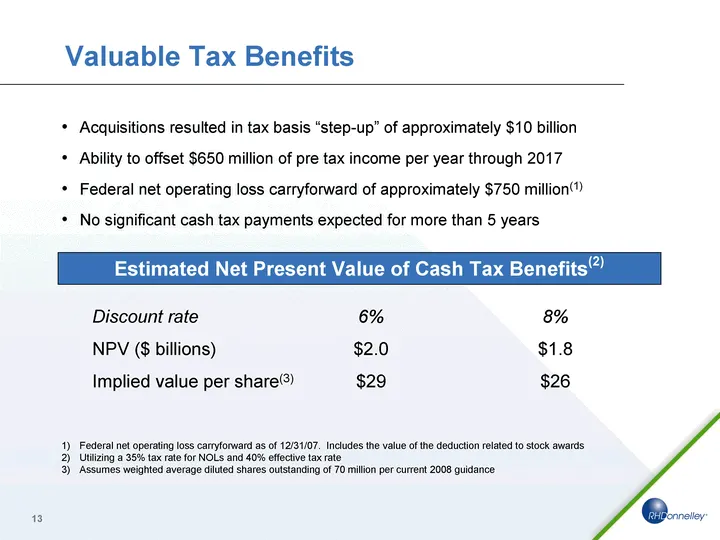
Federal net operating loss carryforward as of 12/31/07. Includes the value of the deduction related to stock awards Utilizing a 35% tax rate for NOLs and 40% effective tax rate Assumes weighted average diluted shares outstanding of 70 million per current 2008 guidance Valuable Tax Benefits Acquisiti
Slide 15: Debt Maturity Profile
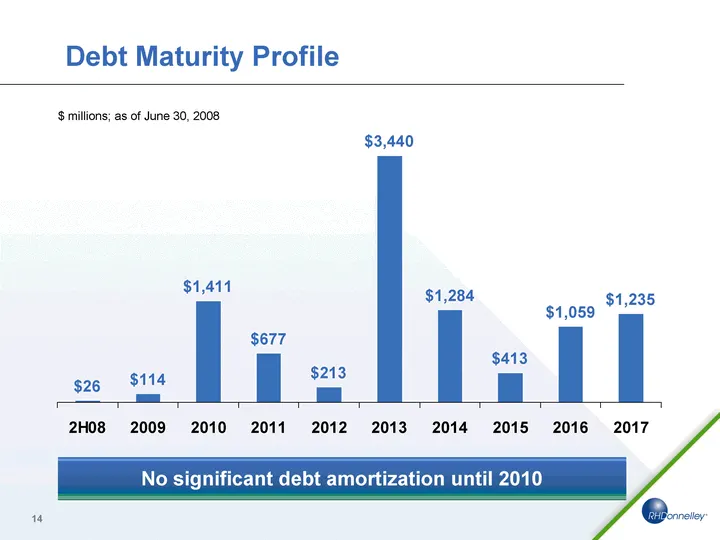
Debt Maturity Profile $ millions; as of June 30, 2008 2H08 2009 2010 2011 2012 2013 2014 2015 2016 2017 Current 25.91449639 114.4539928 1411.101417 677.4408237 212.875 3440 1283.875 412.871 1058.839 1235.26 No significant debt amortization until 2010
Slide 16: Cumulative Debt Repayment
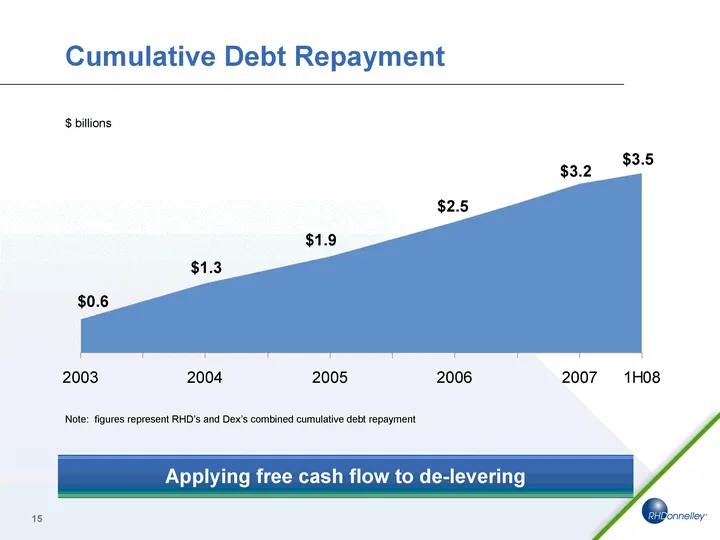
Cumulative Debt Repayment Debt Repayment Column 3 Column 4 Column 5 Column 6 Column 7 Column 8 Column 9 Column 10 Column 11 Column 12 Column 13 Column 14 Column 15 Column 16 2003 0.648 0.992 2004 1.336 1.598 2005 1.859 2.19 2006 2.521 2.884 2007 3.246 1H08 3.454 $ billions Note: figures represent RH

Slide 17: Appendix
Appendix
Slide 18: GAAP Reconciliations - 1H08 & 1H07
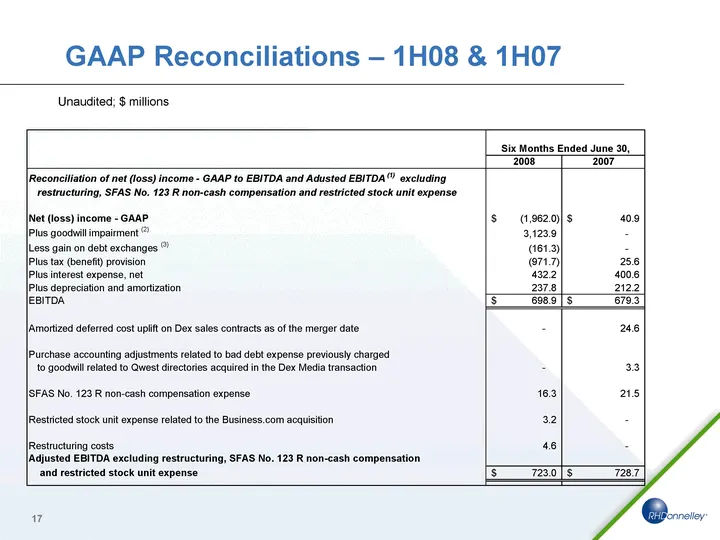
GAAP Reconciliations - 1H08 & 1H07 Unaudited; $ millions
Slide 19: GAAP Reconciliations - 1H08 & 1H07 (cont'd)
GAAP Reconciliations - 1H08 & 1H07 (cont'd) Unaudited; $ millions
Slide 20: GAAP Reconciliation - 2008 Outlook
GAAP Reconciliation - 2008 Outlook Unaudited; $ millions For purposes of reconciling non-GAAP measures used in our full year 2008 outlook to their most comparable GAAP measures, we have utilized the midpoint of the range of those respective measures. This should not be interpreted to suggest that an
Slide 21: GAAP Reconciliation - 2008 Outlook (cont'd)
GAAP Reconciliation - 2008 Outlook (cont'd) Unaudited; $ millions For purposes of reconciling non-GAAP measures used in our full year 2008 outlook to their most comparable GAAP measures, we have utilized the midpoint of the range of those respective measures. This should not be interpreted to sugges
Slide 22: Notes To Reconciliations
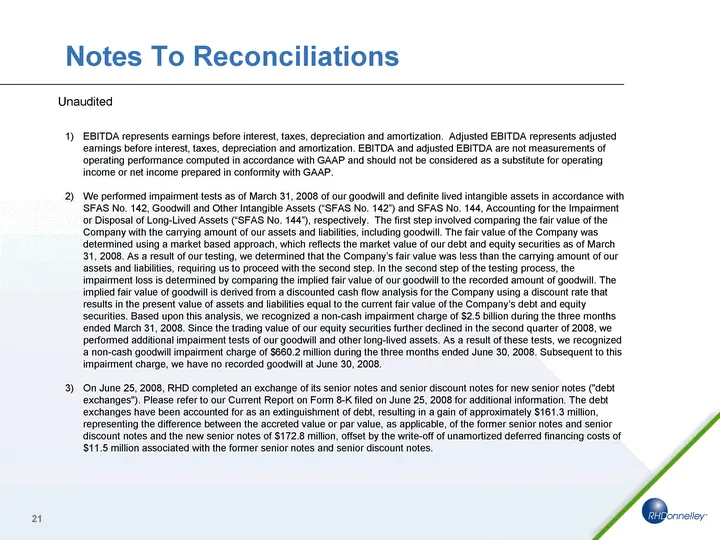
Notes To Reconciliations Unaudited EBITDA represents earnings before interest, taxes, depreciation and amortization. Adjusted EBITDA represents adjusted earnings before interest, taxes, depreciation and amortization. EBITDA and adjusted EBITDA are not measurements of operating performance computed i
Slide 23: Notes To Reconciliations (cont'd)
Notes To Reconciliations (cont'd) Unaudited 4) Revenue with respect to print advertising, and Internet-based advertising products that are bundled with print advertising, is recognized under the deferral and amortization method, whereby revenue is initially deferred when a directory is published and
Source: SEC EDGAR · 8-K filed Sep 18, 2008
More decks from DEX ONE Corp
 Q4 2012 Earnings Presentation17 slides · Mar 18, 2013
 Merger or Acquisition (December 2012)42 slides · Dec 6, 2012
 Merger or Acquisition (September 2012)51 slides · Sep 18, 2012
 Merger or Acquisition (August 2012)15 slides · Aug 21, 2012
 Q2 2012 Earnings Presentation16 slides · Jul 25, 2012
 Q1 2012 Earnings Presentation17 slides · Apr 26, 2012