Amedisys — J.P. Morgan Health Care Conference 2018
18 slides from Amedisys's conference presentation, Jan 10, 2018

Slide 1: Amedisys Presentation J.P. Morgan Health Care Conference 2018
Amedisys Presentation J.P. Morgan Health Care Conference 2018 Exhibit 99.1
Slide 2: Forward-looking statements
This presentation may include forward-looking statements as defined by the Private Securities Litigation Reform Act of 1995. These forward-looking statements are based upon current expectations and assumptions about our business that are subject to a variety of risks and uncertainties that could cau
Slide 3: The Home Health and Hospice Industries Continue to Grow
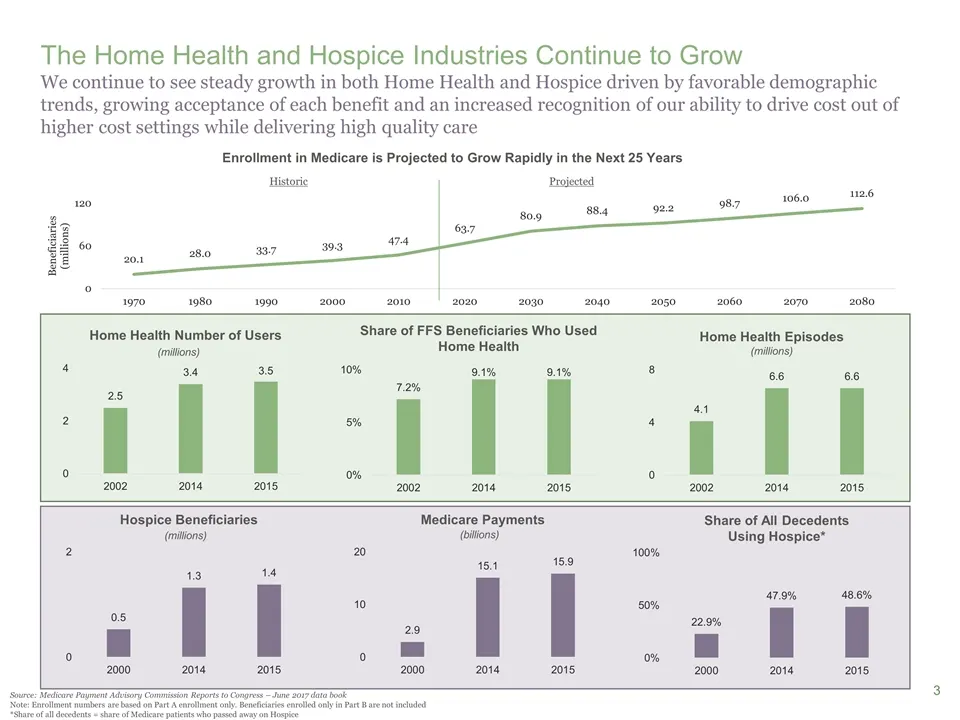
The Home Health and Hospice Industries Continue to Grow We continue to see steady growth in both Home Health and Hospice driven by favorable demographic trends, growing acceptance of each benefit and an increased recognition of our ability to drive cost out of higher cost settings while delivering h
Slide 4: 2018 Strategic Landscape
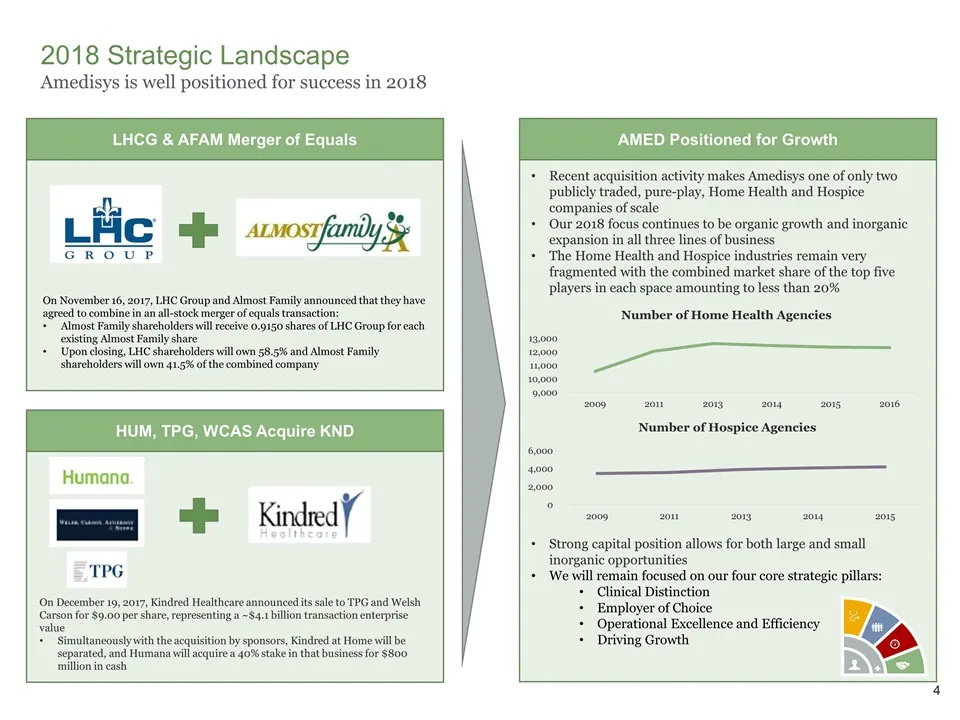
2018 Strategic Landscape Amedisys is well positioned for success in 2018 LHCG & AFAM Merger of Equals On November 16, 2017, LHC Group and Almost Family announced that they have agreed to combine in an all-stock merger of equals transaction: Almost Family shareholders will receive 0.9150 shares of LH
Slide 5: What we Accomplished and Where we are Going
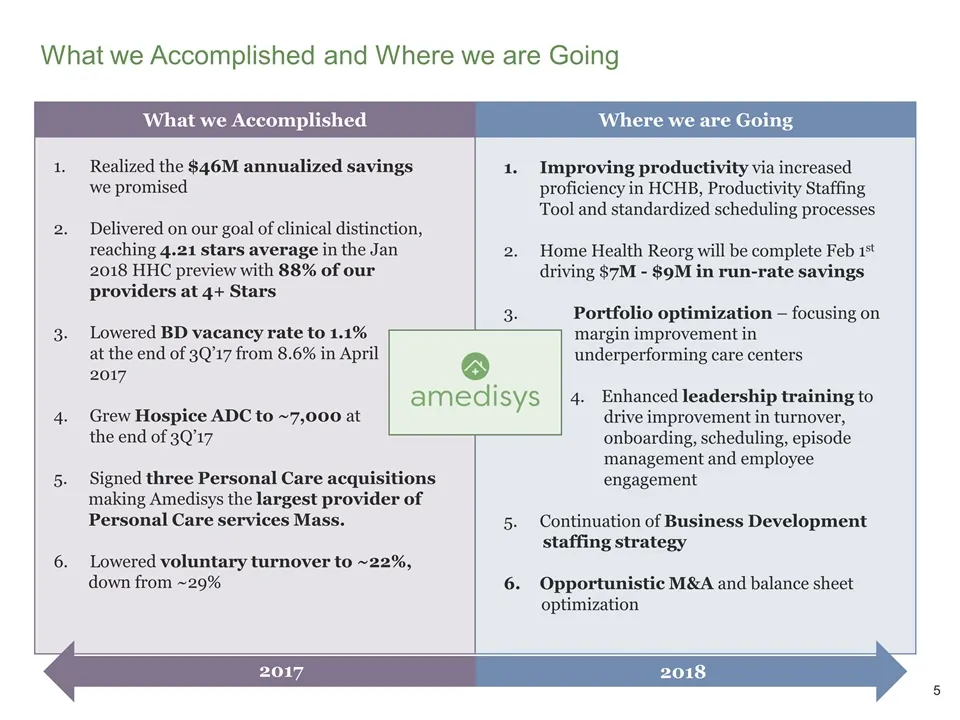
What we Accomplished and Where we are Going 2018 2017 Realized the $46M annualized savings we promised Delivered on our goal of clinical distinction, reaching 4.21 stars average in the Jan 2018 HHC preview with 88% of our providers at 4+ Stars Lowered BD vacancy rate to 1.1% at the end of 3Q’17 from
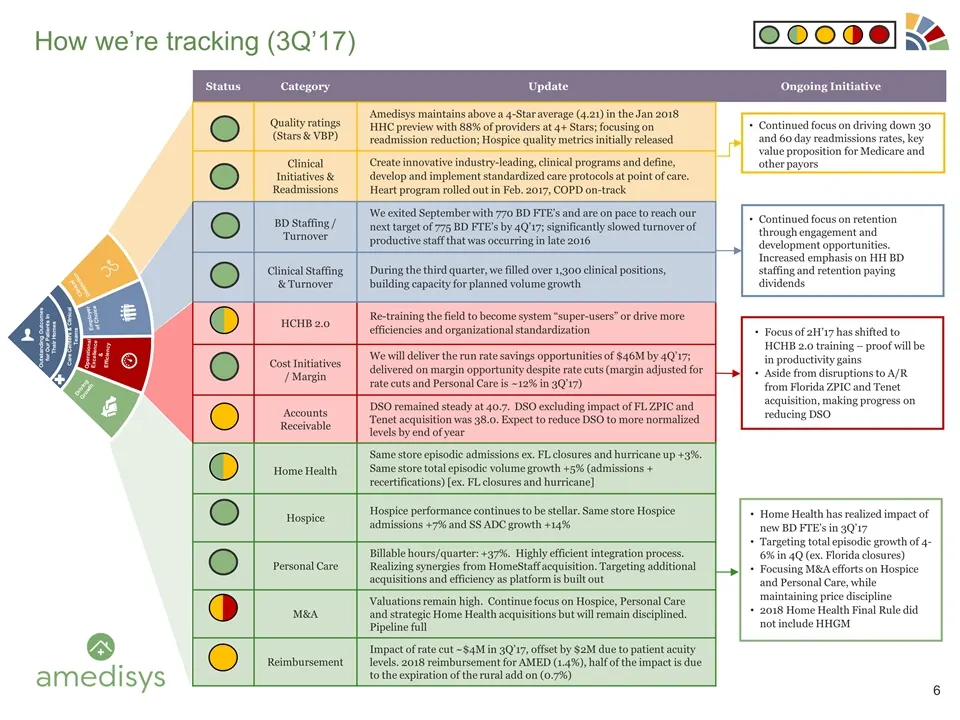
Slide 6: Status update on ongoing initiatives
Status Category Update Ongoing Initiative Quality ratings (Stars & VBP) Amedisys maintains above a 4-Star average (4.21) in the Jan 2018 HHC preview with 88% of providers at 4+ Stars; focusing on readmission reduction; Hospice quality metrics initially released Clinical Initiatives & Readmissions Cr
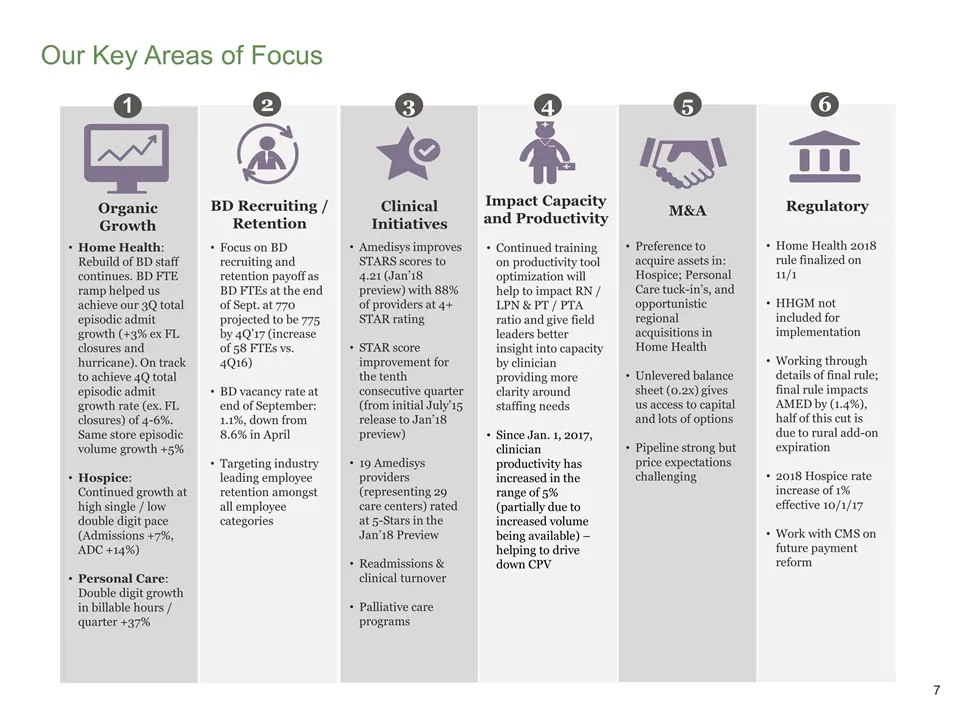
Slide 7: Our Key Areas of Focus
Our Key Areas of Focus Home Health: Rebuild of BD staff continues. BD FTE ramp helped us achieve our 3Q total episodic admit growth (+3% ex FL closures and hurricane). On track to achieve 4Q total episodic admit growth rate (ex. FL closures) of 4-6%. Same store episodic volume growth +5% Hospice: Co
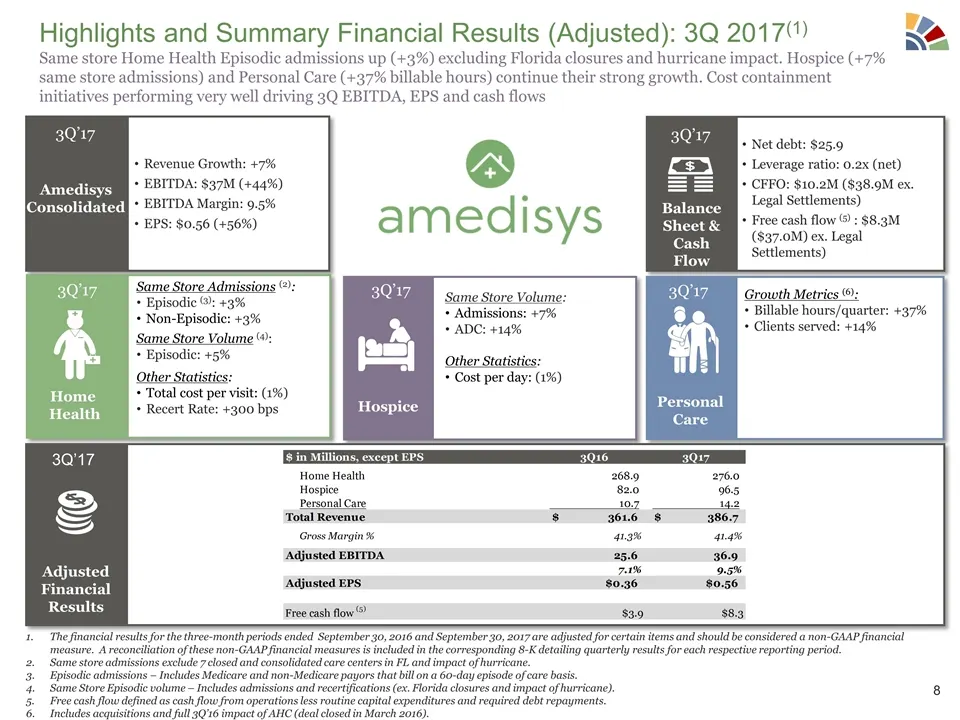
Slide 8: Highlights and Summary Financial Results (Adjusted): 3Q 2017
Highlights and Summary Financial Results (Adjusted): 3Q 2017(1) Same store Home Health Episodic admissions up (+3%) excluding Florida closures and hurricane impact. Hospice (+7% same store admissions) and Personal Care (+37% billable hours) continue their strong growth. Cost containment initiatives
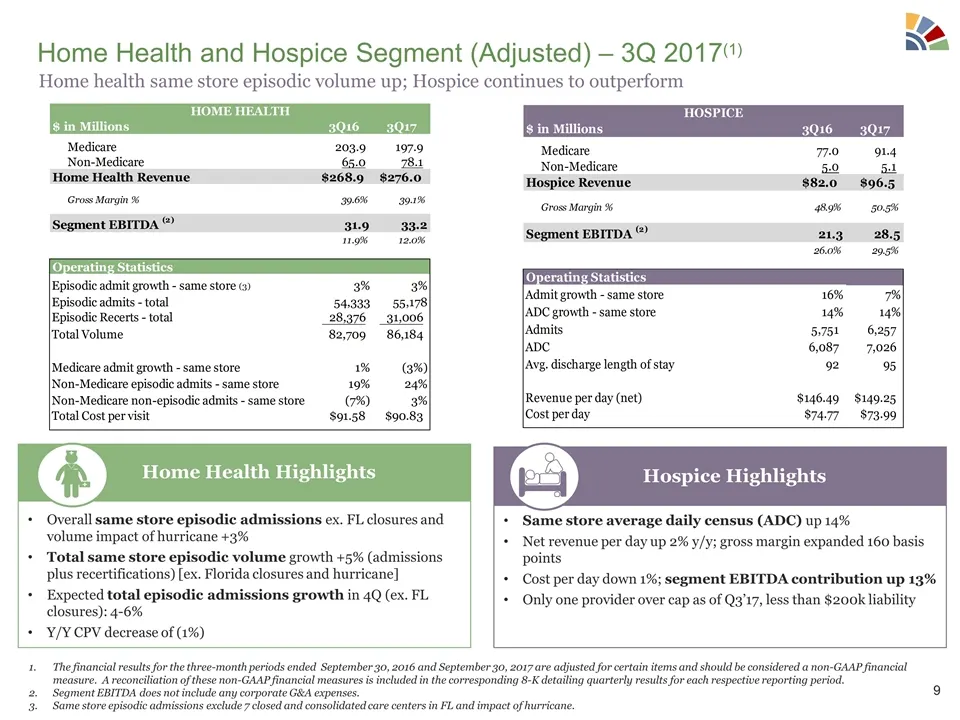
Slide 9: Home Health and Hospice Segment (Adjusted) – 3Q 2017
Home Health and Hospice Segment (Adjusted) – 3Q 2017(1) Overall same store episodic admissions ex. FL closures and volume impact of hurricane +3% Total same store episodic volume growth +5% (admissions plus recertifications) [ex. Florida closures and hurricane] Expected total episodic admissions gro
Slide 10: General & Administrative Expenses – Adjusted
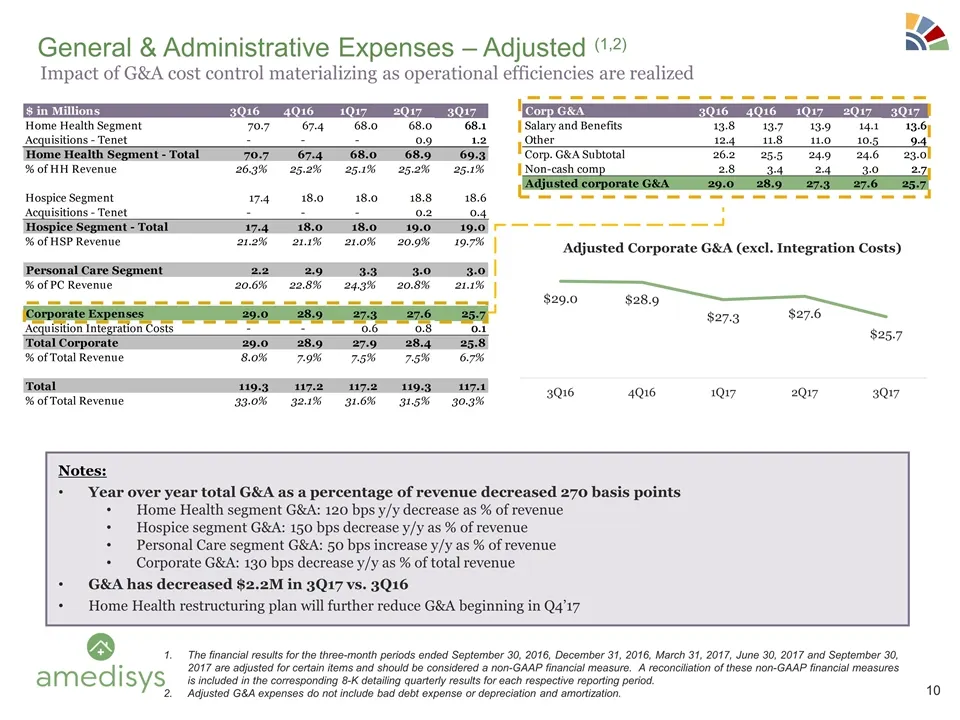
General & Administrative Expenses – Adjusted (1,2) Notes: Year over year total G&A as a percentage of revenue decreased 270 basis points Home Health segment G&A: 120 bps y/y decrease as % of revenue Hospice segment G&A: 150 bps decrease y/y as % of revenue Personal Care segment G&A: 50 bps increase
Slide 11: Our Stars scores have continued to trend upwards and are amongst industry leaders
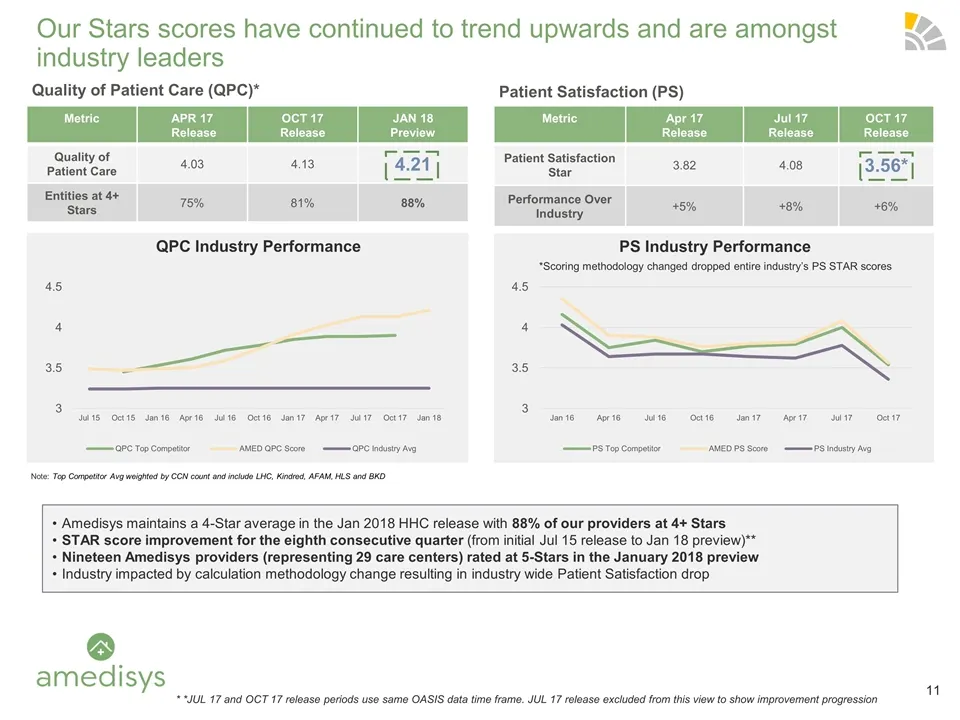
Our Stars scores have continued to trend upwards and are amongst industry leaders Note: Top Competitor Avg weighted by CCN count and include LHC, Kindred, AFAM, HLS and BKD Metric APR 17 Release OCT 17 Release JAN 18 Preview Quality of Patient Care 4.03 4.13 4.21 Entities at 4+ Stars 75% 81% 88% Met
Slide 12: On Target to Reach 775 BD FTEs by End of 4Q'17
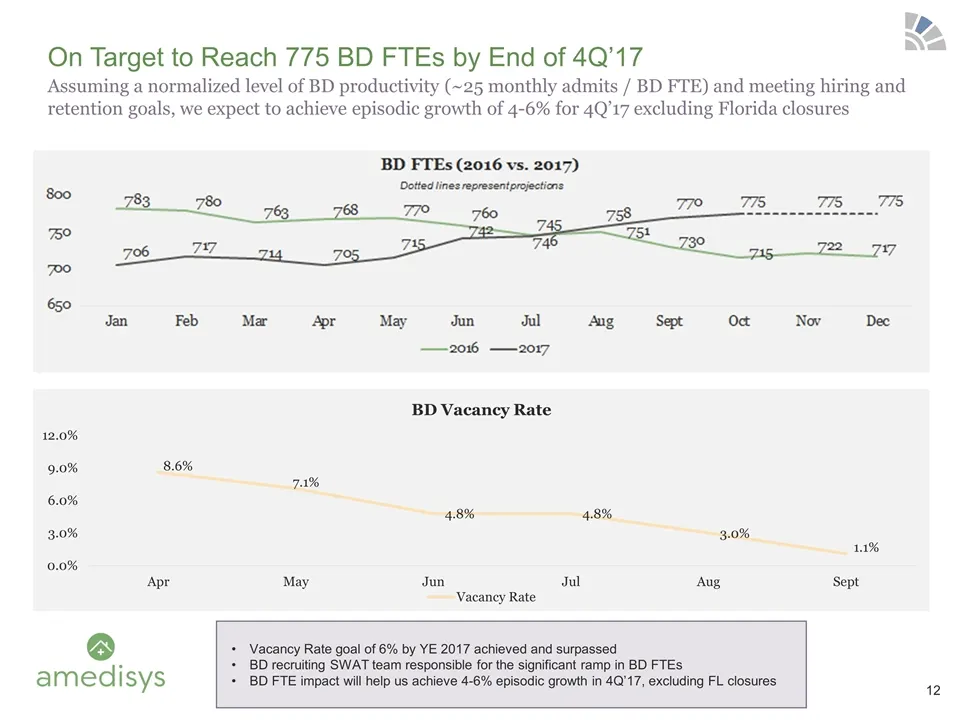
Assuming a normalized level of BD productivity (~25 monthly admits / BD FTE) and meeting hiring and retention goals, we expect to achieve episodic growth of 4-6% for 4Q’17 excluding Florida closures On Target to Reach 775 BD FTEs by End of 4Q’17 Vacancy Rate goal of 6% by YE 2017 achieved and surpas
Slide 13: On track to realize the $46M annualized savings we promised by Q4'17
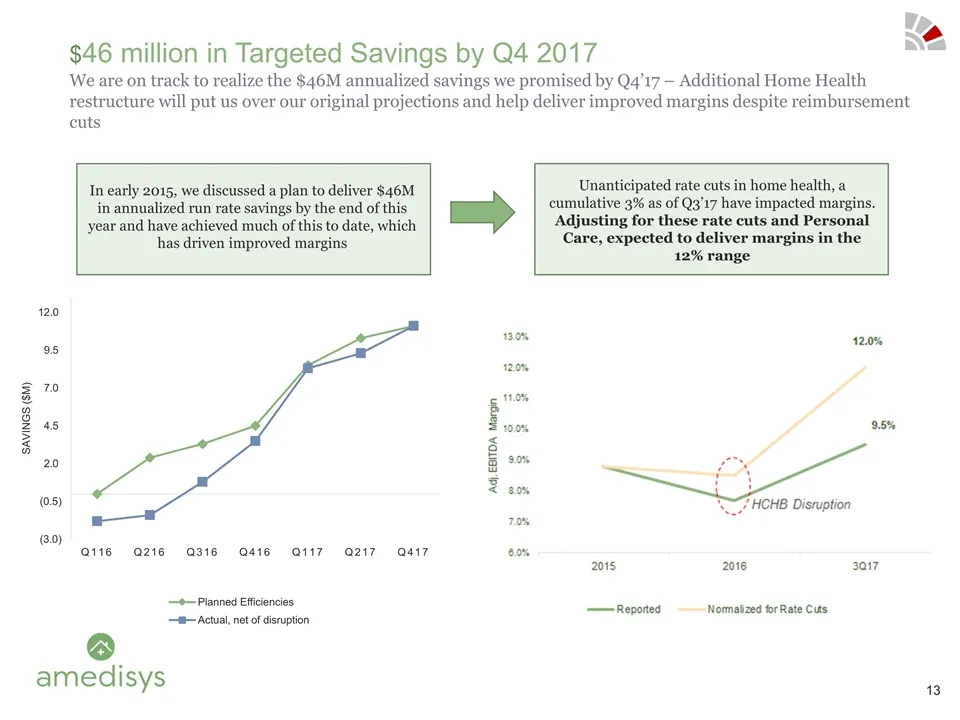
We are on track to realize the $46M annualized savings we promised by Q4’17 – Additional Home Health restructure will put us over our original projections and help deliver improved margins despite reimbursement cuts $46 million in Targeted Savings by Q4 2017 In early 2015, we discussed a plan to del
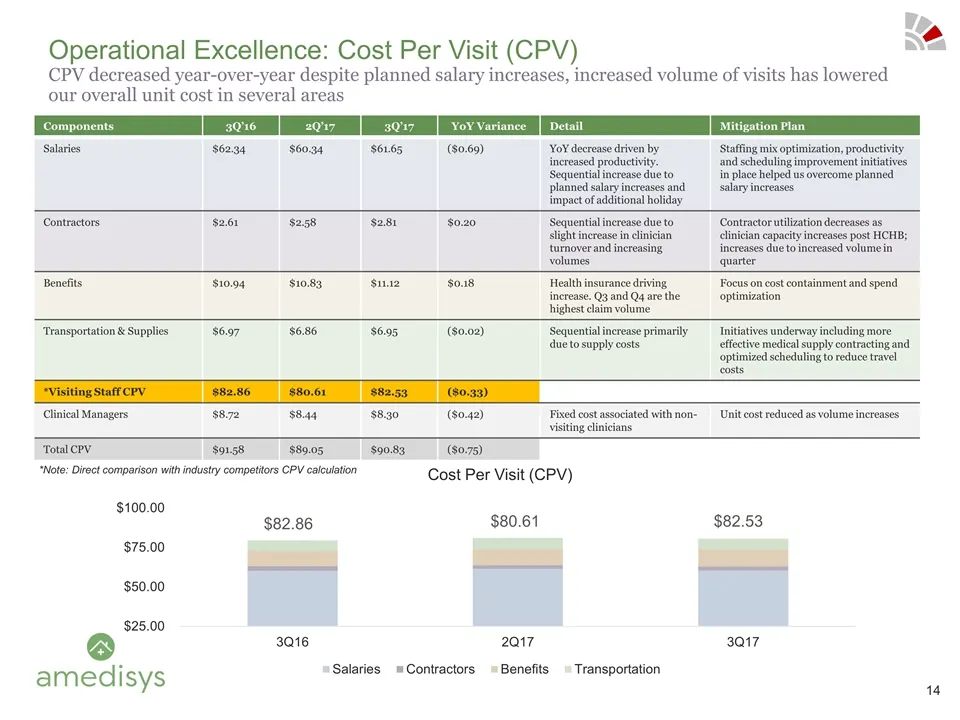
Slide 14: Cost per visit components and mitigation plan
Components 3Q’16 2Q’17 3Q’17 YoY Variance Detail Mitigation Plan Salaries $62.34 $60.34 $61.65 ($0.69) YoY decrease driven by increased productivity. Sequential increase due to planned salary increases and impact of additional holiday Staffing mix optimization, productivity and scheduling improvemen
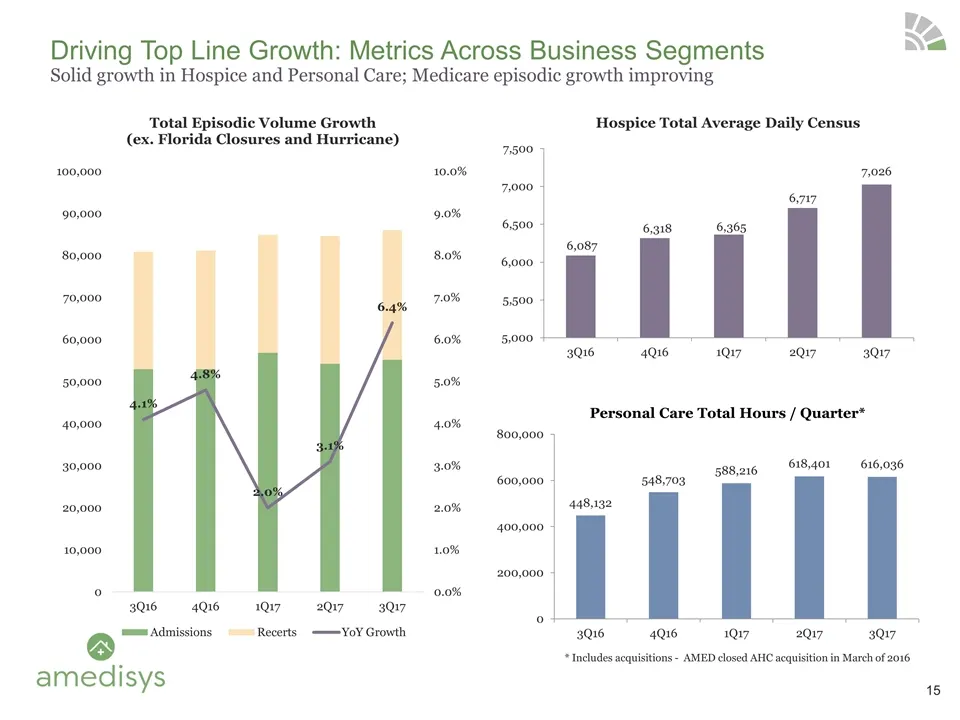
Slide 15: Driving Top Line Growth: Metrics Across Business Segments
Driving Top Line Growth: Metrics Across Business Segments Solid growth in Hospice and Personal Care; Medicare episodic growth improving 234 Opportunities Prospected 45 Opportunities Under Review 13 Active Processes Personal Care Total Hours / Quarter* * Includes acquisitions - AMED closed AHC acquis
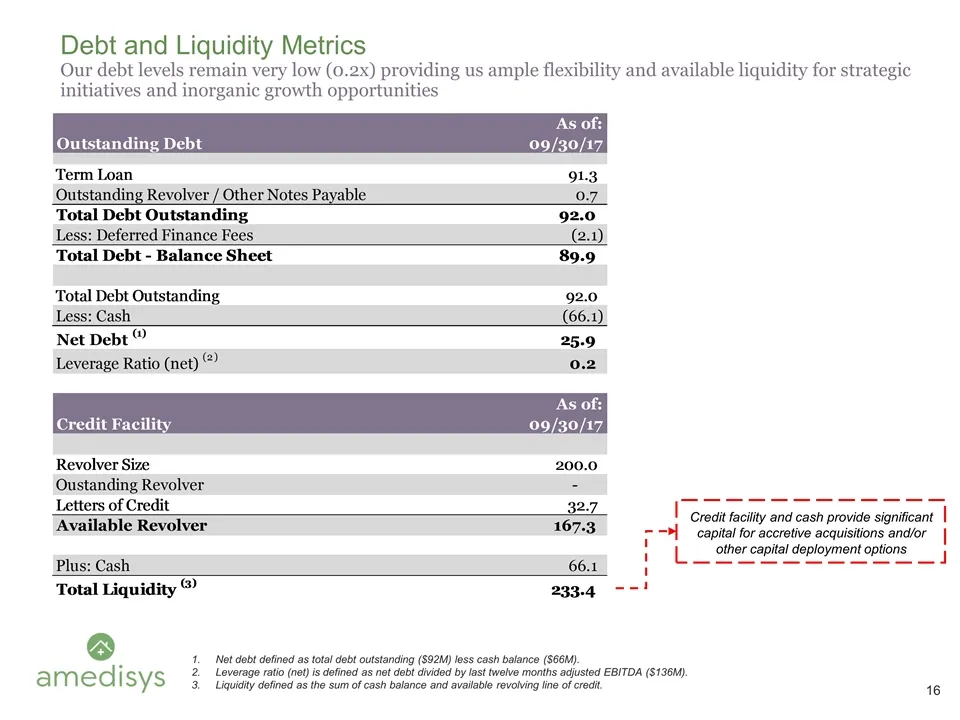
Slide 16: Debt and Liquidity Metrics
Debt and Liquidity Metrics Our debt levels remain very low (0.2x) providing us ample flexibility and available liquidity for strategic initiatives and inorganic growth opportunities Net debt defined as total debt outstanding ($92M) less cash balance ($66M). Leverage ratio (net) is defined as net deb
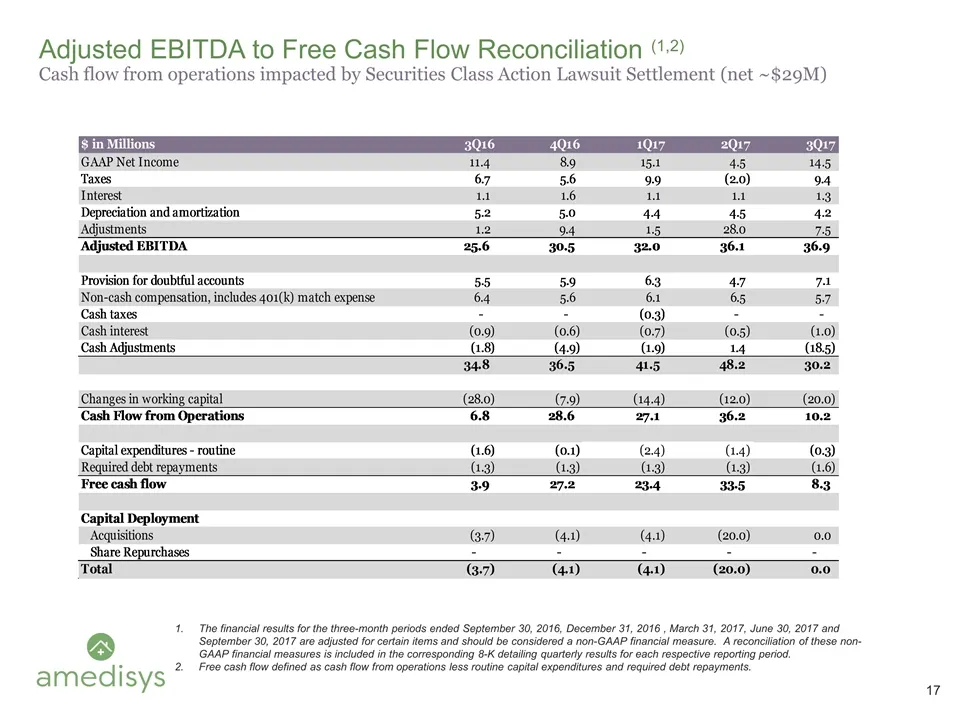
Slide 17: Adjusted EBITDA to Free Cash Flow Reconciliation
Adjusted EBITDA to Free Cash Flow Reconciliation (1,2) Cash flow from operations impacted by Securities Class Action Lawsuit Settlement (net ~$29M) The financial results for the three-month periods ended September 30, 2016, December 31, 2016 , March 31, 2017, June 30, 2017 and September 30, 2017 are
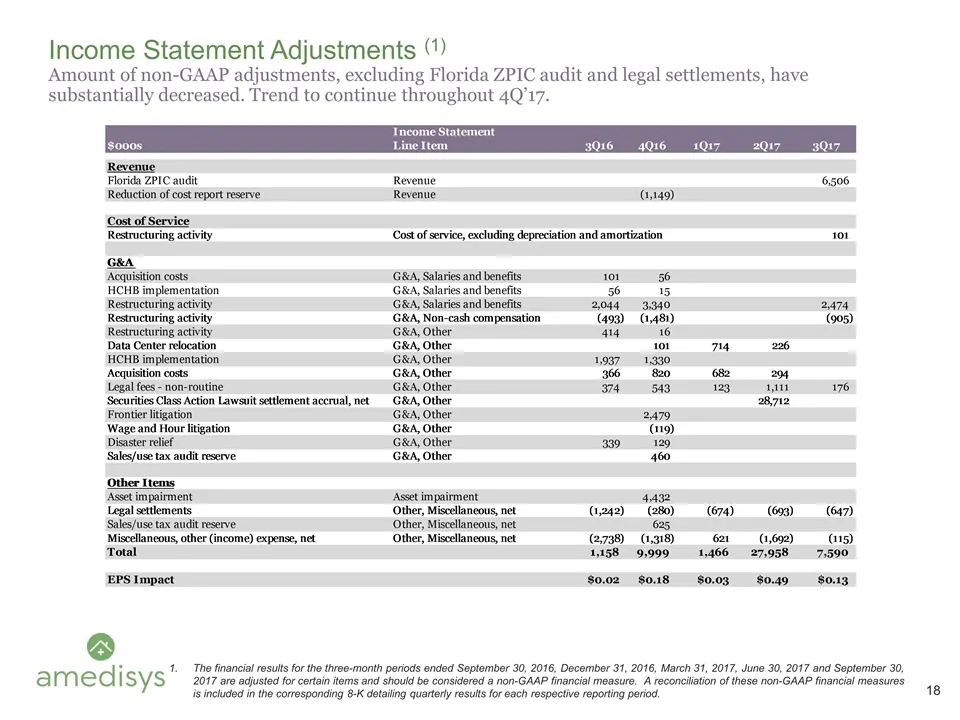
Slide 18: Income Statement Adjustments
Income Statement Adjustments (1) Amount of non-GAAP adjustments, excluding Florida ZPIC audit and legal settlements, have substantially decreased. Trend to continue throughout 4Q’17. The financial results for the three-month periods ended September 30, 2016, December 31, 2016, March 31, 2017, June 3
Source: SEC EDGAR · 8-K filed Jan 10, 2018
More decks from Amedisys Inc
 Q2 2025 Earnings Presentation11 slides · Jul 29, 2025
 Q1 2025 Earnings Presentation11 slides · Apr 23, 2025
 Q4 2024 Earnings Presentation14 slides · Feb 26, 2025
 Q3 2024 Earnings Presentation16 slides · Nov 6, 2024
 Q2 2024 Earnings Presentation16 slides · Jul 24, 2024
 Q1 2024 Earnings Presentation16 slides · Apr 24, 2024