PPD — Debt Investor Presentation (February 2020)
9 slides from PPD's debt investor presentation, Feb 18, 2020

Slide 1: Lender Presentation
Lender Presentation* * Select pages Exhibit 99.1
Slide 2: Disclaimer
Disclaimer This presentation contains forward-looking statements within the meaning of the federal securities laws. These forward-looking statements, which are subject to risks, uncertainties and assumptions about PPD, Inc. “the (“Company”), may include projections of the Company’s future financial
Slide 3: Executive summary
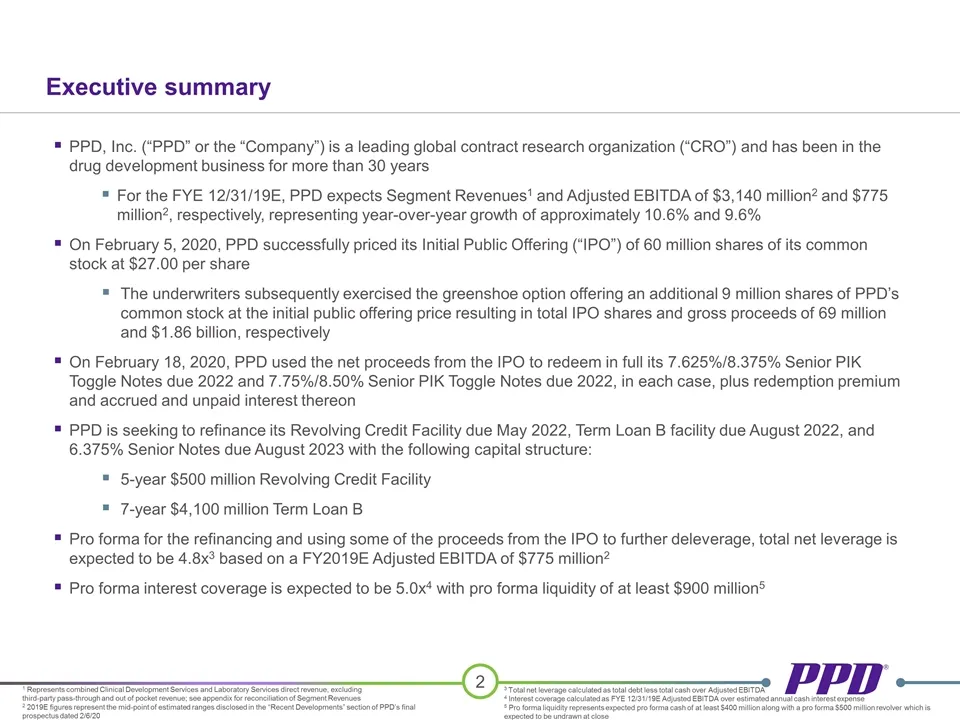
Executive summary PPD, Inc. (“PPD” or the “Company”) is a leading global contract research organization (“CRO”) and has been in the drug development business for more than 30 years For the FYE 12/31/19E, PPD expects Segment Revenues1 and Adjusted EBITDA of $3,140 million2 and $775 million2, respecti
Slide 4: Summary of Indicative Terms
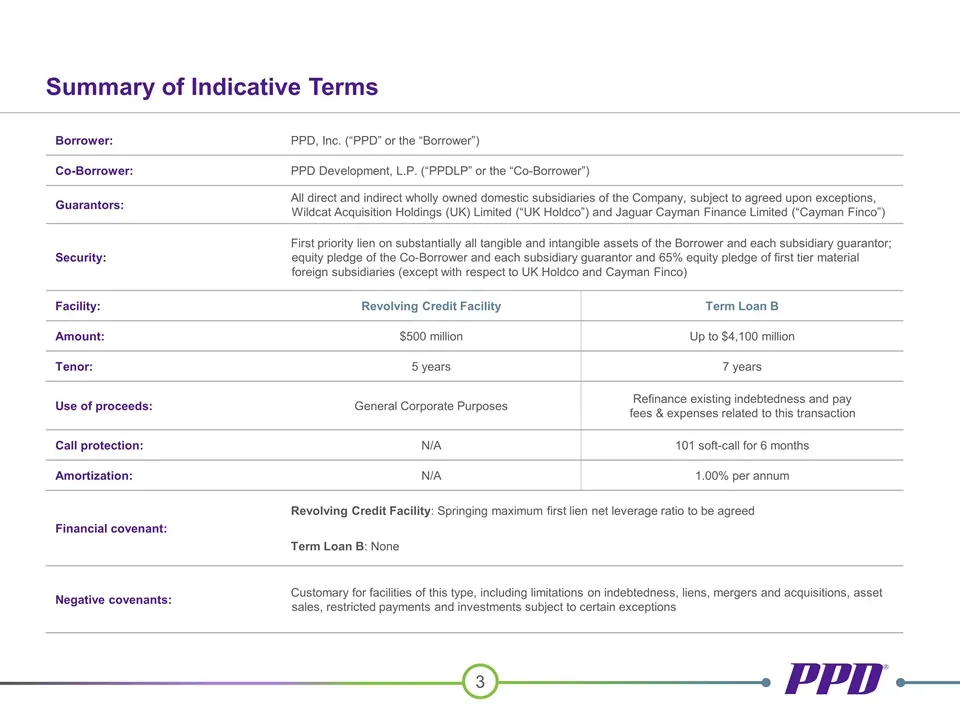
Summary of Indicative Terms Borrower: PPD, Inc. (“PPD” or the “Borrower”) Co-Borrower: PPD Development, L.P. (“PPDLP” or the “Co-Borrower”) Guarantors: All direct and indirect wholly owned domestic subsidiaries of the Company, subject to agreed upon exceptions, Wildcat Acquisition Holdings (UK) Limi
Slide 5: Pro forma capitalization
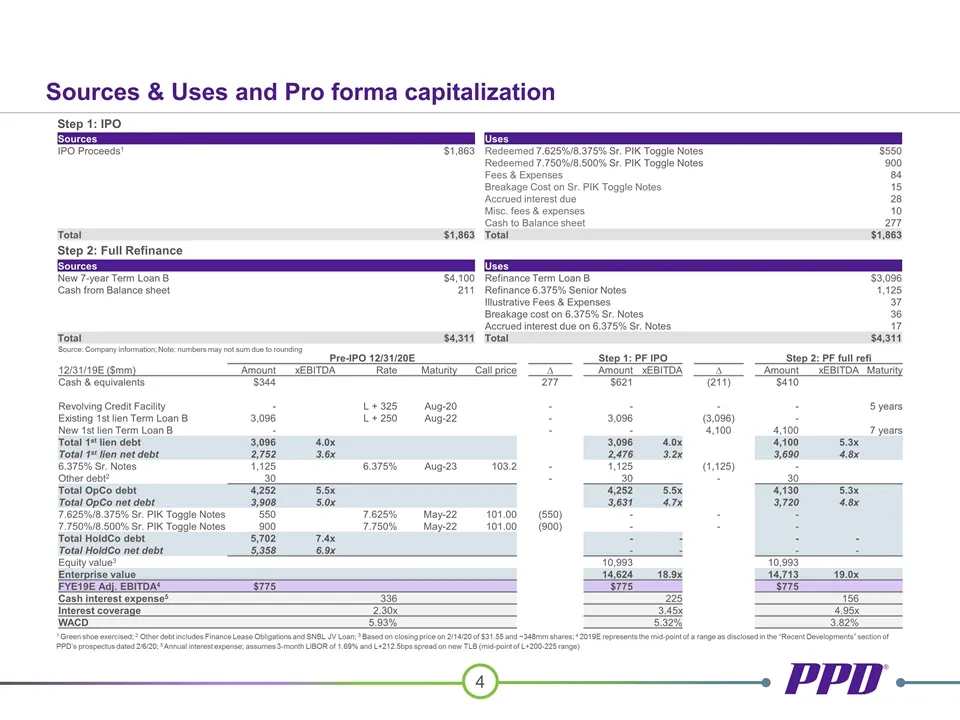
Pre-IPO 12/31/20E Step 1: PF IPO Step 2: PF full refi 12/31/19E ($mm) Amount xEBITDA Rate Maturity Call price ∆ Amount xEBITDA ∆ Amount xEBITDA Maturity Cash & equivalents $344 277 $621 (211) $410 Revolving Credit Facility - L + 325 Aug-20 - - - - 5 years Existing 1st lien Term Loan B 3,096 L + 250
Slide 6: Revenue Reconciliation
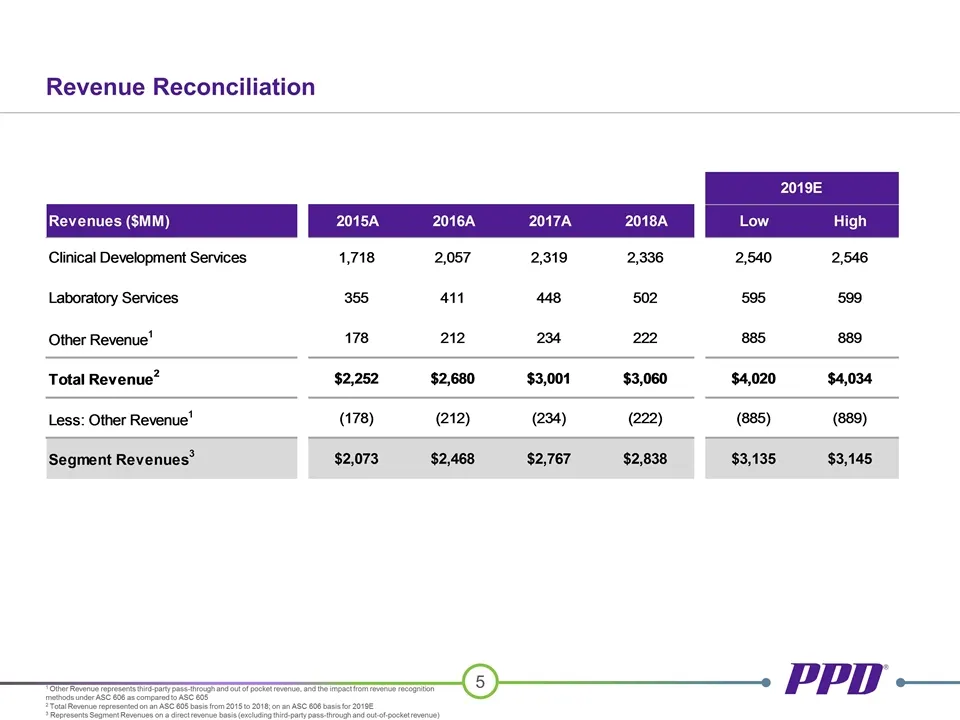
Revenue Reconciliation 1 Other Revenue represents third-party pass-through and out of pocket revenue, and the impact from revenue recognition methods under ASC 606 as compared to ASC 605 2 Total Revenue represented on an ASC 605 basis from 2015 to 2018; on an ASC 606 basis for 2019E 3 Represents Seg
Slide 7: Unlevered Free Cash Flow Reconciliation
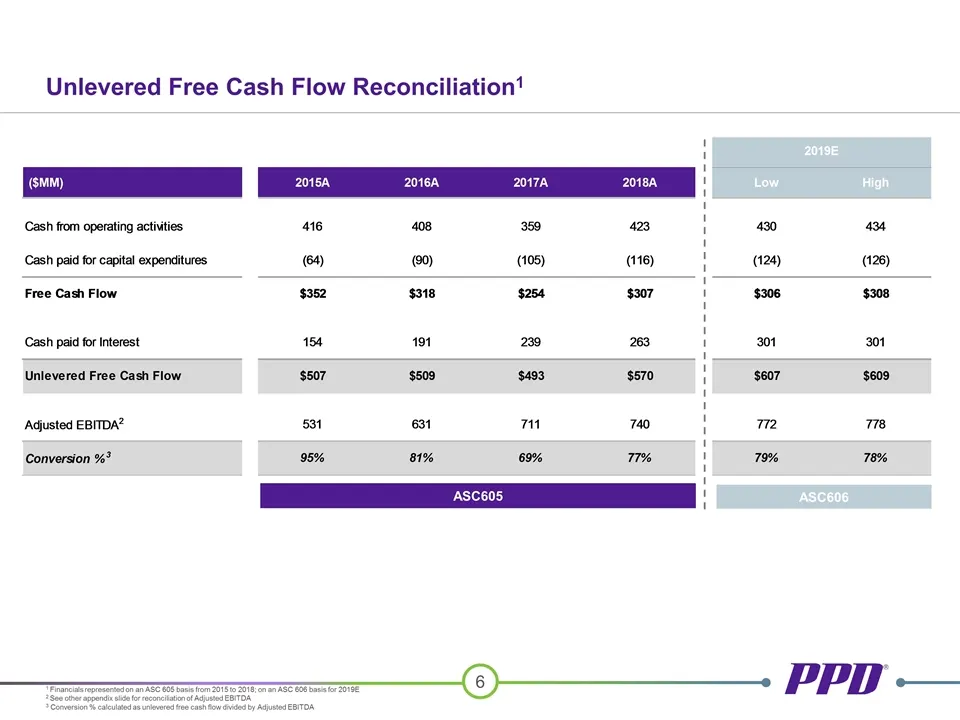
1 Financials represented on an ASC 605 basis from 2015 to 2018; on an ASC 606 basis for 2019E 2 See other appendix slide for reconciliation of Adjusted EBITDA 3 Conversion % calculated as unlevered free cash flow divided by Adjusted EBITDA Unlevered Free Cash Flow Reconciliation1 ASC605 ASC606
Slide 8: Adjusted EBITDA and Adjusted EBITDA Margin Reconciliation
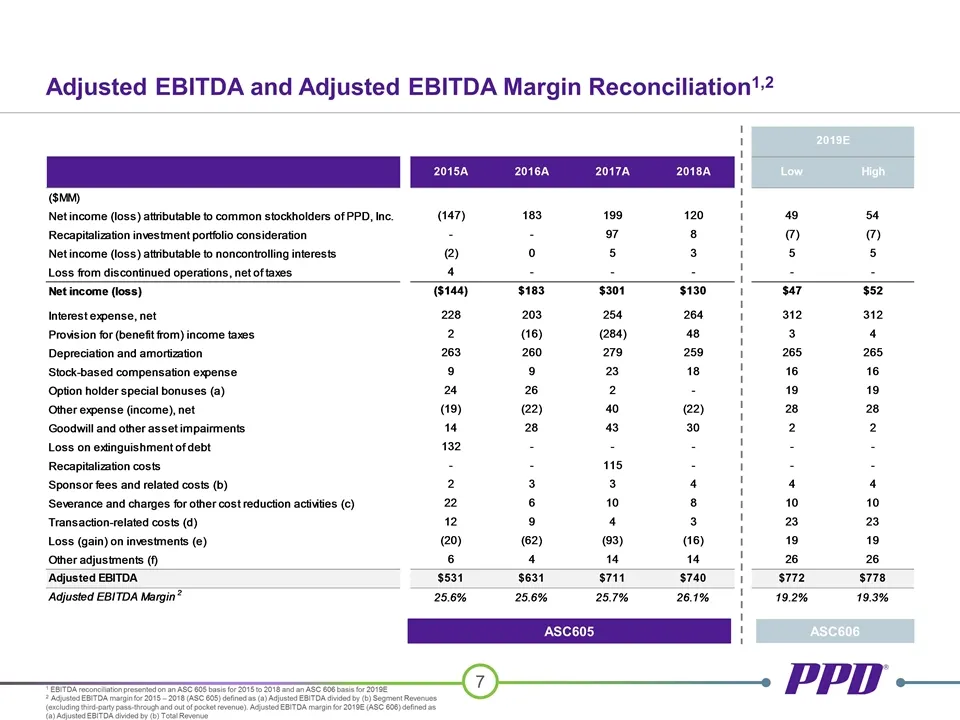
Adjusted EBITDA and Adjusted EBITDA Margin Reconciliation1,2 1 EBITDA reconciliation presented on an ASC 605 basis for 2015 to 2018 and an ASC 606 basis for 2019E 2 Adjusted EBITDA margin for 2015 – 2018 (ASC 605) defined as (a) Adjusted EBITDA divided by (b) Segment Revenues (excluding third-party
Slide 9: Adjusted EBITDA adjustment footnotes
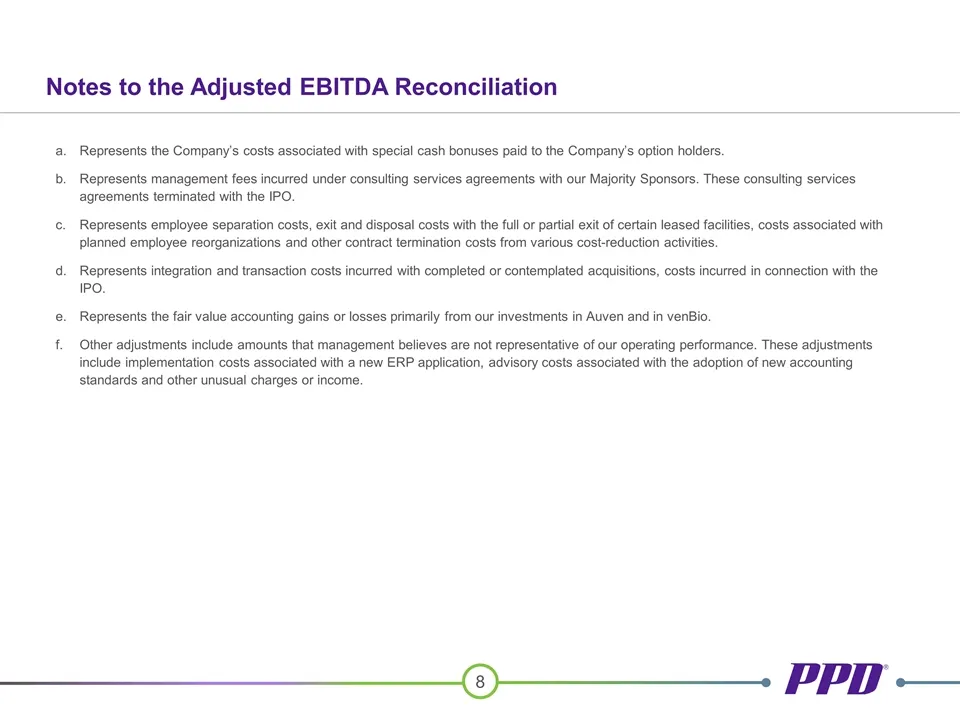
Represents the Company’s costs associated with special cash bonuses paid to the Company’s option holders. Represents management fees incurred under consulting services agreements with our Majority Sponsors. These consulting services agreements terminated with the IPO. Represents employee separation
Source: SEC EDGAR · 8-K filed Feb 18, 2020