JMP — Investor Presentation (September 2014)
24 slides from JMP's investor presentation, Sep 16, 2014
Slide 1: Introduction to JMP Group Inc.
GROWP Introduction to JMP Group Inc. September 2014
Slide 2: Disclosures
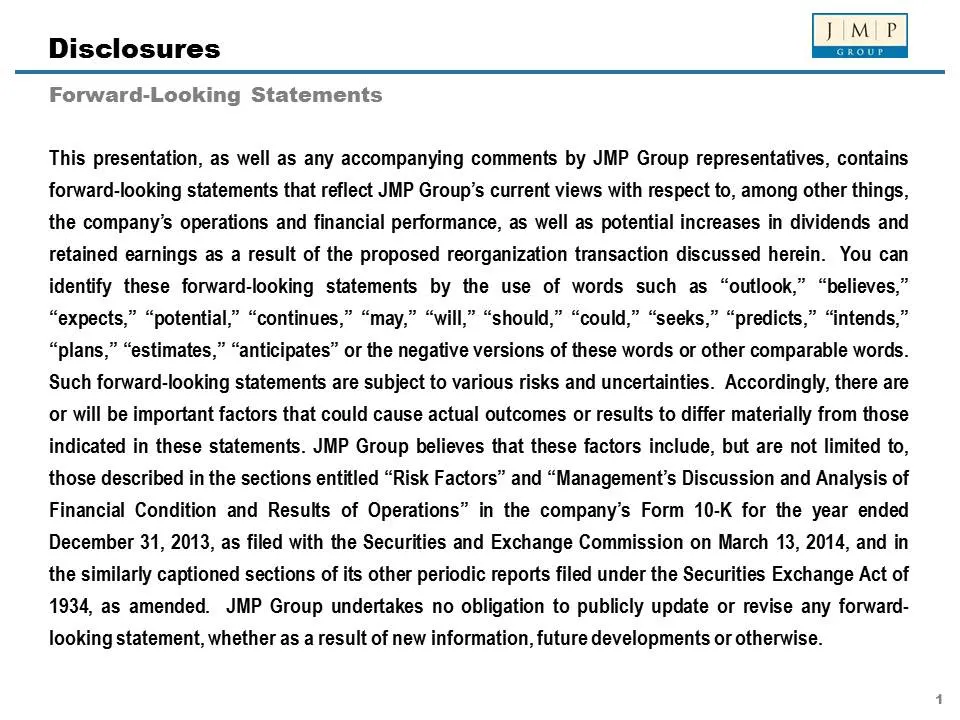
Disclosures Forward-Looking Statements This presentation, as well as any accompanying comments by JMP Group representatives, contains forward-looking statements that reflect JMP Group’s current views with respect to, among other things, the company’s operations and financial performance, as well as
Slide 3: Company Overview
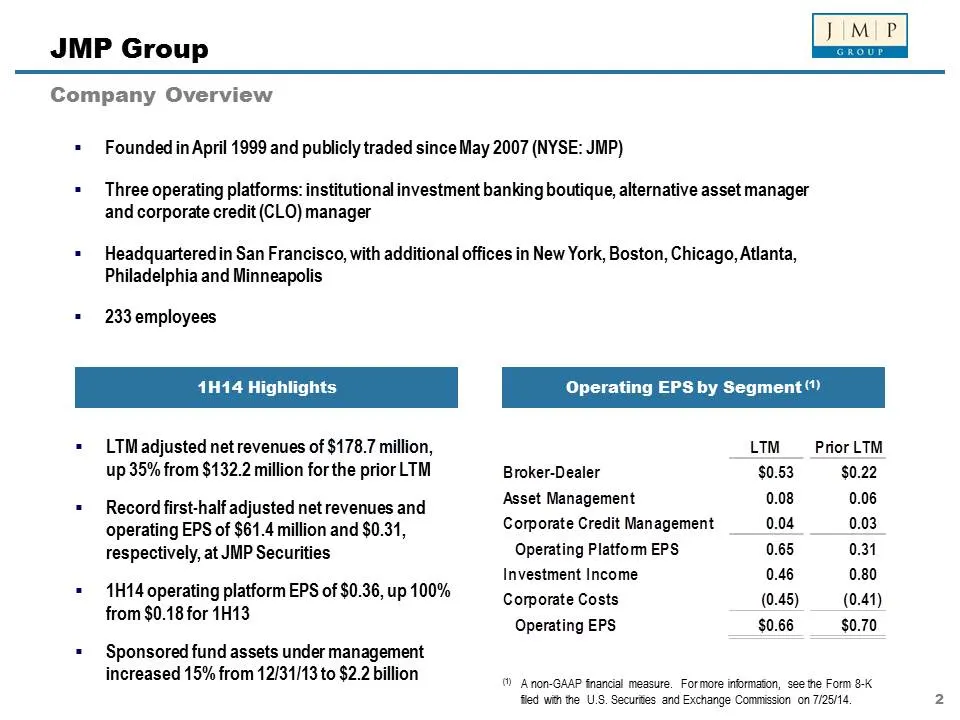
JMP Group Company Overview = Founded in April 1999 and publicly traded since May 2007 (NYSE: JMP) = Three operating platforms: institutional investment banking boutique, alternative asset manager and corporate credit (CLO) manager « Headquartered in San Francisco, with additional offices in New York
Slide 4: Financial Highlights
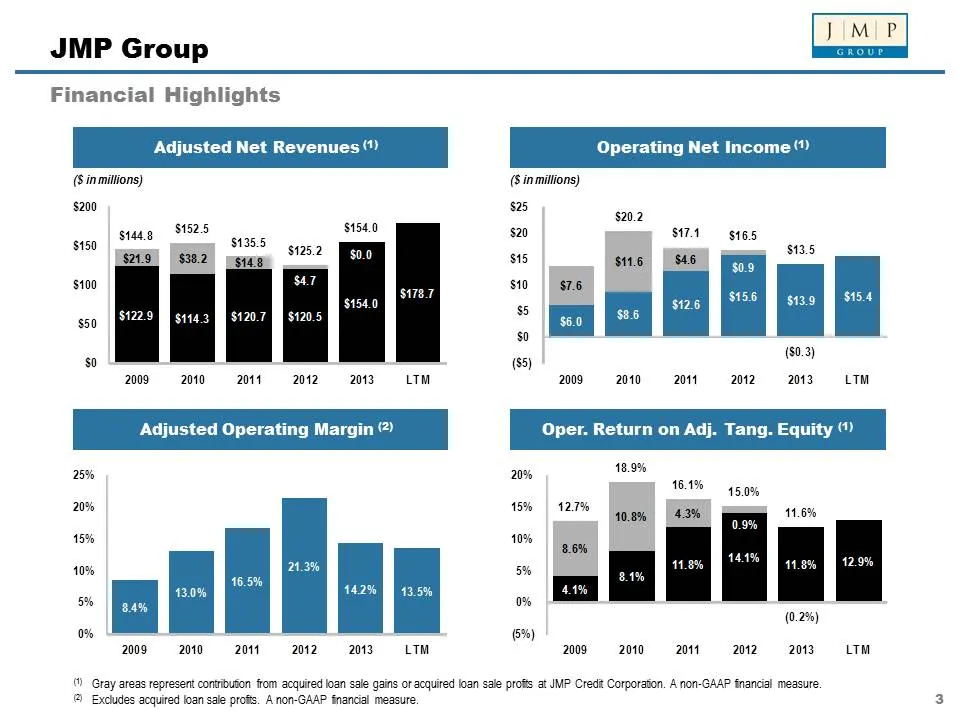
JMP Group Financial Highlights Adjusted Net Revenues“) (6 inmitions) s200 $1825 $154.0 $135.5 “a 2 sue 2? BO $100 ae $154.0 $50 114.3 ff $120.7 so 2009 © 2010» 2042042, 2013 LT M Adjusted Operating Margin @) 25% 20% 15% 10% 13.0% 142% Bh 13.5% om | Pes 0% 2009 20a 20t1 20422013 L TM Operating Net In
Slide 5: Capital Management
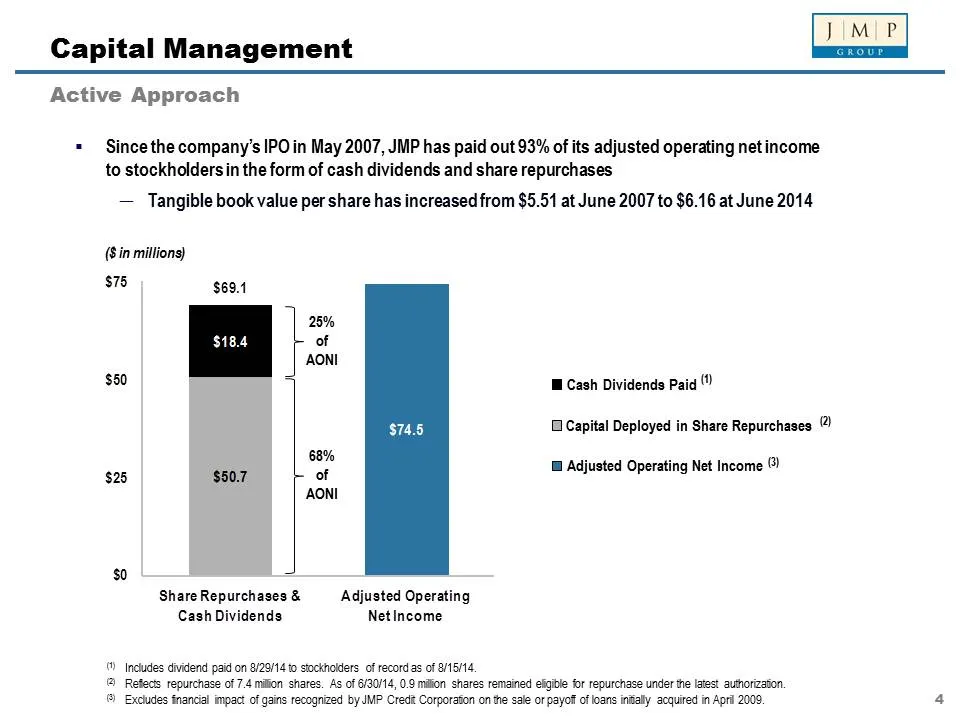
Capital Management Active Approach « — Since the company’s IPO in May 2007, JMP has paid out 93% of its adjusted operating net income to stockholders in the form of cash dividends and share repurchases — Tangible book value per share has increased from $5.51 at June 2007 to $6.16 at June 2014 (8in m
Slide 6: Reorganization Transaction
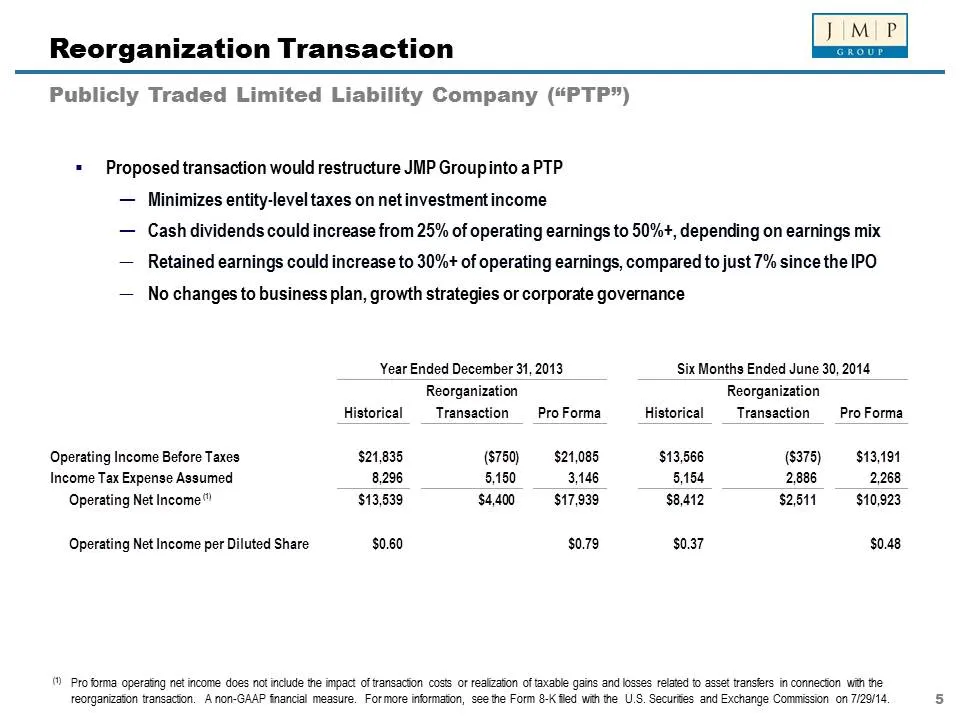
Reorganization Transaction Publicly Traded Limited Liability Company (“PTP”) « Proposed transaction would restructure JMP Groupinto aPTP — Minimizes entity-level taxes on net investment income — Cash dividends could increase from 25% of operating earnings to 50%+, depending on earnings mix — Retaine
Slide 7: Reorganization Transaction
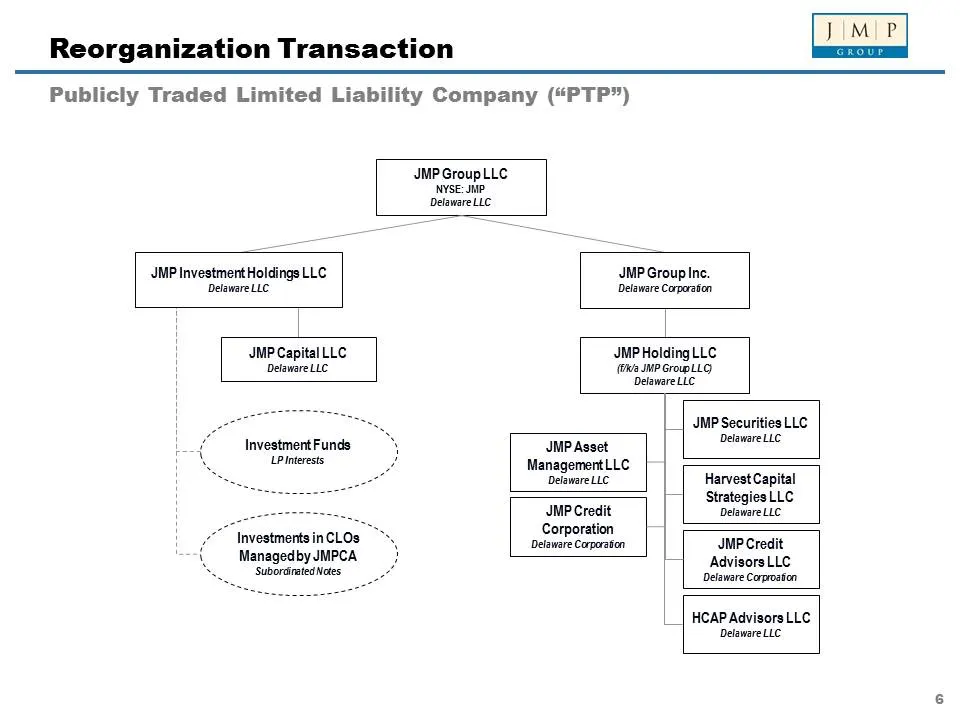
Reorganization Transaction Publicly Traded Limited Liability Company (“PTP”) JMP Investment Holdings LLC DelawareLLC JMPGroupLL¢ NYSE: JMP DelawareLLC JMP Capital LLC DelawareLLC Investment Funds LPinterests Investments in CLOs Managedby JMPCA Suberdrated Noes MP Group Inc. Delaware Carpraton MP Hol
Slide 8: Revenue Growth
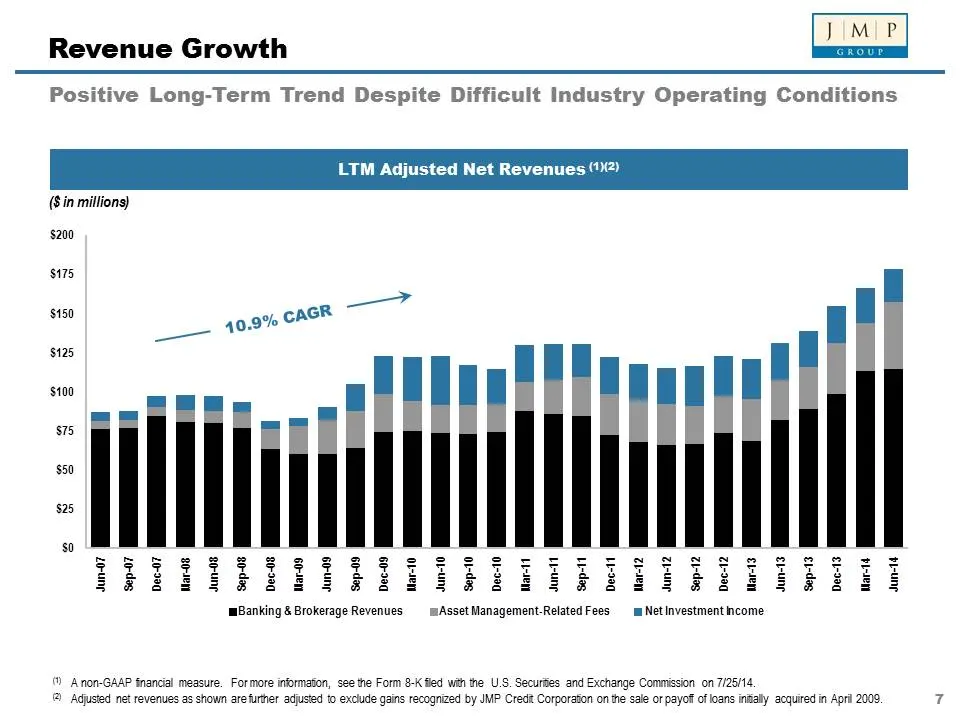
Revenue Growth Positive Long-Term Trend Despite Di icult Industry Operating Conditions LTM Adjusted Net Revenues ()2) ($in millions) ie: $150 40.9% cack _ $100 $50 “ TELELLLLLLIGLLLLLLILLELLLL 28 288 28 GF 2K GF SK FERS KFS FEF KBE SK BES Anon-GAAP fnancial measure. Formore informaion, see the Form
Slide 9: Industry Backdrop
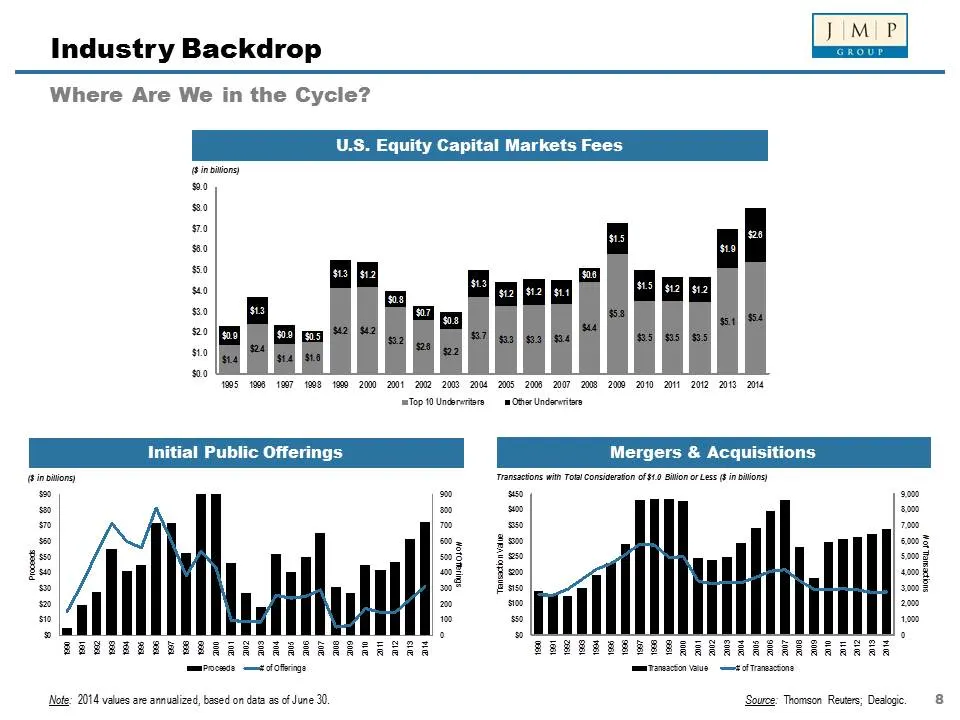
Industry Backdrop Where Are We in the Cycle? ‘905 190 1057 1608 1000 2000 2001 zome 20m 2004 mS 208 z0N7 za 2000 2910 <a 20% aItd ate ‘Top 10 Undrerore Ofer Undswiee Initial Public Offerings Mergers & Acquisitions ‘Tansatons win Tob Consideration $0 Btlon ores (in itions) ERERRGERERERERRRRRRR EERE w
Slide 10: Organic Growth Strategies
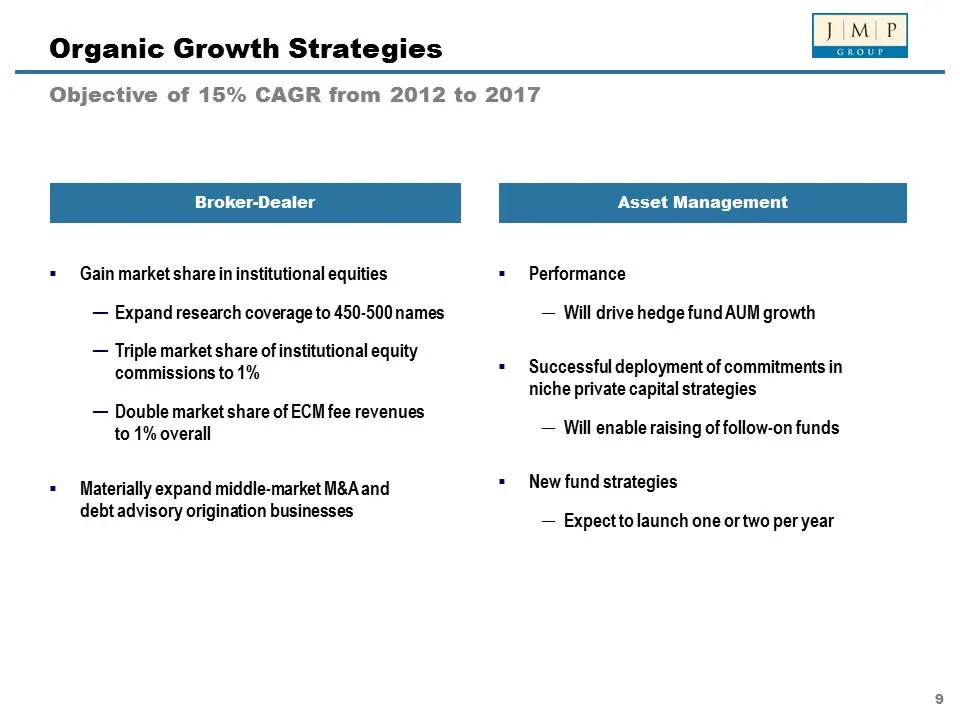
Organic Growth Strategies Objective of 15% CAGR from 2012 to 2017 Broker-Dealer Asset Management «Gain market share in institutional equities — Expand research coverage to 450-500 names — Triple market share of institutional equity commissions to 1% — Double market share of ECM fee revenues to 1% ov
Slide 11: Equity Research
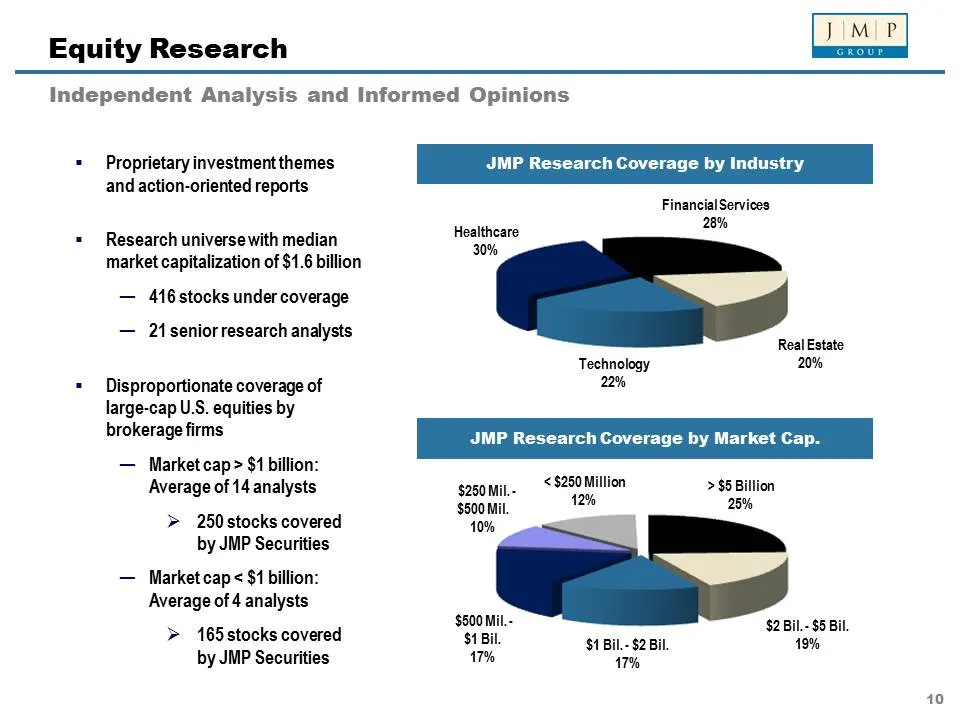
Equity Research Independent Analysis and Informed Opinions = Proprietary investment themes JMP Research Coverage by Industry and action-oriented reports FinancialServices 28% = Research universe with median market capitalization of $1.6 billion — 416 stocks under coverage — 21 senior research analys
Slide 12: Sales & Trading
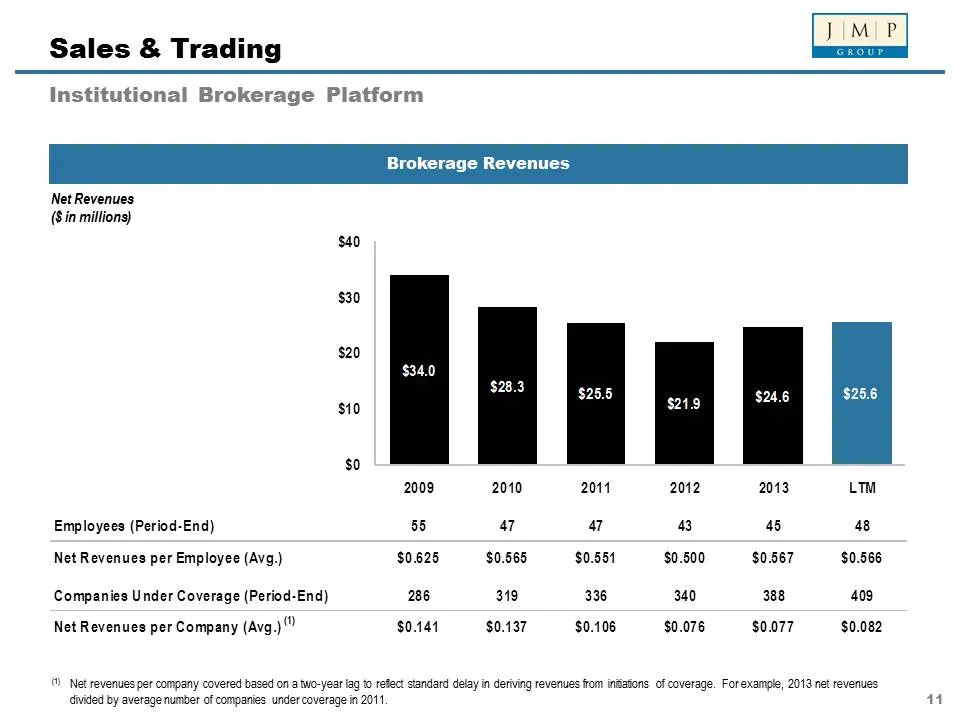
Sales & Trading Institutional Brokerage Platform Brokerage Revenues Net Revenues (Sin millions) $40 $30 $20 $25.5 s10 $0 2009 2010 2014 Employees (Period-End) 55 47 a Net Revenues per Employee (Avg.) $0,625 $0.565 $0.55 Companies Under Coverage (Period-End) 286 319 336 Net Revenues per Company (Avg.
Slide 13: Investment Banking
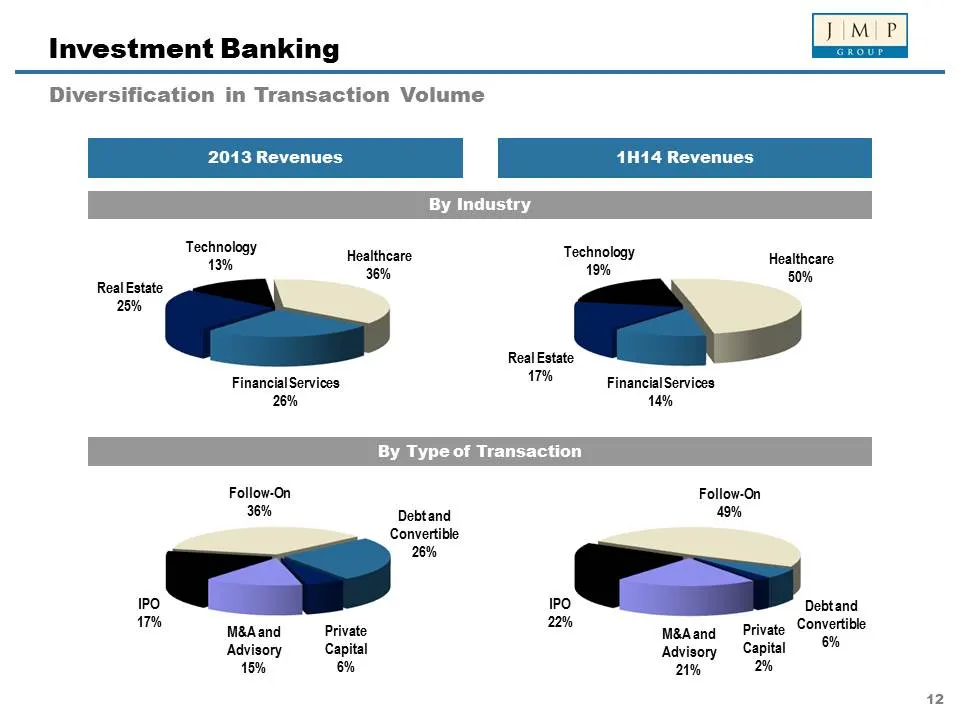
Investment Banking Diversification in Transaction Volume 2013 Revenues 1H14 Revenues Teehnekeay Healthcare Technology Healthcare 13% pe 19% 50% Real Estate 25% RealEstate Financial Services it Financial Services 26% 14% By Type of Transaction Follow-On Follow-On 46% Debtand 49% Convertible 26% |PO I
Slide 14: Investment Banking
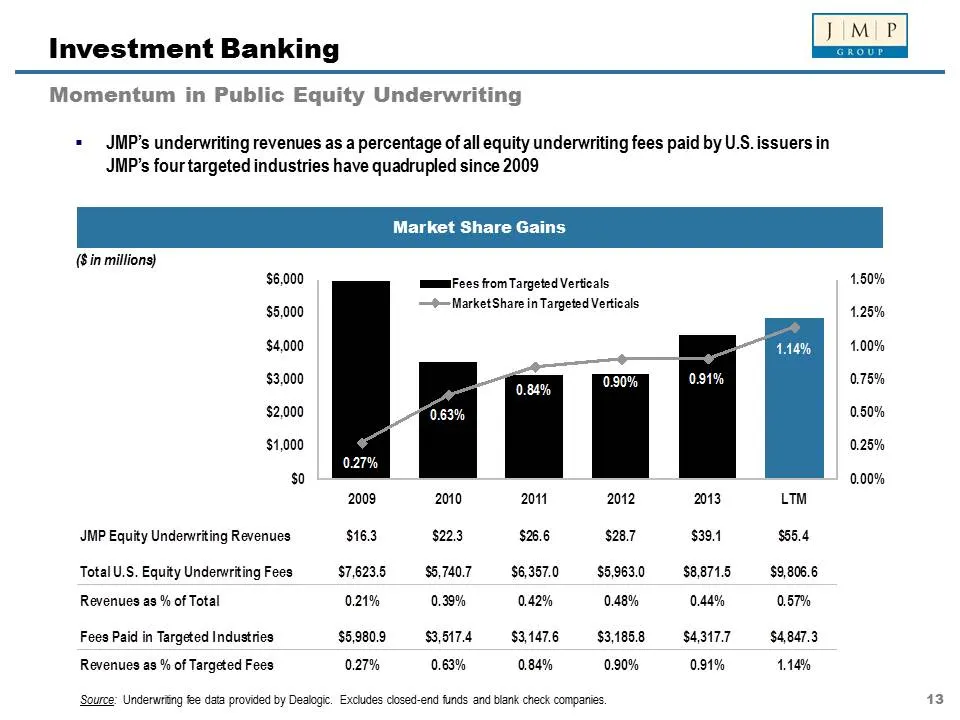
Investment Banking Momentum in Public Equity Underwriting « — JMP’s underwriting revenues as a percentage of all equity underwriting fees paid by U.S. issuers in JMP’s four targeted industries have quadrupled since 2009 Market Share Gains (Sin millions) $6,000 mmmFees from Targeted Verticals sn 000
Slide 15: Investment Banking
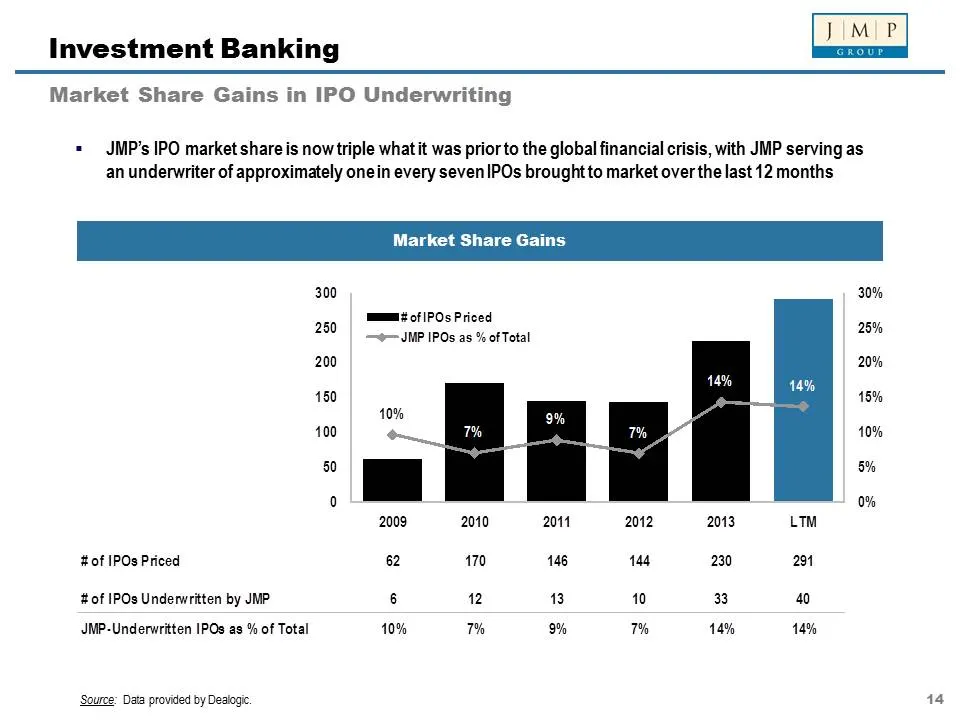
Investment Banking Market Share Gains in IPO Underwriting « — JMP’s IPO market share is now triple what it was prior to the global financial crisis, with JMP serving as an underwriter of approximately onein every seven |IPOs brought to market over the last 12 months Market Share Gains #of IPOs Price
Slide 16: Investment Banking
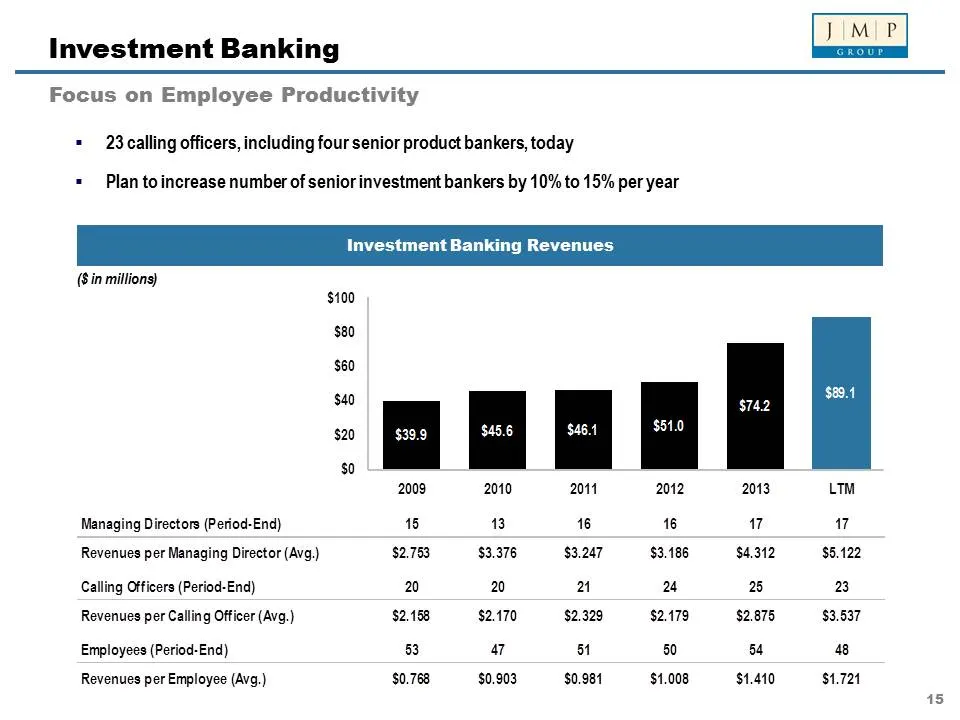
Investment Banking Focus on Employee Productivity « 23 calling officers, including four senior product bankers, today « — Plan to increase number of senior investment bankers by 10% to 15% per year vestment Banking Revenues ($in millions) Managing Directors (Period-End) Revenues per Managing Directo
Slide 17: Asset Management
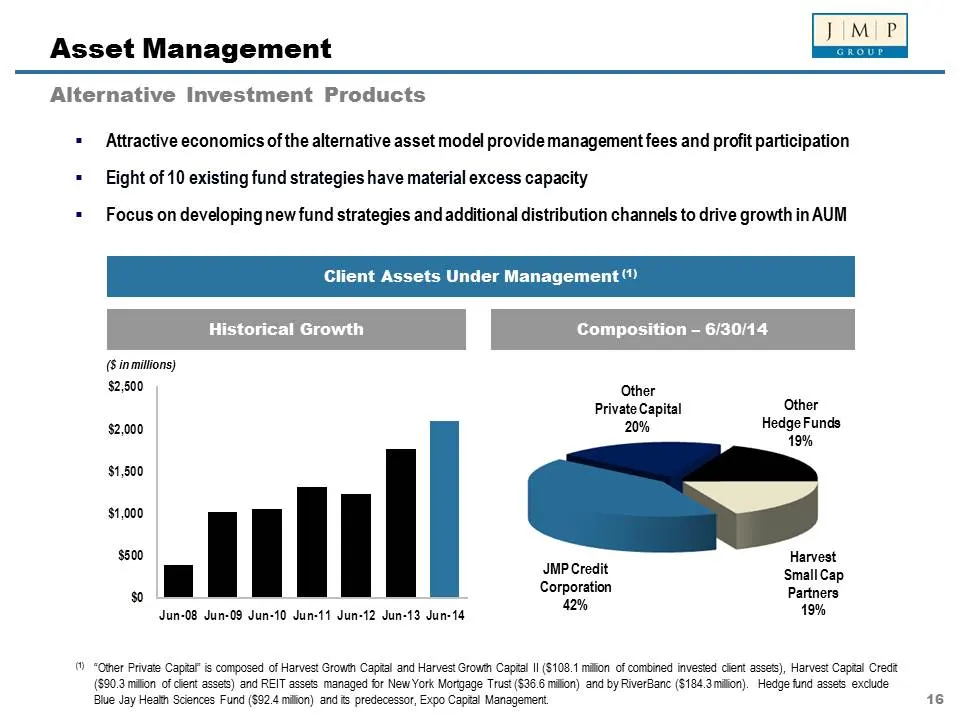
Asset Management Alternative Investment Products « — Attractive economics of the alternative asset model provide management fees and profit participation « — Eight of 10 existing fund strategies have material excess capacity « Focus on developing new fund strategies and additional distribution chann
Slide 18: Asset Management
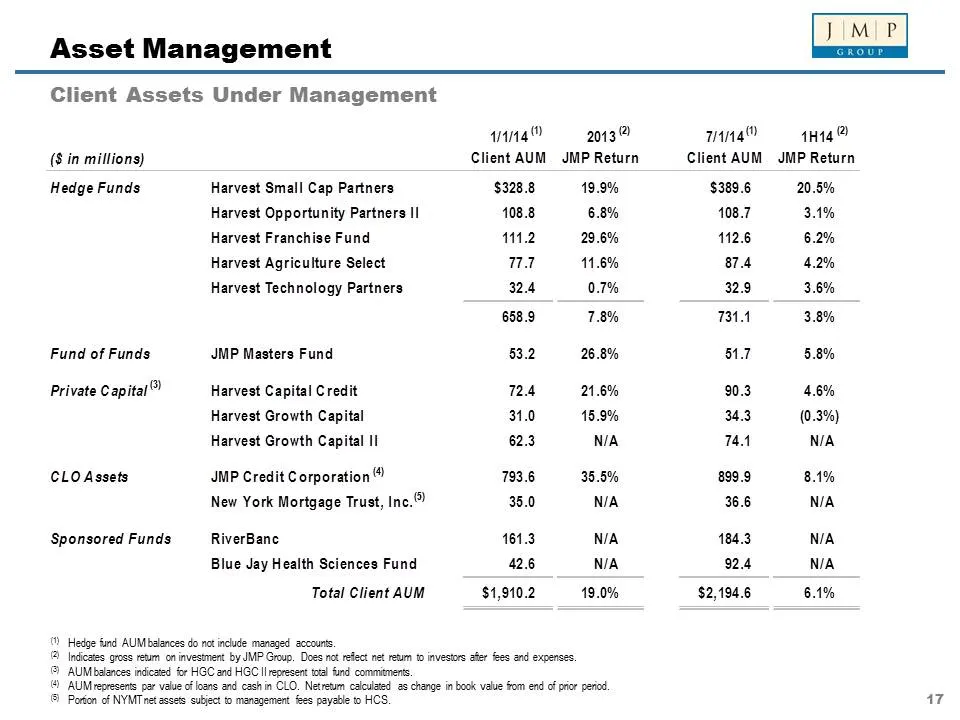
Asset Management Client Assets Under Management wna” 2013” mina” 1H14? ($ in millions) Client AUM JMP Return Client AUM JMP Return Hedge Funds Harvest Small Cap Partners $328.8 19.9% $389.6 20.5% Harvest Opportunity Partners II 108.8 6.8% 108.7 3.1% Harvest Franchise Fund 11.2 29.6% 112.6 6.2% Harve
Slide 19: Revenue Diversification
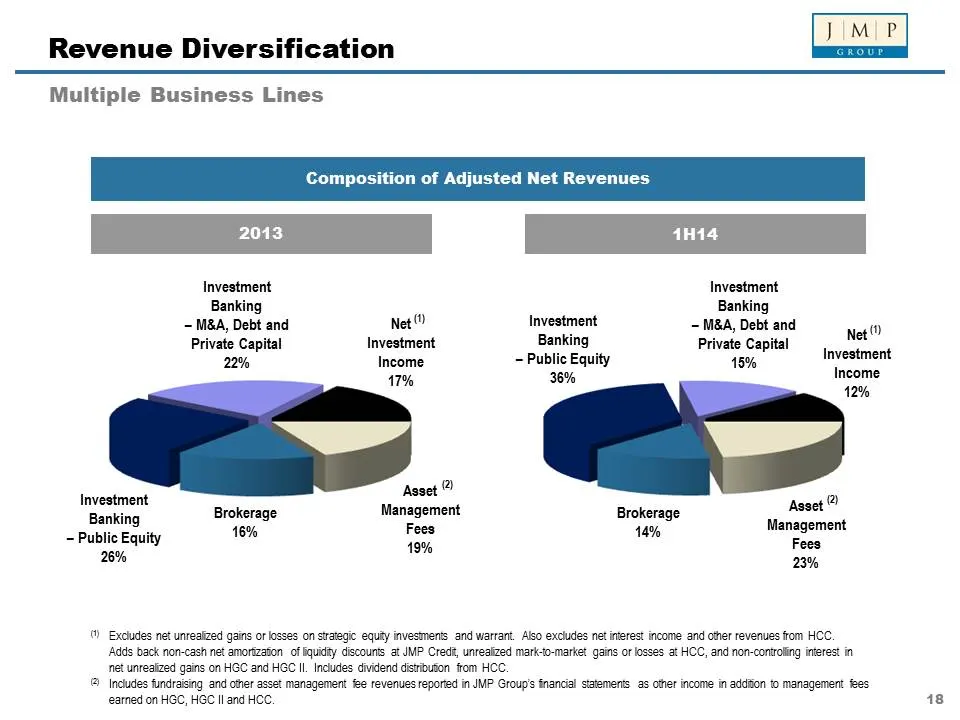
Revenue Diversification Multiple Business Lines Composition of Adjusted Net Revenues Investment Banking - M&A, Debt and Net) Private Capital Investment 22% Income 17% Investment Asset? Barking Brokerage Management ~ Public Equity 16% ed 26% Investment Banking Investment — MBA, Debt and wet‘ Banking
Slide 20: Financial Statements
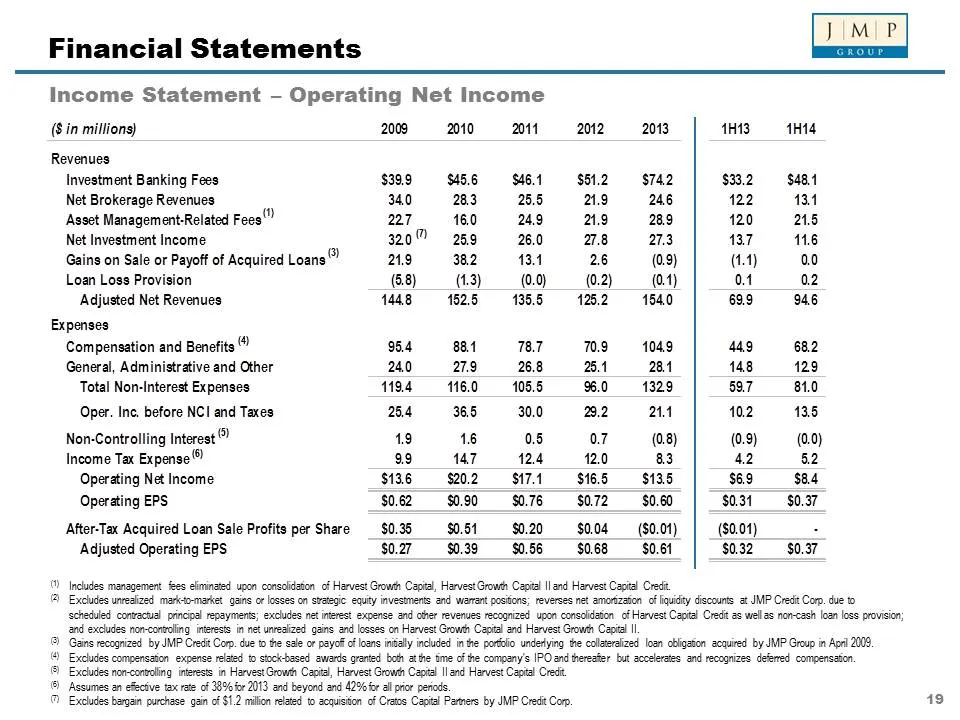
Financial Statements Income Statement - Operating Net Income (8 in millions) 2008-10 Ot 20122013 4H13 1H14 Revenues Investment Banking Fees $329 S56 SHB 85.2 8742 $33.2 $4a4 Net Brokerage Revenues 340-283 58 2KG 12200134 ‘Asset Management-Related Fees” 227 160 24.9 2.9 289 120 215 Net Investment Inc
Slide 21: Financial Statements
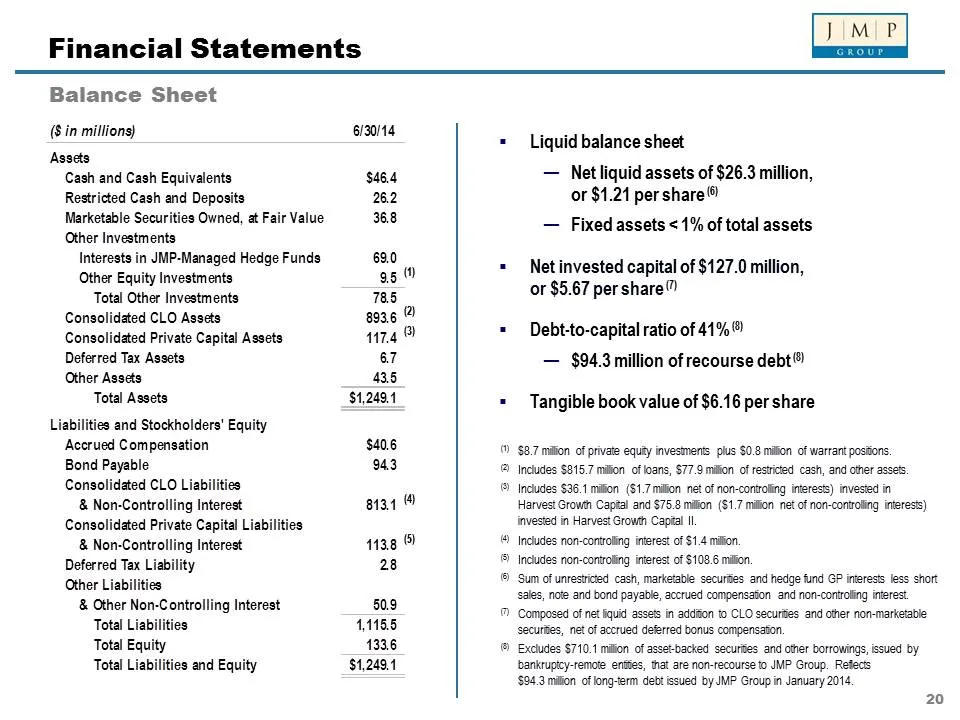
Financial Statements Balance Sheet (8 in millions) Assets Cash and Cash Equivalents Restricted Cash and Deposits Marketable Securities Owned, at Fair Value Other Investments Interests in JMP-Menaged Hedge Funds Other Equity Investments Total Other Investments Consolidated CLO Assets Consolidated Pri
Slide 22: Analysis of Comparable Peers
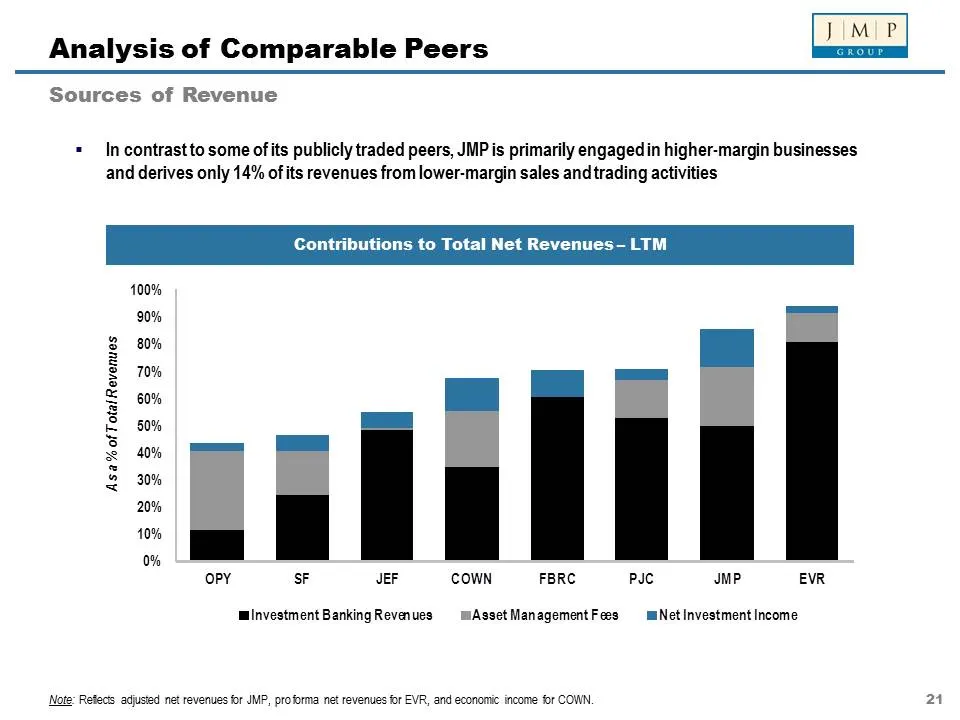
Analysis of Comparable Peers Sources of Revenue « In contrast to some of its publicly traded peers, JMP is primarily engagedin higher-margin businesses and derives only 14% of its revenues from lower-margin sales andtrading activities Contributions to Total Net Revenues - L 100% 90% 80% 70% 60% 50%
Slide 23: Summary
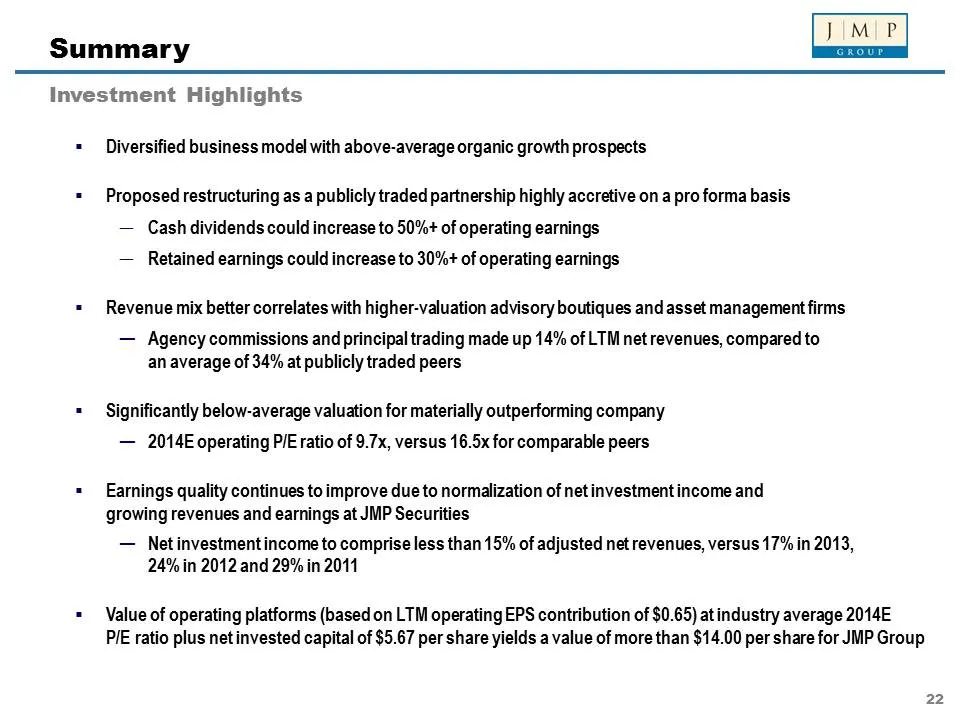
Summary Investment Highlights Diversified business model with above-average organic growth prospects = Proposed restructuring as a publicly traded partnership highly accretive on a pro forma basis — Cash dividends could increase to 50%+ of operating earnings — Retained earnings could increase to 30%
Slide 24: Notices
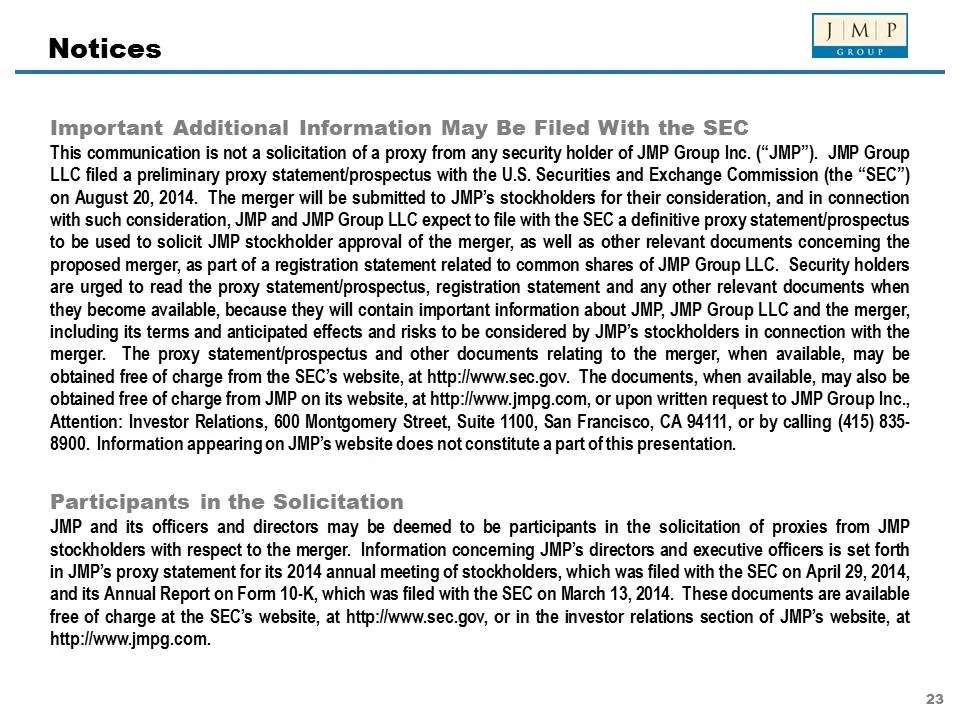
Notices Important Additional Information May Be Filed With the SEC This communication is not a solicitation of a proxy from any security holder of JMP Group Inc. (“JMP”). JMP Group LLC filed a preliminary proxy statement/prospectus with the U.S. Securities and Exchange Commission (the “SEC”) on Augu
Source: SEC EDGAR · 8-K filed Sep 16, 2014