CrossFirst Bankshares — GulfSouth Bank Conference 2023
30 slides from CrossFirst Bankshares's conference presentation, May 5, 2023
Slide 1: GulfSouth Bank Conference
Exhibit 99.1 CROSSFIRST BANKSHARES, INC. GulfSouth Bank Conference May 8, 2023 Mike Maddox, President & CEO Randy Rapp, President, CrossFirst Bank Ben Clouse, CFO Heather Worley, Director of IR
Slide 2: Legal disclaimer
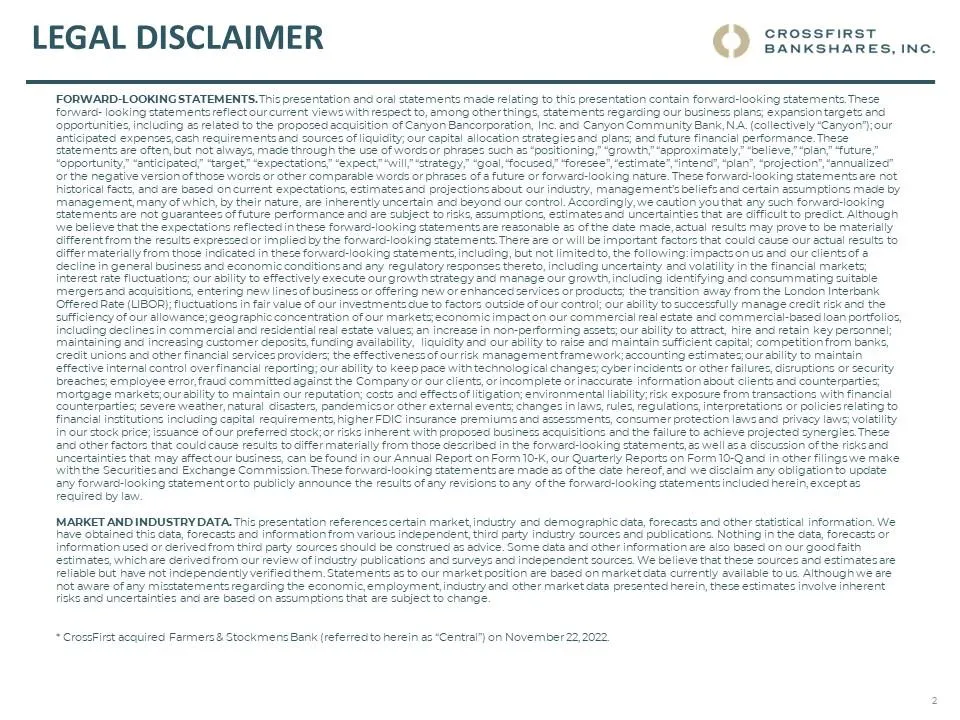
Legal disclaimer CROSSFIRST BANKSHARES, INC. FORWARD -LOOKING STATEMENTS. This presentation and oral statements made relating to this presentation contain forward -looking statements. These forward- looking statements reflect our current views with respect to, among other things, statements regardin
Slide 3: About Non-GAAP Financial Measures
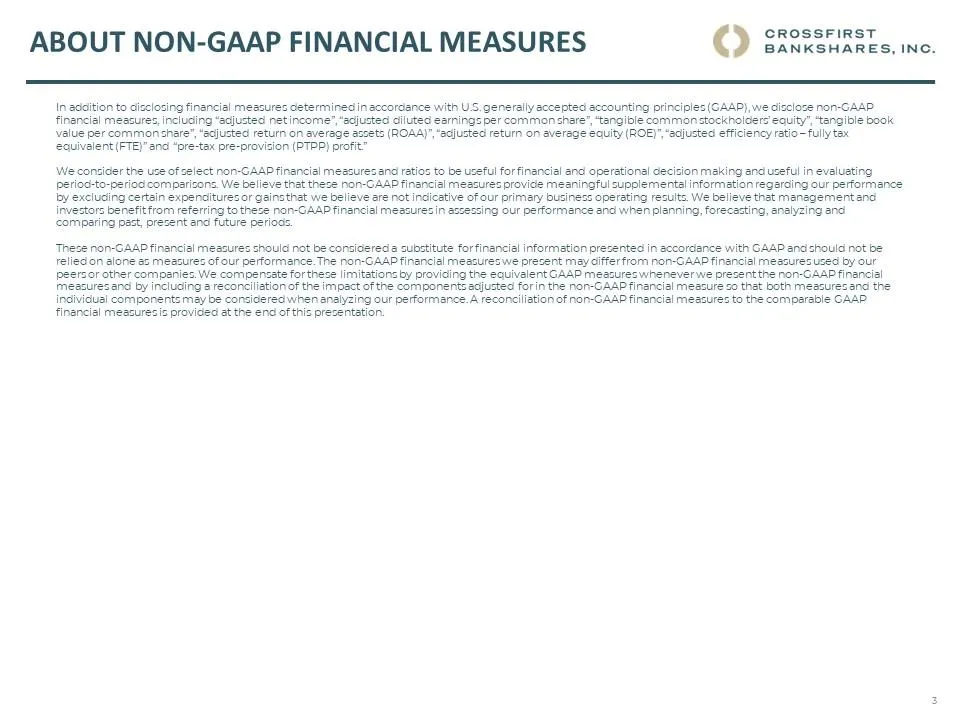
ABOUT NON-GAAP FINANCIAL MEASURES CROSSFIRST BANKSHARES, INC. In addition to disclosing financial measures determined in accordance with U.S. generally accepted accounting principles (GAAP), we disclose non-GAAP financial measures, including “adjusted net income”, “adjusted diluted earnings per comm
Slide 4: Management Team
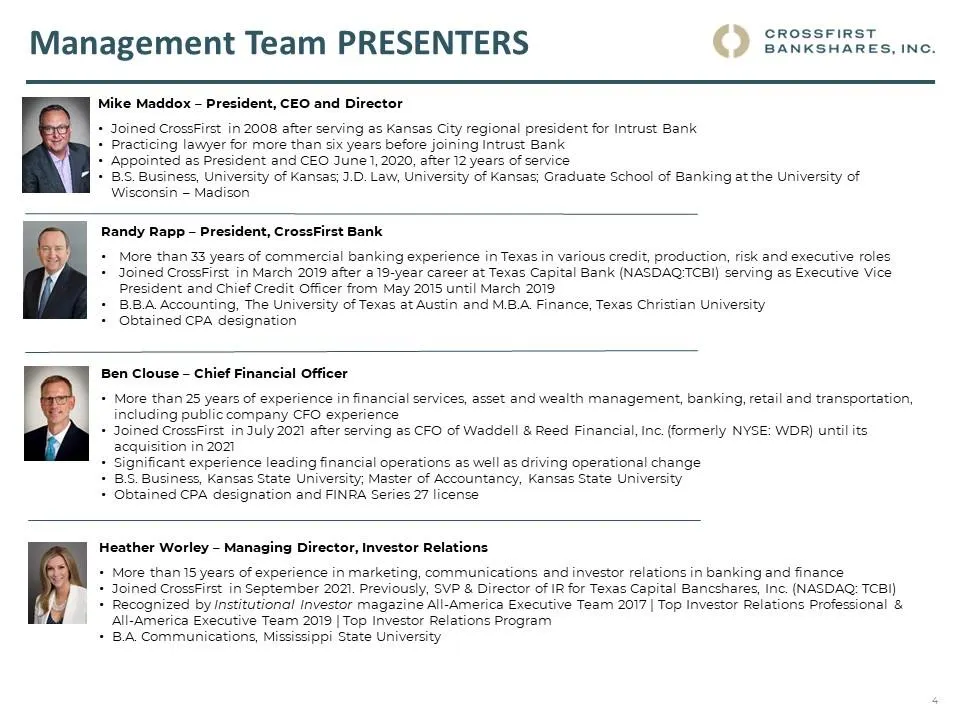
Management Team PRESENTERS CROSSFIRST BANKSHARES, INC. Mike Maddox – President, CEO and Director Joined CrossFirst in 2008 after serving as Kansas City regional president for Intrust Bank Practicing lawyer for more than six years before joining Intrust Bank Appointed as President and CEO June 1, 202
Slide 5: Company Overview
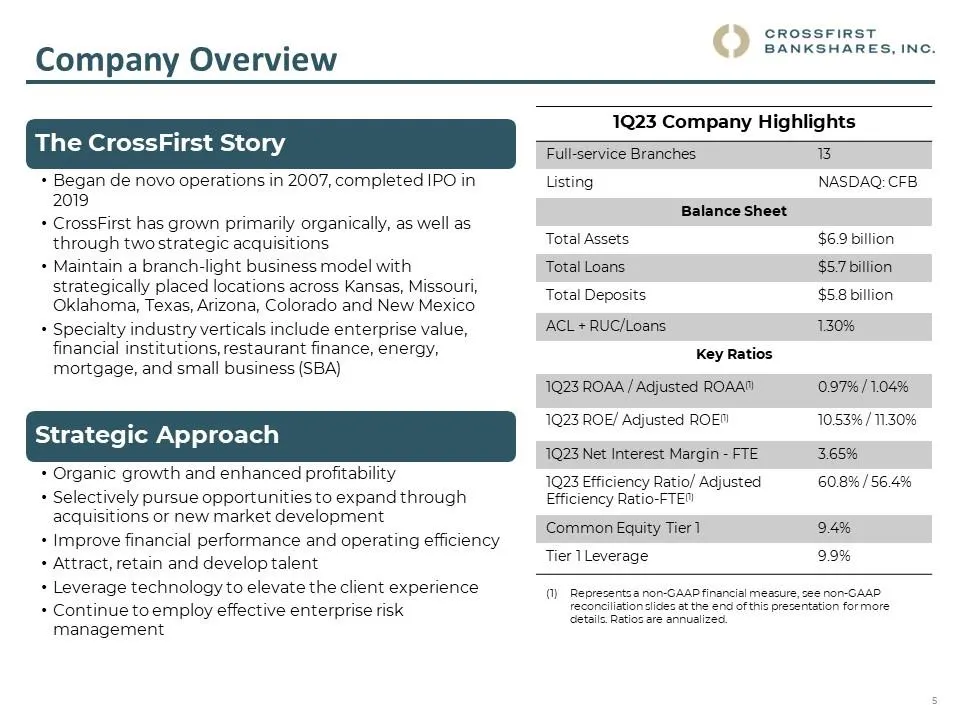
COMPANY OVERVIEW CROSSFIRST BANKSHARES, INC. The CrossFirst Story Began de novo operations in 2007, completed IPO in 2019 CrossFirst has grown primarily organically, as well as through two strategic acquisitions Maintain a branch -light business model with strategically placed locations across Kansa
Slide 6: Footprint and Operating Structure
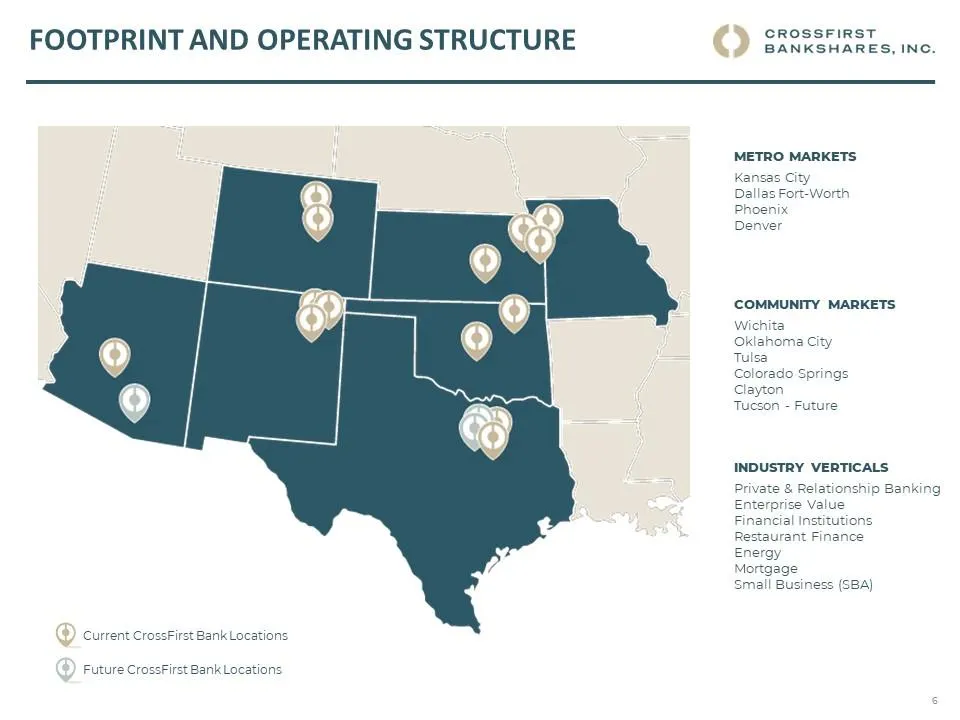
FOOTPRINT AND OPERATING STRUCTURE CROSSFIRST BANKSHARES, INC. METRO MARKETS Kansas City Dallas Fort -Worth Phoenix Denver COMMUNITY MARKETS Wichita Oklahoma City Tulsa Colorado Springs Clayton Tucson – Future INDUSTRY VERTICALS Private & Relationship Banking Enterprise Value Financial Institutions R
Slide 7: Investment Highlights
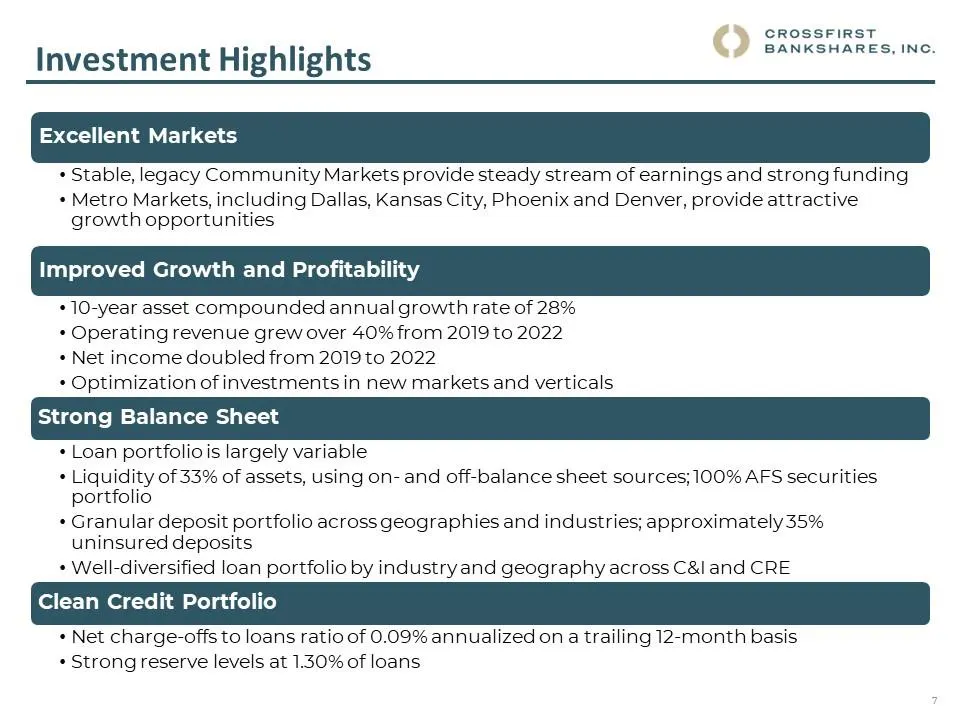
Investment Highlights CROSSFIRST BANKSHARES, INC. Excellent Markets Stable, legacy Community Markets provide steady stream of earnings and strong funding Metro Markets, including Dallas, Kansas City, Phoenix and Denver, provide attractive growth opportunities Improved Growth and Profitability 10-yea
Slide 8: Improving Core Metrics
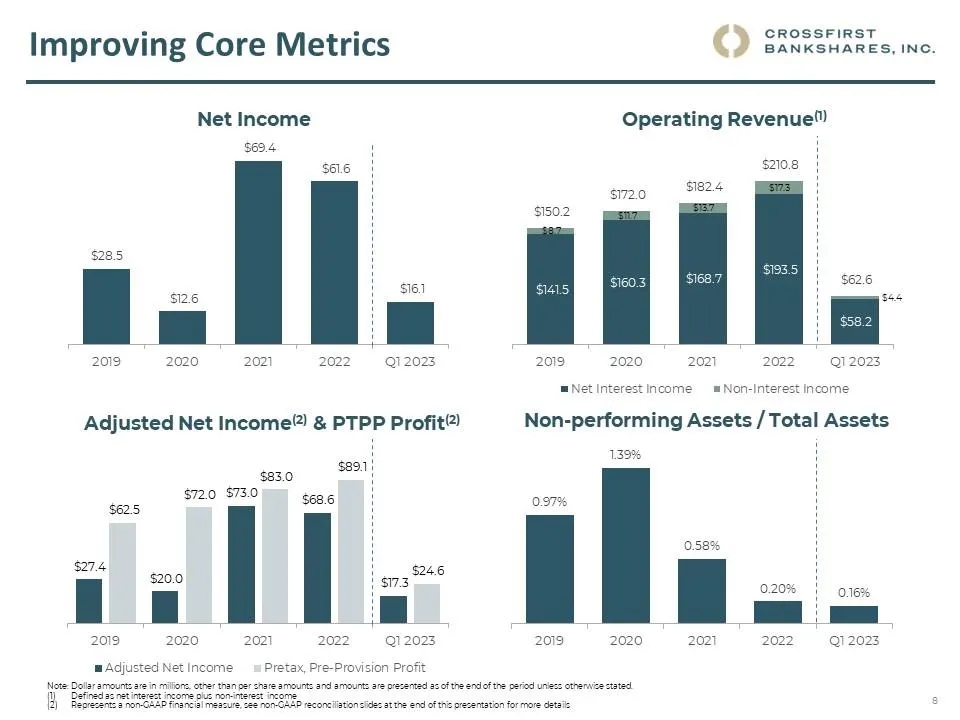
Improving Core Metrics CROSSFIRST BANKSHARES, INC. Net Income $28.5 $12.6 $69.4 $61.6 $16.1 2019 2020 2021 2022 Q1 2023 Operating Revenue (1 $15.2 $172.0 $182.4 $210.8 $62.6 $8.7 $11.7 $13.7 $17.3 $4.4 $141.5 $160.3 $168.7 $193.5 $58.2 2019 2020 2021 2022 Q1 2023 Net Interest Income Non-Interest Inc
Slide 9: Our Growth
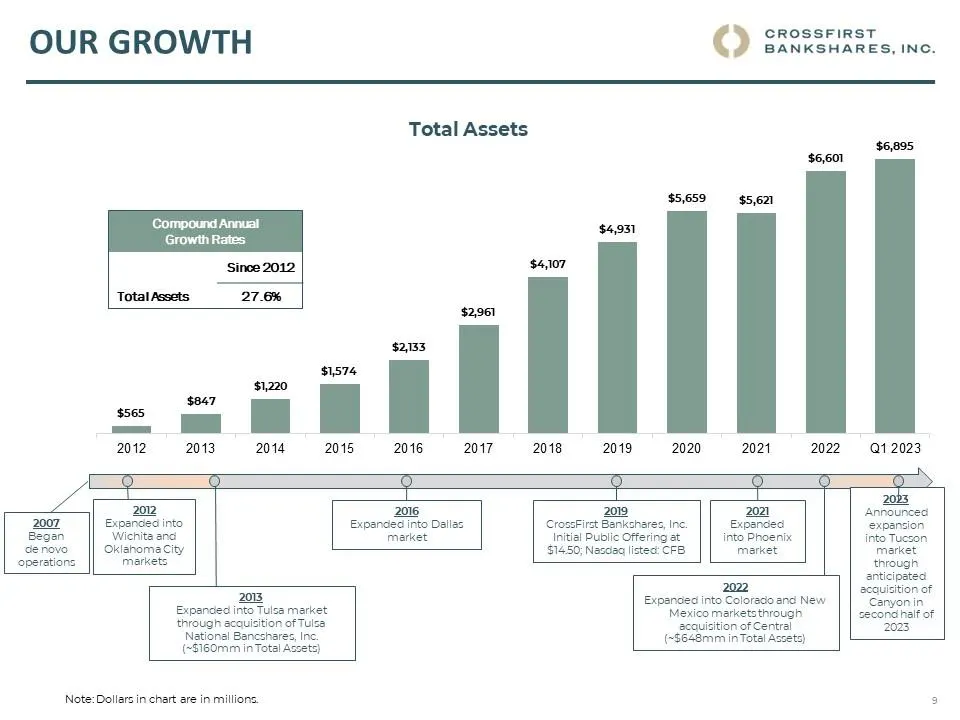
OUR GROWTH CROSSFIRST BANKSHARES, INC. Total Assets Compound Annual Growth Rates Since 2012 Total Assets 27.6% $565 $847 $1,220 $1,574 $2,133 $2,961 $4,107 $4,931 $5,659 $5,621 $6,601 $56,895 2012 2013 2014 2015 2016 2017 2018 2019 2020 2021 2022 Q1 2023 2007 Began de novo operations 2012 Expanded i
Slide 10: Driven by Our Extraordinary Culture
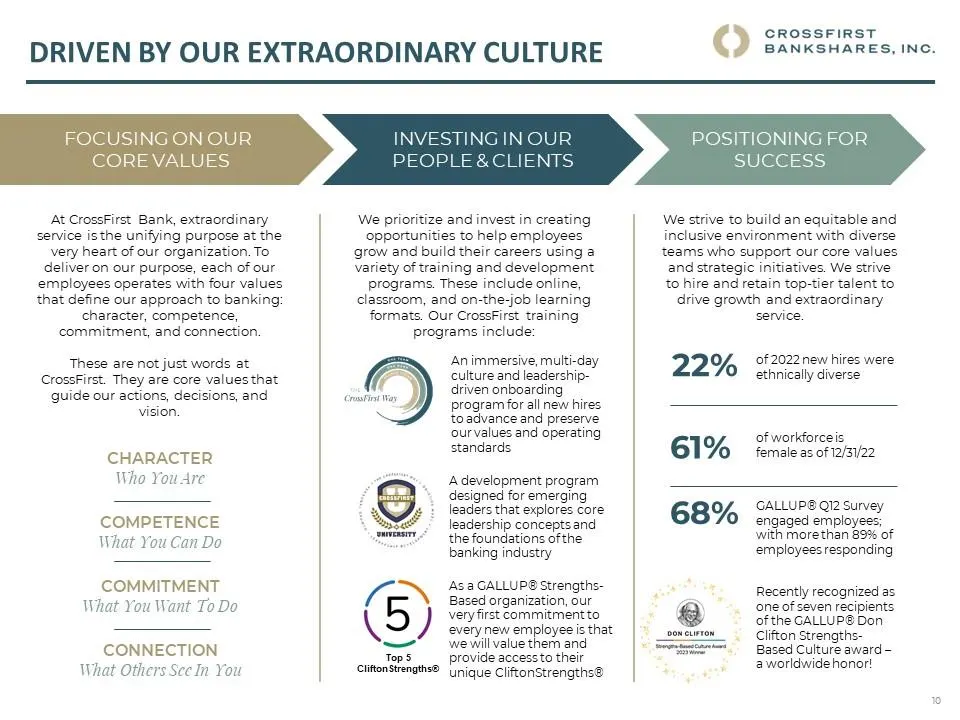
DRIVEN BY OUR EXTRAORDINARY CULTURE CROSSFIRST BANKSHARES, INC. At CrossFirst Bank, extraordinary service is the unifying purpose at the very heart of our organization. To deliver on our purpose, each of our employees operates with four values that define our approach to banking: character, competen
Slide 11: First Quarter 2023 Highlights
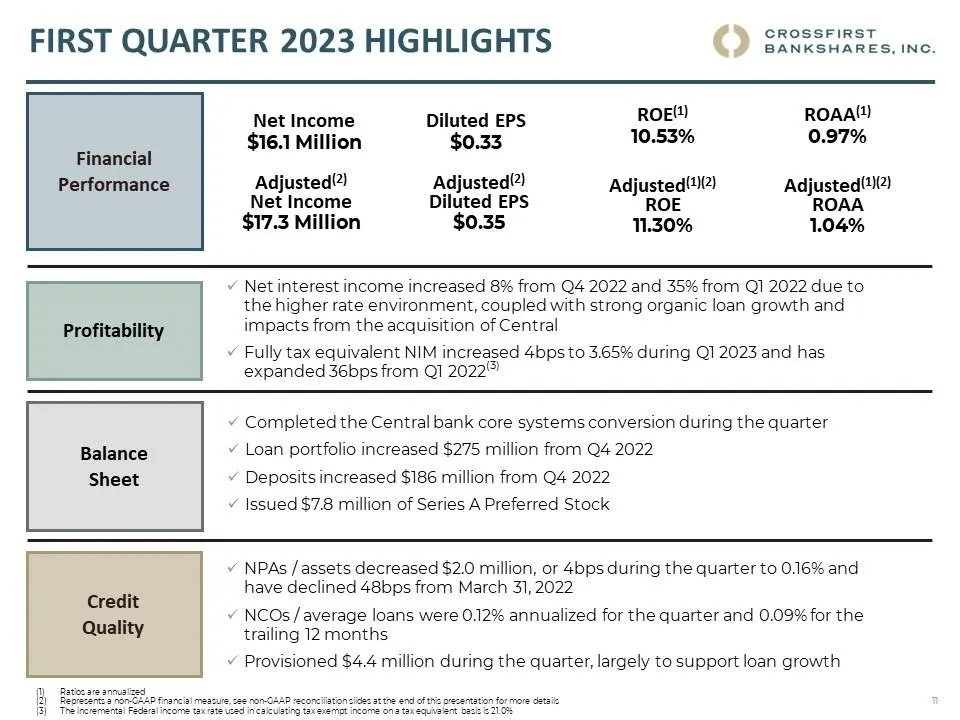
First Quarter 2023 Highlights CROSSFIRST BANKSHARES, INC. Financial Performance Net Income $16.1 Million Adjusted(2) Net Income $17.3 Million Diluted EPS $0.33 Adjusted(2) Diluted EPS $0.35 ROE(1) 10.53% Adjusted(1)(2) ROE 11.30% ROAA(1) 0.97% Adjusted(1)(2) ROAA 1.04% Profitability Net interest inc
Slide 12: Diverse loan portfolio
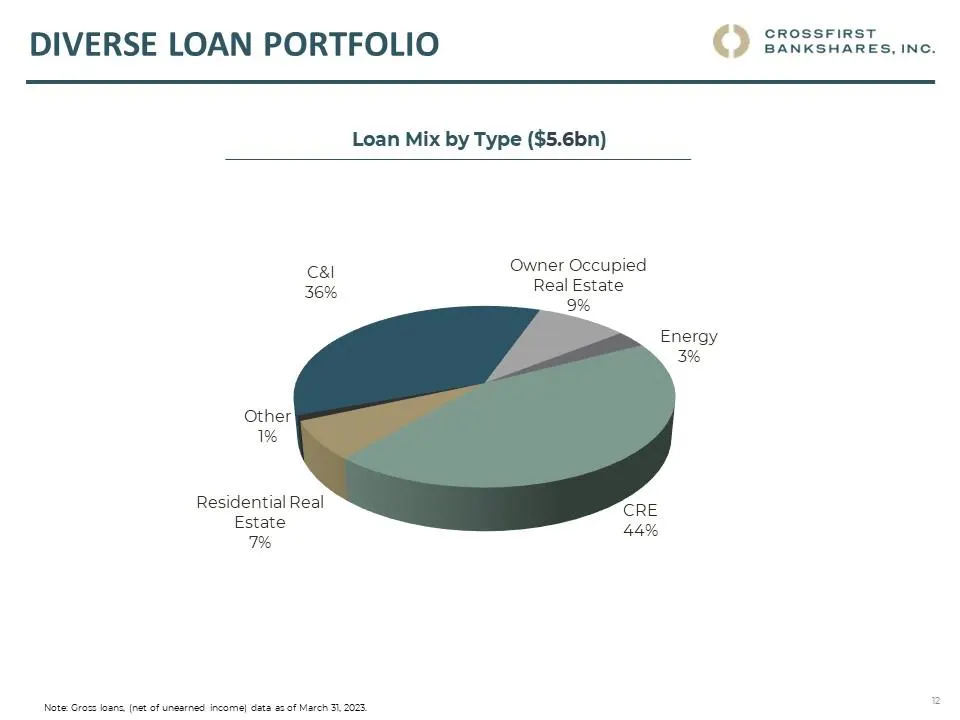
Diverse loan portfolio CROSSFIRST BANKSHARES, INC. Loan Mix by Type ($5.6bn) Owner Occupied Real Estate 9% Energy 3% CRE 44% Residential Real Estate 7% Other 1% C&I 36% Note: Gross loans, (net of unearned income) data as of March 31, 2023. 12
Slide 13: Diverse loan portfolio: CRE and C&I breakdown
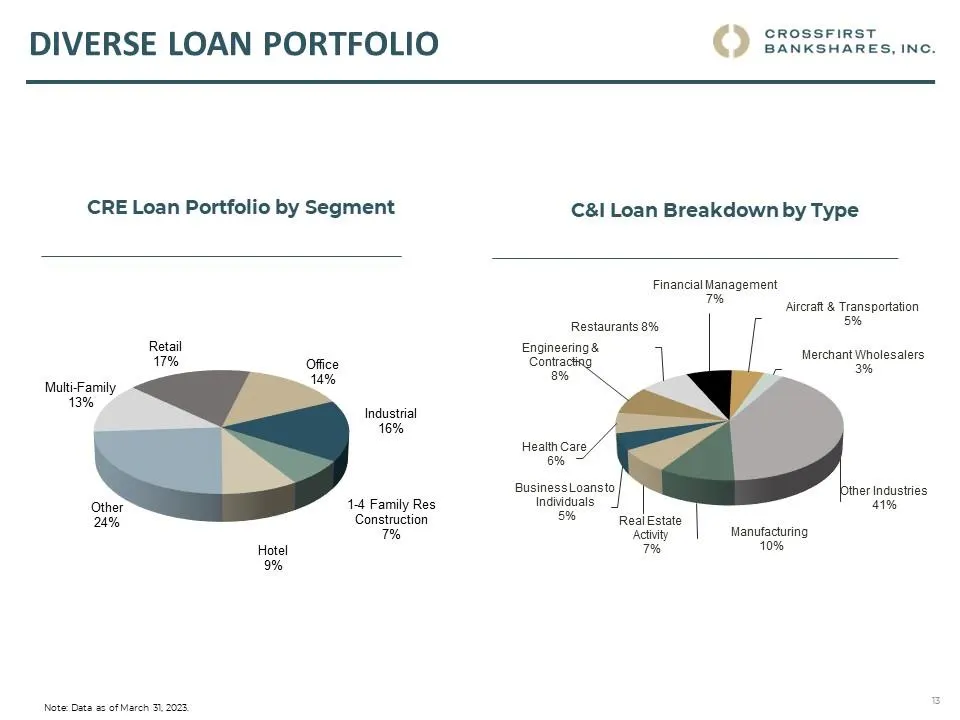
Diverse loan portfolio CROSSFIRST BANKSHARES, INC. CRE Loan Portfolio by Segment Retail 17% Office 14% Industrial 16% 1-4 Family Res Construction 7% Hotel 9% Other 24% Multi-Family 13% C&I Loan Breakdown by Type Financial Management Financial Management 7% Restaurants 8% Engineering & Contracting 8%
Slide 14: Asset Quality Performance
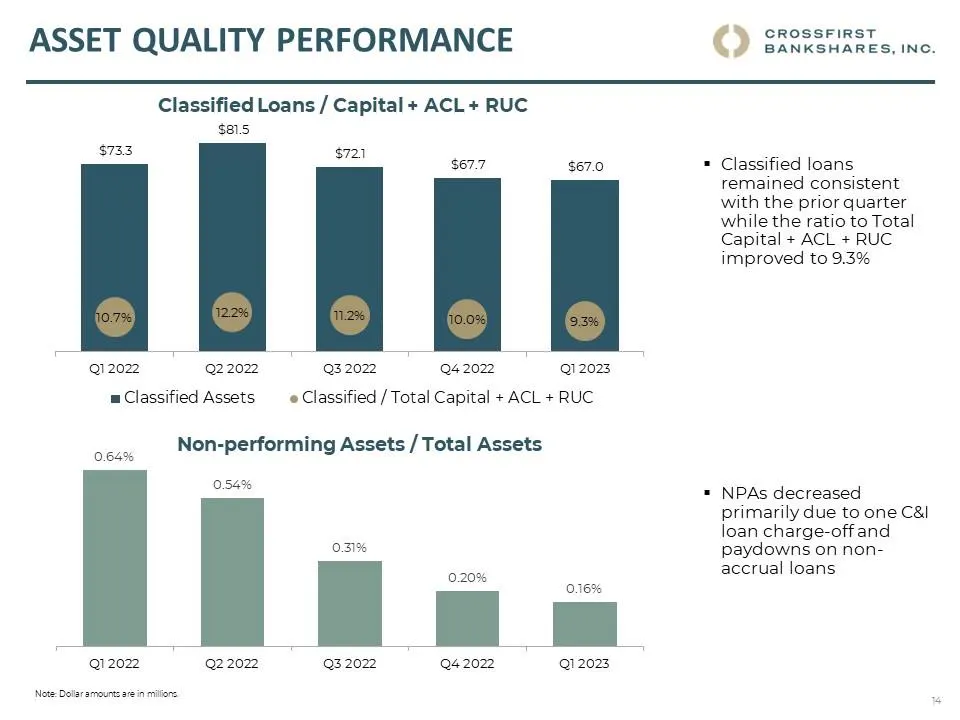
Asset Quality Performance CROSSFIRST BANKSHARES, INC. Classified Loans / Capital + ACL + RUC $73.3 $81.5 $72.1 $67.7 $67.0 10.7% 12.2% 11..2% 10.0% 9.3% Q1 2022 Q2 2022 Q3 2022 Q4 2022 Q1 2023 Classified Assets Classified / Total Capital + ACL + RUC Classified loans remained consistent with the prio
Slide 15: Asset Quality Performance
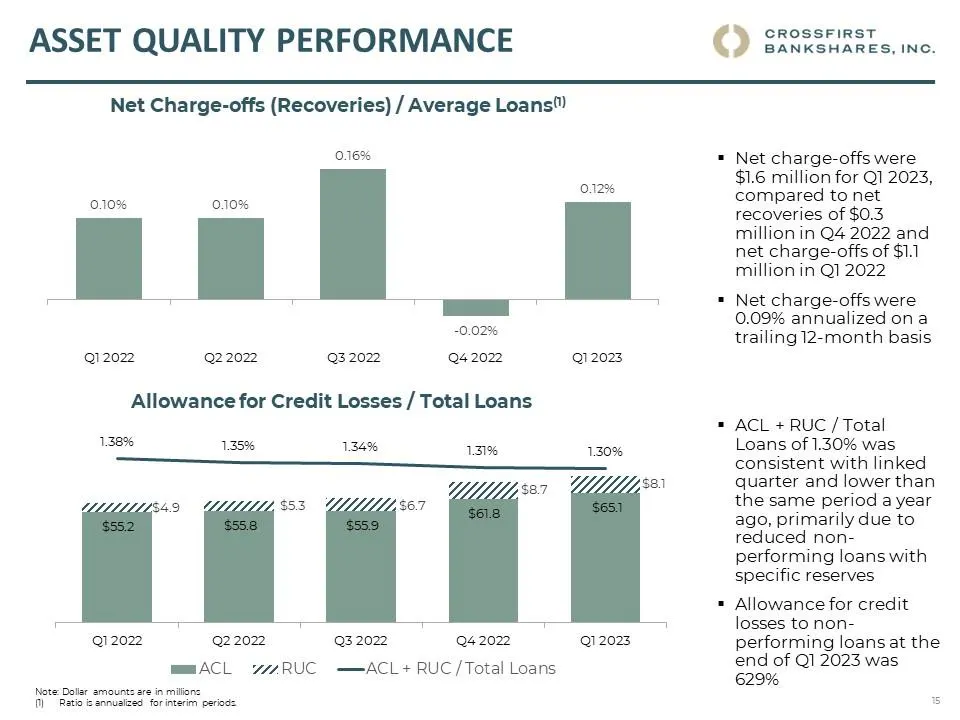
Asset Quality Performance CROSSFIRST BANKSHARES, INC. Net Charge-offs (Recoveries) / Average Loans(1) 0.10% 0.10% 0.16% -0.02% 0.12% Q1 2022 Q2 2022 Q3 2022 Q4 2022 Q1 2023 Net charge-offs were $1.6 million for Q1 2023, compared to net recoveries of $0.3 million in Q4 2022 and net charge -offs of $1
Slide 16: Deposit trends
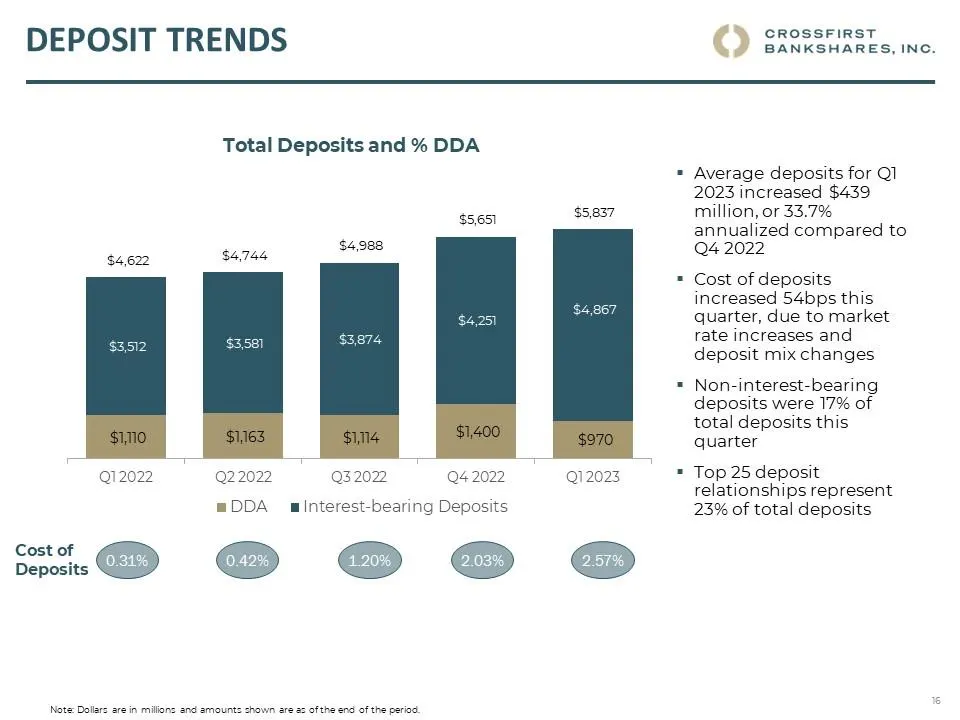
Deposit trends CROSSFIRST BANKSHARES, INC. Total Deposits and % DDA $4,622 $4,744 $4,988 $5,651 $587 $3,512 $3,581 $3,874 $4,251 $4,867 $1,110 $1,163 $1,114 $1,400 $970 Q1 2022 Q2 2022 Q3 2022 Q4 2022 Q1 2023 DDA Interest-bearing Deposits Average deposits for Q1 2023 increased $439 million, or 33.7%
Slide 17: Deposit diversity & Characteristics
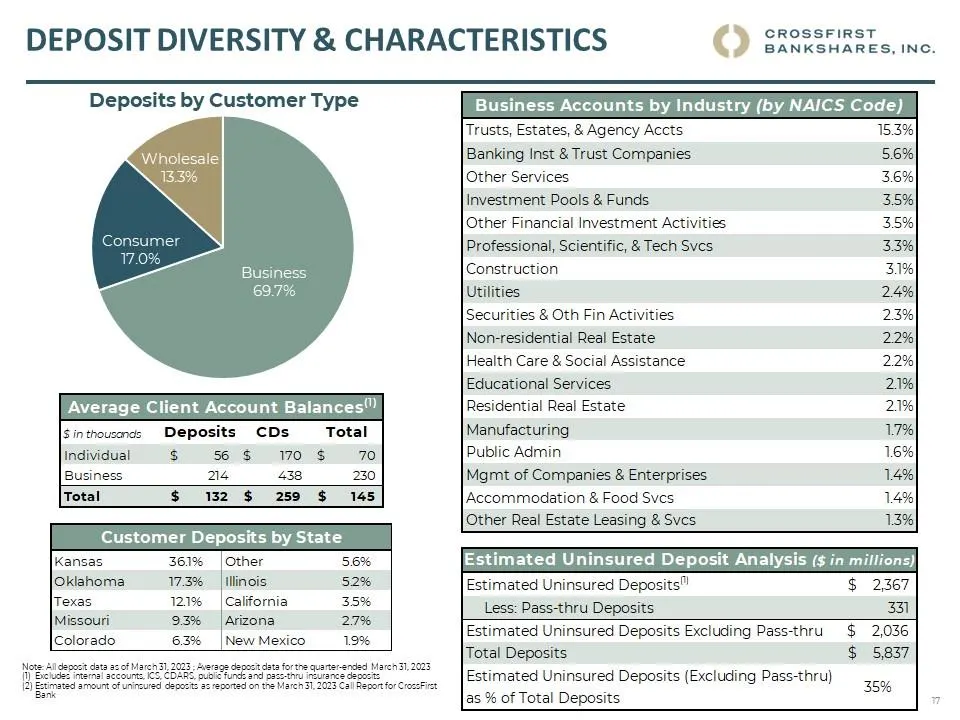
Deposit diversity & Characteristics CROSSFIRST BANKSHARES, INC. Deposits by Customer Type Wholesale 13.3% Business 69.7% Consumer 17.0% Average Client Account Balances(1) $ in thousands Deposits CDs Total individual $ 56 $ 170 $ 70 Business 214 438 230 Total $ 132 $ 259 $ 145 Customer Deposits by St
Slide 18: Net Interest Margin
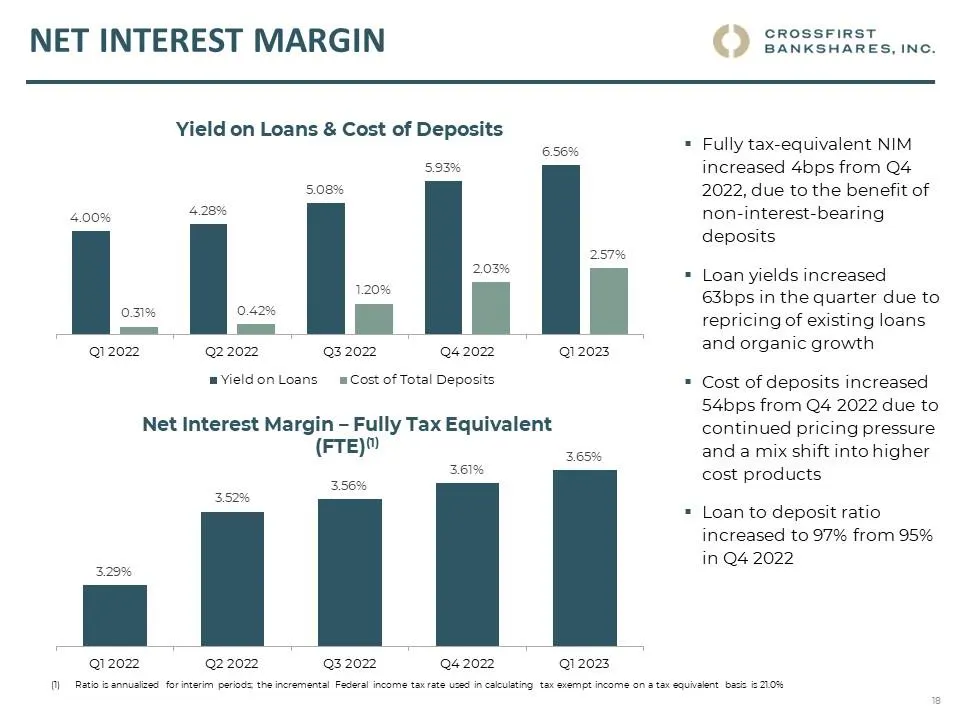
Net Interest Margin CROSSFIRST BANKSHARES, INC. Yield on Loans & Cost of Deposits 4.00% 0.31% 4.28% 0.42% 5.08% 1.20% 5.93% 2.03% 6.56% 2.57% Q1 2022 Q2 2022 Q3 2022 Q4 2022 Q1 2023 Yield on Loans Cost of Total Deposits Net Interest Margin – Fully Tax Equivalent (FTE)(1) 3.29% 3.52% 3.56% 3.61% 3.65
Slide 19: Net Interest Income Sensitivity
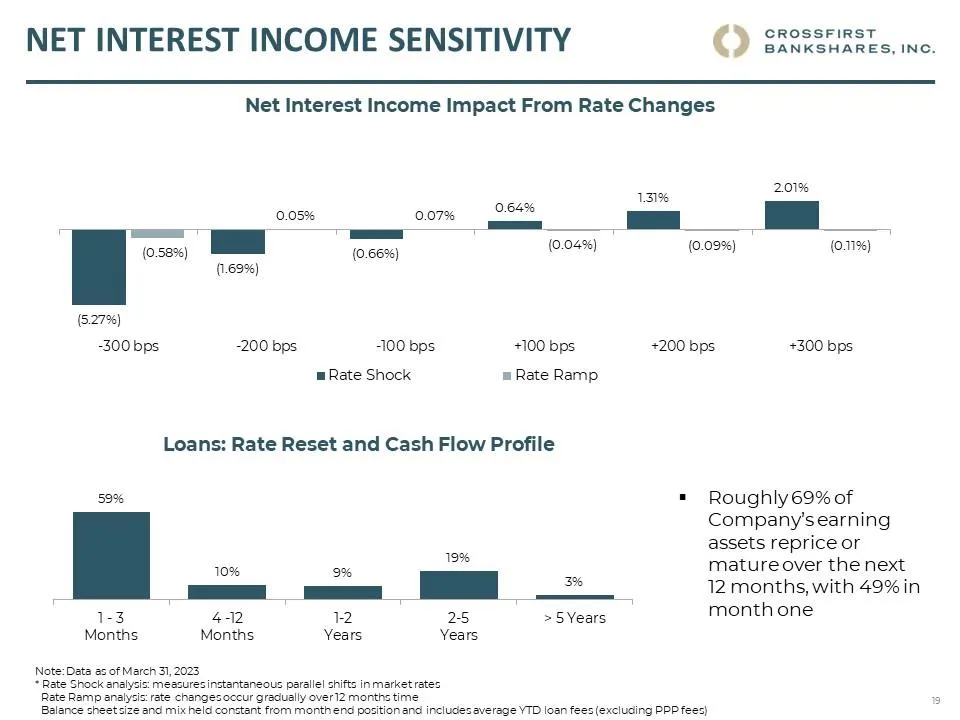
Net Interest Income Sensitivity CROSSFIRST BANKSHARES, INC. Net Interest Income Impact From Rate Changes (5.27)% (0.58)% (1.69)% 0.05% (0.66)% 0.07% 0.64% (0.04)% 1.31% (0.09)% 2.01% (11.00)% -300 bps -200 bps -100 bps 100+ bps 200+ bps 300+ bps Rate Shock Rate Ramp Loans: Rate Reset and Cash Flow P
Slide 20: Expense Management
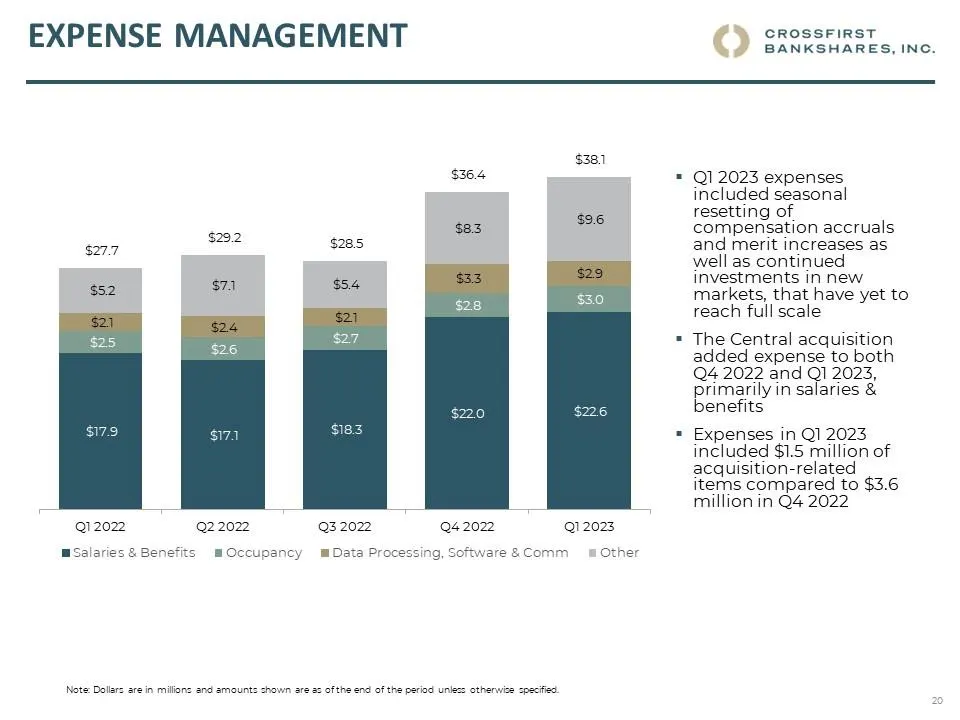
expense management CROSSFIRST BANKSHARES, INC. $27.7 $29.2 $28.5 $36.4 $38.1 $7.1 $5.4 $8.3 $9.6 $5.2 $2.1 $2.4 $2.1 $3.3 $2.9 $2.5 $2.6 $2.7 $2.8 $3.0 $17.9 $17.1 $18.3 $22.0 $22.6 Q1 2022 Q2 2022 Q3 2022 Q4 2022 Q1 2023 Salaries & Benefits Occupancy Data Processing, Software & Comm Other Q1 2023 e
Slide 21: Ample Liquidity and Flexibility
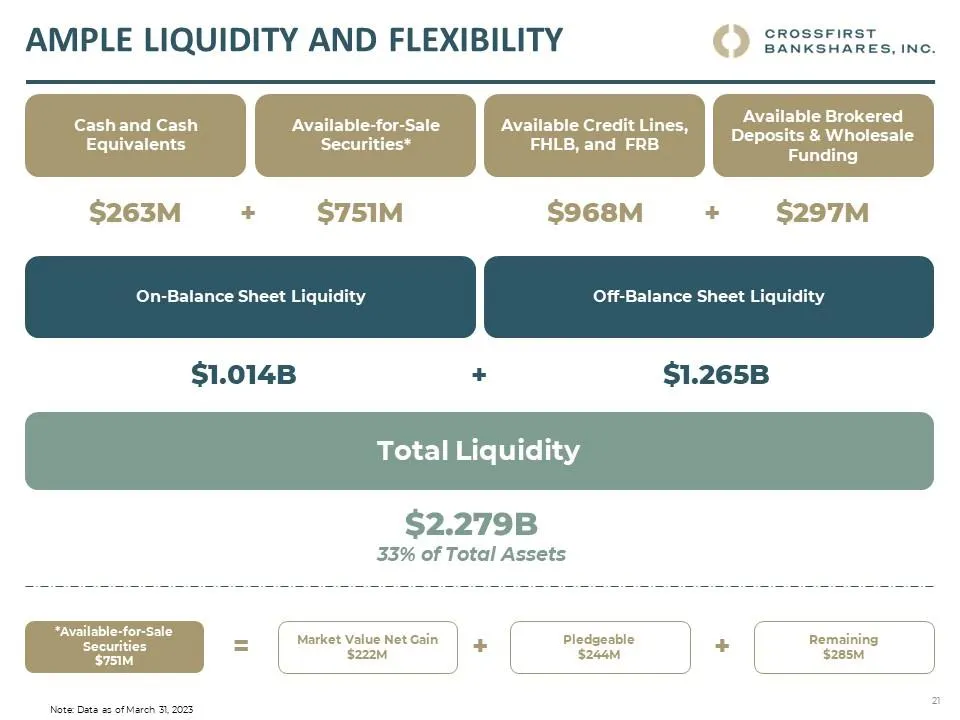
Ample LIQUIDITY and flexibility CROSSFIRST BANKSHARES, INC. Cash and Cash Equivalents $263 M + Available-for-Sale Securities* $751 M Available Credit Lines, FHLB, and FRB $968 Available Brokered Deposits & Wholesale Funding $297M On -Balance Sheet Liquidity Off-Balance Sheet Liquidity $1.014B + $1.2
Slide 22: Securities portfolio
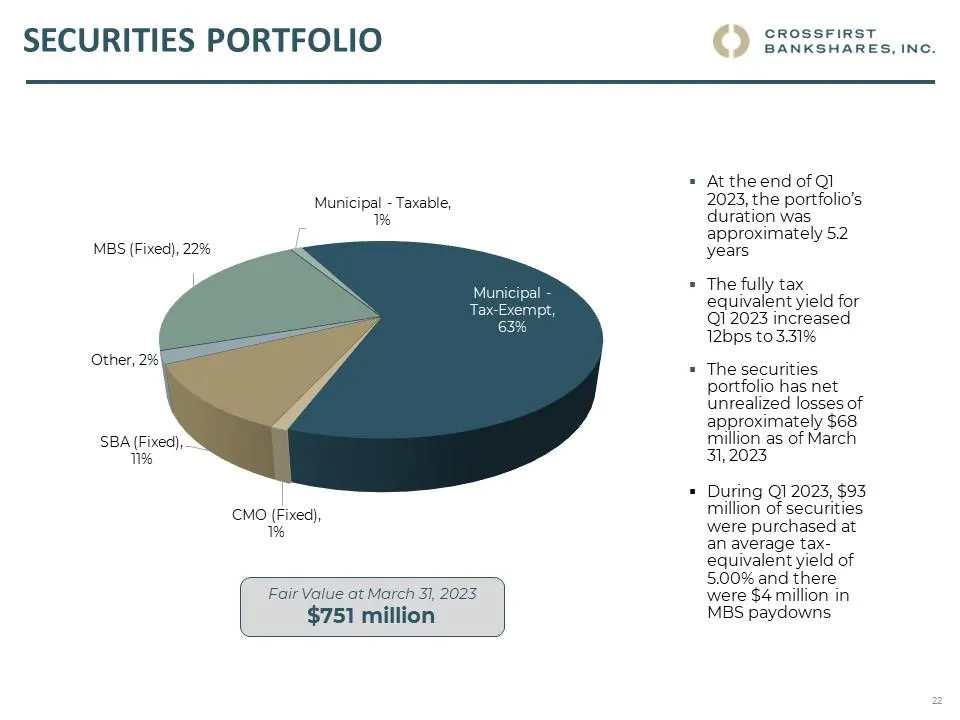
CROSSFIRST BANKSHARES, INC. Securities portfolio Municipal - Taxable, 1% Municipal - Tax-Exempt, 63% CMO (Fixed), 1% SBA (Fixed), 11% Other, 2% MBS (Fixed), 22% Fair Value at March 31, 2023 $751 million At the end of Q1 2023, the portfolio’s duration was approximately 5.2 years The fully tax equival
Slide 23: Capital Ratios
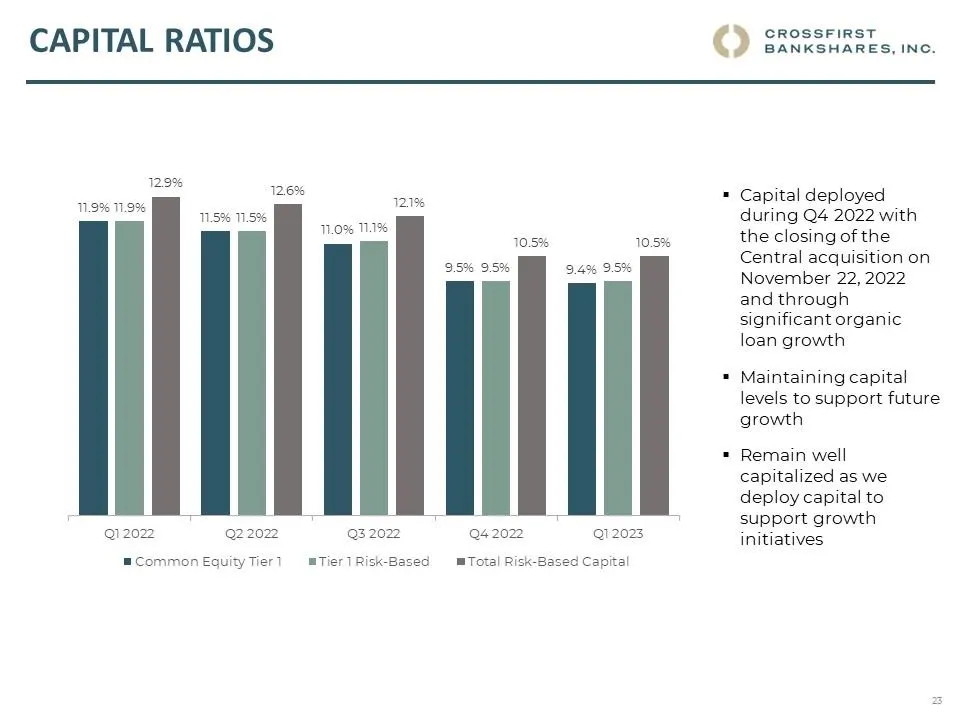
CAPITAL RATIOS CROSSFIRST BANKSHARES, INC. 11.9% 11.9% 12.9% 11.5% 11.5% 12.6% 11.0% 11.1% 12.1% 9.5% 9.5% 10.5% 9.4% 9.5% 10.5% Q1 2022 Q2 2022 Q3 2022 Q4 2022 Q1 2023 Common Equity Tier 1 Tier 1 Risk-Based Total Risk-Based Capital Capital deployed during Q4 2022 with the closing of the Central acq

Slide 24: Acquisition of Canyon Bancorporation, Inc.
CROSSFIRST BANKSHARES, INC. NASDAQ: CFB Acquisition of Canyon Bancorporation, Inc.
Slide 25: Canyon Overview & Rationale
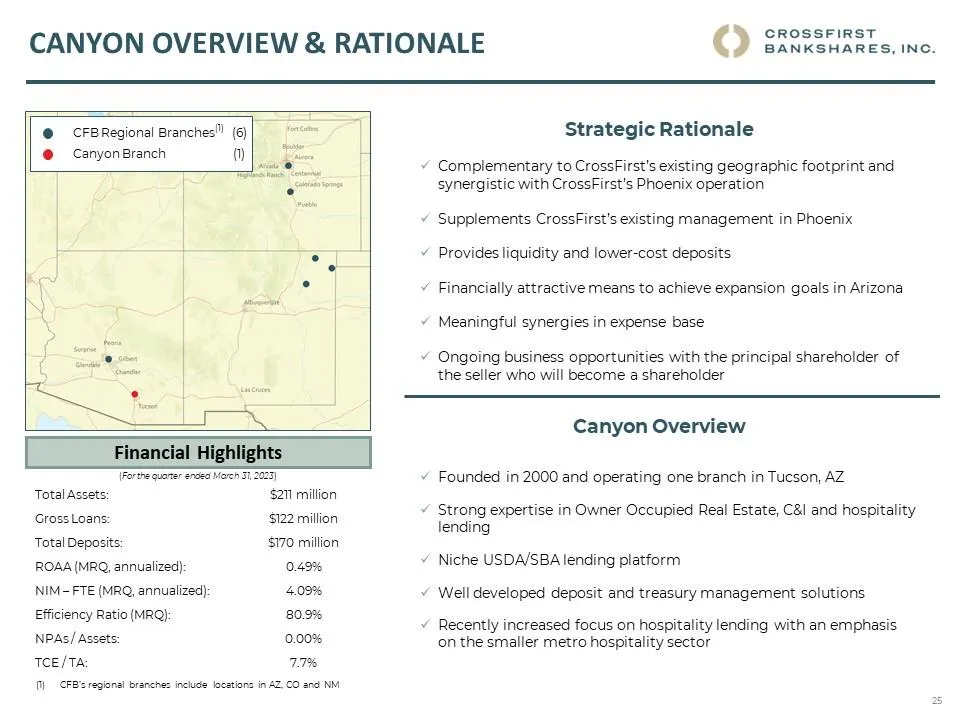
Canyon Overview & Rationale CROSSFIRST BANKSHARES, INC. CFB Regional Branches(1) Canyon Branch Strategic Rationale Complementary to CrossFirst’s existing geographic footprint and synergistic with CrossFirst’s Phoenix operation Supplements CrossFirst’s existing management in Phoenix Provides liquidit
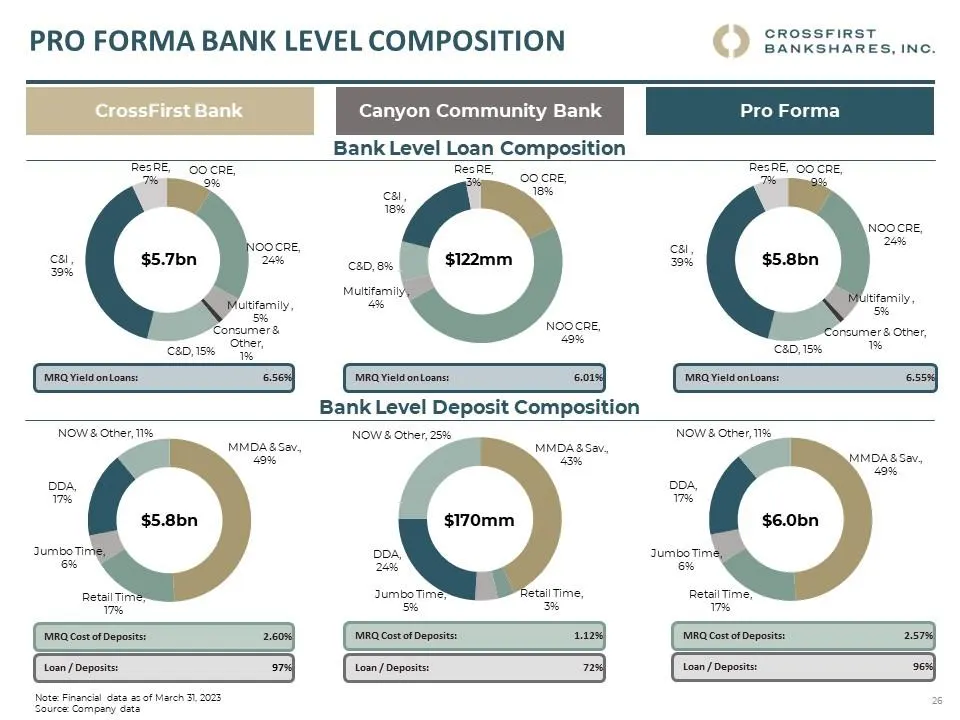
Slide 26: Pro forma Bank Level Composition
Pro forma Bank Level Composition CROSSFIRST BANKSHARES, INC. CrossFirst Bank Res RE, 7% OO CRE, 9% NOO CRE, 24% Multifamily , 5% Consumer & Other, 1% C&D, 15% C&I , 39% $5.7bn MRQ Yield on Loans: 6.56% Canyon Community Bank Bank Level Loan Composition Res RE, 3% OO CRE, 18% NOO CRE, 49% Multifamily
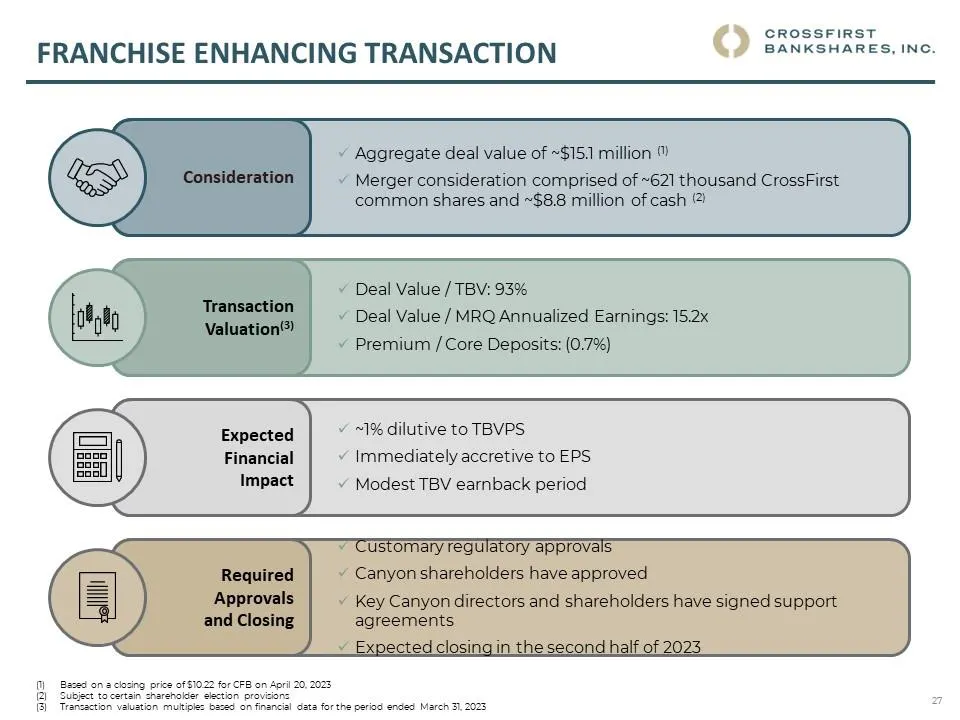
Slide 27: Franchise Enhancing Transaction
franchise enhancing transaction CROSSFIRST BANKSHARES, INC. Consideration Aggregate deal value of ~$15.1 million Merger consideration comprised of ~621 thousand Cross First common shares and ~$8.8 million of cash ® Z Transaction Valuation*3’ Deal Va lue/TBV: 93% Deal Value / MRQ Annualized Earnings:
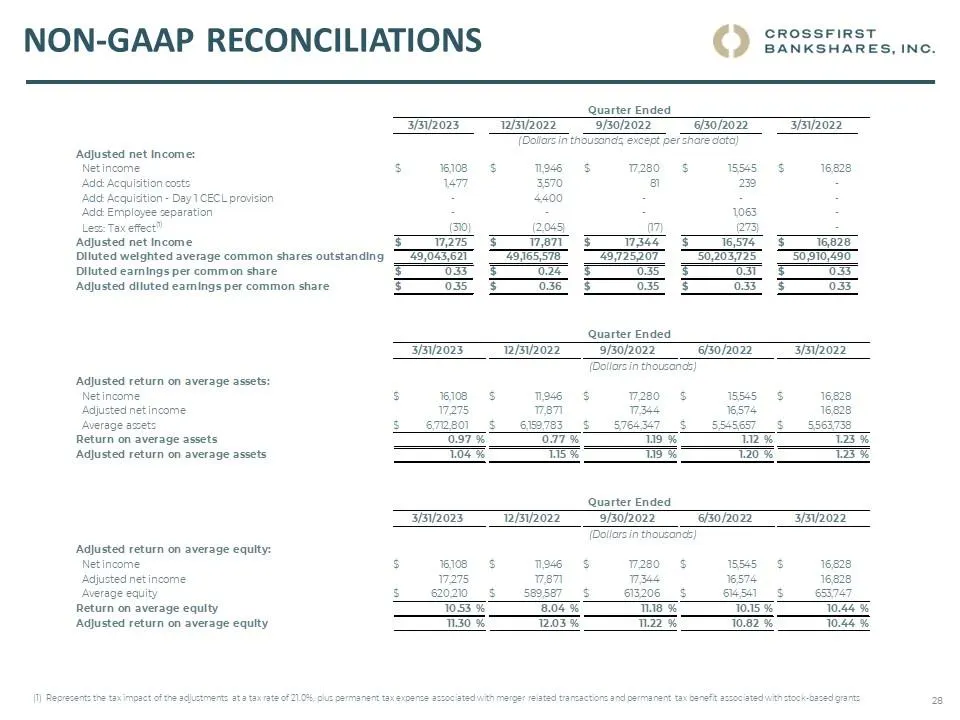
Slide 28: NON-GAAP Reconciliations
NON-GAAP Reconciliations CROSSFIRST BANKSHARES, INC. 3/31/2023 Adjusted net income: Net income S 16,108 Add:Acquisition costs 1,477 Add: Acquisition - Day 1 CECL provision - Add: Employee separation - Less: Tax effect111 (310) Adjusted net income Diluted weighted average common shares outstanding Di
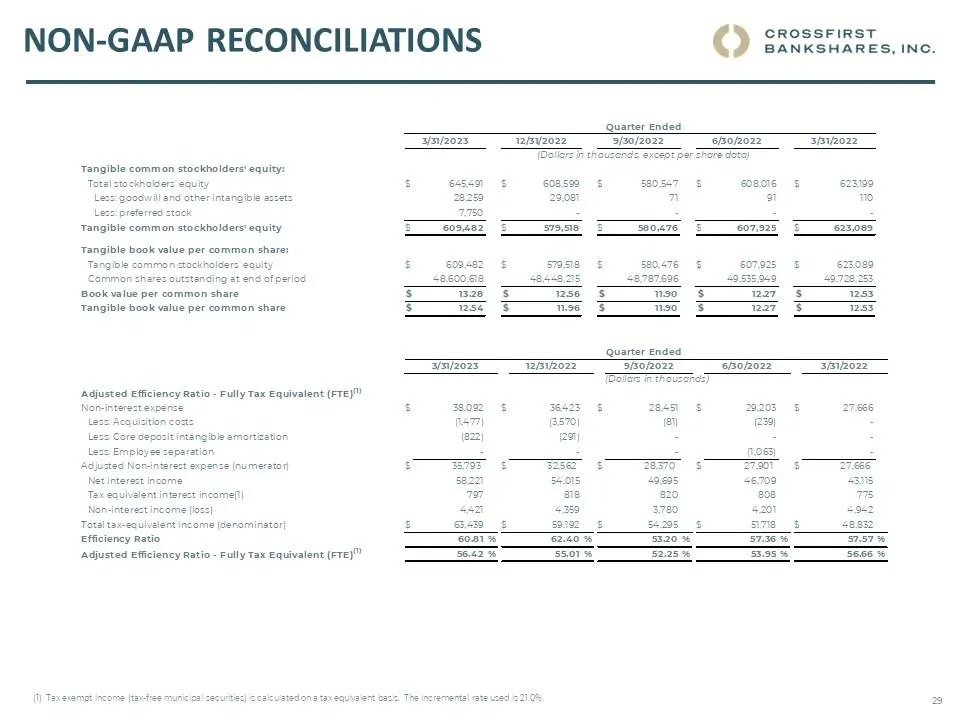
Slide 29: NON-GAAP Reconciliations
NON-GAAP Reconciliations CROSSFIRST BANKSHARES, INC. 3/31/2023 Tangible common stockholders' equity: Total stockholders' equity Less: goodwill and other intangible assets Less: preferred stock Tangible common stockholders' equity Tangible book value per common share: Tangible common stockholders' eq
Slide 30: NON-GAAP Reconciliations
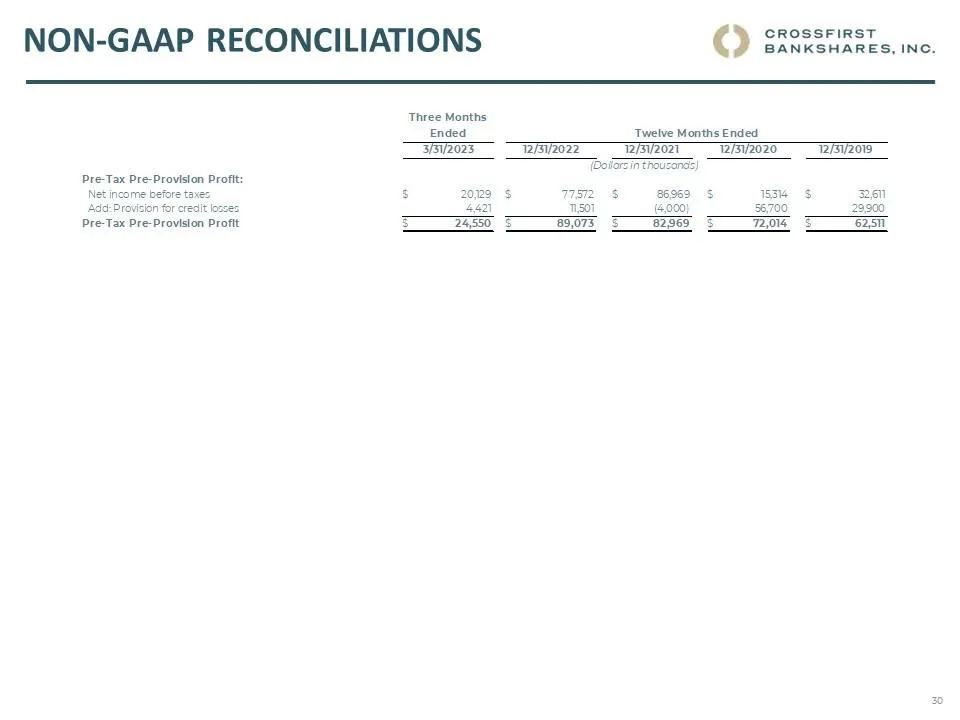
NON-GAAP Reconciliations CROSSFIRST BANKSHARES, INC. Three Months Ended Pre-Tax Pre-Provision Profit: Net income before taxes Add: Provision for credit losses Pre-Tax Pre-Provision Profit 3/31/2023 S 20,129 4,421 S 24,550 Twelve Months Ended 12/31/2022 12/31/2021 (Dollars in thousands) S 77,572 11,5
Source: SEC EDGAR · 8-K filed May 5, 2023
More decks from CrossFirst Bankshares Inc
 Q3 2024 Earnings Presentation44 slides · Oct 22, 2024
 Merger or Acquisition (August 2024)27 slides · Aug 27, 2024
 Merger or Acquisition (August 2024)30 slides · Aug 27, 2024
 Merger or Acquisition (August 2024)31 slides · Aug 27, 2024
 Q2 2024 Earnings Presentation19 slides · Jul 15, 2024
 Q1 2024 Earnings Presentation19 slides · Apr 15, 2024