Yadkin Financial — Yadkin Valley Financial — Howe Barnes Annual Bank Conference 2008
21 slides from Yadkin Financial's conference presentation, Aug 19, 2008
Slide 1: Howe Barnes Annual Bank Conference August 19-20, 2008
Howe Barnes Annual Bank Conference August 19-20, 2008
Slide 2: Road map
Road map Corporate Overview Financial Performance Operating Strategy Outlook
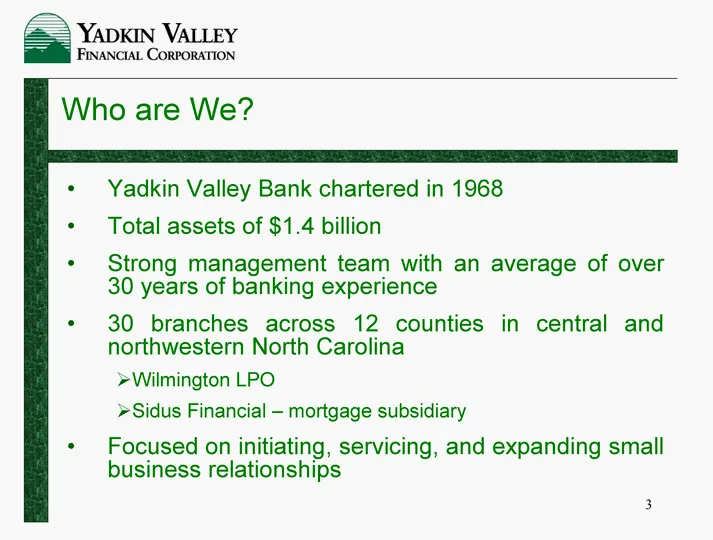
Slide 3: Who are We?
Who are We? Yadkin Valley Bank chartered in 1968 Total assets of $1.4 billion Strong management team with an average of over 30 years of banking experience 30 branches across 12 counties in central and northwestern North Carolina Wilmington LPO Sidus Financial - mortgage subsidiary Focused on initia
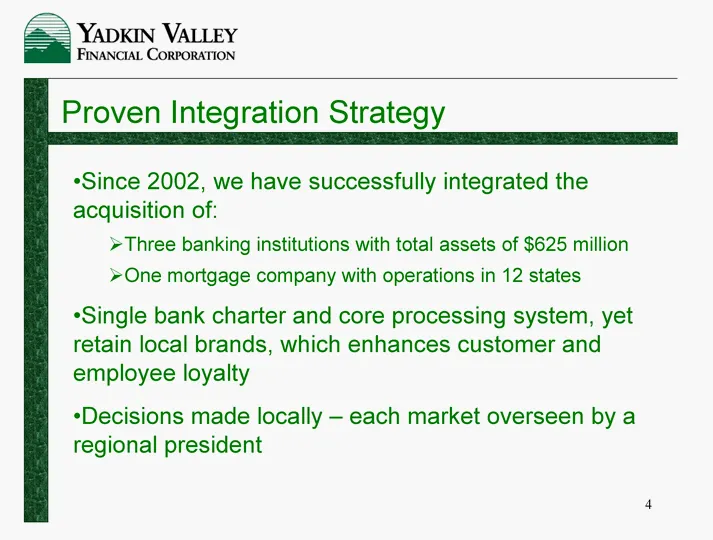
Slide 4: Proven Integration Strategy
Proven Integration Strategy Since 2002, we have successfully integrated the acquisition of: Three banking institutions with total assets of $625 million One mortgage company with operations in 12 states Single bank charter and core processing system, yet retain local brands, which enhances customer
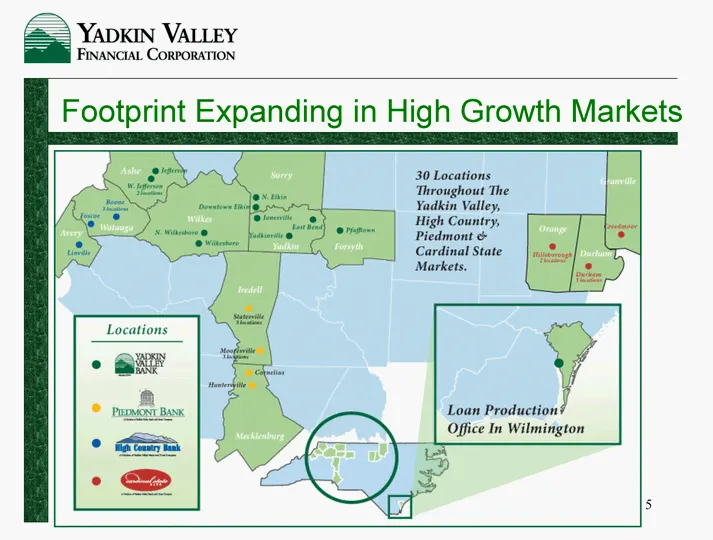
Slide 5: Footprint Expanding in High Growth Markets
Footprint Expanding in High Growth Markets
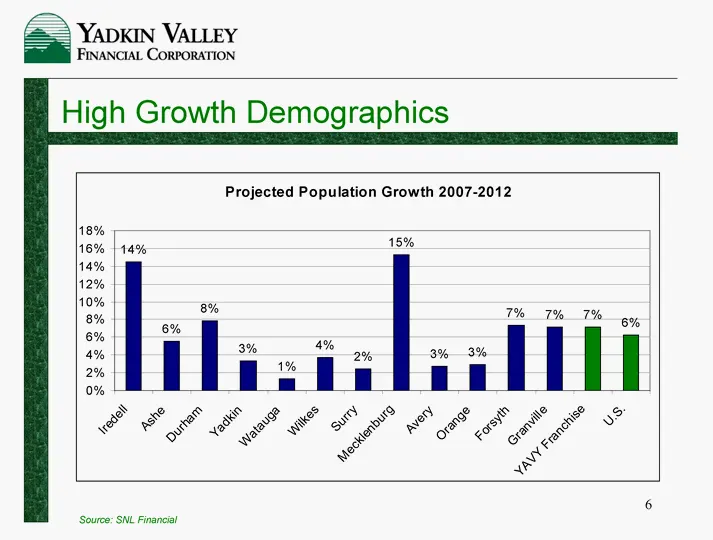
Slide 6: High Growth Demographics
High Growth Demographics Source: SNL Financial
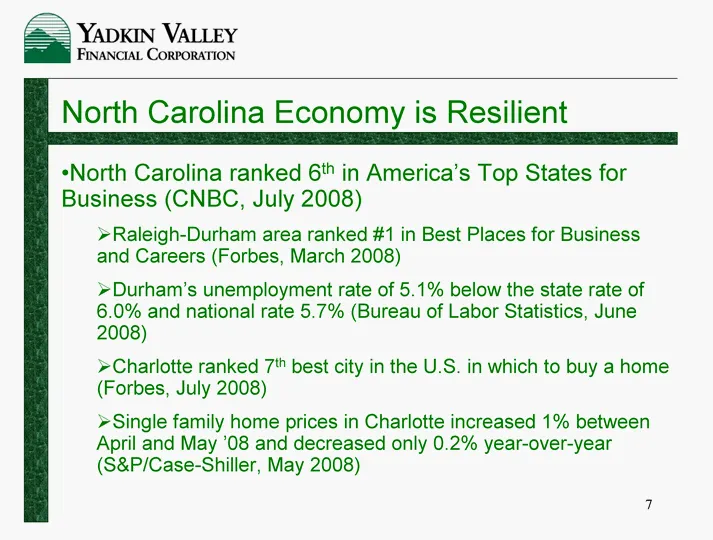
Slide 7: North Carolina Economy is Resilient
North Carolina Economy is Resilient North Carolina ranked 6th in America's Top States for Business (CNBC, July 2008) Raleigh-Durham area ranked #1 in Best Places for Business and Careers (Forbes, March 2008) Durham's unemployment rate of 5.1% below the state rate of 6.0% and national rate 5.7% (Bure
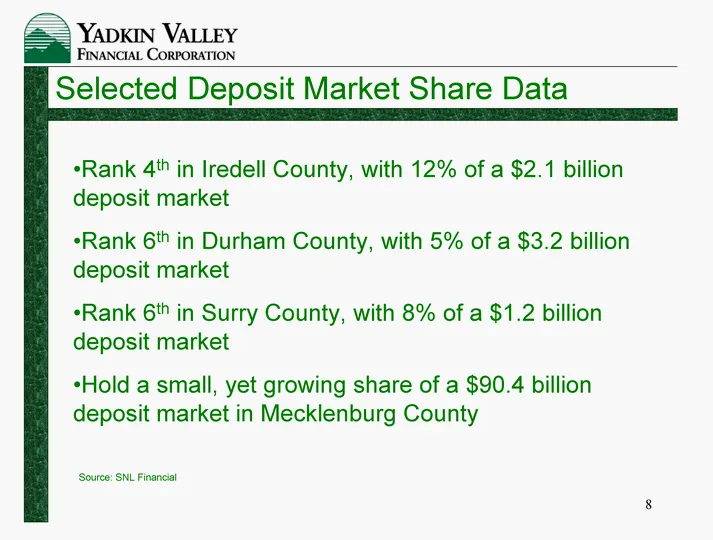
Slide 8: Selected Deposit Market Share Data
Selected Deposit Market Share Data Rank 4th in Iredell County, with 12% of a $2.1 billion deposit market Rank 6th in Durham County, with 5% of a $3.2 billion deposit market Rank 6th in Surry County, with 8% of a $1.2 billion deposit market Hold a small, yet growing share of a $90.4 billion deposit m
Slide 9: A Track Record of Solid Growth
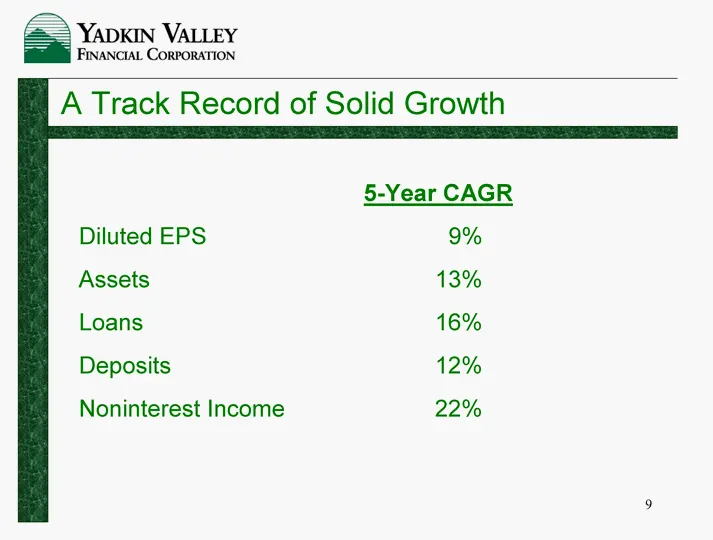
A Track Record of Solid Growth 5-Year CAGR Diluted EPS 9% Assets 13% Loans 16% Deposits 12% Noninterest Income 22%
Slide 10: We Continue to Outperform Peers
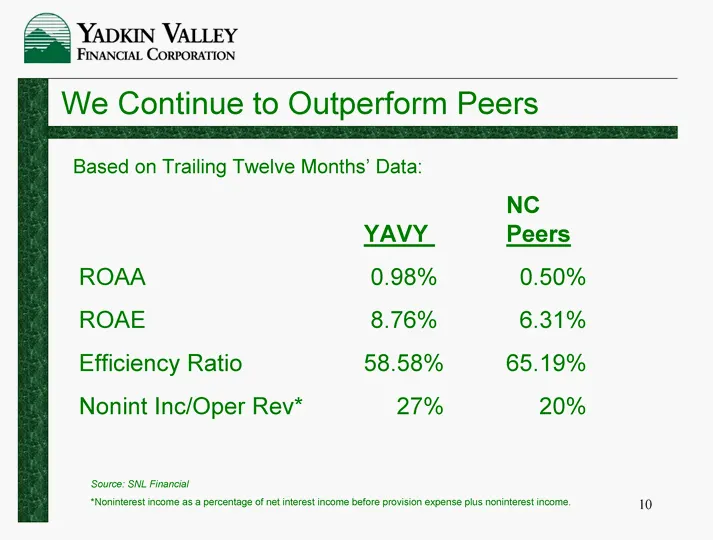
We Continue to Outperform Peers NC YAVY Peers ROAA 0.98% 0.50% ROAE 8.76% 6.31% Efficiency Ratio 58.58% 65.19% Nonint Inc/Oper Rev* 27% 20% Based on Trailing Twelve Months' Data: Source: SNL Financial *Noninterest income as a percentage of net interest income before provision expense plus noninteres
Slide 11: Asset Quality Consistently Outperforms Peers
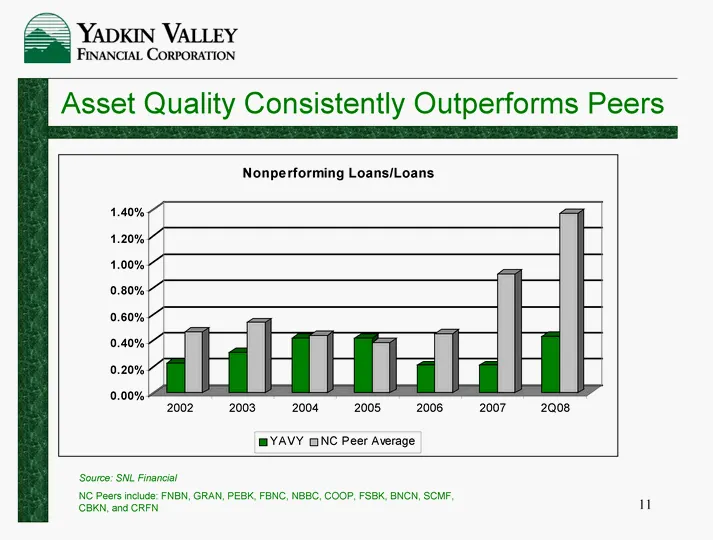
Asset Quality Consistently Outperforms Peers Source: SNL Financial NC Peers include: FNBN, GRAN, PEBK, FBNC, NBBC, COOP, FSBK, BNCN, SCMF, CBKN, and CRFN
Slide 12: Asset Quality Consistently Outperforms Peers
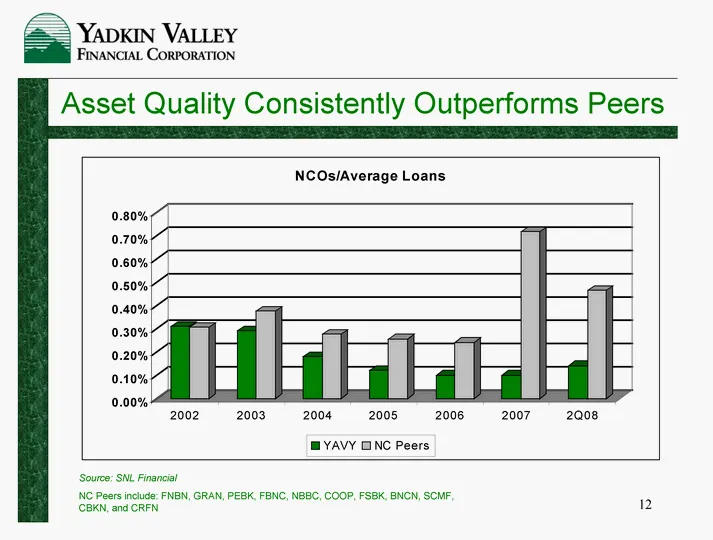
Asset Quality Consistently Outperforms Peers Source: SNL Financial NC Peers include: FNBN, GRAN, PEBK, FBNC, NBBC, COOP, FSBK, BNCN, SCMF, CBKN, and CRFN
Slide 13: Second Quarter 2008 Financial Highlights
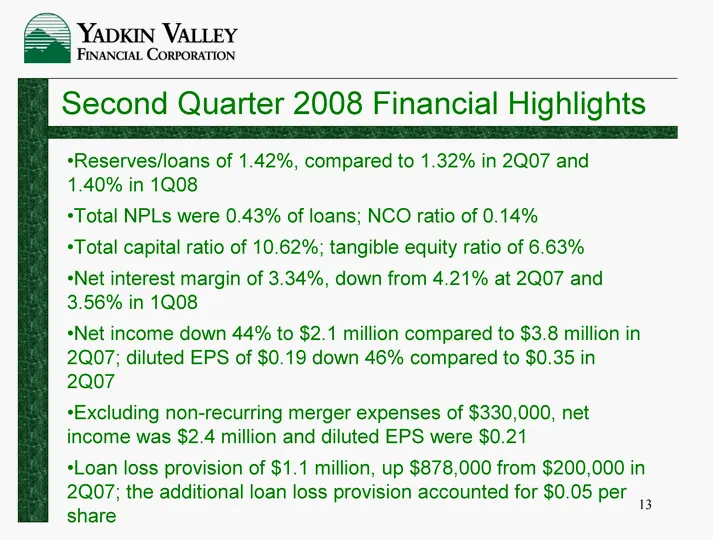
Second Quarter 2008 Financial Highlights Reserves/loans of 1.42%, compared to 1.32% in 2Q07 and 1.40% in 1Q08 Total NPLs were 0.43% of loans; NCO ratio of 0.14% Total capital ratio of 10.62%; tangible equity ratio of 6.63% Net interest margin of 3.34%, down from 4.21% at 2Q07 and 3.56% in 1Q08 Net i
Slide 14: A Diverse Loan Portfolio
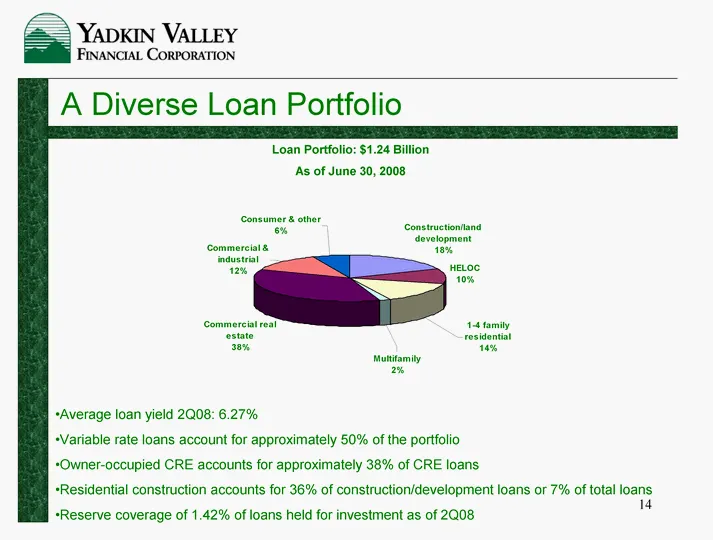
A Diverse Loan Portfolio Loan Portfolio: $1.24 Billion As of June 30, 2008 Average loan yield 2Q08: 6.27% Variable rate loans account for approximately 50% of the portfolio Owner-occupied CRE accounts for approximately 38% of CRE loans Residential construction accounts for 36% of construction/develo
Slide 15: Asset Quality Remains Strong
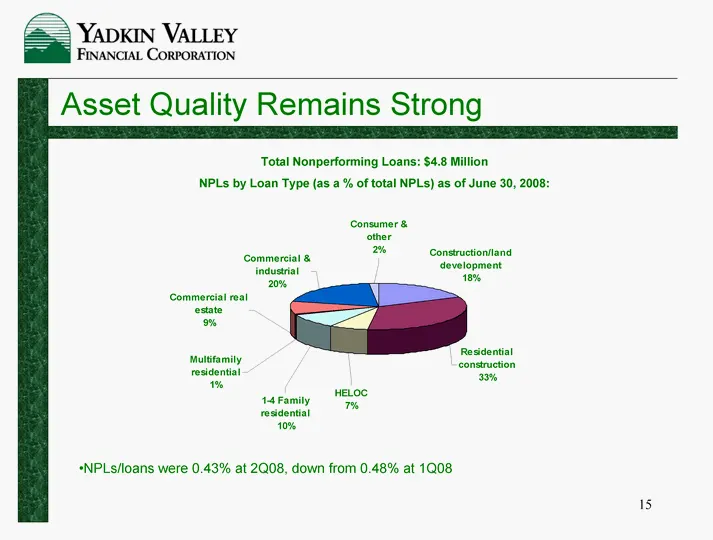
Asset Quality Remains Strong Total Nonperforming Loans: $4.8 Million NPLs by Loan Type (as a % of total NPLs) as of June 30, 2008: NPLs/loans were 0.43% at 2Q08, down from 0.48% at 1Q08
Slide 16: Strong Core Deposit Base Fuels Loan Growth
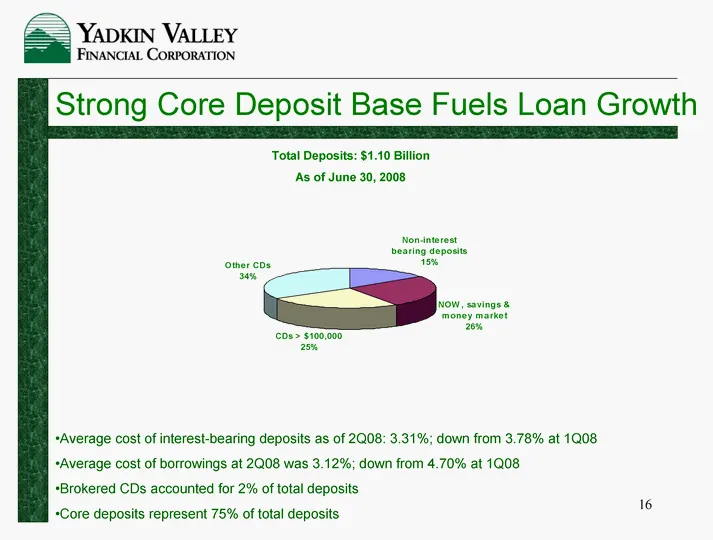
Strong Core Deposit Base Fuels Loan Growth Total Deposits: $1.10 Billion As of June 30, 2008 Average cost of interest-bearing deposits as of 2Q08: 3.31%; down from 3.78% at 1Q08 Average cost of borrowings at 2Q08 was 3.12%; down from 4.70% at 1Q08 Brokered CDs accounted for 2% of total deposits Core
Slide 17: Managing Through the Current Environment
Managing Through the Current Environment Net Interest Margin Running off high cost deposits, replacing them with lower cost borrowings in the short-term Core deposits remain a significant source of funding (75% of total deposits) Stronger focus on low-cost deposit gathering Asset Quality Strengthene
Slide 18: Long-Term Vision
Long-Term Vision Expansion in high growth areas through: Attractive acquisition opportunities De novo branching LPOs Durham, Wake and Mecklenburg Counties are our primary areas of focus South Carolina remains a long-term goal Total assets of >$2.0 billion
Slide 19: Expectations for 2H08
Expectations for 2H08 We believe the net interest margin has bottomed at 3.34% during 2Q08 Expect modest NIM expansion during the second half of 2008 as 48% of CDs reprice at lower rates 2H08 cost savings associated with Cardinal ~ $750,000 NPLs/loans and NCO ratio expected to outperform the industr
Slide 20: Forward-Looking Statement
Forward-Looking Statement This presentation contains forward-looking statements, as defined by Federal Securities Laws, including statements about financial outlook and business environment. These statements are provided to assist in the understanding of future financial performance and such perform
Slide 21: For Further Information Contact
For Further Information Contact: Edwin Laws, EVP & Chief Financial Officer (336) 526-6313 [email protected]
Source: SEC EDGAR · 8-K filed Aug 19, 2008
More decks from Yadkin Financial Corp
 Merger or Acquisition (August 2016)38 slides · Aug 16, 2016
 Merger or Acquisition (July 2016)20 slides · Jul 21, 2016
 Gulf South Bank Conference 201624 slides · May 2, 2016
 Q1 2016 Earnings Presentation10 slides · Apr 21, 2016
 Q4 2015 Earnings Presentation13 slides · Jan 28, 2016
 Q3 2015 Earnings Presentation29 slides · Nov 10, 2015