Yadkin Financial — Yadkin Valley Financial — Investor Presentation (May 2008)
38 slides from Yadkin Financial's investor presentation, May 7, 2008
Slide 1: Investor Presentation May 2008
Investor Presentation May 2008 Edwin E. Laws, Vice President & Chief Financial Officer Stephen S. Robinson, Executive Vice President & Chief Operating Officer For further information please contact: Edwin Laws, Vice President & Chief Financial Officer Office: (336) 526-6313, Fax: (336) 835-8858 Emai
Slide 2: Forward-Looking Statement
Forward-Looking Statement This presentation contains forward-looking statements, as defined by Federal Securities Laws, including statements about financial outlook and business environment. These statements are provided to assist in the understanding of future financial performance and such perform
Slide 3: What You Will Learn Today
What You Will Learn Today . . . History Our Performance Our Operating Strategy
Slide 4: History
History Yadkin Valley Financial Corporation ("Company") was formed July 1, 2006, as a holding company for Yadkin Valley Bank and Trust Company ("Bank"). Yadkin Valley Bank was chartered by the state of North Carolina in 1968. Our Bank is focused on starting, servicing and expanding small business re
Slide 5: History
History Nov. 3, 1995: UCB Branch, Elkin, N. C. O Loans & $25 MM in Deposits Aug. 1, 2002: Main Street BankShares, Inc. (Piedmont Bank) 6 branches in four cities 2 Counties (Iredell & Mecklenburg Counties) $247MM in total assets/$180MM in Loans/ $210MM in Deposits
Slide 6: History
History Jan. 1, 2004: High Country Financial Corporation (High Country Bank) 5 branches in two cities w/1 new branch in progress for a total of 6 branches 2 Counties (Watauga & Ashe Counties) $184MM in total assets $155MM in total loans $163MM in total deposits
Slide 7: History
History October 1, 2004: Sidus Financial LLC - A mortgage company located in Greenville, North Carolina serving approximately 50 banks as their mortgage banker, with 8 production offices and licensed in 12 States (NC, SC, GA, FL, AL, AR, VA, WV, KY, TN, MD, & DE)
Slide 8: History
History March 31, 2008: Cardinal State Bank ? 4 Branch Locations ? 2 Cities (Durham & Hillsborough in 2 Counties (Durham & Orange) ? 2 New Branches in Progress - 1 in Hillsborough (Orange County) & 1 in Creedmoor (Granville County) ? $194MM In Total Assets ? $149MM In Total Gross Loan ? $169MM In To
Slide 9: History
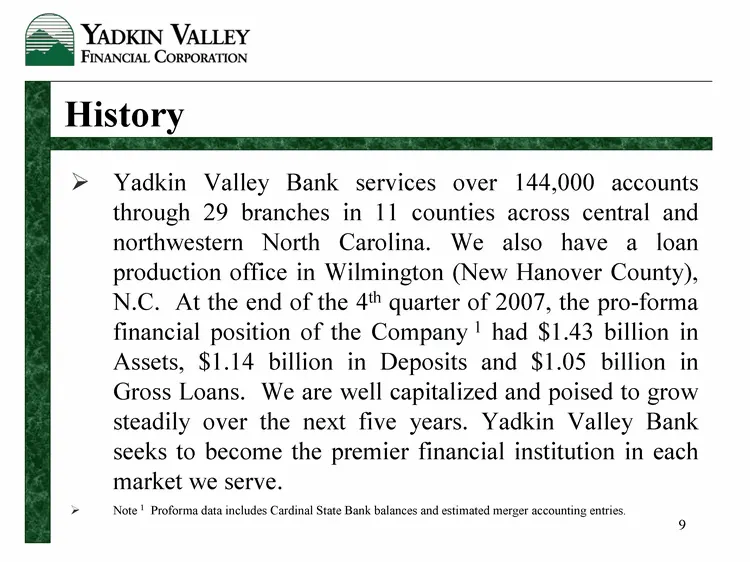
History Yadkin Valley Bank services over 144,000 accounts through 29 branches in 11 counties across central and northwestern North Carolina. We also have a loan production office in Wilmington (New Hanover County), N.C. At the end of the 4th quarter of 2007, the pro-forma financial position of the C
Slide 10: Experienced Leadership Team - Yadkin Valley Bank and Trust Company Officers
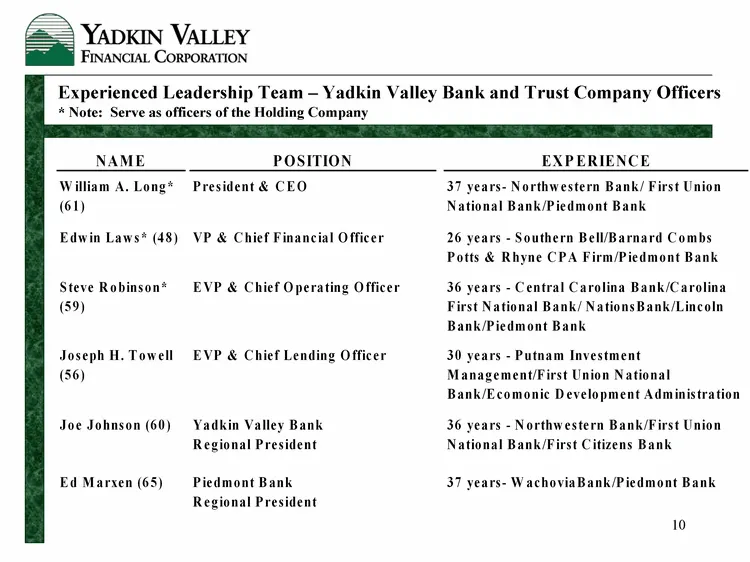
Experienced Leadership Team - Yadkin Valley Bank and Trust Company Officers * Note: Serve as officers of the Holding Company
Slide 11: Experienced Leadership Team
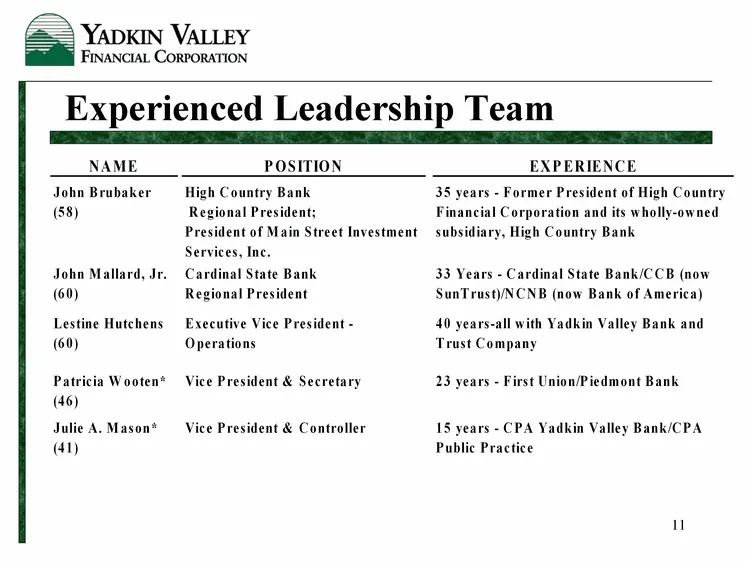
Experienced Leadership Team
Slide 12: Performance
PERFORMANCE
Slide 13: Diluted EPS
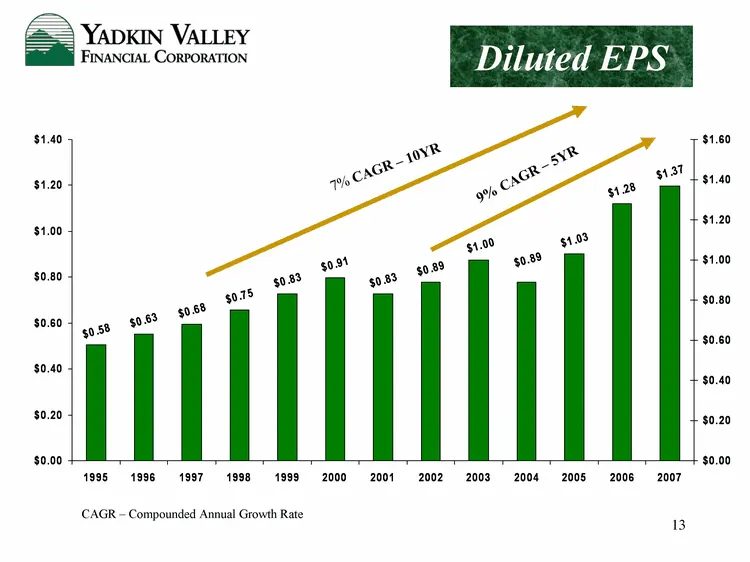
1995 1996 1997 1998 1999 2000 2001 2002 2003 2004 2005 2006 2007 0.58 0.63 0.68 0.75 0.83 0.91 0.83 0.89 1 0.89 1.03 1.28 1.37 Column 2 Diluted EPS 9% CAGR - 5YR 7% CAGR - 10YR CAGR - Compounded Annual Growth Rate
Slide 14: Dividends Per Share
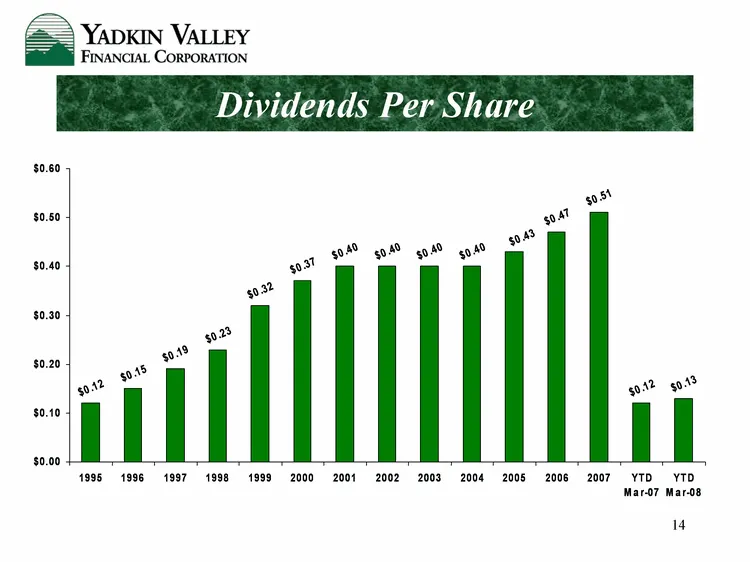
Dividends Per Share 1995 1996 1997 1998 1999 2000 2001 2002 2003 2004 2005 2006 2007 YTD Mar-07 YTD Mar-08 0.12 0.15 0.19 0.23 0.32 0.37 0.4 0.4 0.4 0.4 0.43 0.47 0.51 0.12 0.13
Slide 15: Per Share Information
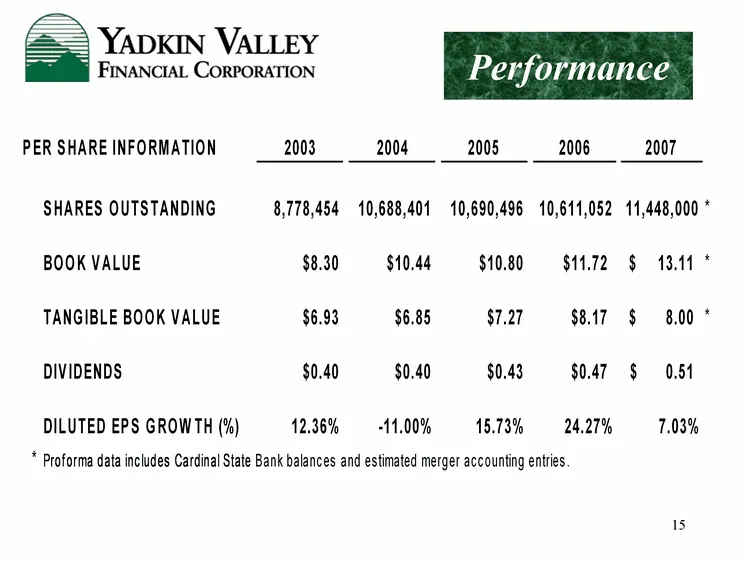
_ "YADKIN VALLEY FINANCIAL CORPORATION ryormance PER SHARE INFORMATION 2003 2004 2005 2006 2007 SHARES OUTSTANDING 8,778,454 10,688,401 10,690,496 10,611,052 11,448,000 * BOOK VALUE $8.30 $10.44 $10.80 $14.72 $13.11 * TANGIBLE BOOK VALUE $6.93 $6.85 $7.27 $8.17 § 8.00 * DIVIDENDS $0.40 $0.40 $0.43 $
Slide 16: Performance
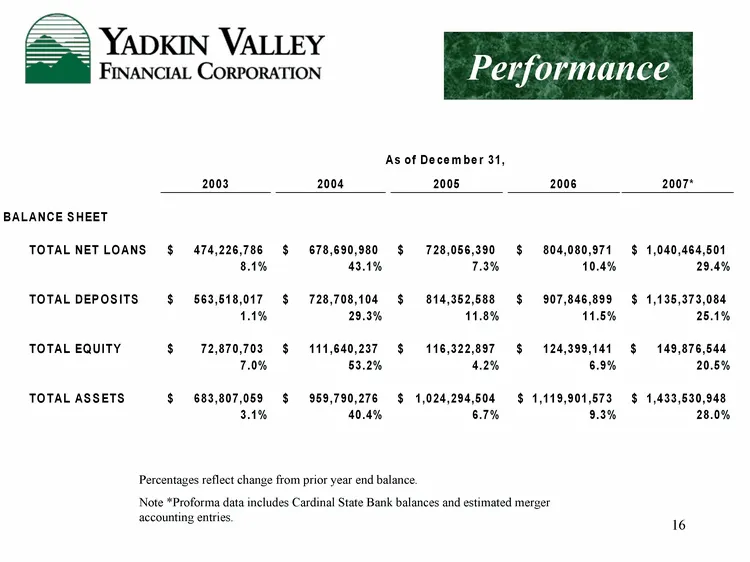
Performance Percentages reflect change from prior year end balance. Note *Proforma data includes Cardinal State Bank balances and estimated merger accounting entries.
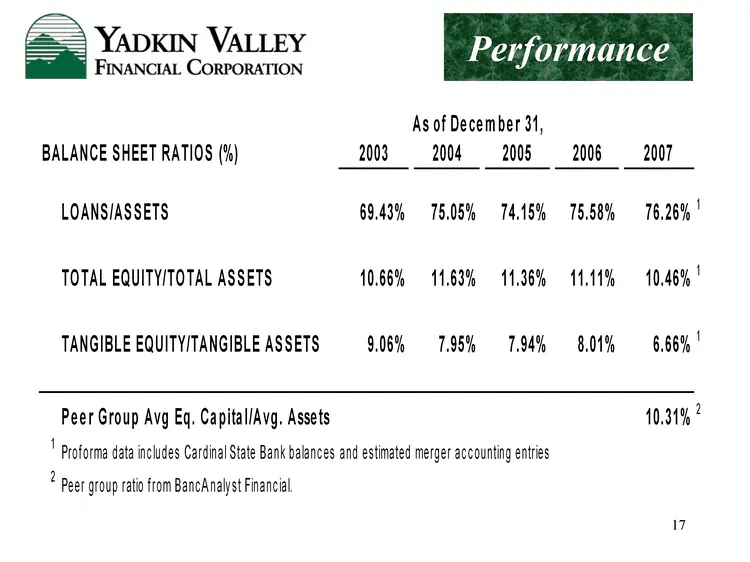
Slide 17: Balance Sheet Ratios
ee YADKIN VALLEY Performance FINANCIAL CORPORATION As of December 31, BALANCE SHEET RATIOS (‘h) 2003 200420052006. = 2007 LOANS/ASSETS 69.43% 75.05% 74.15% 75.58% 76.26% ' TOTAL EQUITYITOTAL ASSETS 10.66% 14.63% 11.36% 14.11% 10.46% ' TANGIBLE EQUITY/TANGIBLE ASSETS 9.06% 7.95 7.94% = 8.01% 6.66% |
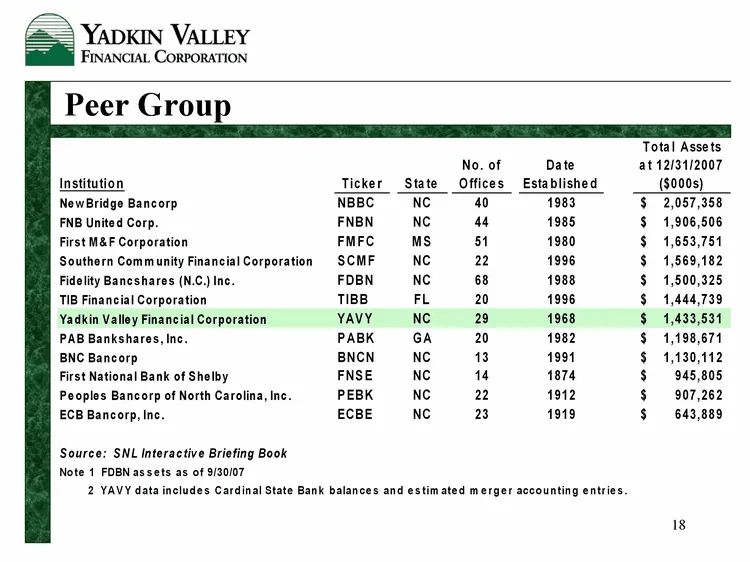
Slide 18: Peer Group
=x “YADKIN VALLEY FINANCIAL CORPORATION Peer Group Total Assets No. of Date at 12/31/2007 n Ticker State Offices Established (000s) NewBridge Bancorp NBBC NC 40 1983 S$ 2,087,358 FNB United Corp. FNBN NC 44 1985 $1,906,506 First M&F Corporation FMFC | MS 54 1980 $1,653,751 Southern Community Financi
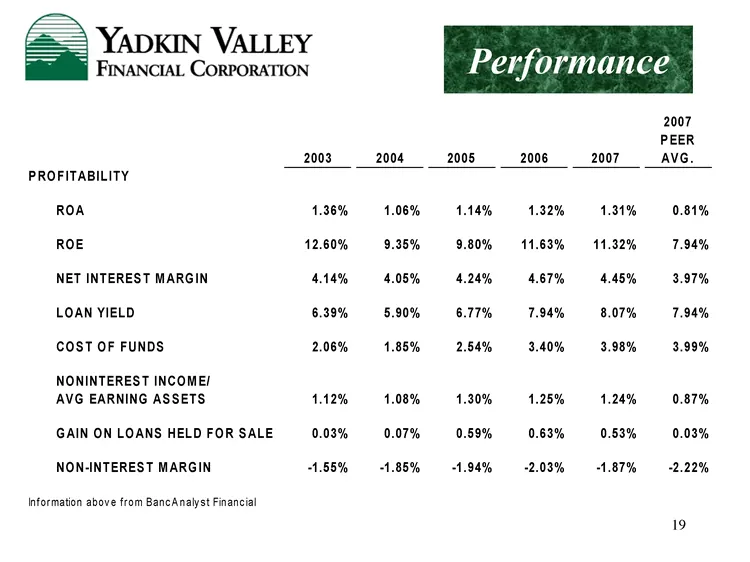
Slide 19: Profitability vs Peer Group
YADKIN VALLEY FINANCIAL CORPORATION Performance 2007 PEER 2003 2004 2005 2006 2007 AVG. PROFITABILITY ROA 1.36% 1.06% 1.14% 1.32% 1.31% 0.81% ROE 12.60% 9.35% 9.80% 11.63% 11.32% 7.94% NET INTEREST MARGIN 44% 4.05% 4.24% 4.87% 4.45% 3.97% LOAN YIELD 6.39% 5.90% 6.77% 7.94% 8.07% 7.94% COST OF FUNDS
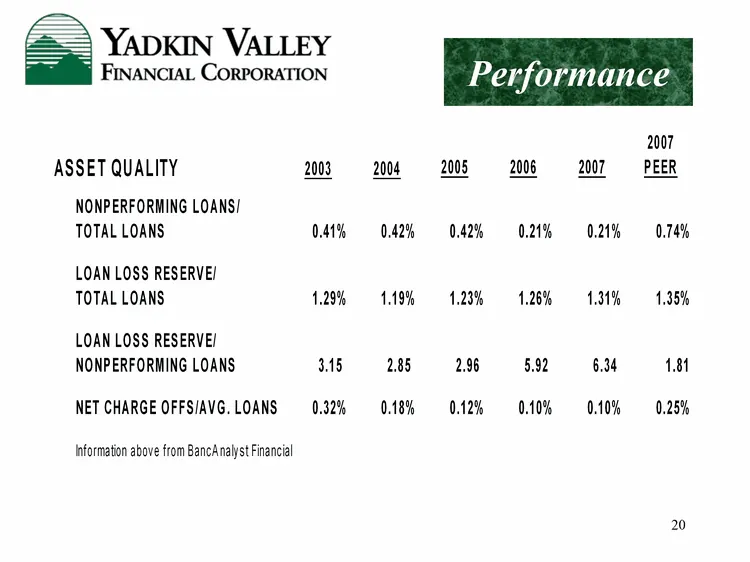
Slide 20: Asset Quality
a. "YADKIN VALLEY mance FINANCIAL CORPORATION 2007 ASSET QUALITY 2003 2004 2005 2006 2007 PEER NONPERFORMING LOANS! TOTAL LOANS Ode = 0.42% = 0.42% = 0.21% = 0.21% 0.74% LOAN LOSS RESERVE! TOTAL LOANS 1.29% 119% 1.23% 1.26% 1.31% 1.35% LOAN LOSS RESERVE! NONPERFORMING LOANS 3.15 2.85 2.96 5.92 6.34
Slide 21: Loan Portfolio Composition
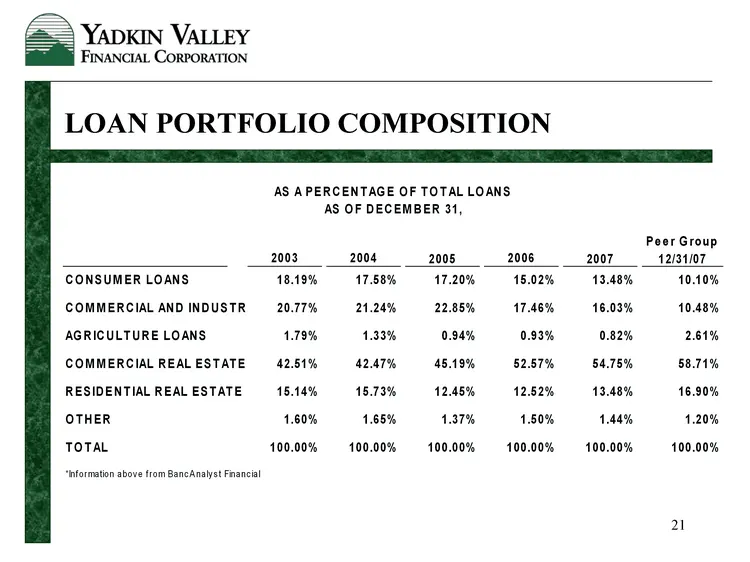
=| "YADKIN VALLEY FINANCIAL CORPORATION LOAN PORTFOLIO COMPOSITION AS APERCENTAGE OF TOTAL LOANS AS OF DECEMBER 31, Peer Group 2003 2004 2005 2006 2007 12/34/07 CONSUMER LOANS 18.19% 17.58% 17.20% 15.02% 13.48% 10.10% COMMERCIAL AND INDUSTR 20.7% 24.24% «22.85% 17.48% 16.03% 10.48% AGRICULTURE LOANS
Slide 22: Loan Portfolio Duration
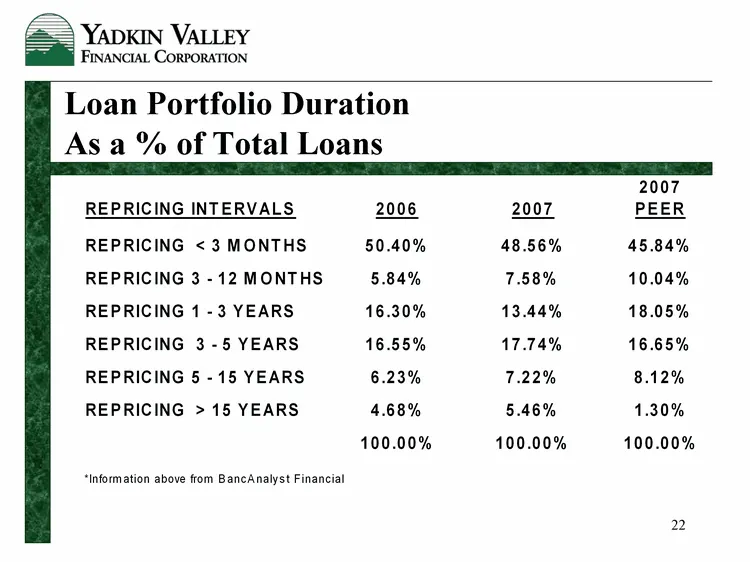
Loan Portfolio Duration As a % of Total Loans
Slide 23: Funds Composition
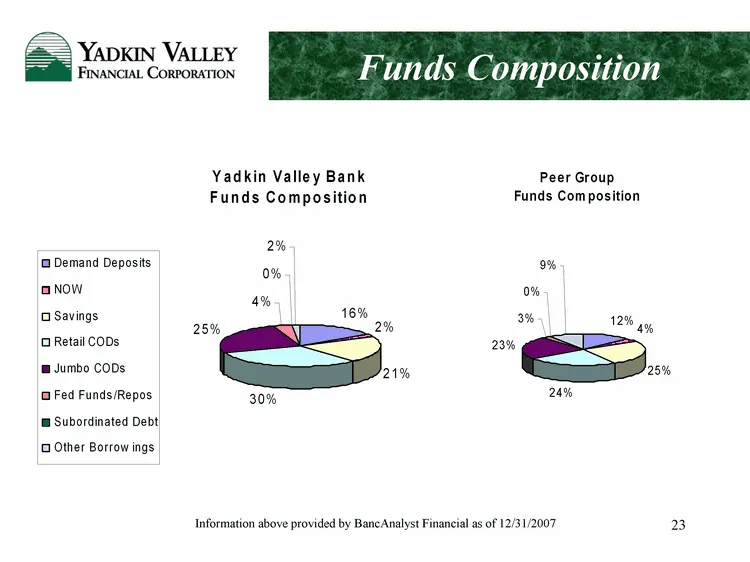
Funds Composition Information above provided by BancAnalyst Financial as of 12/31/2007
Slide 24: Operating Strategy
OPERATING STRATEGY
Slide 25: Our Strategy
Our Strategy Retention Increase Profitability Focus on Growth Maintain our Core Values Execution
Slide 26: Retention
Retention Knowledge of Customer Base Solicit Customers That Value Personal Service Providing Right Products Emphasis on Making Customers Profitable Saturday Banking Low Staff Turnover
Slide 27: Increase Profitability
Increase Profitability Expectation of Our Shareholders Net Interest Margin Operating Efficiency Branch Capture Noninterest Income
Slide 28: Focus on Growth
Focus on Growth Build Market Share In Existing Markets Retention Moving Below Average Customers Toward Profitability Competitive Products Remote Deposit Real-Time On-line Banking Building an ATM Nationwide Accessibility Network
Slide 29: Deposit Share by City/County
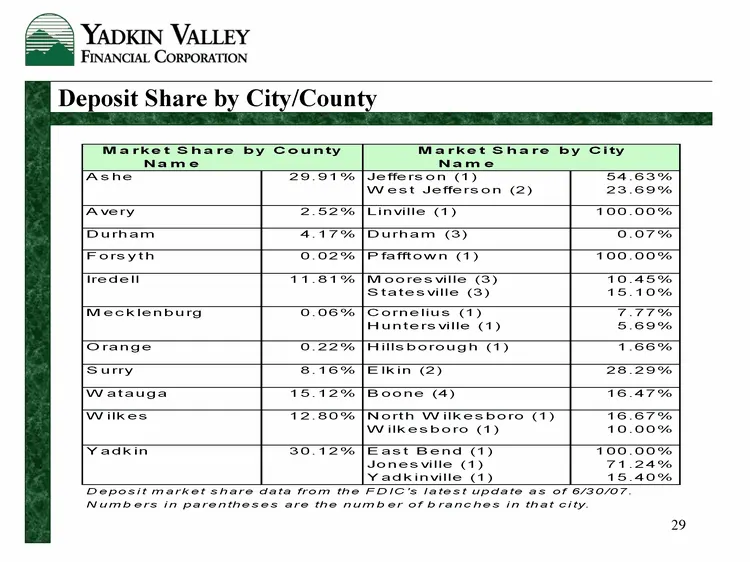
Deposit Share by City/County
Slide 30: Allpoint ATM Network
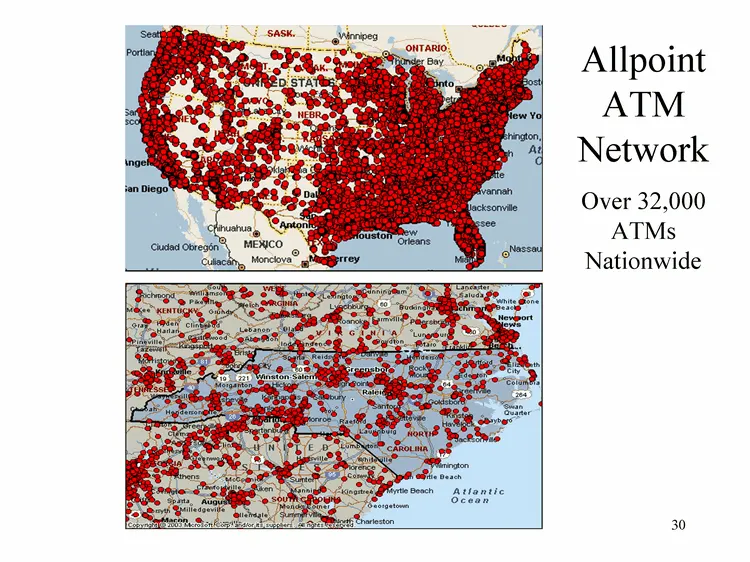
Allpoint ATM Network Over 32,000 ATMs Nationwide
Slide 31: Focus on Growth: Continue Expansion
Focus on Growth Continue Expansion Acquisitions Loan Production Offices De Novo
Slide 32: Yadkin Valley Bank's Footprint
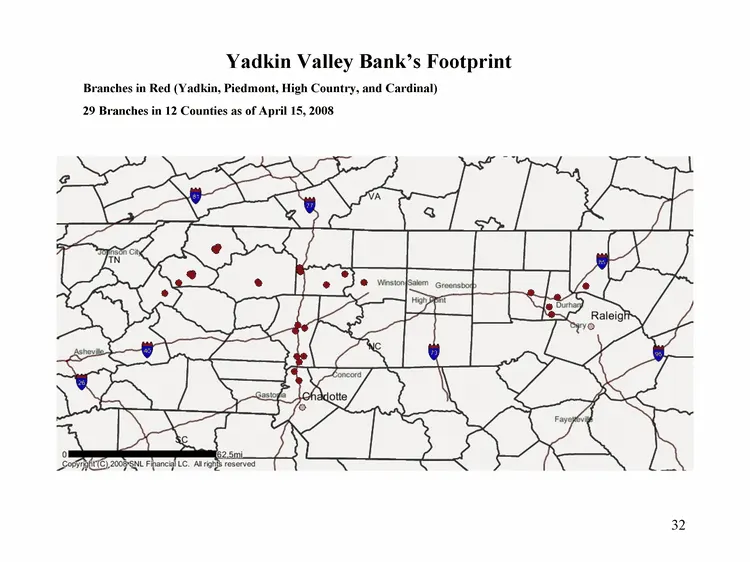
Yadkin Valley Bank's Footprint Branches in Red (Yadkin, Piedmont, High Country, and Cardinal) 29 Branches in 12 Counties as of April 15, 2008 29 Branches in 12 Counties as of April 15, 2008 29 Branches in 12 Counties as of April 15, 2008 29 Branches in 12 Counties as of April 15, 2008
Slide 33: Sidus Financial, LLC Locations
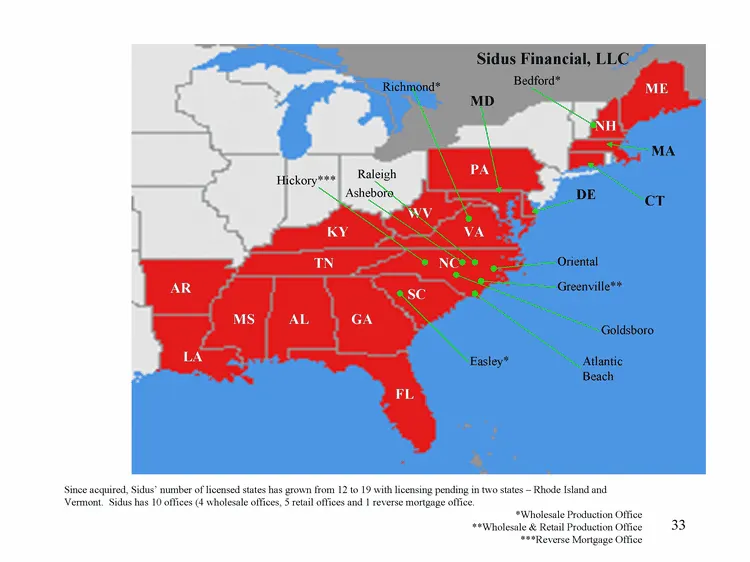
MD DE PA VA WV NC KY TN AR MS AL GA SC FL Asheboro Oriental Greenville** Atlantic Beach Easley* Richmond* Raleigh Hickory*** Sidus Financial, LLC Since acquired, Sidus' number of licensed states has grown from 12 to 19 with licensing pending in two states - Rhode Island and Vermont. Sidus has 10 off
Slide 34: Our Core Values
Our Core Values We exist only because of our customers. We respect employees. We are a for-profit business. We are honest people. We support each community we serve.
Slide 35: Execution
Execution We understand that all banks have strategic plans. At Yadkin Valley Bank, we concentrate on execution of those strategies. Execution will always be the key to our success.

Slide 36: Additional Information
ADDITIONAL INFORMATION
Slide 37: Summary of Peer Group Analysis
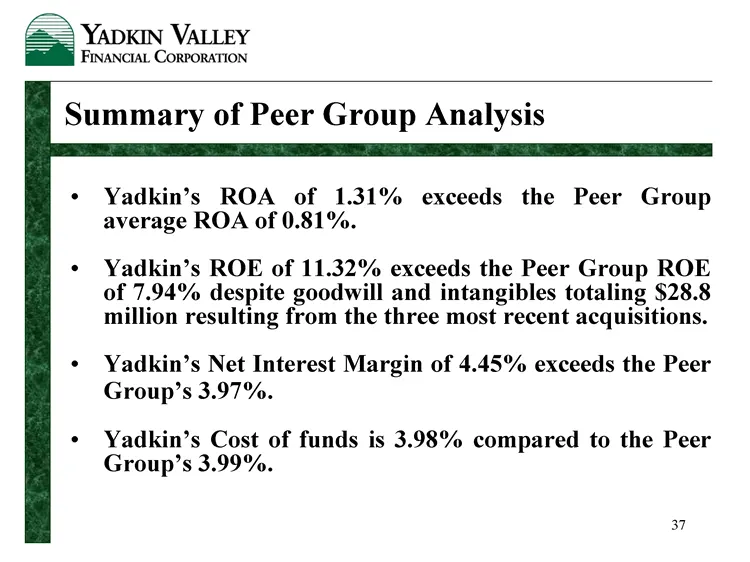
Summary of Peer Group Analysis Yadkin's ROA of 1.31% exceeds the Peer Group average ROA of 0.81%. Yadkin's ROE of 11.32% exceeds the Peer Group ROE of 7.94% despite goodwill and intangibles totaling $28.8 million resulting from the three most recent acquisitions. Yadkin's Net Interest Margin of 4.45
Slide 38: Summary of Peer Group Analysis
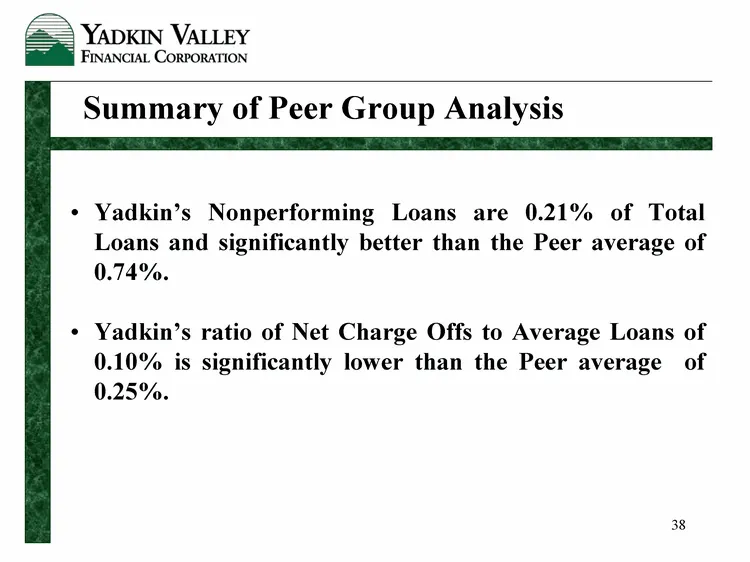
Summary of Peer Group Analysis Yadkin's Nonperforming Loans are 0.21% of Total Loans and significantly better than the Peer average of 0.74%. Yadkin's ratio of Net Charge Offs to Average Loans of 0.10% is significantly lower than the Peer average of 0.25%.
Source: SEC EDGAR · 8-K filed May 7, 2008
More decks from Yadkin Financial Corp
 Merger or Acquisition (August 2016)38 slides · Aug 16, 2016
 Merger or Acquisition (July 2016)20 slides · Jul 21, 2016
 Gulf South Bank Conference 201624 slides · May 2, 2016
 Q1 2016 Earnings Presentation10 slides · Apr 21, 2016
 Q4 2015 Earnings Presentation13 slides · Jan 28, 2016
 Q3 2015 Earnings Presentation29 slides · Nov 10, 2015