Enventis — Hickory Tech — Q4 2008 Earnings Presentation
19 slides from Enventis's earnings presentation, Mar 5, 2009
Slide 1: Investor Update: Fourth Quarter 2008 and Fiscal 2008 Earnings Conference Call
1 Investor Update Fourth Quarter 2008 and Fiscal 2008 Earnings Conference Call March 4, 2009 NASDAQ: HTCO
Slide 2: Forward Looking Statement
2 Information set forth in this presentation contains financial estimates and other forward-looking statements that are subject to risks and uncertainties; therefore, actual results might differ materially from such statements, whether as a result of new information, future events or otherwise. You
Slide 3: Agenda
3 Agenda John Finke President and Chief Executive Officer David Christensen Senior Vice President and Chief Financial Officer 4Q08 Earnings | 3.04.09 | HTCO
Slide 4: Fourth Quarter 2008 Highlights
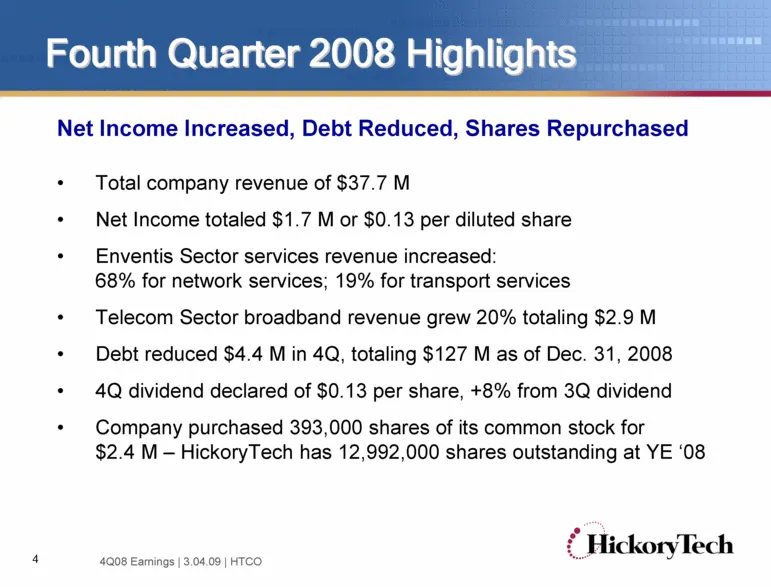
4 Fourth Quarter 2008 Highlights Net Income Increased, Debt Reduced, Shares Repurchased Total company revenue of $37.7 M Net Income totaled $1.7 M or $0.13 per diluted share Enventis Sector services revenue increased: 68% for network services; 19% for transport services Telecom Sector broadband reve
Slide 5: Fiscal 2008 Results
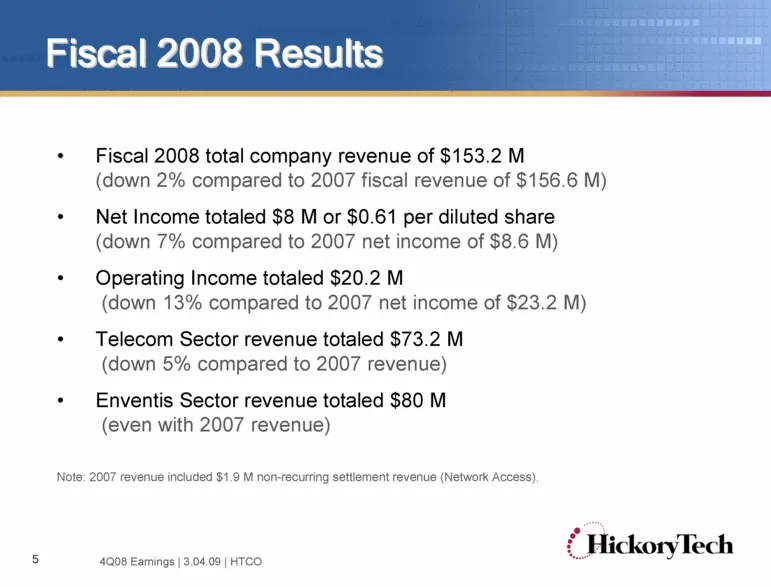
5 Fiscal 2008 Results Fiscal 2008 total company revenue of $153.2 M (down 2% compared to 2007 fiscal revenue of $156.6 M) Net Income totaled $8 M or $0.61 per diluted share (down 7% compared to 2007 net income of $8.6 M) Operating Income totaled $20.2 M (down 13% compared to 2007 net income of $23.2
Slide 6: Total Company Results
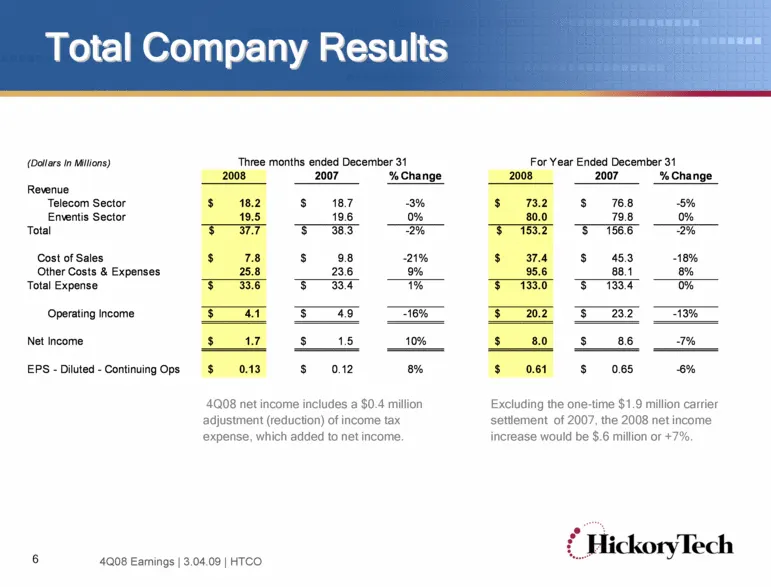
6 Total Company Results Excluding the one-time $1.9 million carrier settlement of 2007, the 2008 net income increase would be $.6 million or +7%. 4Q08 net income includes a $0.4 million adjustment (reduction) of income tax expense, which added to net income. 4Q08 Earnings | 3.04.09 | HTCO 2008 2007
Slide 7: Revenue by Business Sector
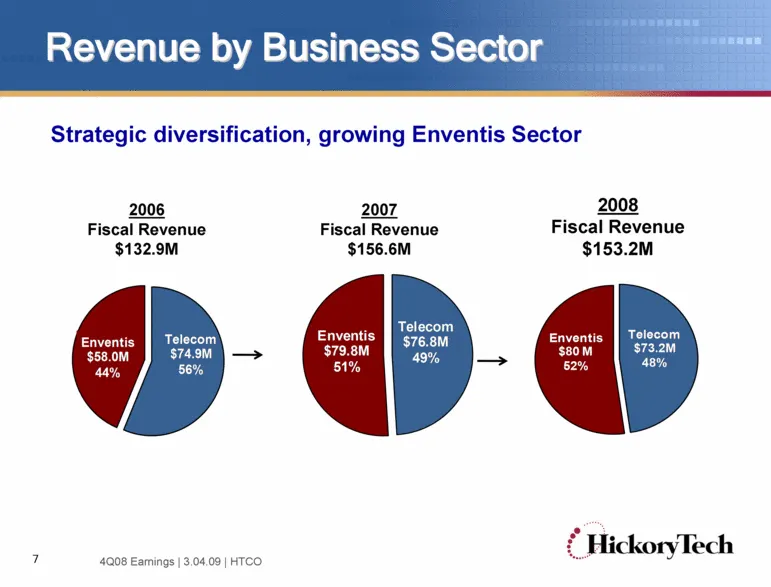
7 Revenue by Business Sector Strategic diversification, growing Enventis Sector 2008 Fiscal Revenue $153.2M 2007 Fiscal Revenue $156.6M 2006 Fiscal Revenue $132.9M 4Q08 Earnings | 3.04.09 | HTCO Telecom $73.2M 48% Enventis $80 M 52% Telecom $74.9M 56% Enventis $58.0M 44% Telecom $76.8M 49% Enventis
Slide 8: Revenue Diversification
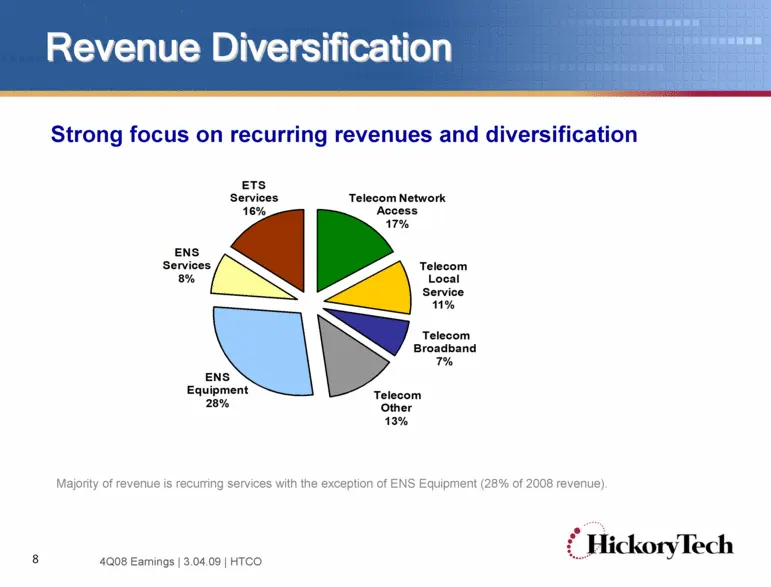
8 Revenue Diversification Strong focus on recurring revenues and diversification Majority of revenue is recurring services with the exception of ENS Equipment (28% of 2008 revenue). 4Q08 Earnings | 3.04.09 | HTCO Telecom Network Access 17% Telecom Local Service 11% Telecom Broadband 7% Telecom Other
Slide 9: Telecom Sector Results
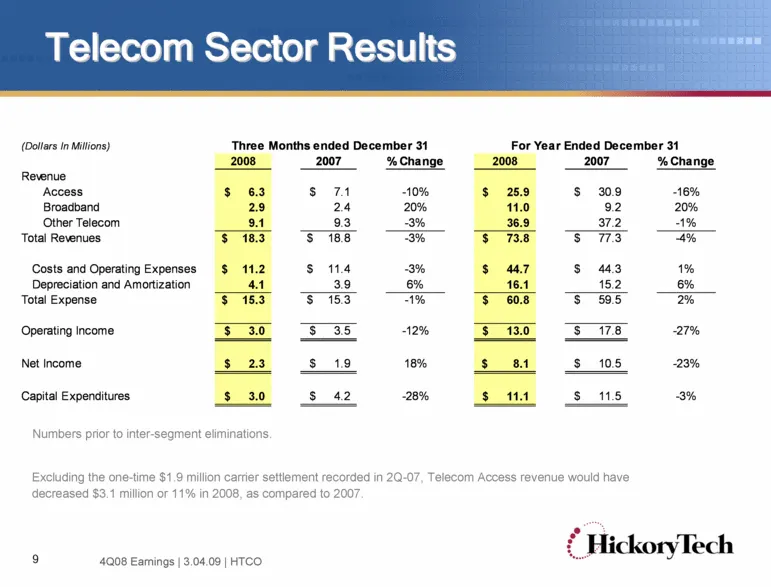
9 Telecom Sector Results Numbers prior to inter-segment eliminations. Excluding the one-time $1.9 million carrier settlement recorded in 2Q-07, Telecom Access revenue would have decreased $3.1 million or 11% in 2008, as compared to 2007. 4Q08 Earnings | 3.04.09 | HTCO (Dollars In Millions) 2008 2007
Slide 10: Network Access Revenue
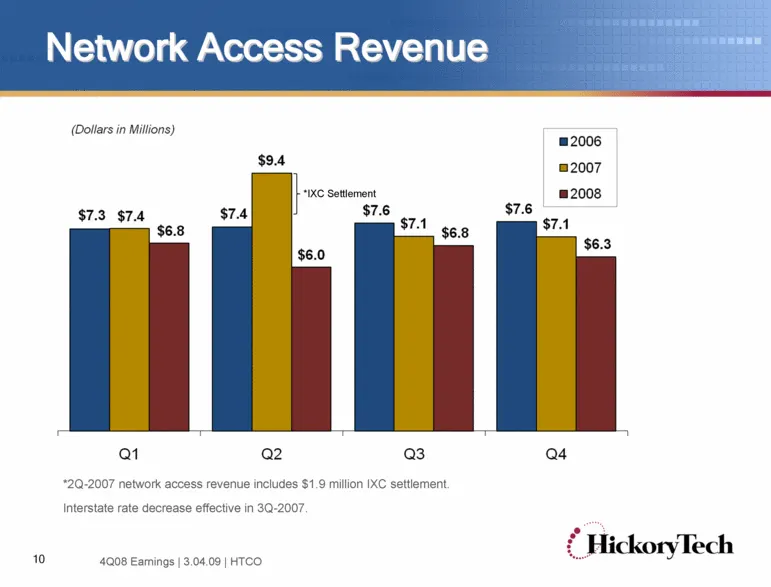
10 Network Access Revenue *2Q-2007 network access revenue includes $1.9 million IXC settlement. Interstate rate decrease effective in 3Q-2007. *IXC Settlement 4Q08 Earnings | 3.04.09 | HTCO
Slide 11: Enventis Sector Results
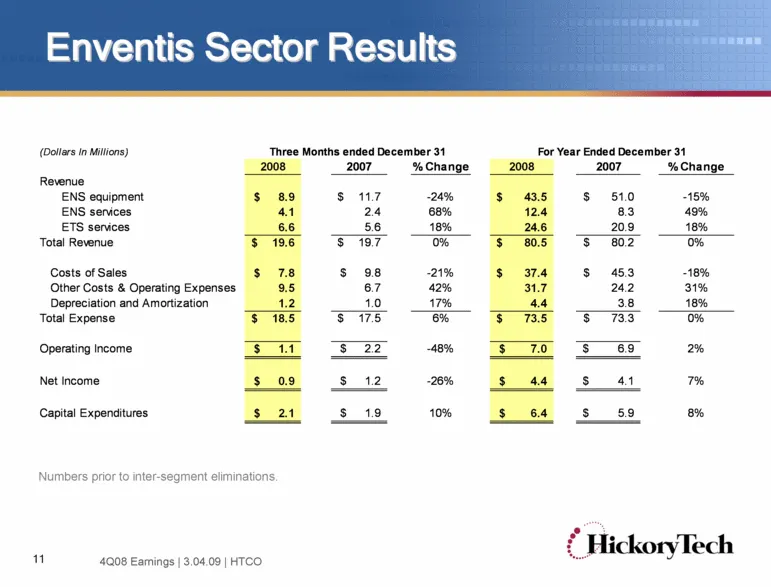
11 Enventis Sector Results Numbers prior to inter-segment eliminations. 4Q08 Earnings | 3.04.09 | HTCO 2008 2007 % Change 2008 2007 % Change Revenue ENS equipment 8.9 $ 11.7 $ -24% 43.5 $ 51.0 $ -15% ENS services 4.1 2.4 68% 12.4 8.3 49% ETS services 6.6 5.6 18% 24.6 20.9 18% Total Revenue 19.6 $ 19
Slide 12: Enventis Product Line Results
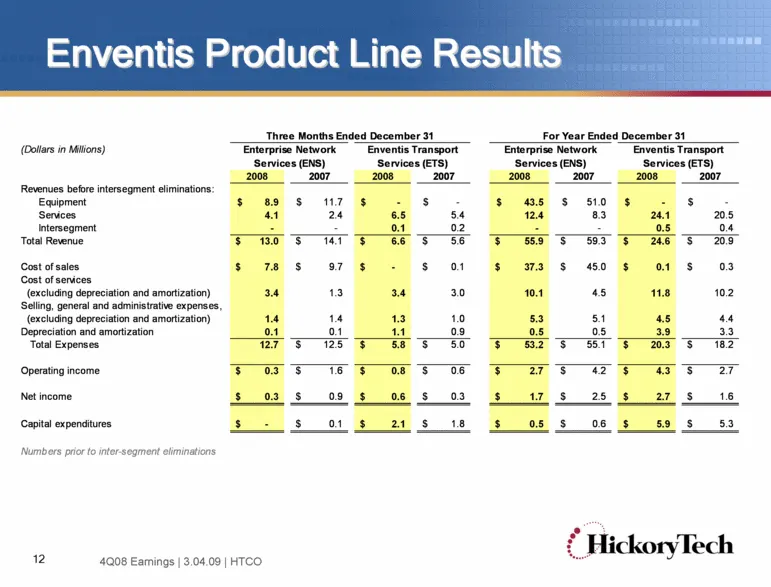
12 Enventis Product Line Results 4Q08 Earnings | 3.04.09 | HTCO (Dollars in Millions) 2008 2007 2008 2007 2008 2007 2008 2007 Revenues before intersegment eliminations: Equipment 8.9 $ 11.7 $ - $ - $ 43.5 $ 51.0 $ - $ - $ Services 4.1 2.4 6.5 5.4 12.4 8.3 24.1 20.5 Intersegment - - 0.1 0.2 - - 0.5 0
Slide 13: Enventis Revenue
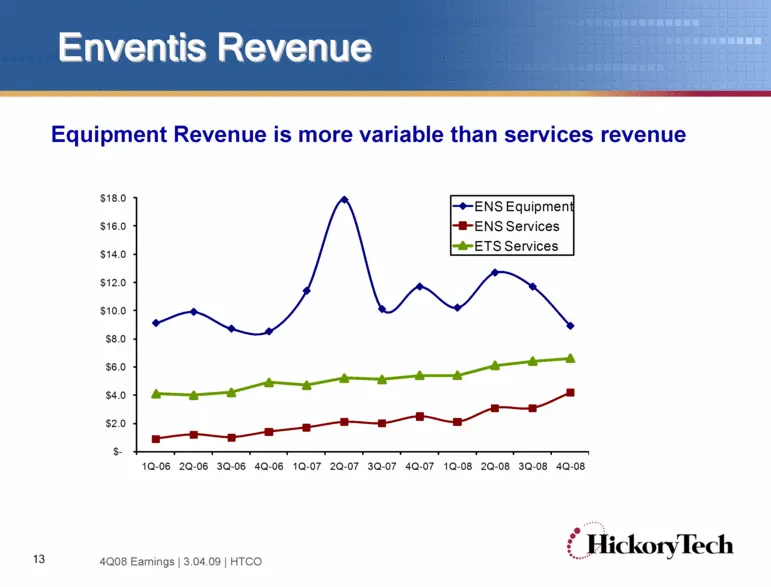
13 Enventis Revenue Equipment Revenue is more variable than services revenue 4Q08 Earnings | 3.04.09 | HTCO $ - $2.0 $4.0 $6.0 $8.0 $10.0 $12.0 $14.0 $16.0 $18.0 1Q-06 2Q-06 3Q-06 4Q-06 1Q-07 2Q-07 3Q-07 4Q-07 1Q-08 2Q-08 3Q-08 4Q-08 ENS Equipment ENS Services ETS Services
Slide 14: 2008 Dividend Summary
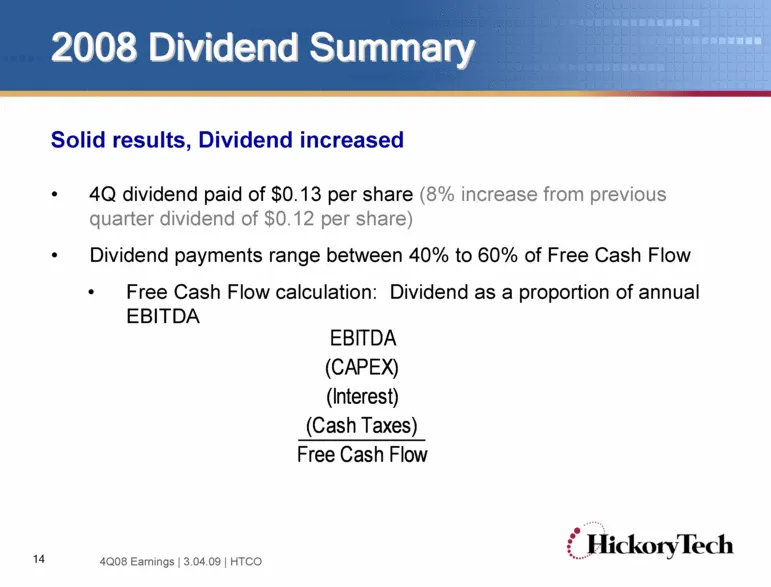
14 2008 Dividend Summary Solid results, Dividend increased 4Q dividend paid of $0.13 per share (8% increase from previous quarter dividend of $0.12 per share) Dividend payments range between 40% to 60% of Free Cash Flow Free Cash Flow calculation: Dividend as a proportion of annual EBITDA 4Q08 Earni
Slide 15: Free Cash Flow: 2008 Illustration
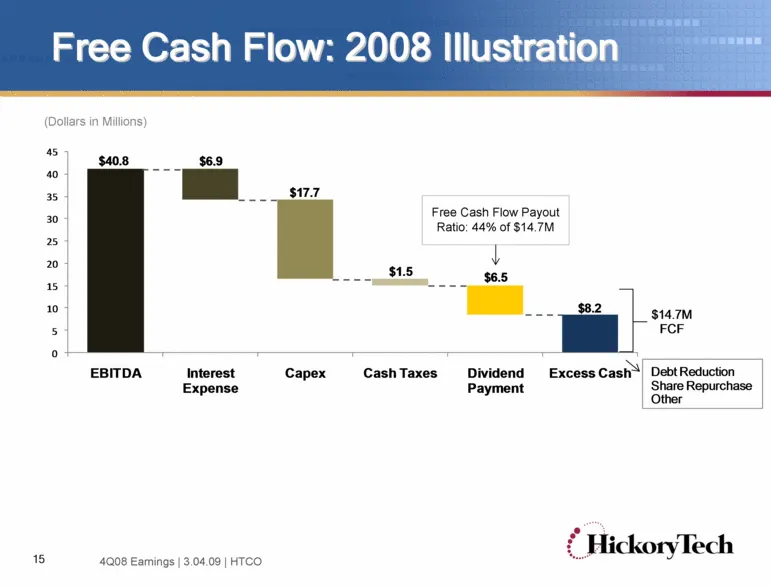
15 Free Cash Flow: 2008 Illustration Free Cash Flow Payout Ratio: 44% of $14.7M (Dollars in Millions) 4Q08 Earnings | 3.04.09 | HTCO
Slide 16: Reconciliation of Operating Income to EBITDA
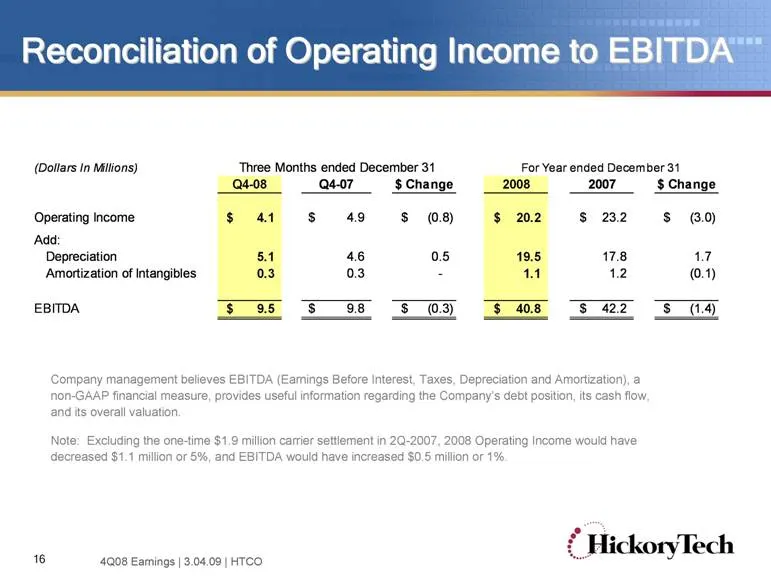
16 Reconciliation of Operating Income to EBITDA Company management believes EBITDA (Earnings Before Interest, Taxes, Depreciation and Amortization), a non-GAAP financial measure, provides useful information regarding the Company’s debt position, its cash flow, and its overall valuation. Note: Exclud
Slide 17: 2009 Fiscal Guidance
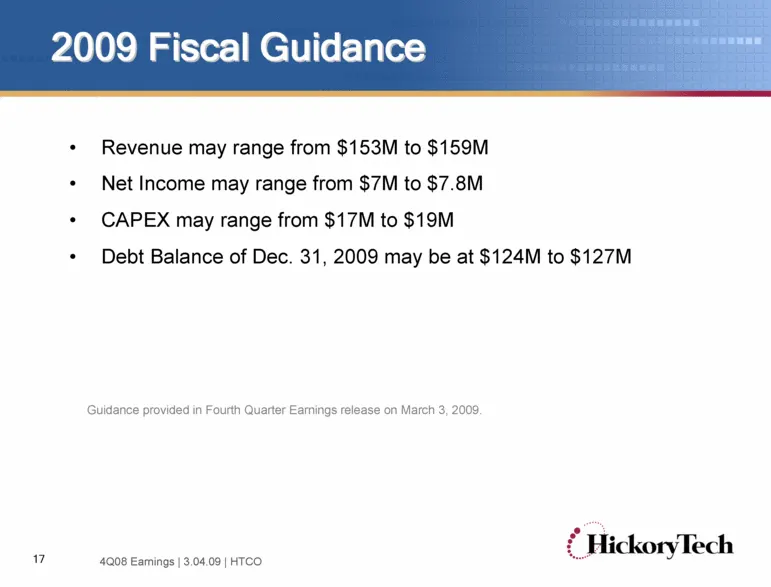
17 2009 Fiscal Guidance Revenue may range from $153M to $159M Net Income may range from $7M to $7.8M CAPEX may range from $17M to $19M Debt Balance of Dec. 31, 2009 may be at $124M to $127M Guidance provided in Fourth Quarter Earnings release on March 3, 2009. 4Q08 Earnings | 3.04.09 | HTCO
Slide 18: Summary
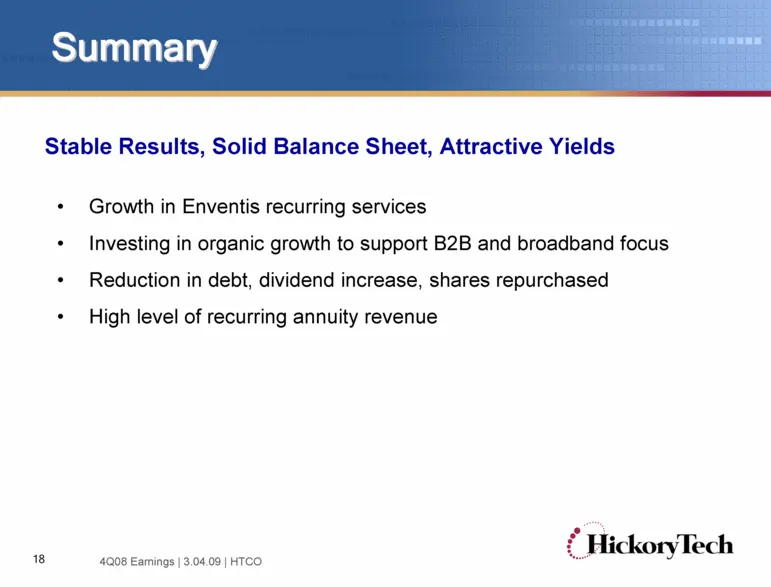
18 Summary Stable Results, Solid Balance Sheet, Attractive Yields Growth in Enventis recurring services Investing in organic growth to support B2B and broadband focus Reduction in debt, dividend increase, shares repurchased High level of recurring annuity revenue 4Q08 Earnings | 3.04.09 | HTCO
Slide 19: HickoryTech Service Area
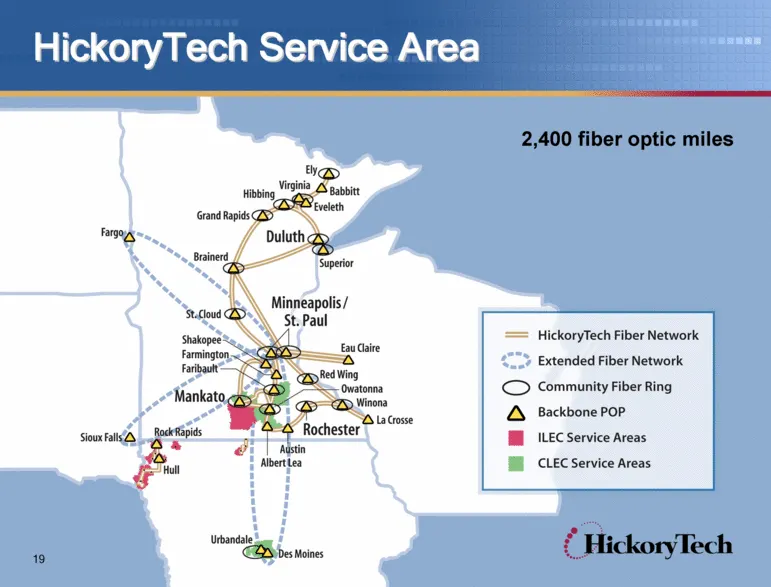
19 HickoryTech Service Area 2,400 fiber optic miles
Source: SEC EDGAR · 8-K filed Mar 5, 2009
More decks from Enventis Corp
 Merger or Acquisition (June 2014)12 slides · Jun 30, 2014
 Hickory Tech — Shareholder Meeting (May 2014)36 slides · May 7, 2014
 Hickory Tech — Q1 2014 Earnings Presentation16 slides · May 2, 2014
 Hickory Tech — Deutsche Bank Media, Internet and Telecom Conference 201431 slides · Mar 11, 2014
 Hickory Tech — Q4 2013 Earnings Presentation21 slides · Mar 4, 2014
 Hickory Tech — Q3 2013 Earnings Presentation16 slides · Nov 7, 2013