Pma Capital — Oppenheimer 4th Annual Mid and Small Cap Conference 2008
30 slides from Pma Capital's conference presentation, Nov 14, 2008

Slide 1: Oppenheimer 4th Annual Mid and Small Cap Conference
SM ® Oppenheimer 4 th Annual Mid and Small Cap Conference November 18, 2008

Slide 2: Forward-looking statements
Forward-looking statements q This presentation and our discussion contain forward- looking information and statements including, but not limited to, such matters as business strategies, market trends, future financial performance, and other matters which inherently involve risks and uncertainties wh

Slide 3: Who We Are
® SM Who We Are Two Ongoing Operating Segments The PMA Insurance Group q Solid presence in workers’ compensation market q Disciplined underwriting standards q Superior long-term client relationships q Statutory capital of $336 million Fee-based Business q Includes combined operating results of PMA M
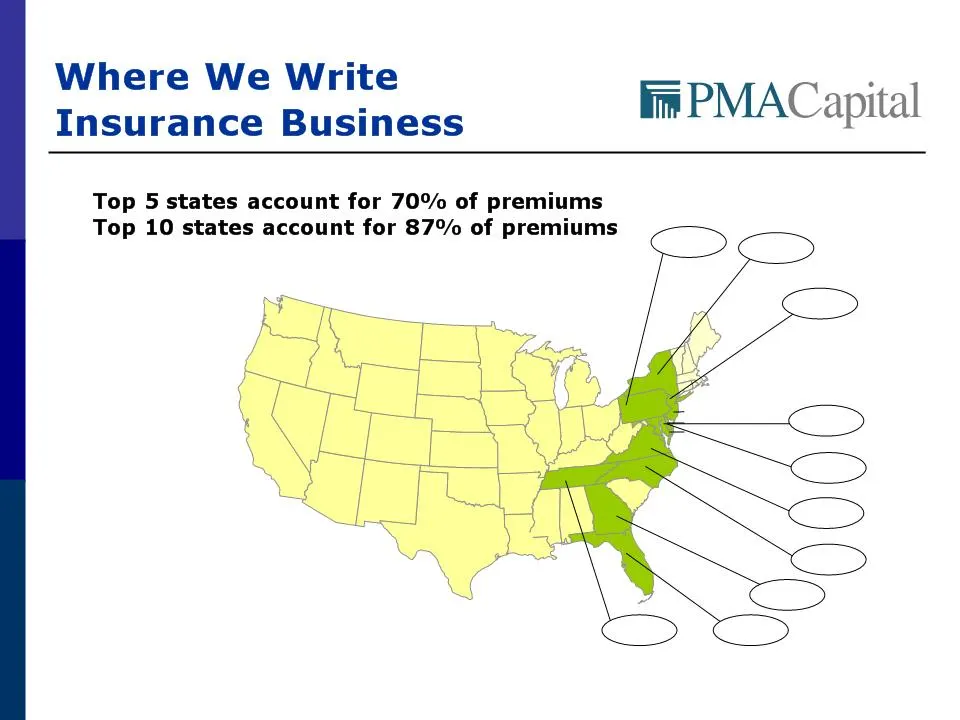
Slide 4: Premium distribution by state
FL NY PA VA NC TN GA ____________________ * Based on direct premiums written, excludes fronting premiums. MI DE MD KY ME VT NH MA RI CT WV OH IN IL SC AL MS WI NJ NM TX OK KS NE SD ND MT WY CO UT ID AZ NV WA CA OR AR LA MO IA MN PA 36% NY 10% NJ 12% MD 6% VA 4% FL 6% NC 4% GA 3% TN 3% DE 3% ® SM
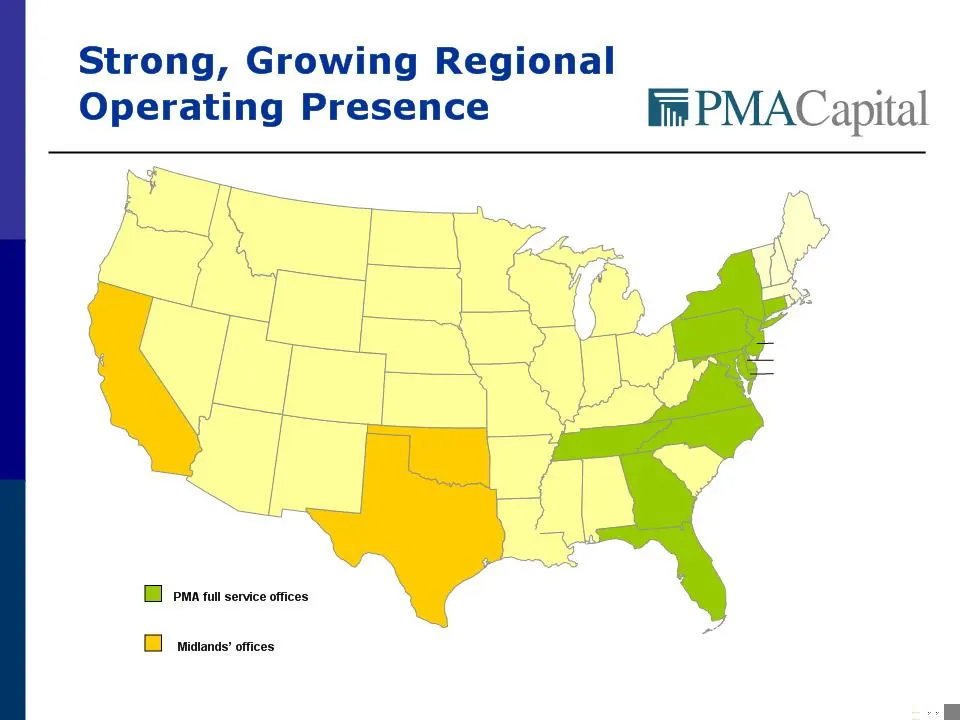
Slide 5: 50 state writing and servicing capabilities
FL NY PA VA NC TN GA TX OK CA MI DE MD KY ME VT NH MA RI CT WV OH IN IL SC AL MS WI NJ NM KS NE SD ND MT WY CO UT ID AZ NV WA OR AR LA MO IA MN ® SM PMA has 50 state writing and servicing capabilities

Slide 6: Highlights
® SM Highlights q 2008 Focus: § Profitable, measured growth at Primary Insurance Operations § High client retention and expansion of Fee- based Business opportunities, as demonstrated by high rate of organic growth and June 2008 acquisition § Assist with regulatory review process in order to obtain
Slide 7: Consolidated Year to Date 9/30 Results
($ millions, except per share) 2008 2007 Direct premiums written $387.7 $418.3 Net premiums earned 286.5 284.6 Fee-based revenues 50.1 22.8 Operating income from continuing operations 18.0 11.6 Loss from discontinued operations (4.9) (16.5) After Tax Capital Gains (Losses) (3.2) - Net Income (Loss)

Slide 8: Consolidated Nine Month Results
® SM Consolidated Nine Month Results q Improved underwriting results at The PMA Insurance Group (combined ratio 96.5% vs. 99.0% in 2007) q Pre-tax operating income increased by 26% at The PMA Insurance Group, compared to first nine months of 2007 q Fee-based revenues increased $27.3 million to $50.1

Slide 9: The PMA Insurance Group
The PMA Insurance Group

Slide 10: Business Overview
Business Overview q Specializes in workers’ compensation and other commercial lines q Focus on mid-size to large accounts § Commercial Markets § Risk Management Services § Specialty Markets q Reputation for excellent customer service and execution
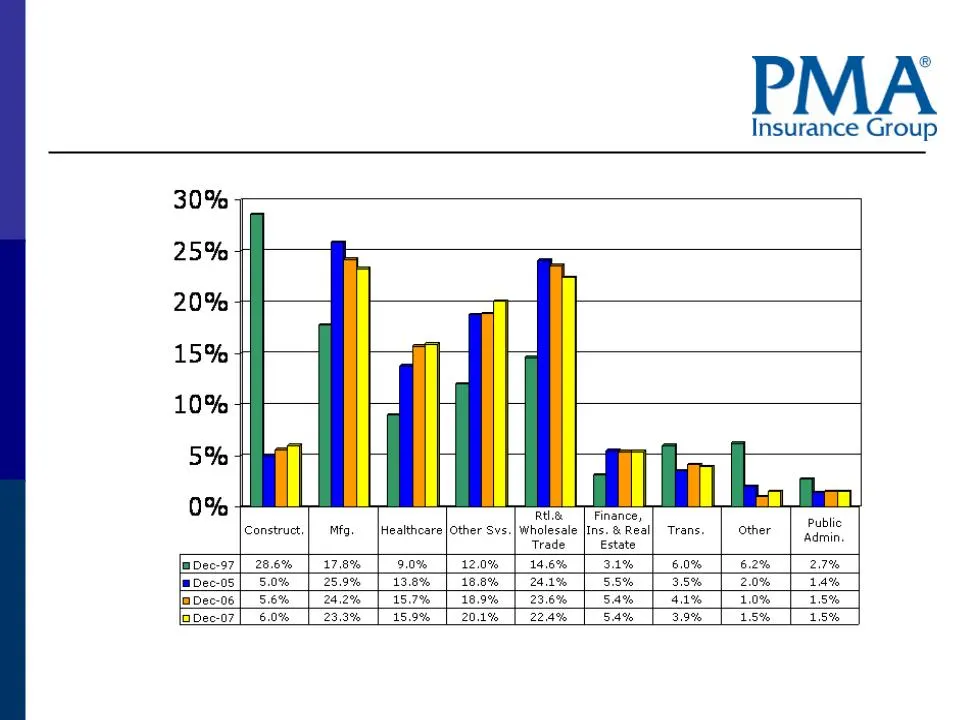
Slide 11: Premium Distribution by Class
Premium Distribution by Class All Lines Combined* * Excluding Fronting Premiums
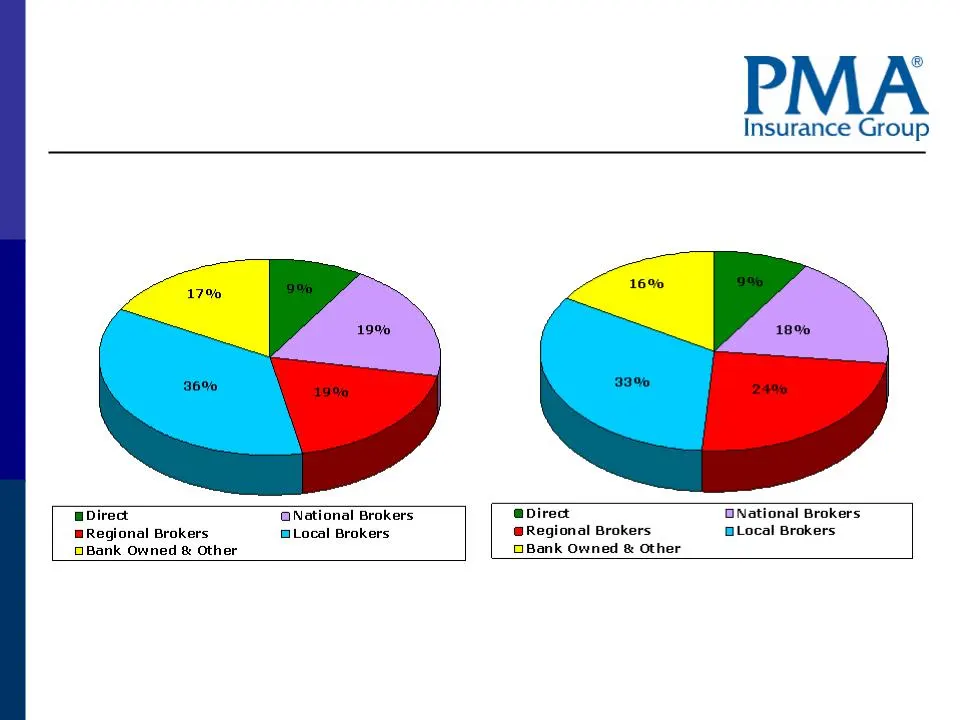
Slide 12: Diversified Distribution Channels
Diversified Distribution Channels Premium Profile by Source* FY Q3 * Excluding Fronting Premiums
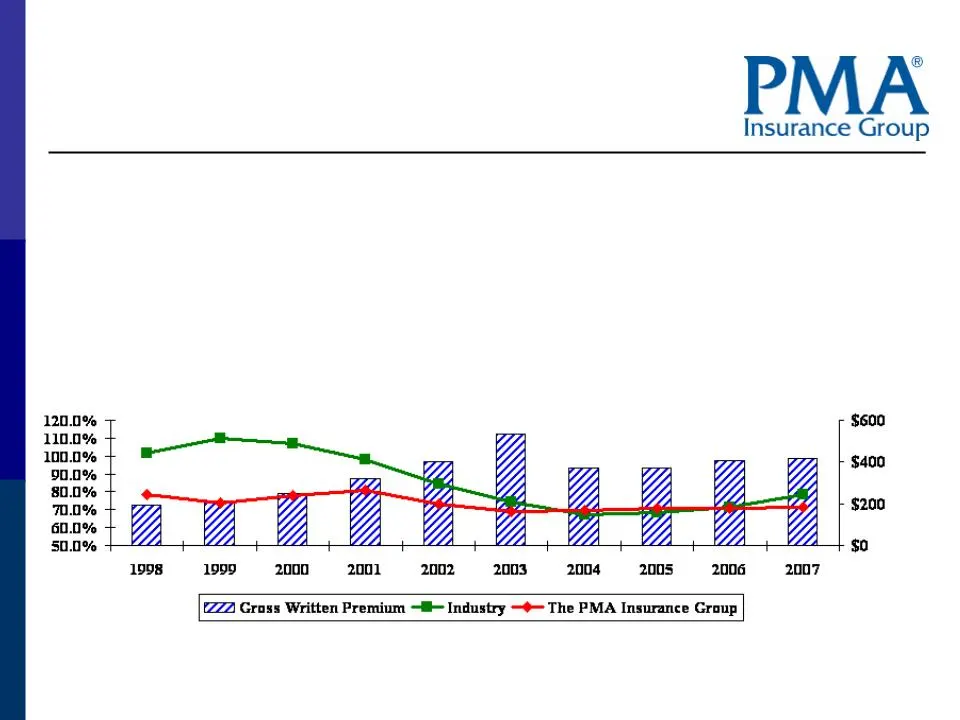
Slide 13: Proven Platform
Source: AM Best Proven Platform q Disciplined underwriting -> Consistent operating returns q The PMA Insurance Group - Workers’ Compensation Estimated Undiscounted Accident Year Net Loss and LAE Ratio (2003 adjusted for retro premium)

Slide 14: Maintain Competitive Advantage in Workers' Compensation Line
Maintain Competitive Advantage in Workers’ Compensation Line q Long-term strategy of Insurance Group is to write workers compensation business at a combined ratio of 100% through underwriting cycle q September year to date 2008 combined ratio of 96.5%, 2007 full year combined ratio was 99.7% q Measu

Slide 15: Managing the Loss and LAE Ratio
Managing the Loss and LAE Ratio q Pricing changes, coupled with payroll inflation for rate sensitive workers’ compensation business were below overall estimated loss trends q Diversification among classes of business insured q Loss containment protection in loss sensitive business (about 40- 45% of

Slide 16: Managing the Loss and LAE Ratio (cont.)
Managing the Loss and LAE Ratio (cont.) q Strategic alliances: § Coventry: preferred provider network; out of network bill review § QualCare: preferred provider network in NJ § MedRisk: physical therapy provider § Corporate Systems: detailed medical bill review § TMESYS: retail pharmacy program § Pa

Slide 17: Fee-based Business
im PMAC apital PMA <p> Management Corp. THE MIDLANDS COMPANIES PMA Management Corp of New England

Slide 18: Fee-based Business segment overview
q In fourth quarter of 2007, began reporting Fee-based Business results as a separate operating segment q PMA Management Corp. § Third-Party Administrator (TPA) producing fee-based revenues § Focus on workers’ compensation & risk management services § Business shares IT infrastructure with PMA Insur

Slide 19: PMA Management Corp.
PMA Management Corp. q Broad service capabilities: § Claims administration/TPA § Managed care § Disability management § Risk control q Solid portfolio of managed care strategic alliances that leverage combined purchasing power with insurance operations q Three-year business retention of over 90% q R

Slide 20: Midlands Management Corporation
Midlands Management Corporation q Acquired October 1, 2007- Initial cash paid of $19.8 million § Ultimate price, which is based on EBITDA growth levels over next four years, could range from $22.8 million (6.9x EBITDA) to $44.5 million (4.8x EBITDA) q Overview of Midlands § Very strong name recognit

Slide 21: PMA Management Corp. of New England
PMA Management Corp. of New England q Connecticut-based TPA, formerly Webster Risk Services q Purchase price of $7.3 million, closing adjustments reduced cash transferred to $5.9 million q Specializes in providing workers’ compensation and risk management services to health care systems and public e

Slide 22: Holding Company Review
SM ® Holding Company Review
Slide 23: Capitalization
$ millions 9/30/08 12/31/07 Shareholders' Equity (Including SFAS #115) $358.0 $378.6 Shareholders' Equity (Excluding SFAS #115) $380.1 $374.6 Debt $129.4 $131.3 Debt to Capital (Including SFAS #115) 27% 26% Capitalization
Slide 24: Debt Structure
$ millions 9/30/08 Trust Preferred and Surplus Notes, Mature 2033-37 $ 74.4 Monthly Senior Notes, Matures 2018 54.9 Other .1 Total $ 129.4 Debt Structure

Slide 25: Invested Assets
Invested Assets
Slide 26: Invested assets by asset type
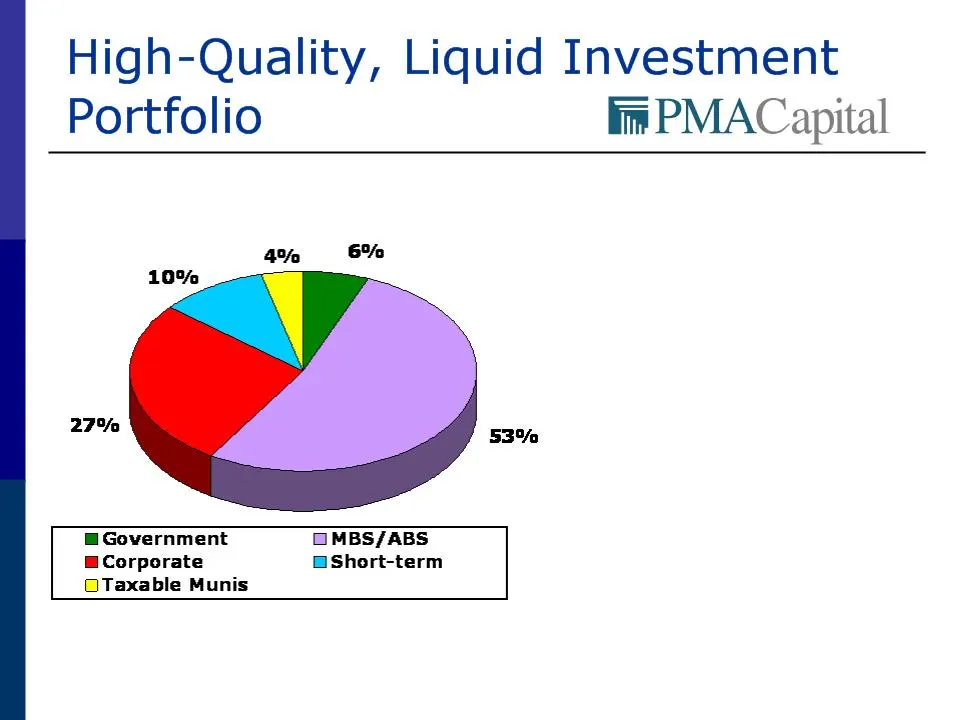
® SM Total = $823 million (excludes cash) September 30, 2008 Asset Type n Conservative investment posture n No wrapped ABS CDO exposures n No derivatives n No equity exposure n Pre-tax net unrealized loss of $33 million at September 30, 2008 n Outside professional manager
Slide 27: Asset Quality
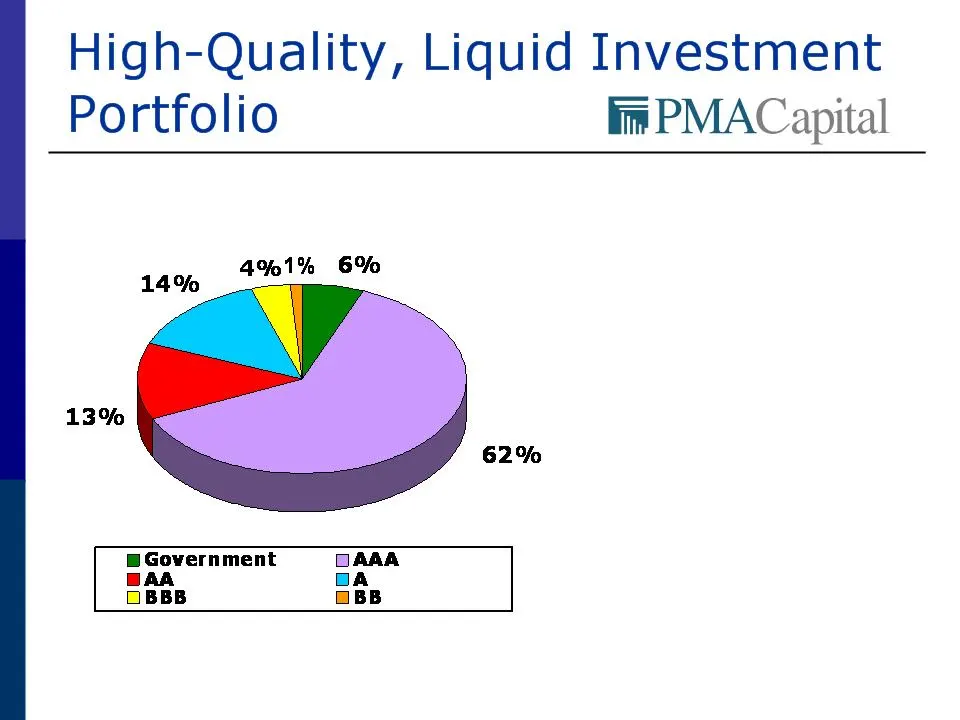
® SM Total = $735 million (excludes short-term investments and cash) September 30, 2008 Asset Quality n AA+ average credit quality n 68% AAA Rated or Government bonds n 2% held in Alternative A/ Subprime loans - average credit quality of AAA with no OTTI n 4% held in credit-enhanced securities with

Slide 28: Investment portfolio notes
® SM p Pre-tax other than temporary impairment (OTTI) charges of $8.2 million and $913,000 taken through realized losses on holdings in Lehman senior debt and Fannie Mae preferred stock, respectively; collectively approx 1% of the investment portfolio. There were no other OTTI losses during the nine
Slide 29: PMA Capital Book Value
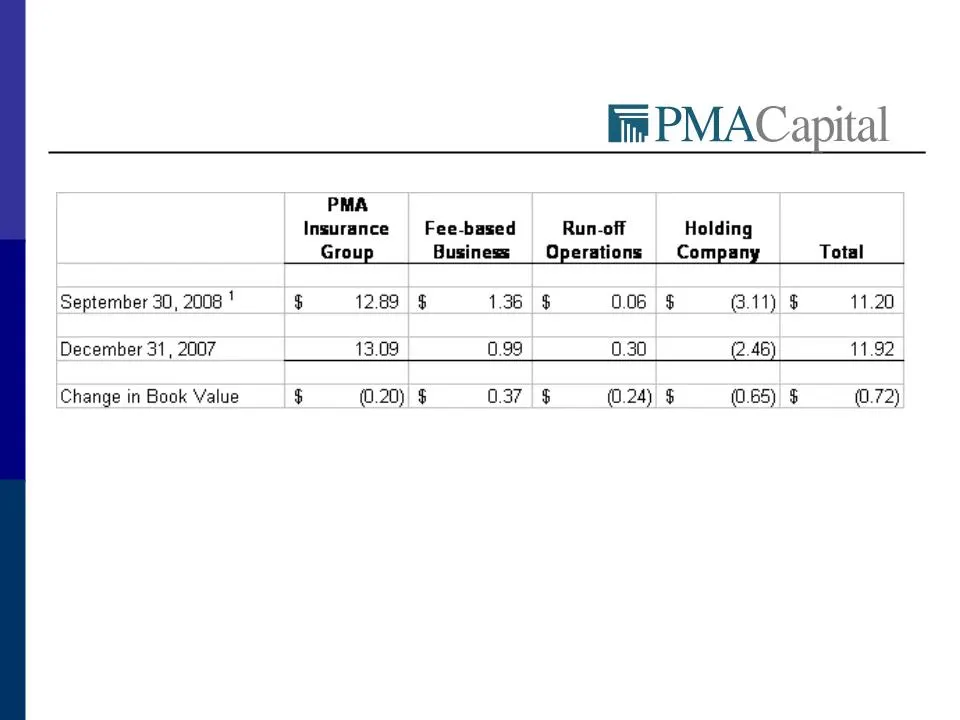
1 Fee-based Business book value increased $0.23 as a result of the acquisition of PMA Management Corp. of New England. The purchase price was funded by the Holding Company. PMA Capital Book Value
Slide 30: 2008 results and expectations
q 2008 results through September detail execution of our business plan: § Measured revenue growth at The PMA Insurance Group § Diligent expense management § Continued expansion of fee-based service platform q Expecting profitable growth in workers’ compensation in q Execution of 2008 plan should res
Source: SEC EDGAR · 8-K filed Nov 14, 2008