Carolina Bank Holding Inc. (NC)
Carolina Bank Holding Inc. (NC) — Carolina Bank Holdings — Investor Presentation (April 2005)
19 slides from Carolina Bank Holding Inc. (NC)'s investor presentation, Apr 21, 2005

Slide 1: Our Commitment to Community: 2004 Annual Report
OUR COMMITMENT TO COMMUNITY 2004 ANNUAL REPORT CAROLINA BANK HOLDINGS, INC.

Slide 2: Forward Looking Statement
Forward Looking Statement This presentation may contain, in addition to historical information, various “forward looking statements” that represent our judgment concerning the future and are subject to risks and uncertainties that could cause Carolina Bank Holdings’ actual operating results and fina
Slide 3: Our Mission
Our Mission To provide the highest quality customer service in our community through a value-added banking relationship. Utilize the highest level of personnel resources and technology to effectively manage the bank and ensure our financial institution is safe and sound. Create a challenging and rew
Slide 4: Overview
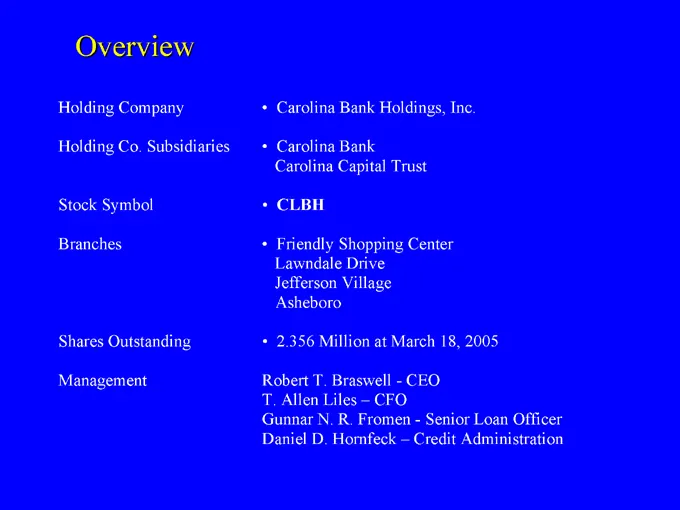
Overview Holding Company Carolina Bank Holdings, Inc. Holding Co. Subsidiaries Carolina Bank Carolina Capital Trust Stock Symbol CLBH Branches Friendly Shopping Center Lawndale Drive Jefferson Village Asheboro Shares Outstanding 2.356 Million at March 18, 2005 Management Robert T. Braswell—CEO T. Al
Slide 5: History of the Bank
History of the Bank Opened November, 1996 New main office completed in July, 2000 Formed Holding Company in August, 2000 Completed Trust Preferred Offering of $3 million in March 2001 and $10 million in 2004 Opened 3rd Office at Jefferson Village in December, 2001 Opened Asheboro loan office in May,
Slide 6: Net Income
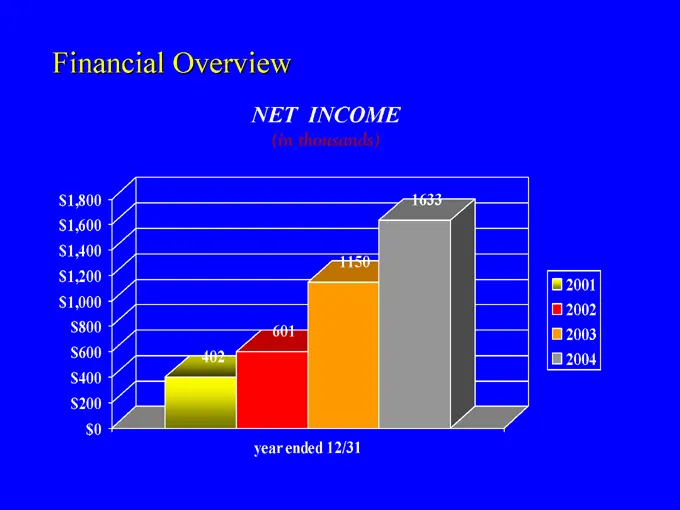
Financial Overview NET INCOME (in thousands) $1,800 $1,600 $1,400 $1,200 $1,000 $800 $600 $400 $200 $0 1150 1633 2001 2002 2003 2004 year ended 12/31
Slide 7: Net Income
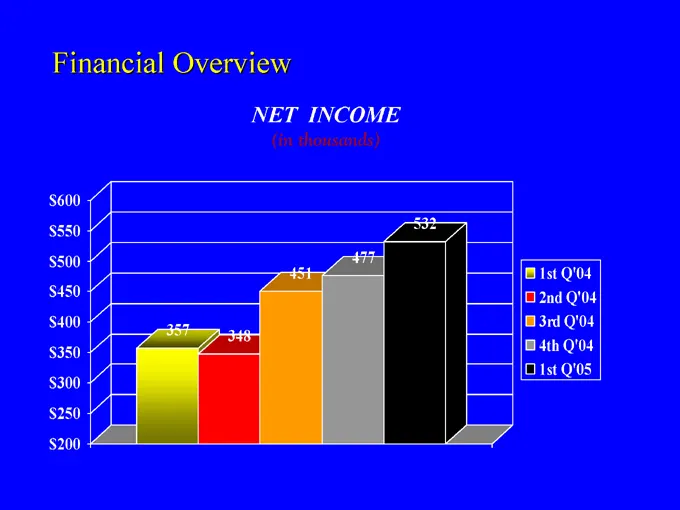
Financial Overview NET INCOME (in thousands) $600 $550 $500 $450 $400 $350 $300 $250 $200 532 477 451 357 348 1st Q’04 2nd Q’04 3rd Q’04 4th Q’04 1st Q’05
Slide 8: Diluted Earnings Per Share
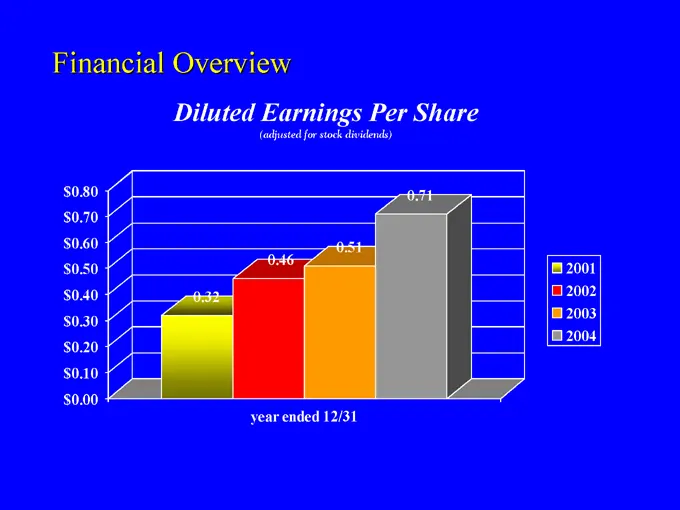
Financial Overview Diluted Earnings Per Share (adjusted for stock dividends) $0.80 $0.70 $0.60 $0.50 $0.40 $0.30 $0.20 $0.10 $0.00 0.71 0.51 0.46 0.32 2001 2002 2003 2004 year ended 12/31
Slide 9: Diluted Earnings Per Share
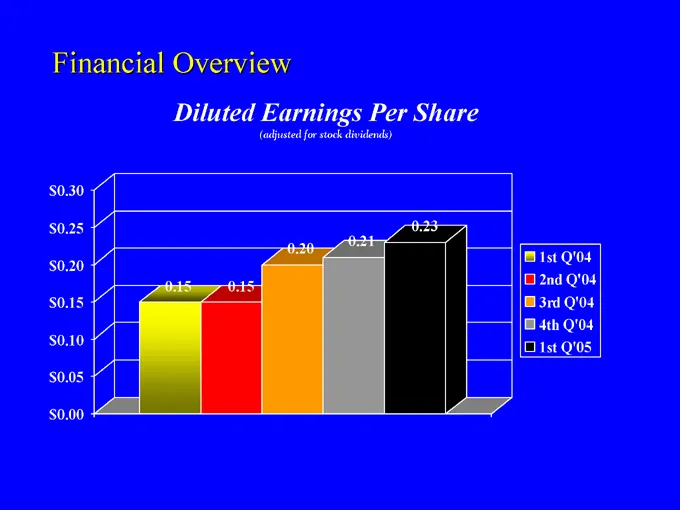
Financial Overview Diluted Earnings Per Share (adjusted for stock dividends) $0.30 $0.25 $0.20 $0.15 $0.10 $0.05 $0.00 0.23 0.21 0.20 0.15 0.15 1st Q’04 2nd Q’04 3rd Q’04 4th Q’04 1st Q’05
Slide 10: Total Assets
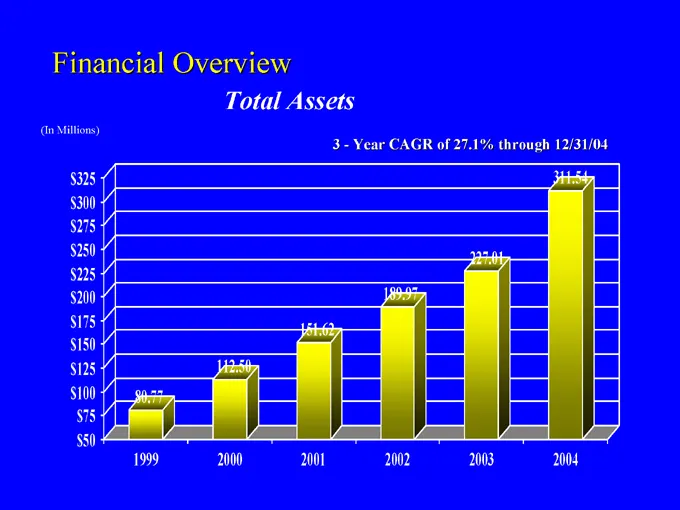
Financial Overview Total Assets (In Millions) 3—Year CAGR of 27.1% through 12/31/04 $325 $300 $275 $250 $225 $200 $175 $150 $125 $100 $75 $50 80.77 112.50 151.62 189.97 227.01 311.54 1999 2000 2001 2002 2003 2004
Slide 11: Total Deposits
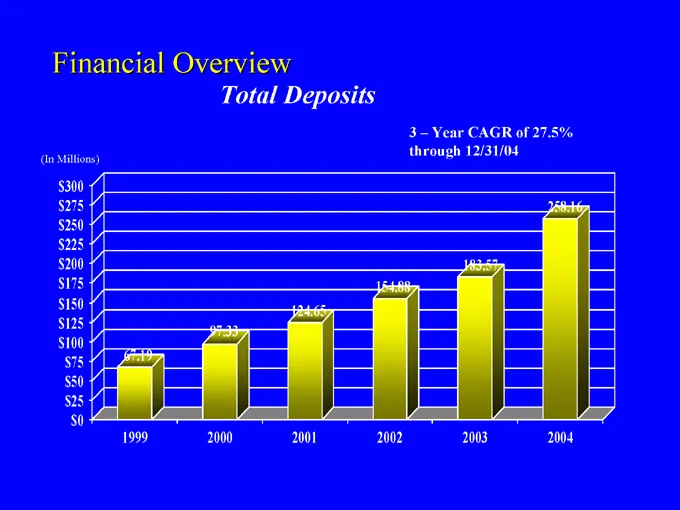
Financial Overview Total Deposits 3 – Year CAGR of 27.5% through 12/31/04 (In Millions) $300 $275 $250 $225 $200 $175 $150 $125 $100 $75 $50 $25 $0 258.16 183.57 154.88 124.65 97.33 67.19 1999 2000 2001 2002 2003 2004
Slide 12: Total Loans
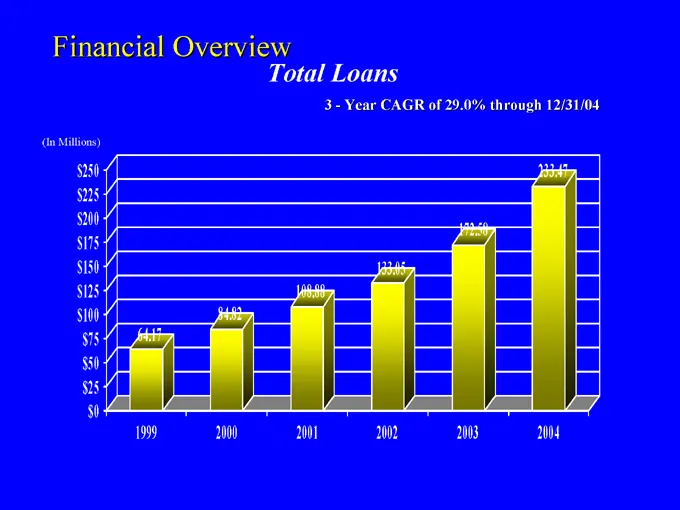
Financial Overview Total Loans 3—Year CAGR of 29.0% through 12/31/04 (In Millions) $250 $225 $200 $175 $150 $125 $100 $75 $50 $25 $0 233.47 172.58 133.05 108.88 84.82 64.17 1999 2000 2001 2002 2003 2004
Slide 13: Net Interest Income
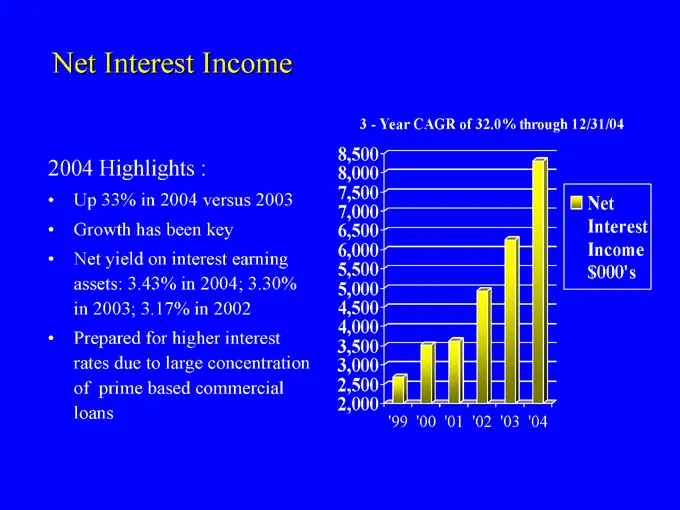
Net Interest Income 2004 Highlights : Up 33% in 2004 versus 2003 Growth has been key Net yield on interest earning assets: 3.43% in 2004; 3.30% in 2003; 3.17% in 2002 Prepared for higher interest rates due to large concentration of prime based commercial loans 3—Year CAGR of 32.0% through 12/31/04 8
Slide 14: Strong Loan Quality
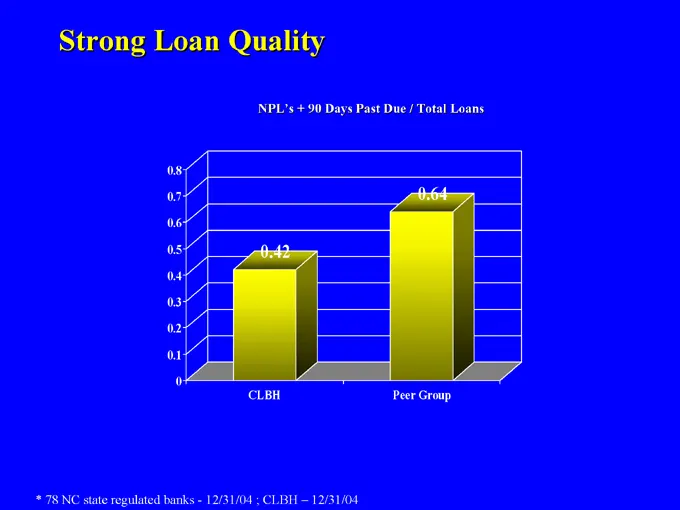
Strong Loan Quality NPL’s + 90 Days Past Due / Total Loans 0.8 0.7 0.6 0.5 0.4 0.3 0.2 0.1 0 0.42 0.64 CLBH Peer Group * 78 NC state regulated banks—12/31/04 ; CLBH – 12/31/04
Slide 15: Strong Loan Quality
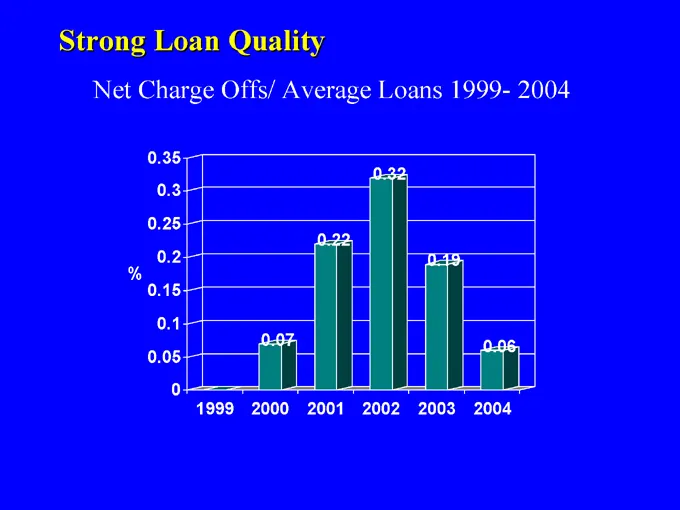
Strong Loan Quality Net Charge Offs/ Average Loans 1999- 2004 0.35 0.3 0.25 0.2 % 0.15 0.1 0.05 0 0.32 0.22 0.19 0.07 0.06 1999 2000 2001 2002 2003 2004
Slide 16: Fee Income
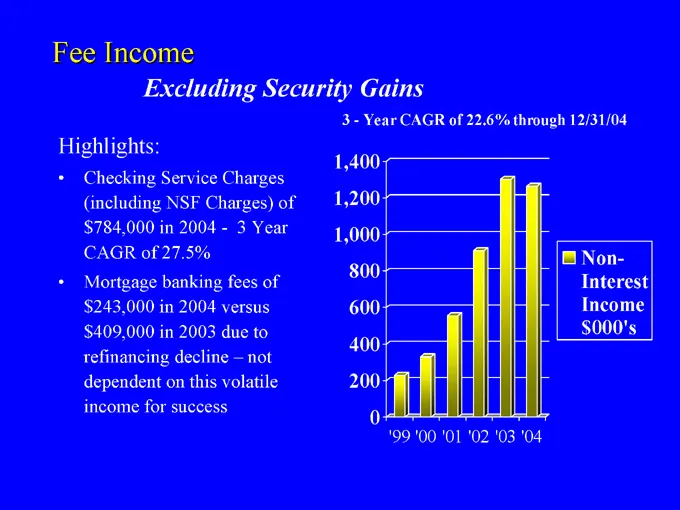
Fee Income Excluding Security Gains 3 - Year CAGR of 22.6% through 12/31/04 Highlights: Checking Service Charges (including NSF Charges) of $784,000 in 2004—3 Year CAGR of 27.5% Mortgage banking fees of $243,000 in 2004 versus $409,000 in 2003 due to refinancing decline – not dependent on this volat
Slide 17: Products and Services
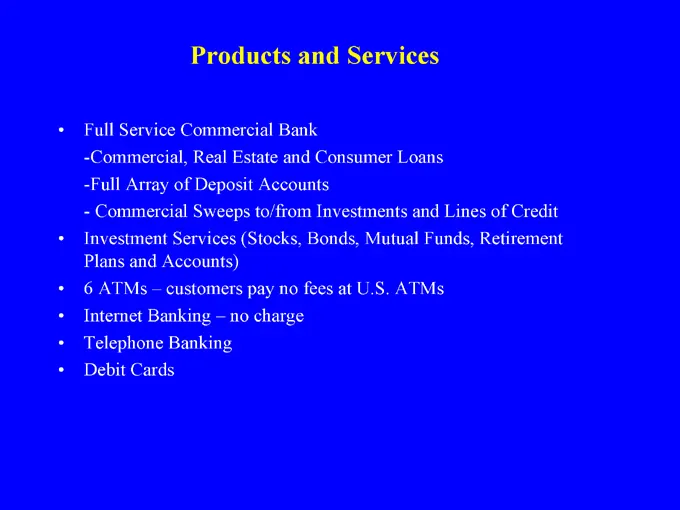
Products and Services Full Service Commercial Bank Commercial, Real Estate and Consumer Loans Full Array of Deposit Accounts Commercial Sweeps to/from Investments and Lines of Credit Investment Services (Stocks, Bonds, Mutual Funds, Retirement Plans and Accounts) 6 ATMs – customers pay no fees at U.
Slide 18: CLBH Stock Facts
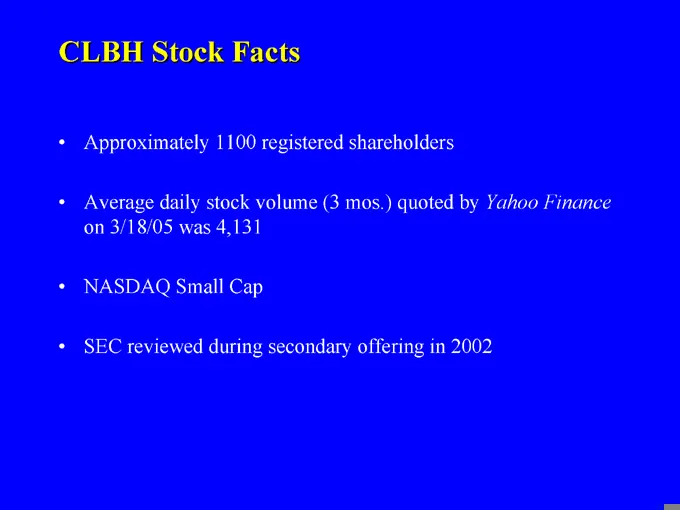
CLBH Stock Facts Approximately 1100 registered shareholders Average daily stock volume (3 mos.) quoted by Yahoo Finance on 3/18/05 was 4,131 NASDAQ Small Cap SEC reviewed during secondary offering in 2002
Slide 19: Summary
Summary Core bank established for profitable growth Strong, seasoned management team Highly attractive markets Strong asset quality Significant growth potential in EPS and market share Relationship banking approach versus transactional
Source: SEC EDGAR · 8-K filed Apr 21, 2005
More decks from Carolina Bank Holding Inc. (NC)
 Merger or Acquisition (June 2016)18 slides · Jun 22, 2016
 Southeast 2008 Super Community Bank Conference31 slides · Feb 12, 2008
 Southeast 2007 Super Community Bank Conference31 slides · Feb 14, 2007
 Mid-Atlantic 2006 Super Community Bank Conference25 slides · Nov 7, 2006
 Southeast Super-Community Bank Conference (February 2006)25 slides · Feb 6, 2006
 Southeast Super-Community Bank Conference 200415 slides · Feb 2, 2004