Allegiance Bancshares — Debt Investor Presentation (September 2019)
28 slides from Allegiance Bancshares's debt investor presentation, Sep 20, 2019

Slide 1: Fixed Income Investor Presentation
Fixed Income Investor Presentation September 2019 Fixed Income Investor Presentation [Month] [Day], 2019 Fixed Income Investor Presentation September 20, 2019 cshares, Inc. Exhibit 99.1
Slide 2: Forward-Looking Statements
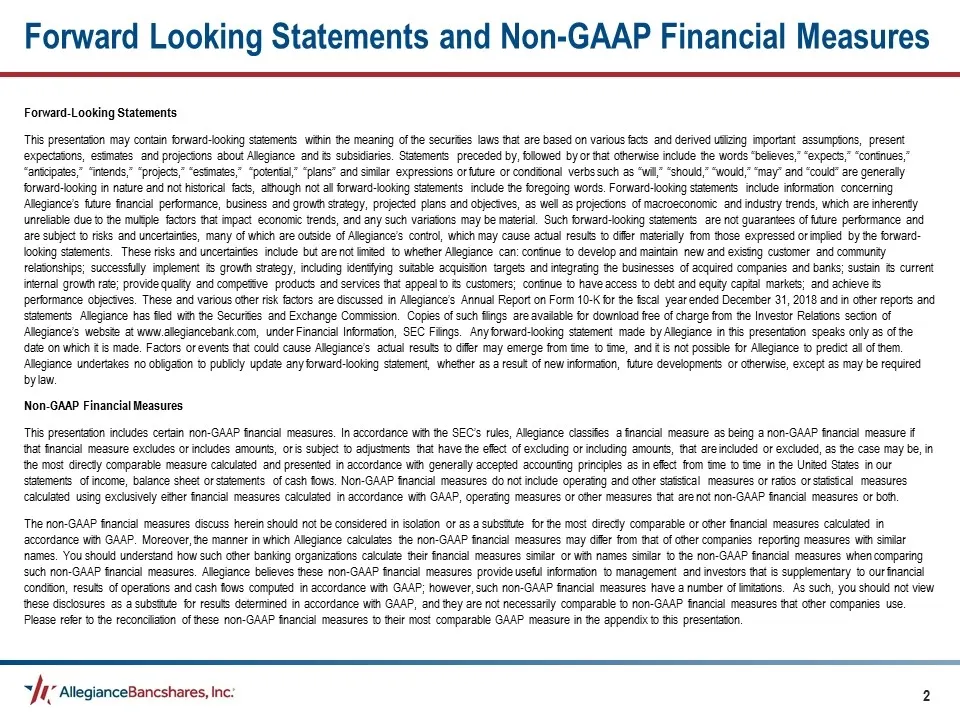
Forward-Looking Statements This presentation may contain forward-looking statements within the meaning of the securities laws that are based on various facts and derived utilizing important assumptions, present expectations, estimates and projections about Allegiance and its subsidiaries. Statements
Slide 3: Preliminary Term Sheet
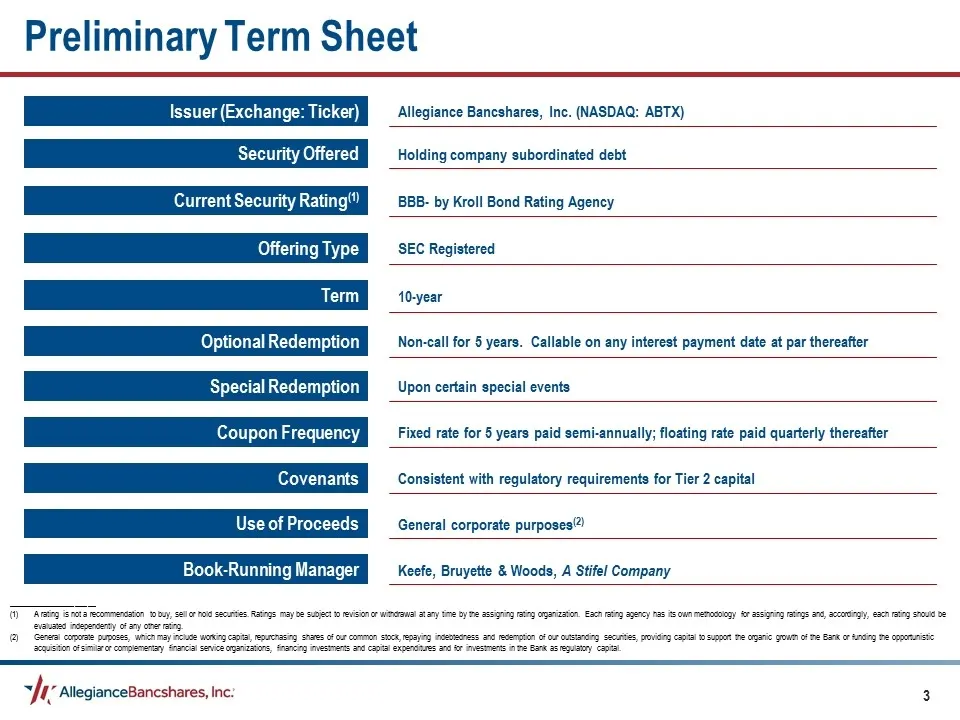
_____________________ A rating is not a recommendation to buy, sell or hold securities. Ratings may be subject to revision or withdrawal at any time by the assigning rating organization. Each rating agency has its own methodology for assigning ratings and, accordingly, each rating should be evaluate
Slide 4: Corporate Overview
Corporate Overview Wh ” AllegianceBancshares, Inc:
Slide 5: Allegiance Bancshares, Inc. Overview
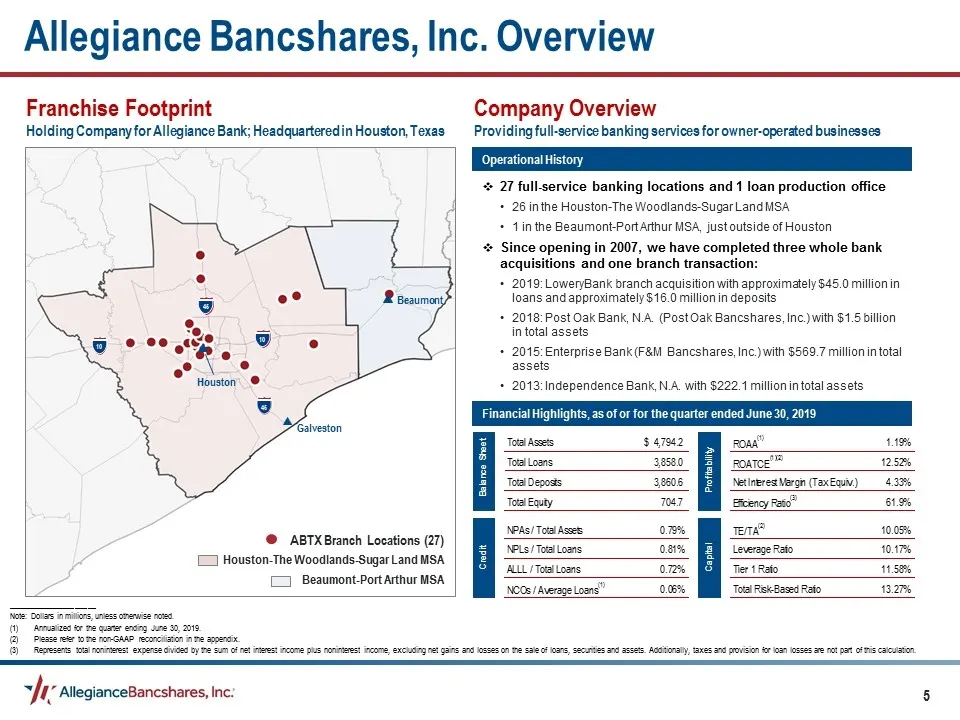
Allegiance Bancshares, Inc. Overview Franchise Footprint Holding Company for Allegiance Bank; Headquartered in Houston, Texas Company Overview Providing full-service banking services for owner-operated businesses Operational History 27 full-service banking locations and 1 loan production office 26 i
Slide 6: Senior Management Team
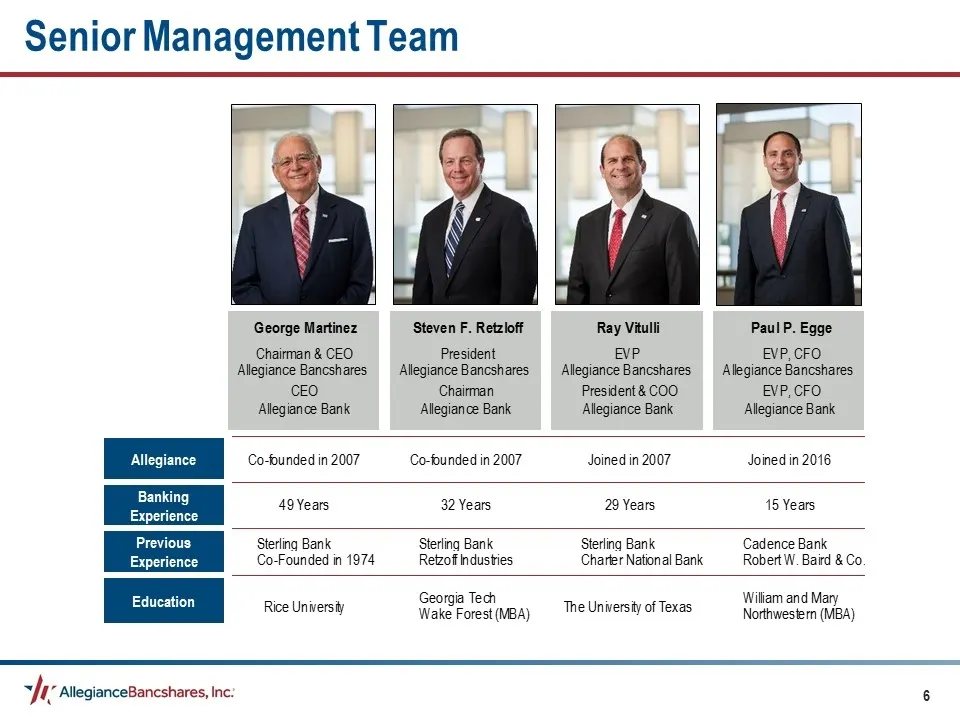
Senior Management Team Allegiance Banking Experience Previous Experience Education
Slide 7: Key Credit Investor Highlights
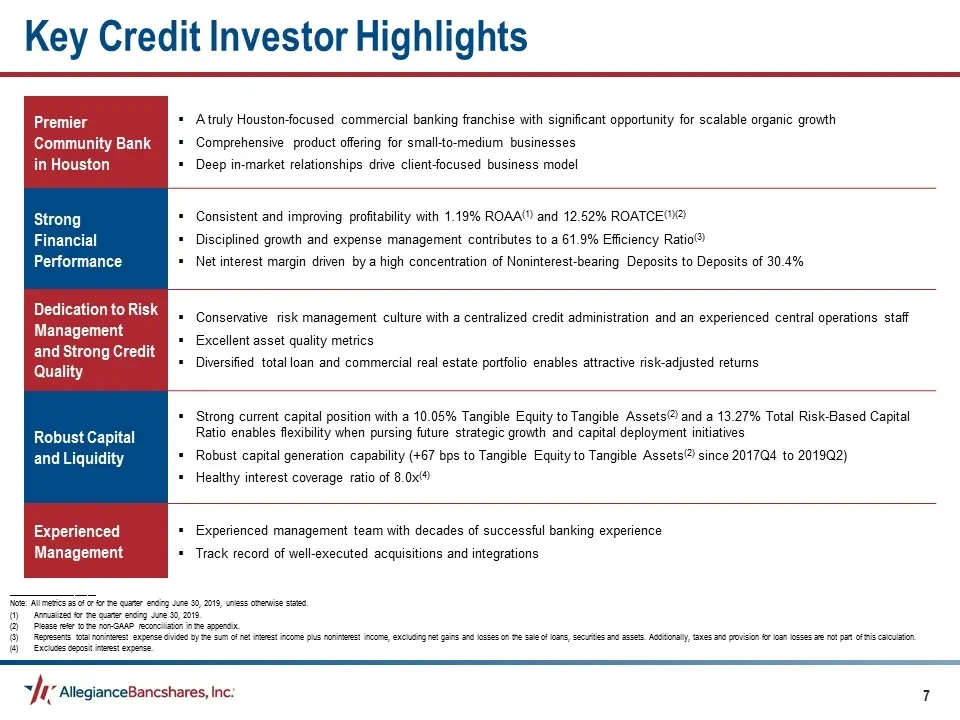
Key Credit Investor Highlights Premier Community Bank in Houston A truly Houston-focused commercial banking franchise with significant opportunity for scalable organic growth Comprehensive product offering for small-to-medium businesses Deep in-market relationships drive client-focused business mode
Slide 8: Significant Market Share in the Houston MSA
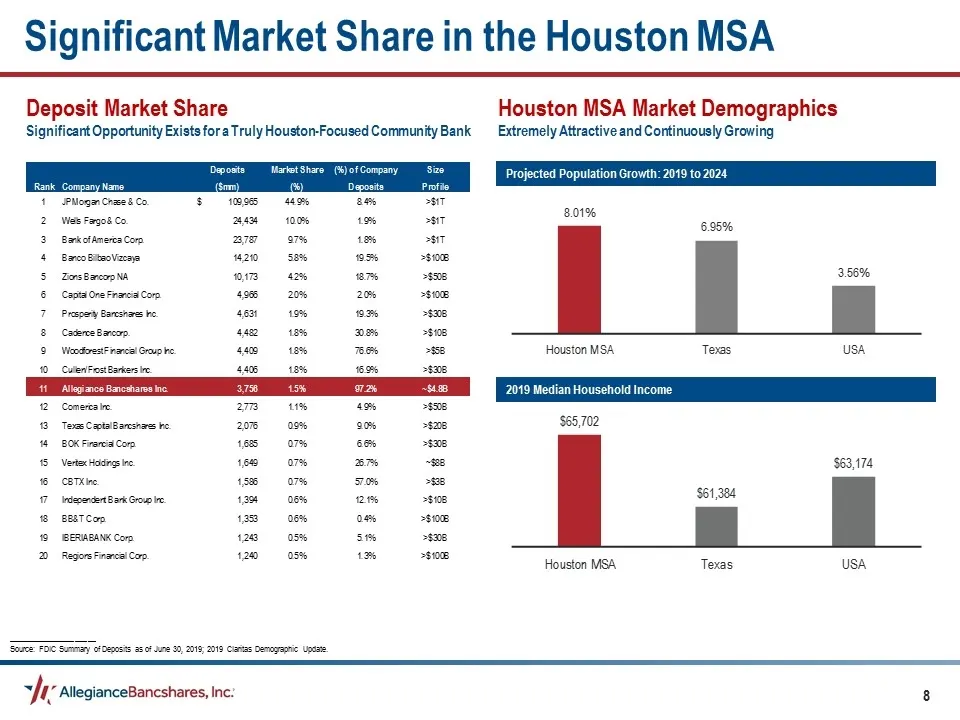
Significant Market Share in the Houston MSA Deposit Market Share Significant Opportunity Exists for a Truly Houston-Focused Community Bank Houston MSA Market Demographics Extremely Attractive and Continuously Growing Projected Population Growth: 2019 to 2024 2019 Median Household Income ____________
Slide 9: Houston Highlights
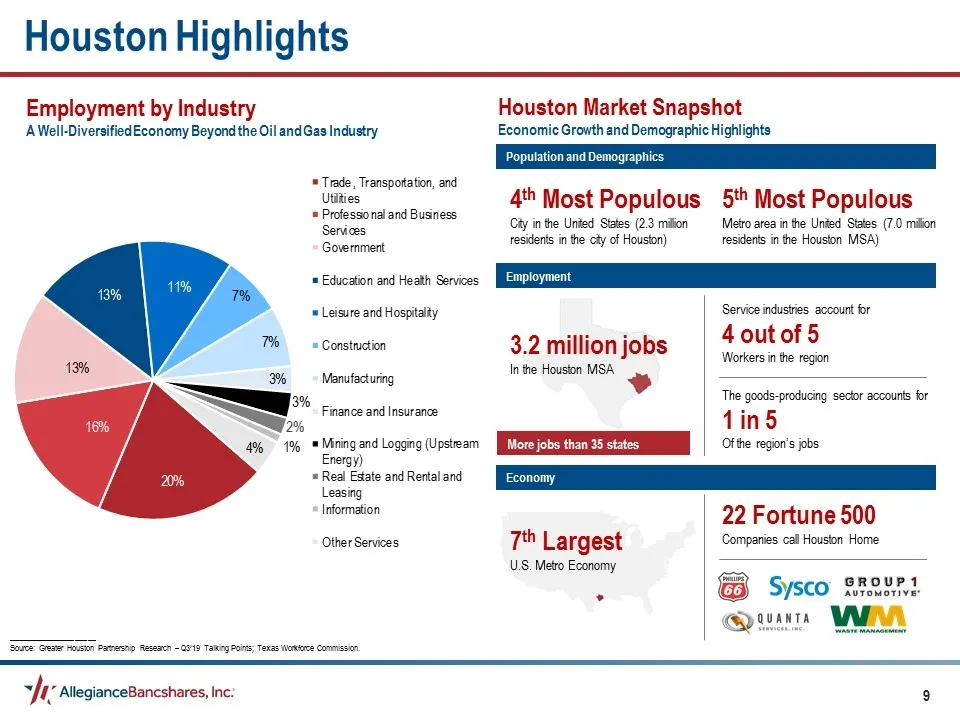
Houston Highlights Employment by Industry A Well-Diversified Economy Beyond the Oil and Gas Industry Houston Market Snapshot Economic Growth and Demographic Highlights _____________________ Source: Greater Houston Partnership Research – Q3’19 Talking Points; Texas Workforce Commission. Population an
Slide 10: Our Super-Community Banking Strategy
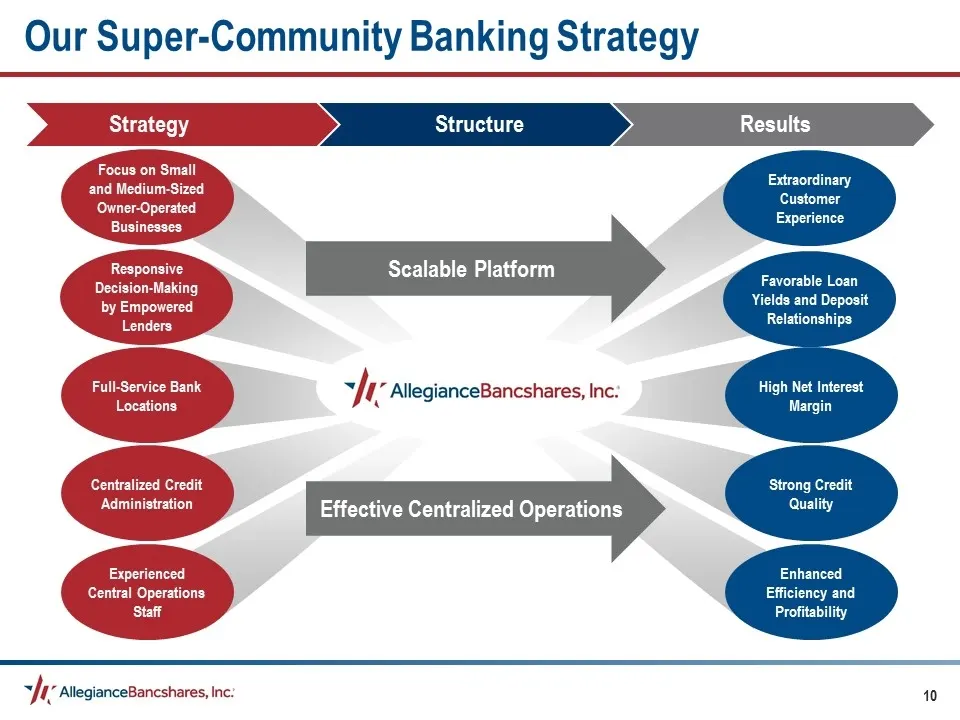
Our Super-Community Banking Strategy High Net Interest Margin Strong Credit Quality Centralized Credit Administration Focus on Small and Medium-Sized Owner-Operated Businesses Full-Service Bank Locations Favorable Loan Yields and Deposit Relationships Effective Centralized Operations Scalable Platfo
Slide 11: Financial Highlights
Financial Highlights Wh ” AllegianceBancshares, Inc:
Slide 12: Financial Highlights – Second Quarter 2019
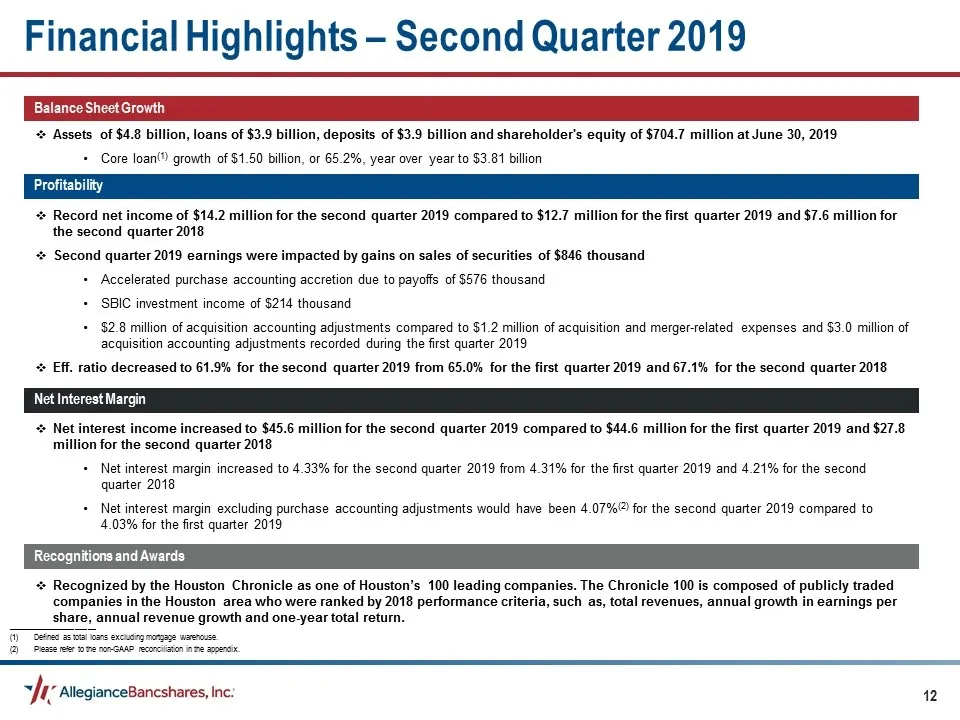
Financial Highlights – Second Quarter 2019 Assets of $4.8 billion, loans of $3.9 billion, deposits of $3.9 billion and shareholder's equity of $704.7 million at June 30, 2019 Core loan(1) growth of $1.50 billion, or 65.2%, year over year to $3.81 billion Balance Sheet Growth Record net income of $14
Slide 13: Historical Balance Sheet Growth
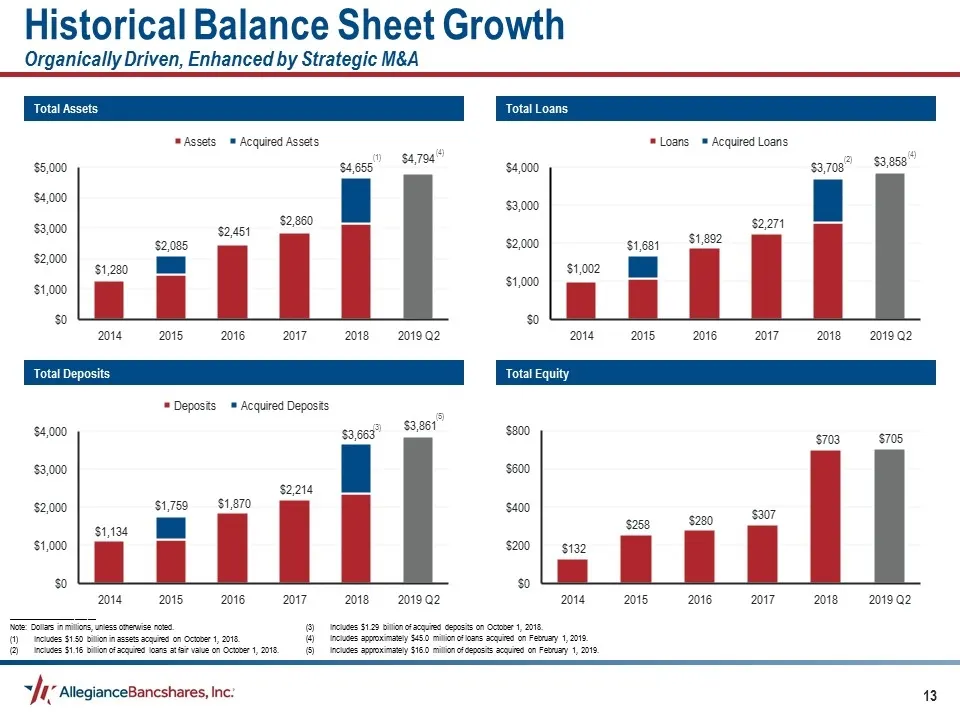
Historical Balance Sheet Growth Organically Driven, Enhanced by Strategic M&A Total Loans Total Assets Total Equity Total Deposits (1) _____________________ Note: Dollars in millions, unless otherwise noted. Includes $1.50 billion in assets acquired on October 1, 2018. Includes $1.16 billion of acqu
Slide 14: Earnings Performance
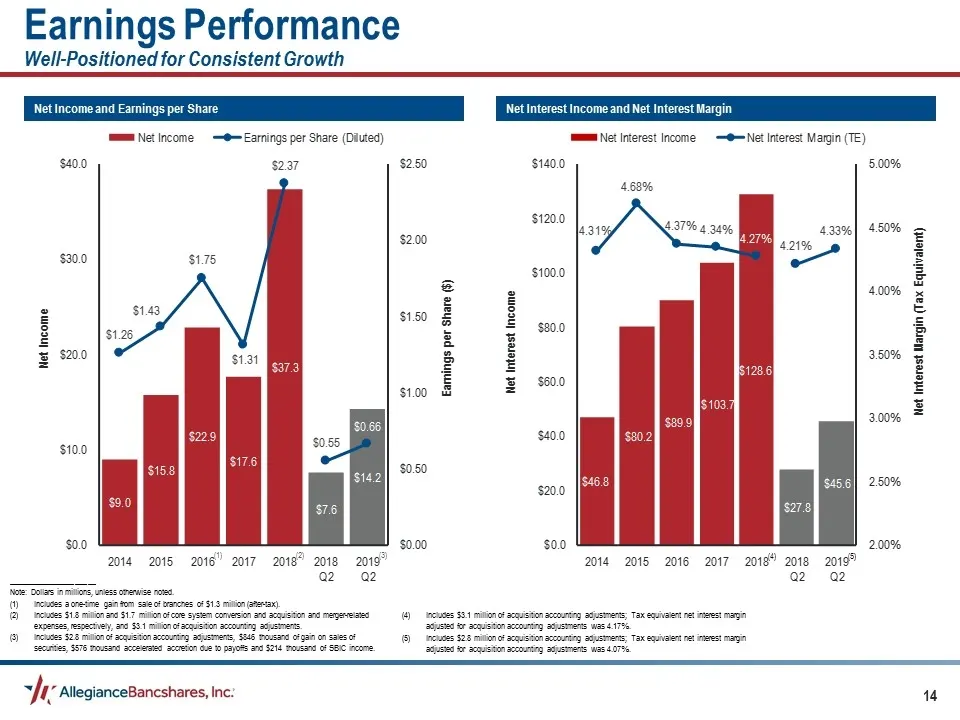
Earnings Performance Well-Positioned for Consistent Growth Net Interest Income and Net Interest Margin Net Income and Earnings per Share _____________________ Note: Dollars in millions, unless otherwise noted. Includes a one-time gain from sale of branches of $1.3 million (after-tax). Includes $1.8
Slide 15: Earnings Performance, continued
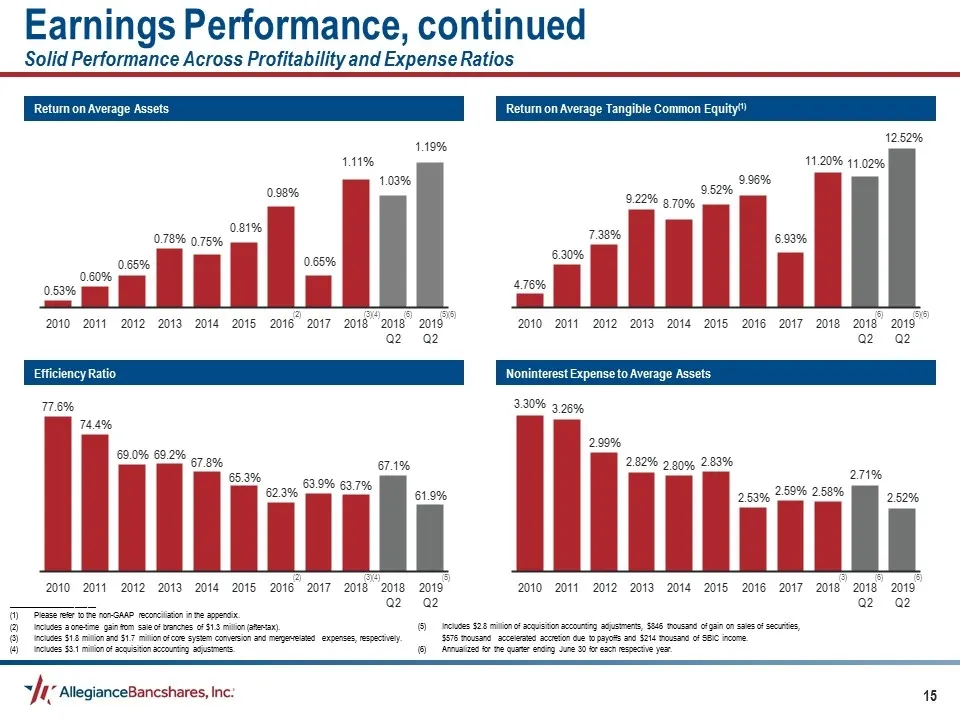
Return on Average Tangible Common Equity(1) Return on Average Assets Noninterest Expense to Average Assets Efficiency Ratio _____________________ Please refer to the non-GAAP reconciliation in the appendix. Includes a one-time gain from sale of branches of $1.3 million (after-tax). Includes $1.8 mil
Slide 16: Yields and Cost Analysis
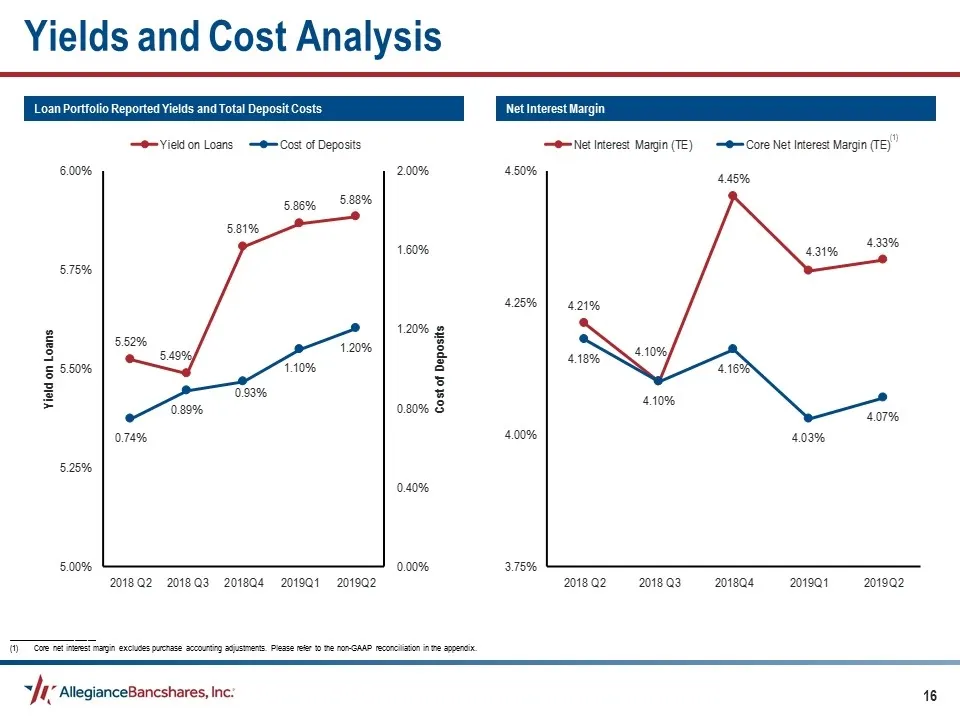
Yields and Cost Analysis Net Interest Margin Loan Portfolio Reported Yields and Total Deposit Costs _____________________ Core net interest margin excludes purchase accounting adjustments. Please refer to the non-GAAP reconciliation in the appendix. (1)
Slide 17: Current Capital Position
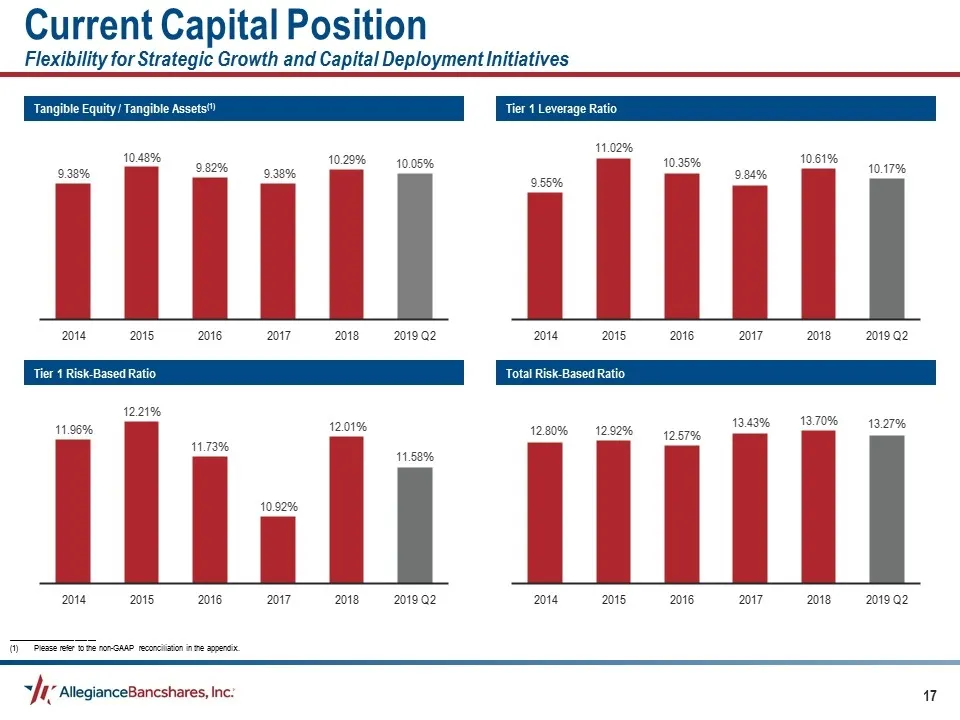
Tier 1 Leverage Ratio Tangible Equity / Tangible Assets(1) Total Risk-Based Ratio Tier 1 Risk-Based Ratio Current Capital Position Flexibility for Strategic Growth and Capital Deployment Initiatives _____________________ Please refer to the non-GAAP reconciliation in the appendix.
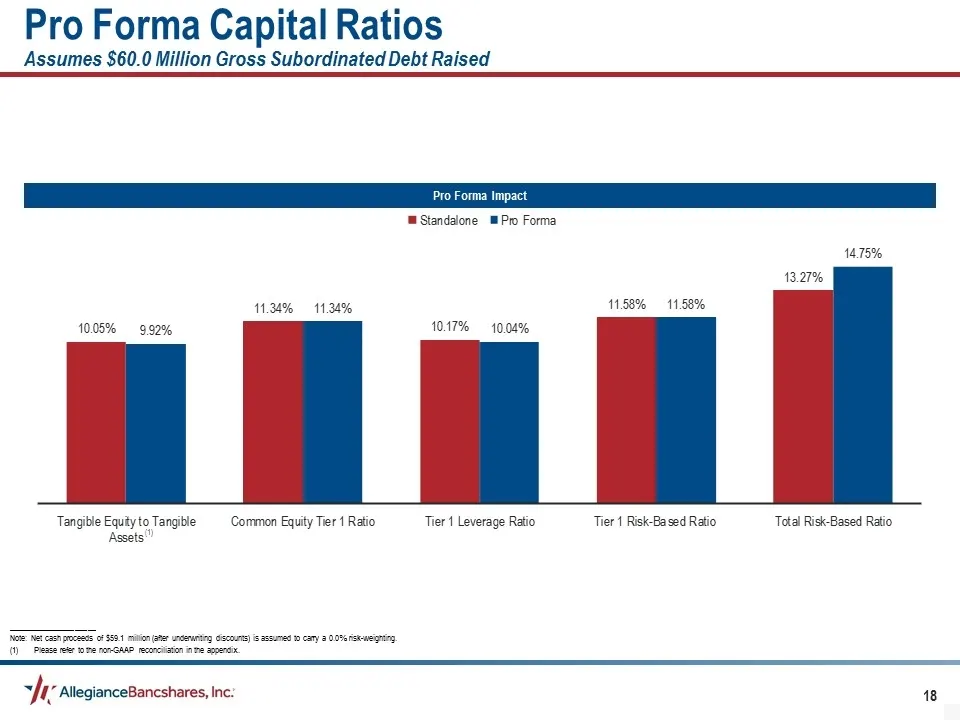
Slide 18: Pro Forma Impact
Pro Forma Impact _____________________ Note: Net cash proceeds of $59.1 million (after underwriting discounts) is assumed to carry a 0.0% risk-weighting. Please refer to the non-GAAP reconciliation in the appendix. Pro Forma Capital Ratios Assumes $60.0 Million Gross Subordinated Debt Raised (1)
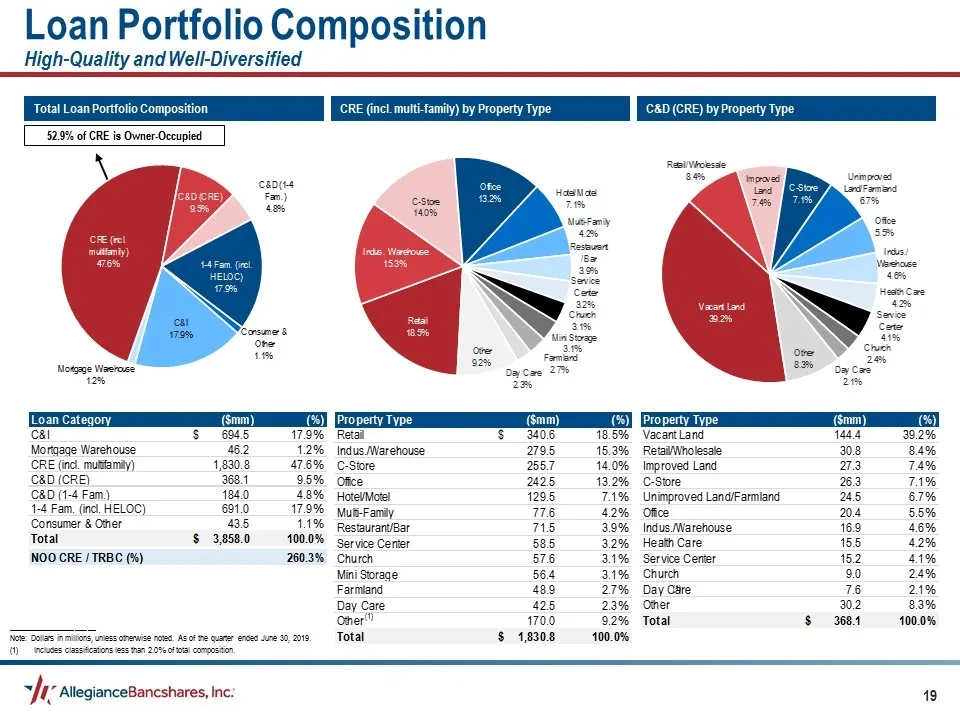
Slide 19: Loan Portfolio Composition
Total Loan Portfolio Composition 52.9% of CRE is Owner-Occupied CRE (incl. multi-family) by Property Type C&D (CRE) by Property Type _____________________ Note: Dollars in millions, unless otherwise noted. As of the quarter ended June 30, 2019. Includes classifications less than 2.0% of total compos
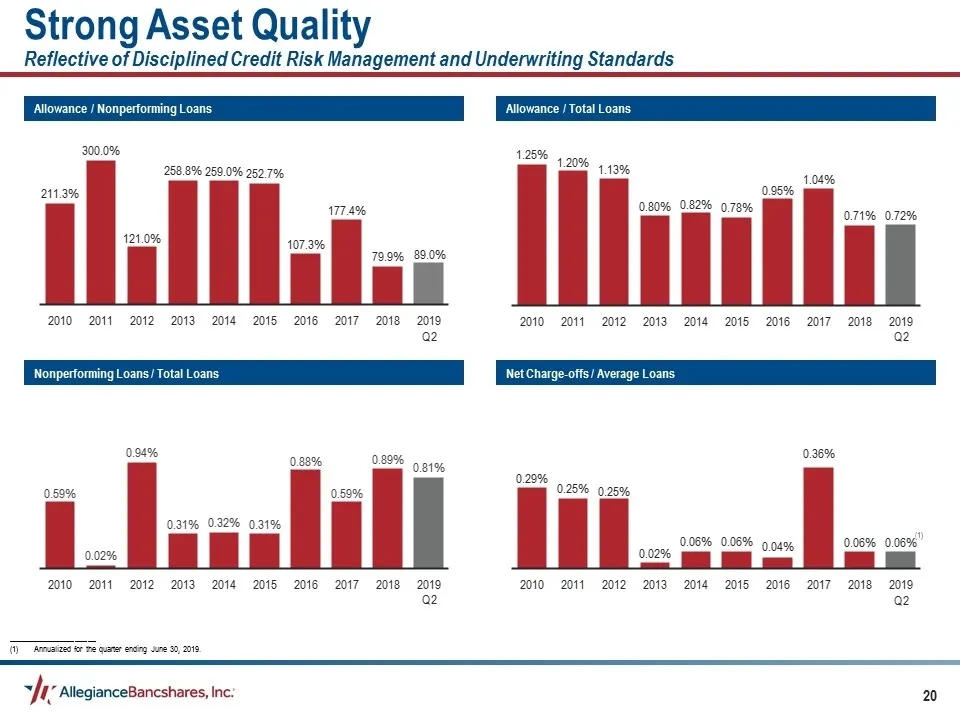
Slide 20: Strong Asset Quality
Allowance / Total Loans Allowance / Nonperforming Loans Net Charge-offs / Average Loans Nonperforming Loans / Total Loans (1) _____________________ Annualized for the quarter ending June 30, 2019. Strong Asset Quality Reflective of Disciplined Credit Risk Management and Underwriting Standards
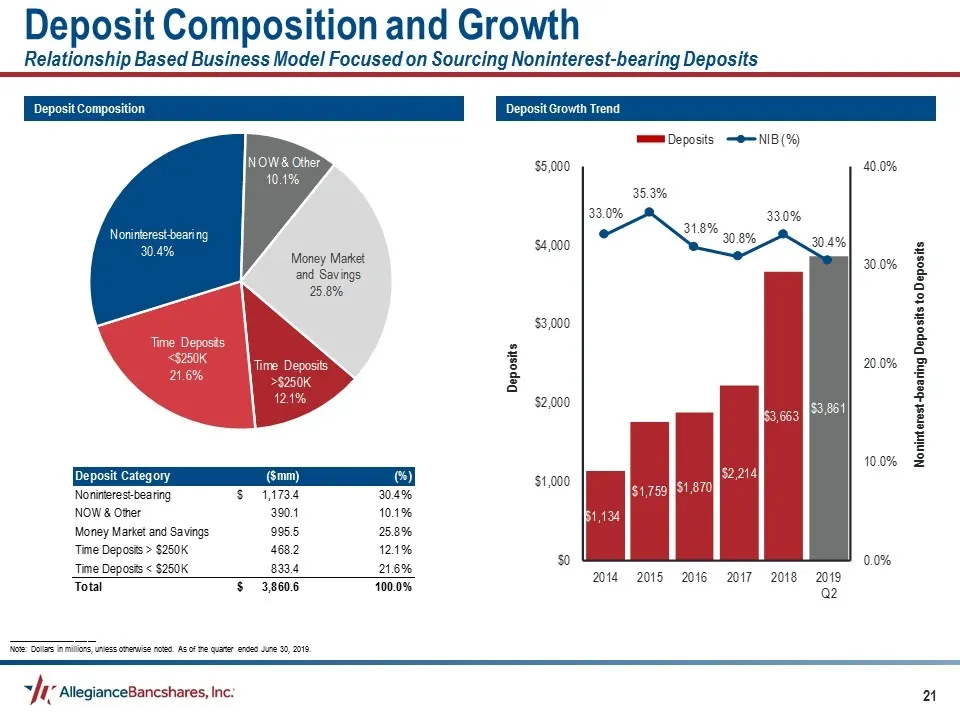
Slide 21: Deposit Composition and Growth
Deposit Composition and Growth Relationship Based Business Model Focused on Sourcing Noninterest-bearing Deposits Deposit Growth Trend Deposit Composition _____________________ Note: Dollars in millions, unless otherwise noted. As of the quarter ended June 30, 2019.
Slide 22: Securities Portfolio Composition
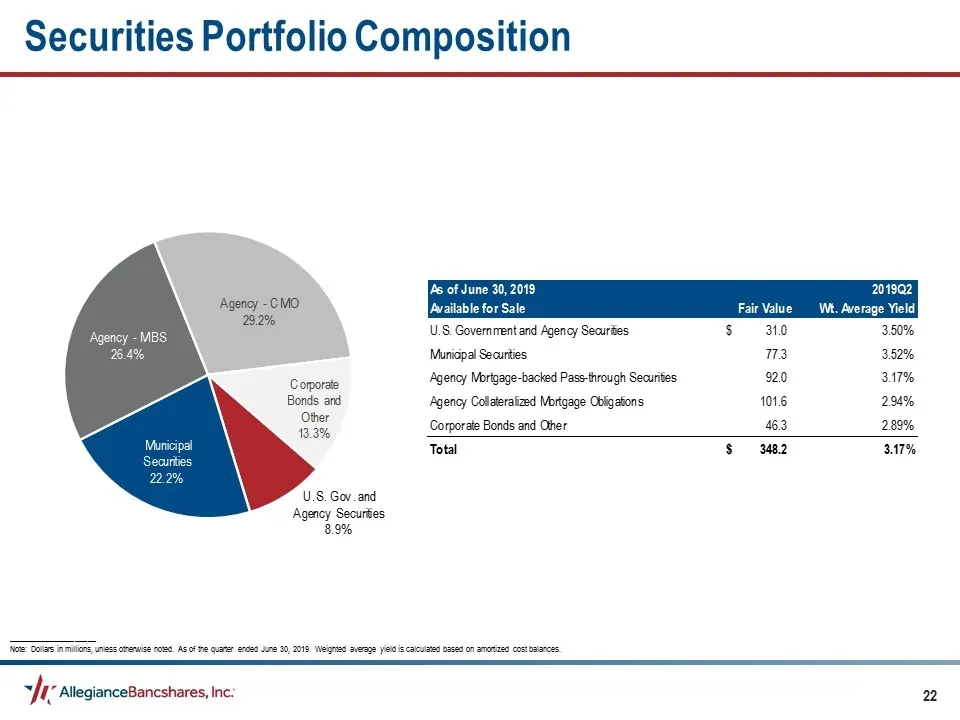
Securities Portfolio Composition _____________________ Note: Dollars in millions, unless otherwise noted. As of the quarter ended June 30, 2019. Weighted average yield is calculated based on amortized cost balances.
Slide 23: Appendix
Appendix Wh ” AllegianceBancshares, Inc:
Slide 24: Ratings From Kroll Bond Rating Agency
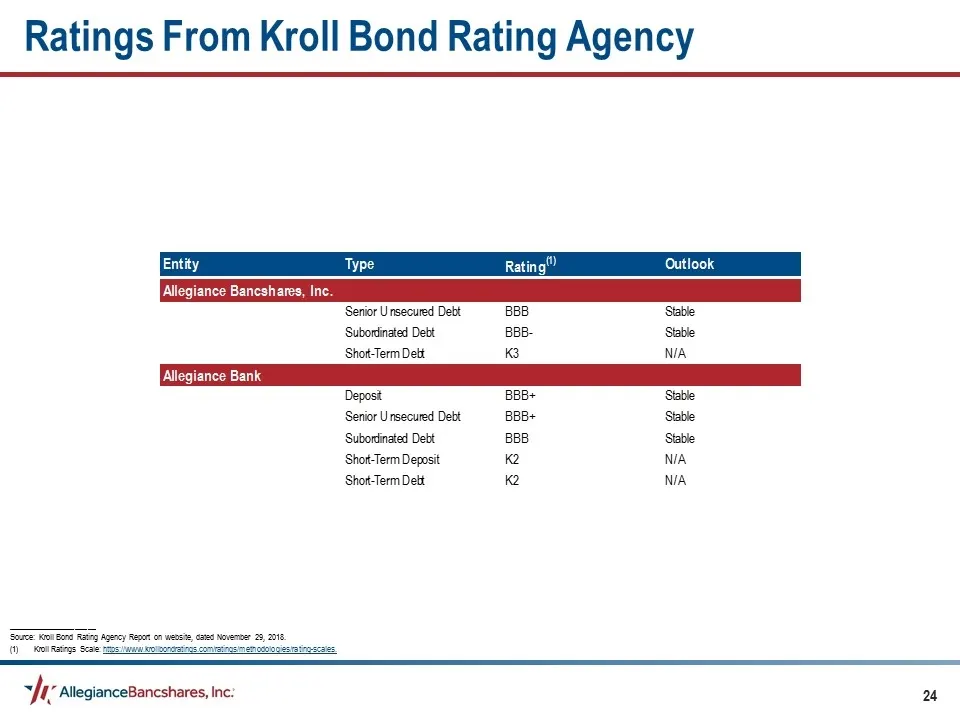
Ratings From Kroll Bond Rating Agency _____________________ Source: Kroll Bond Rating Agency Report on website, dated November 29, 2018. Kroll Ratings Scale: https://www.krollbondratings.com/ratings/methodologies/rating-scales.
Slide 25: Consolidated Financial Highlights
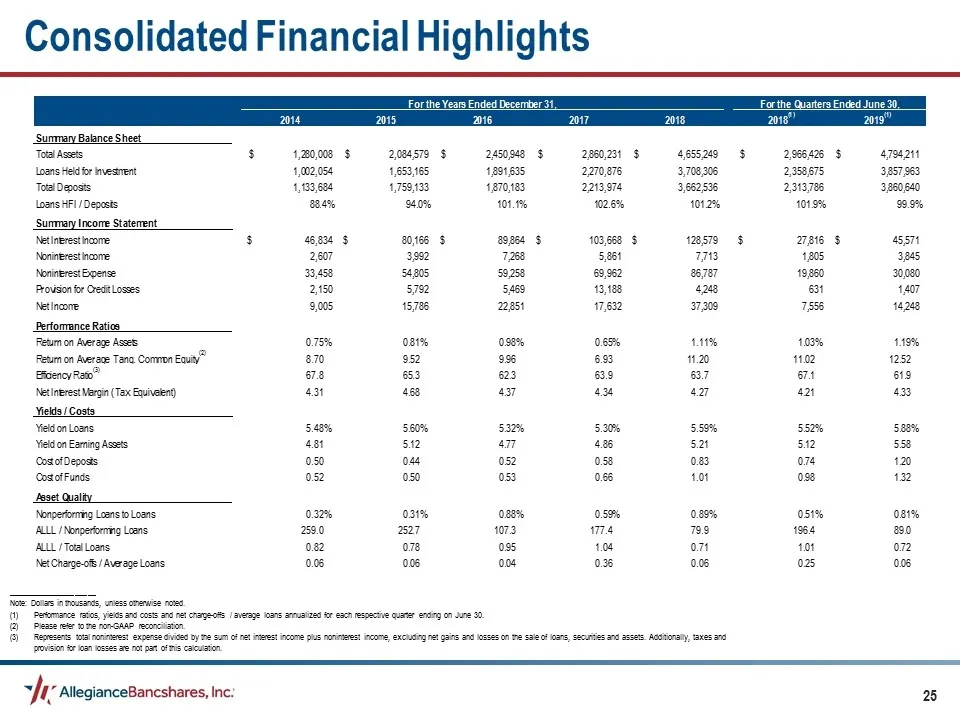
Consolidated Financial Highlights _____________________ Note: Dollars in thousands, unless otherwise noted. Performance ratios, yields and costs and net charge-offs / average loans annualized for each respective quarter ending on June 30. Please refer to the non-GAAP reconciliation. Represents total
Slide 26: Historical Interest Coverage
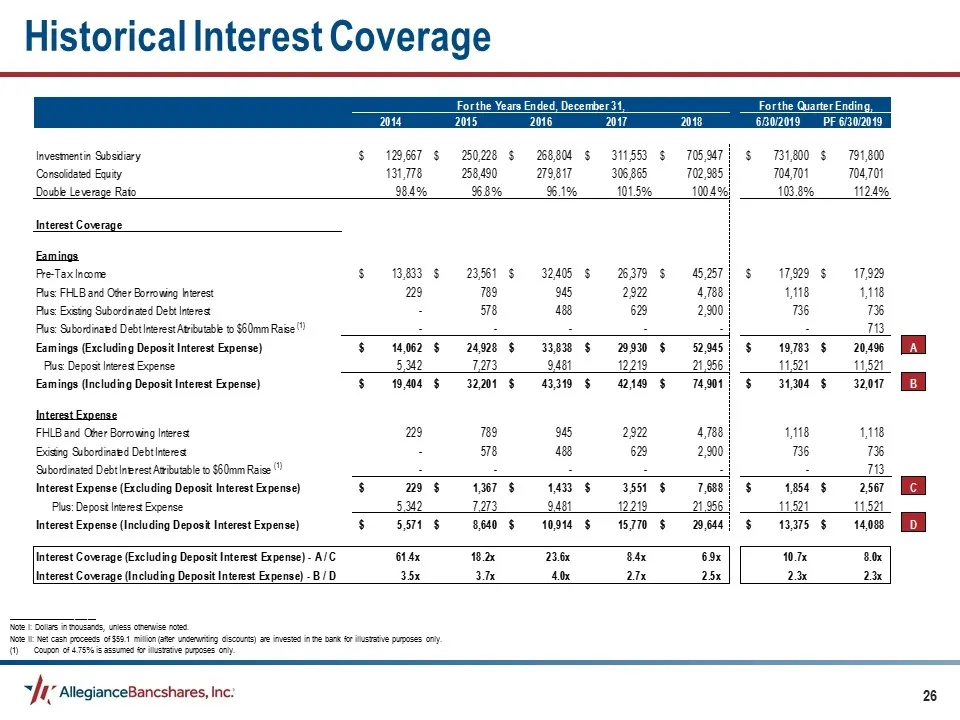
Historical Interest Coverage _____________________ Note I: Dollars in thousands, unless otherwise noted. Note II: Net cash proceeds of $59.1 million (after underwriting discounts) are invested in the bank for illustrative purposes only. Coupon of 4.75% is assumed for illustrative purposes only.
Slide 27: Non-GAAP Reconciliation
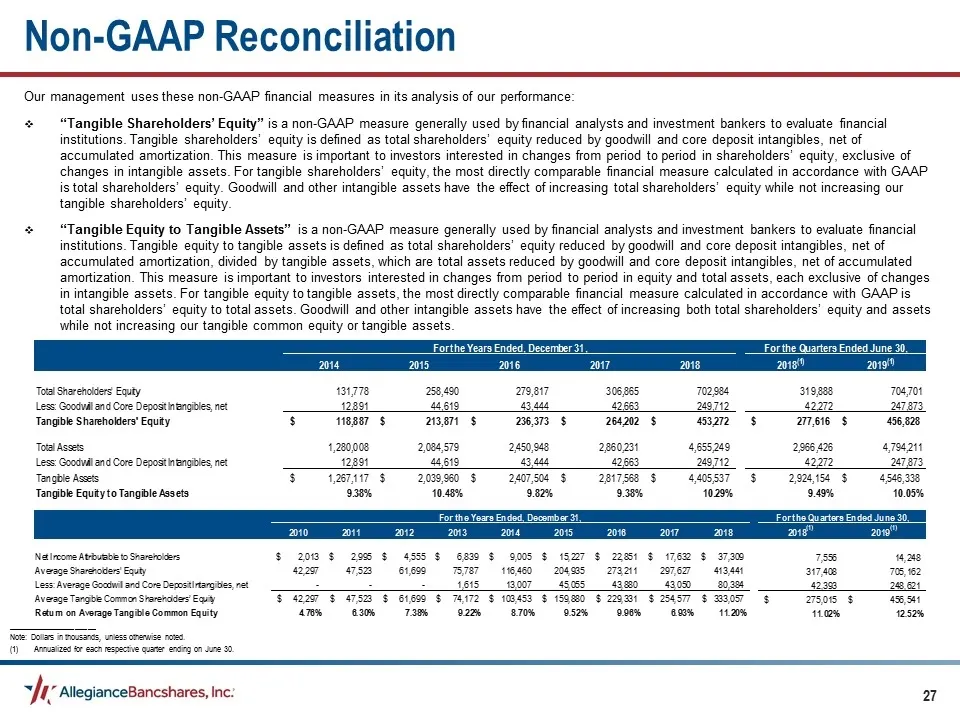
Our management uses these non-GAAP financial measures in its analysis of our performance: “Tangible Shareholders’ Equity” is a non-GAAP measure generally used by financial analysts and investment bankers to evaluate financial institutions. Tangible shareholders’ equity is defined as total shareholde
Slide 28: Non-GAAP Reconciliation, continued
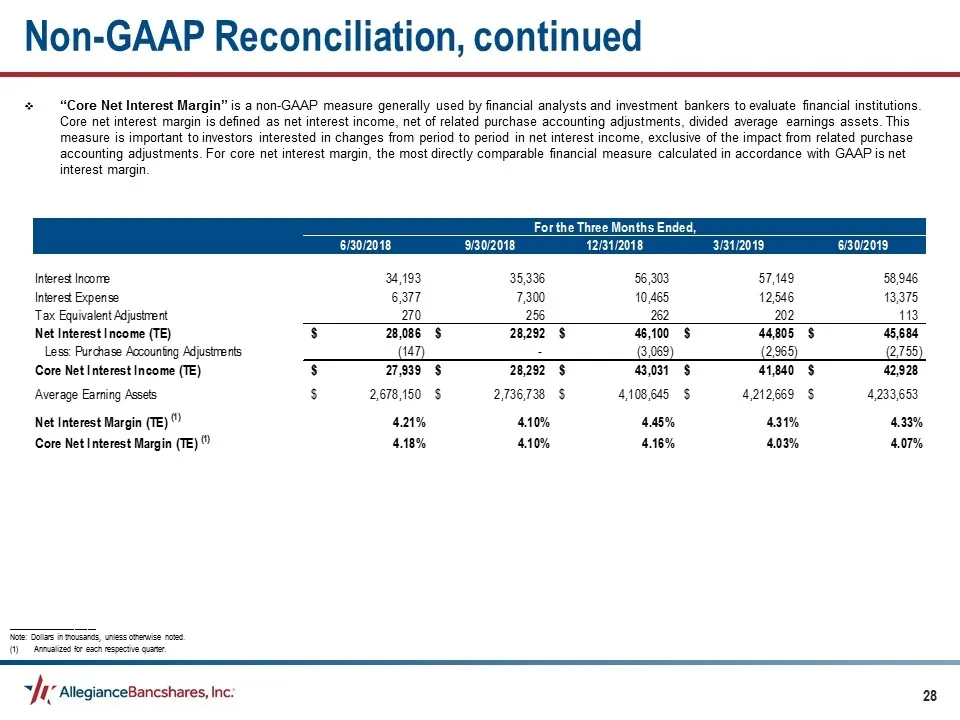
Non-GAAP Reconciliation, continued “Core Net Interest Margin” is a non-GAAP measure generally used by financial analysts and investment bankers to evaluate financial institutions. Core net interest margin is defined as net interest income, net of related purchase accounting adjustments, divided aver
Source: SEC EDGAR · 8-K filed Sep 20, 2019
More decks from Allegiance Bancshares Inc
 Q2 2022 Earnings Presentation16 slides · Jul 29, 2022
 Q1 2022 Earnings Presentation19 slides · Apr 28, 2022
 FY2021 Earnings Presentation18 slides · Jan 28, 2022
 Q4 2021 Earnings Presentation19 slides · Jan 28, 2022
 Merger or Acquisition (November 2021)28 slides · Nov 8, 2021
 Q3 2021 Earnings Presentation17 slides · Oct 28, 2021