Taronis Fuels — Investor Presentation (February 2020)
22 slides from Taronis Fuels's investor presentation, Feb 5, 2020
Slide 1: Q1 2020 Investor Presentation
F U E L § Cleaner — Safer — Smarter Q1 2020 Investor Presentation
Slide 2: Forward Looking Statements
Forward Looking Statements This presentation forward-looking statements as defined within Section 27A of the Securities Act of 1933, as amended, and Section 21E of the Securities Exchange Act of 1934, as amended. These statements relate to future events, including our ability to raise capital, or to
Slide 3: Mission Statement
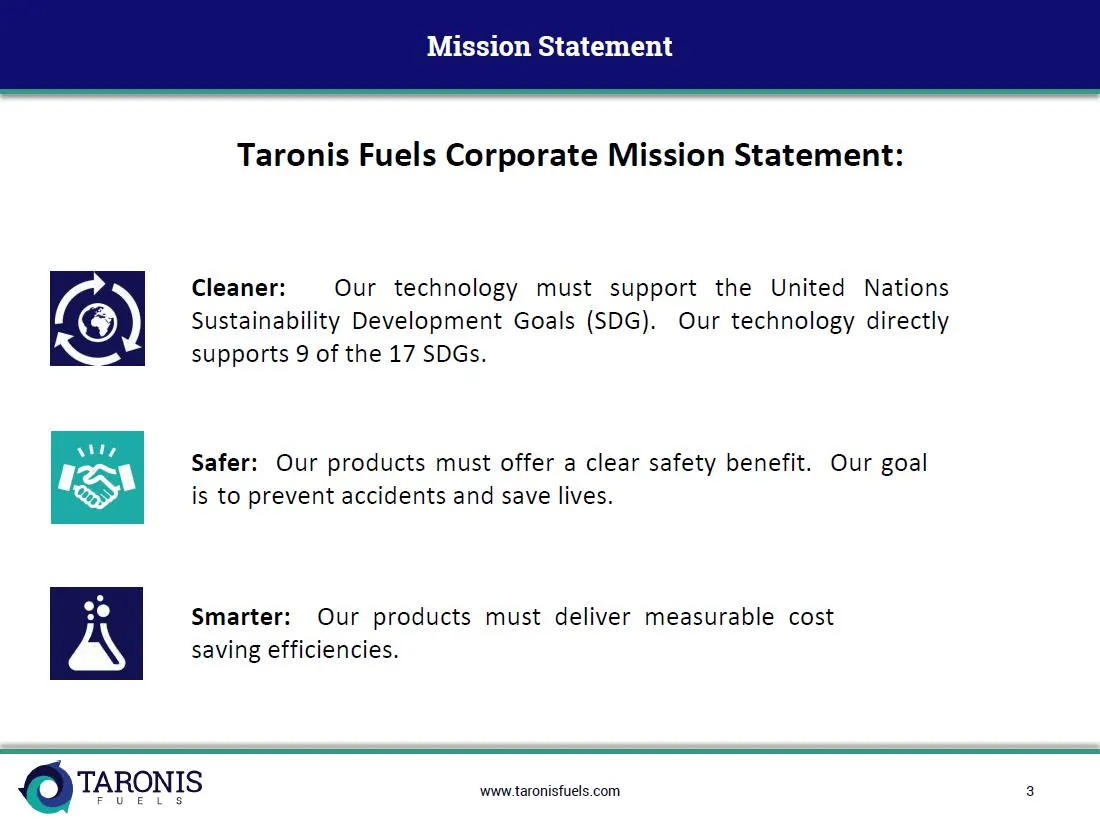
Mission Statement Taronis Fuels Corporate Mission Statement: Sustainability Development Goals (SDG). Our technology directly (@) Cleaner: Our technology must support the United Nations supports 9 of the 17 SDGs. ric~ \ Safer: Our products must offer a clear safety benefit. Our goal SS is to prevent
Slide 4: Intro
Intro Taronis Fuels is a renewable fuel & power generation company. We produce sustainable, socially responsible alternatives to existing fossil fuel & industrial gas products. — Our products are made with common industrial & medical waste materials. — Our production process can conserve billions of
Slide 5: We operate the only submerged plasma arc technology
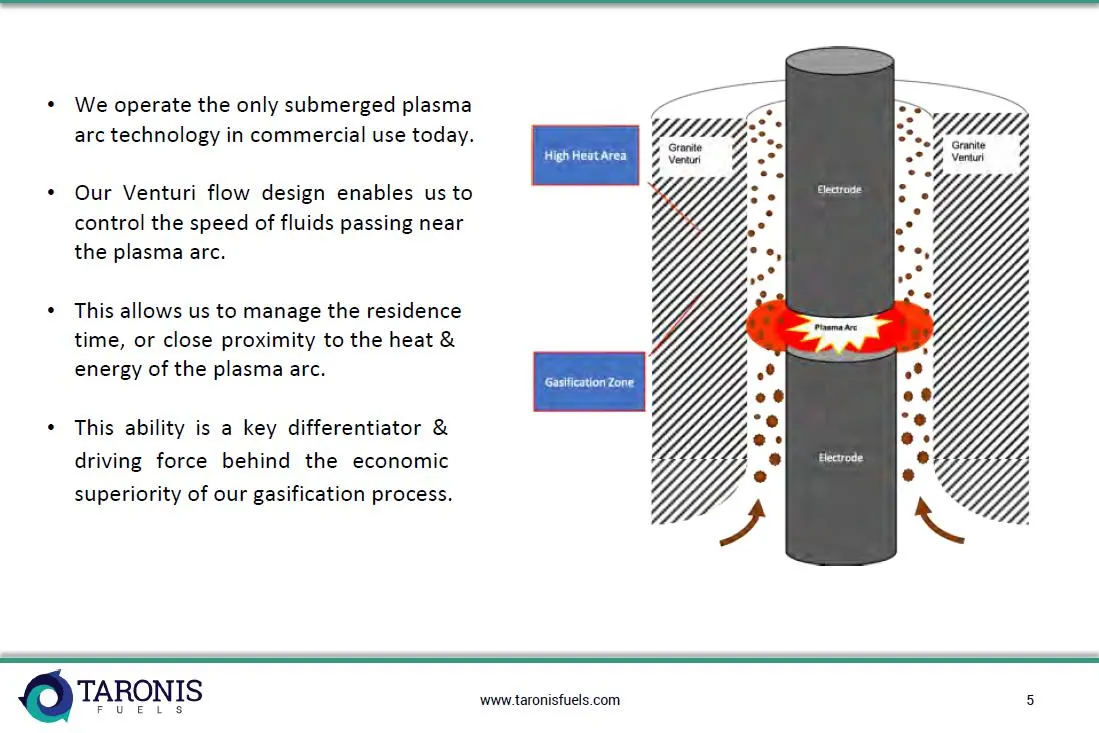
We operate the only submerged plasma arc technology in commercial use today. Our Venturi flow design enables us to control the speed of fluids passing near the plasma arc. This allows us to manage the residence time, or close proximity to the heat & energy of the plasma arc. This ability is a key di
Slide 6: Our Technology: Sustainable and Renewable
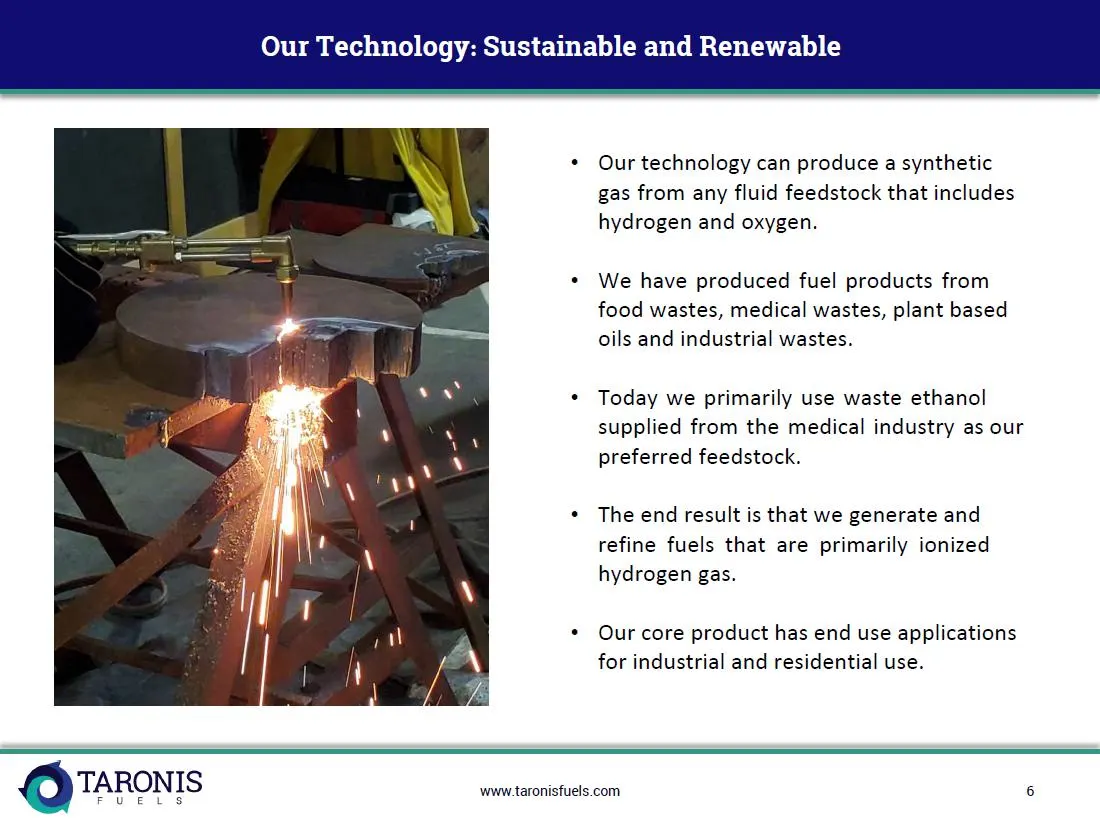
Our Technology: Sustainable and Renewable * Our technology can produce a synthetic gas from any fluid feedstock that includes hydrogen and oxygen. * We have produced fuel products from food wastes, medical wastes, plant based oils and industrial wastes. * Today we primarily use waste ethanol supplie
Slide 7: Extensive Technology Validation
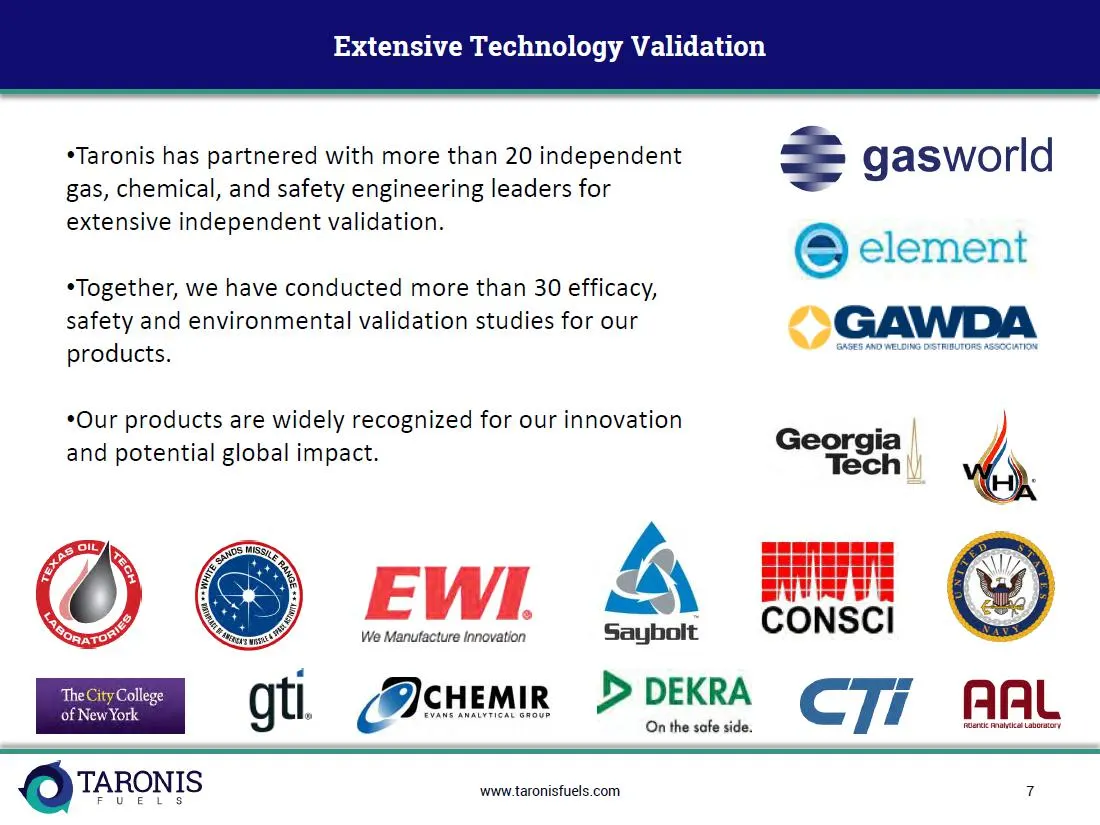
Extensive Technology Validation *Taronis has partnered with more than 20 independent = gasworld gas, chemical, and safety engineering leaders for extensive independent validation. @ element *Together, we have conducted more than 30 efficacy, safety and environmental validation studies for our CGAWDA
Slide 8: Rapidly Improving Economic Model
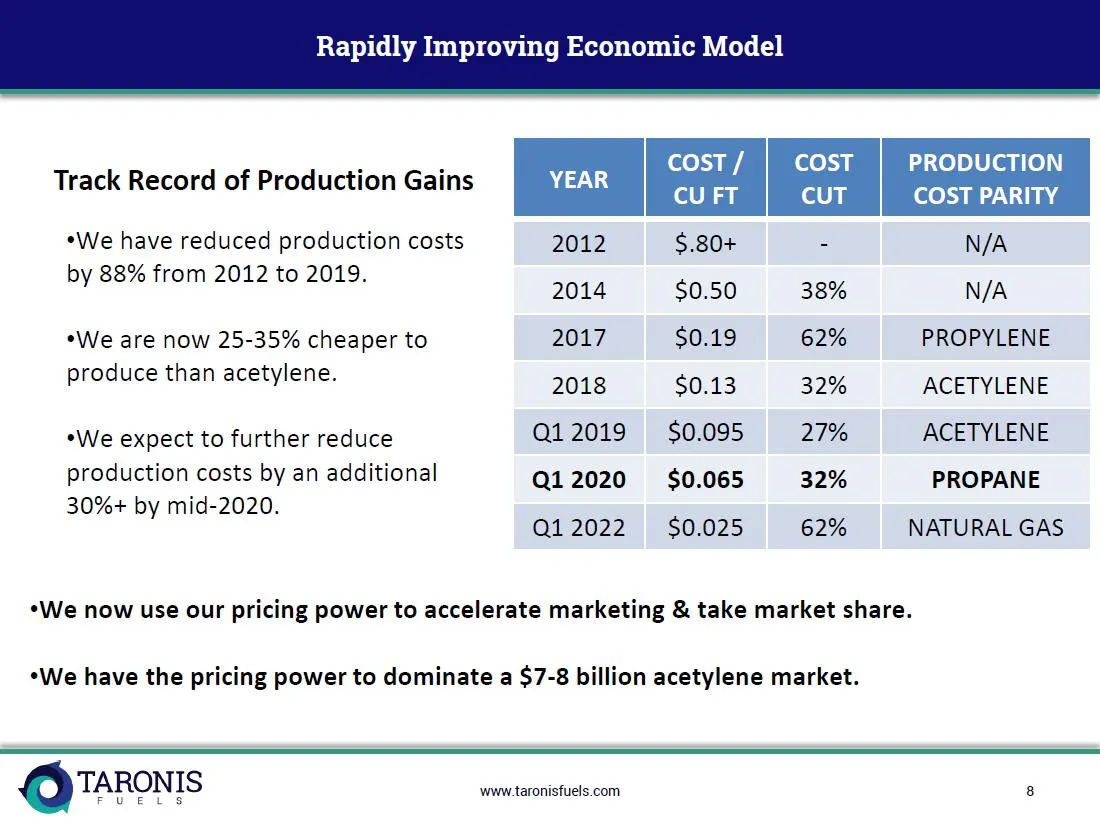
Rapidly Improving Economic Model cost/ | COST PRODUCTION Track Record of Production Gains YEAR aes aor Rat *We have reduced production costs 2012 $.80+ 2 by 88% from 2012 to 2019. 2014 $0.50 38% N/A *We are now 25-35% cheaper to 2017 $0.19 62% PROPYLENE produceithaniacetylene: 2018 $0.13 32% ACETYLE
Slide 9: Metal Cutting Fuel Competitive Landscape
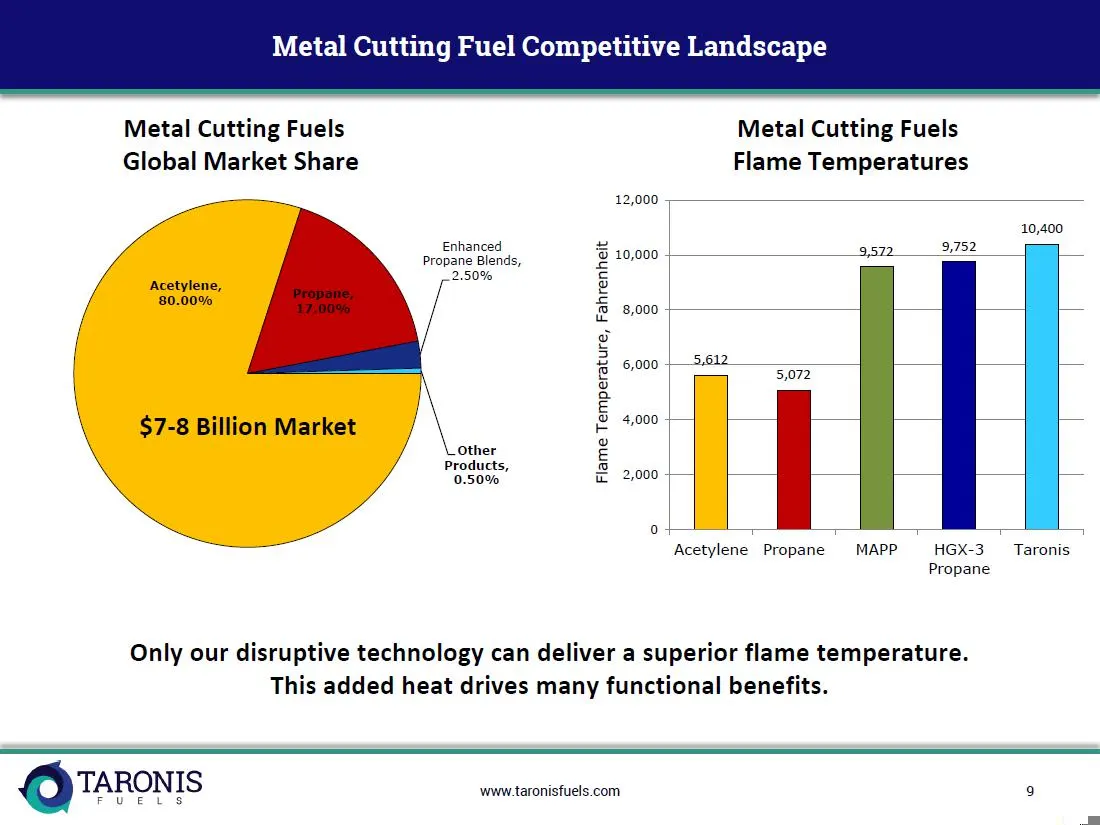
Metal Cutting Fuel Competitive Landscape Metal Cutting Fuels Metal Cutting Fuels Global Market Share Flame Temperatures a 12,000 + 10,400 propane Blends, 8 10,000 3572 eS — 2.50% € Acetylene, © 80.00% 5 samp I. g | Bom am i | 5 \ E \ $7-8 Billion Market E00 tJ i Other £ Pos0%8 © 2,000 —| |} — = rn L
Slide 10: Higher Flame Temperature = Added Functionality
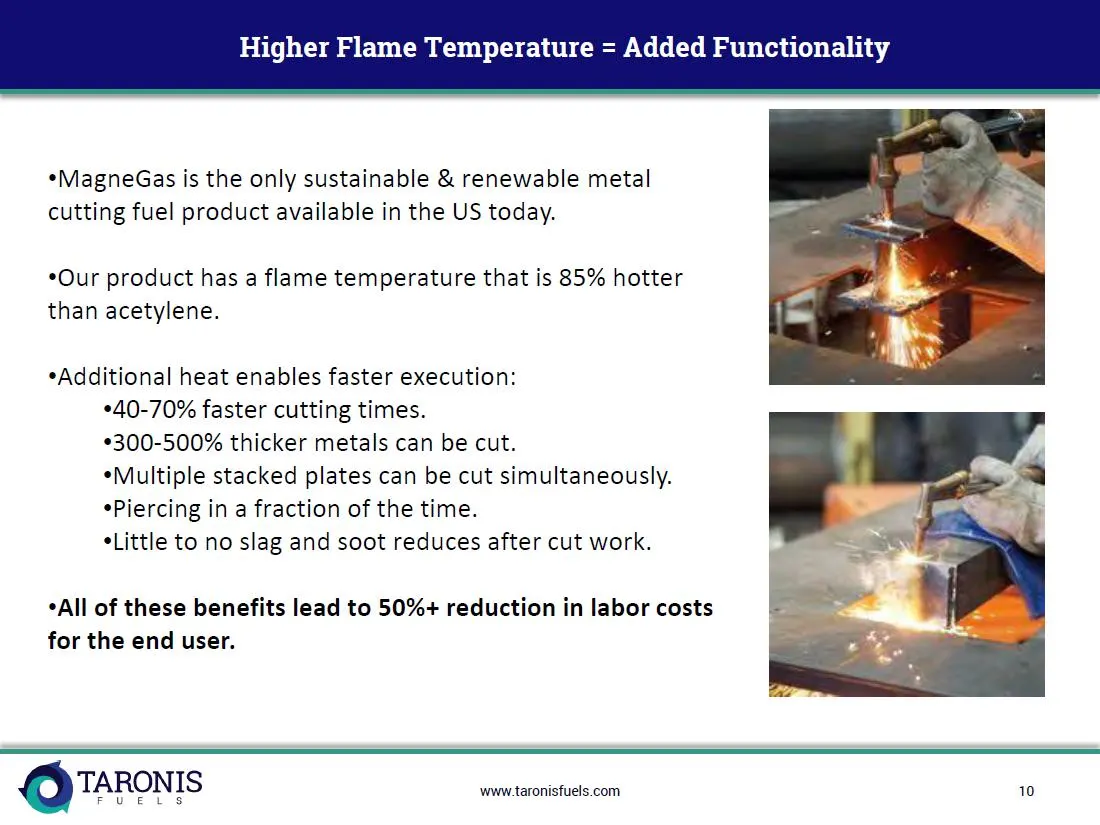
Higher Flame Temperature = Added Functionality *MagneGas is the only sustainable & renewable metal cutting fuel product available in the US today. *Our product has a flame temperature that is 85% hotter than acetylene. *Additional heat enables faster execution: 40-70% faster cutting times. *300-500%
Slide 11: US Growth Strategy
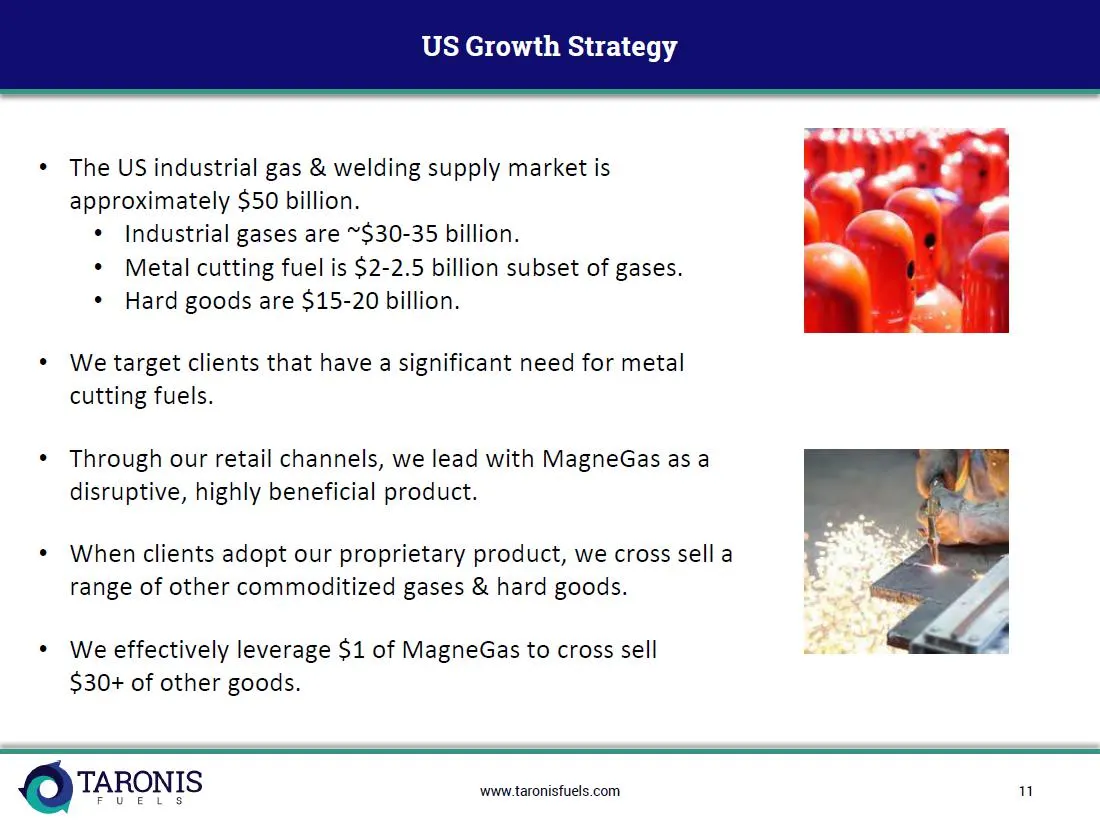
US Growth Strategy The US industrial gas & welding supply market is approximately $50 billion. * Industrial gases are ~$30-35 billion. * Metal cutting fuel is $2-2.5 billion subset of gases. * Hard goods are $15-20 billion. We target clients that have a significant need for metal cutting fuels. Thro
Slide 12: Expanding US Distribution Capabilities
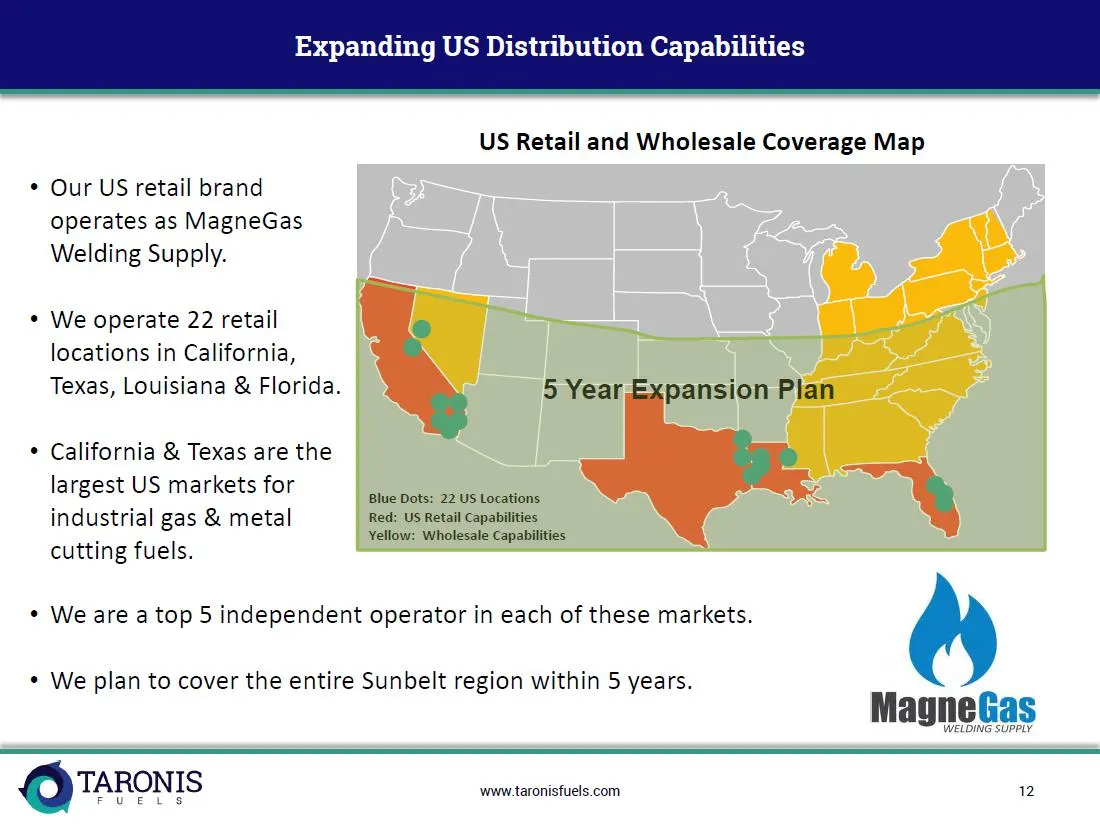
Expanding US Distribution Capabilities US Retail and Wholesale Coverage Map Our US retail brand operates as MagneGas Welding Supply. We operate 22 retail locations in California, Texas, Louisiana & Florida. California & Texas are the largest US markets for Blue Dots: 22 US Locations industrial gas &
Slide 13: Demonstrated Acceleration in Revenues
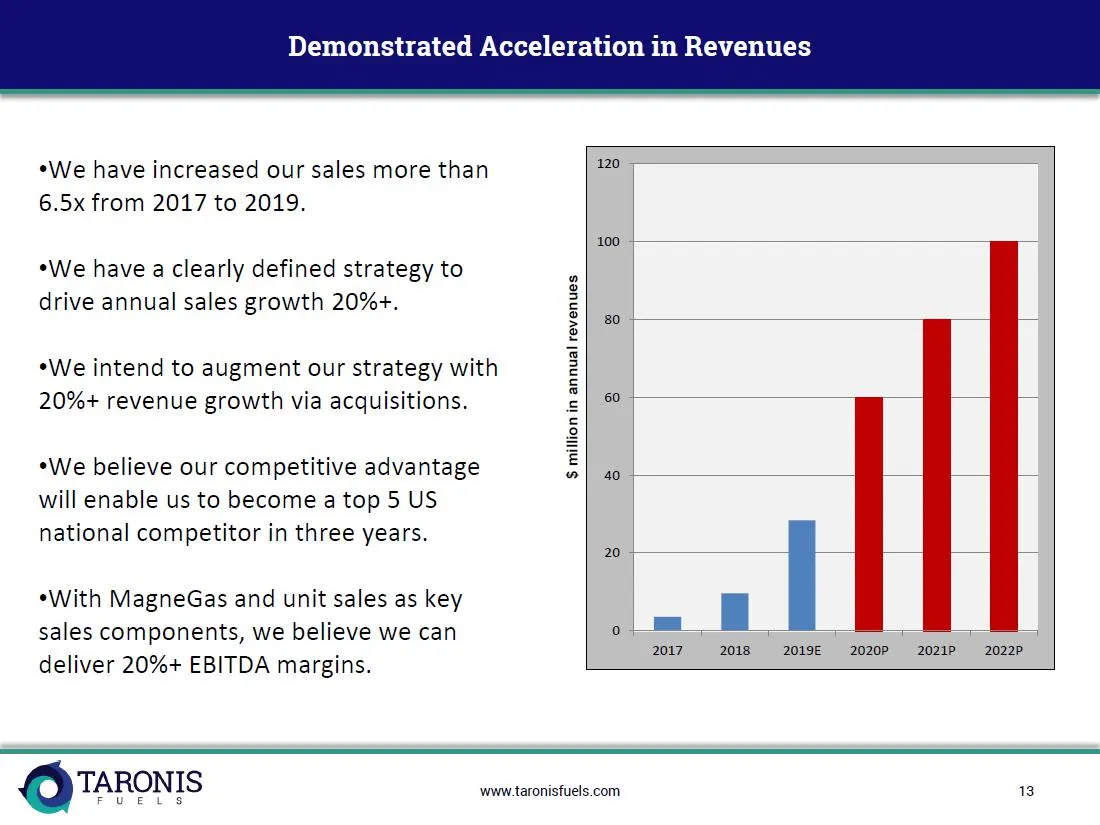
Demonstrated Acceleration in Revenues *We have increased our sales more than 6.5x from 2017 to 2019. *We have a clearly defined strategy to drive annual sales growth 20%+. *We intend to augment our strategy with 20%+ revenue growth via acquisitions. *We believe our competitive advantage will enable
Slide 14: International Competitive Advantages
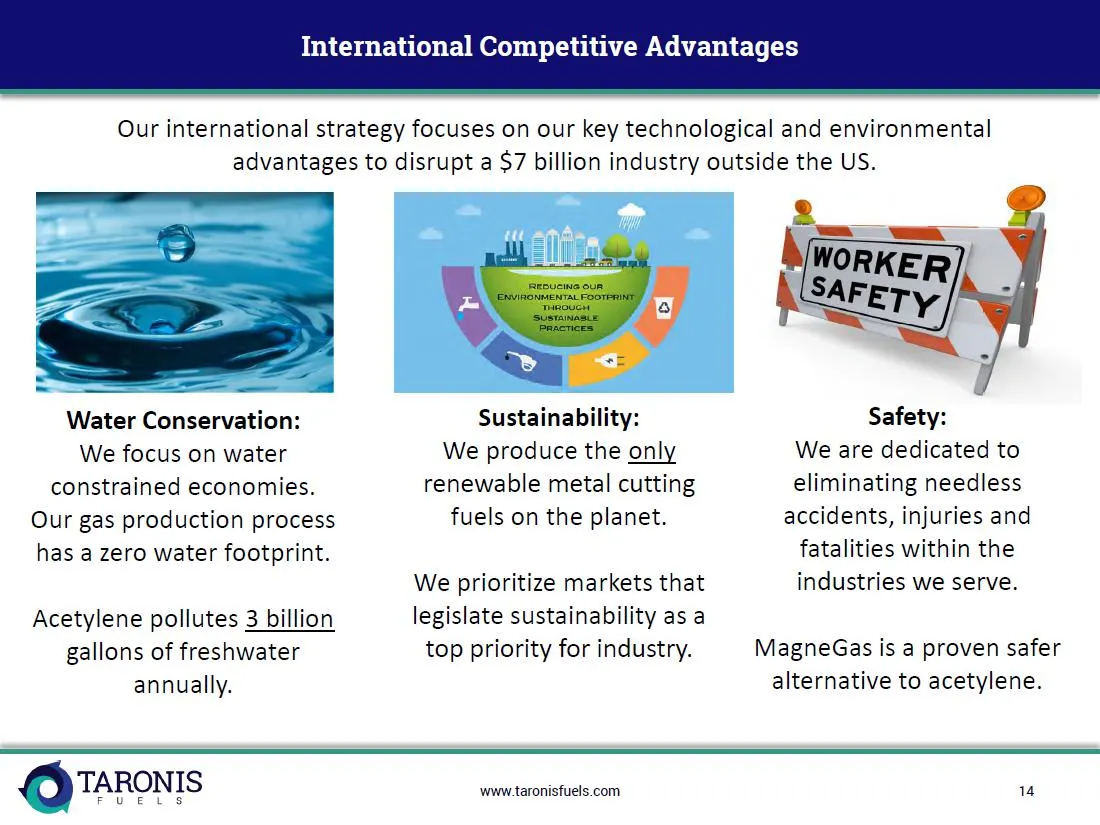
International Competitive Advantages Our international strategy focuses on our key technological and environmental advantages to disrupt a $7 billion industry outside the US. Se Water Conservation: Sustainability: Safety: We focus on water We produce the only We are dedicated to constrained economie
Slide 15: Turkey: 1st Scaled Licensing Contract
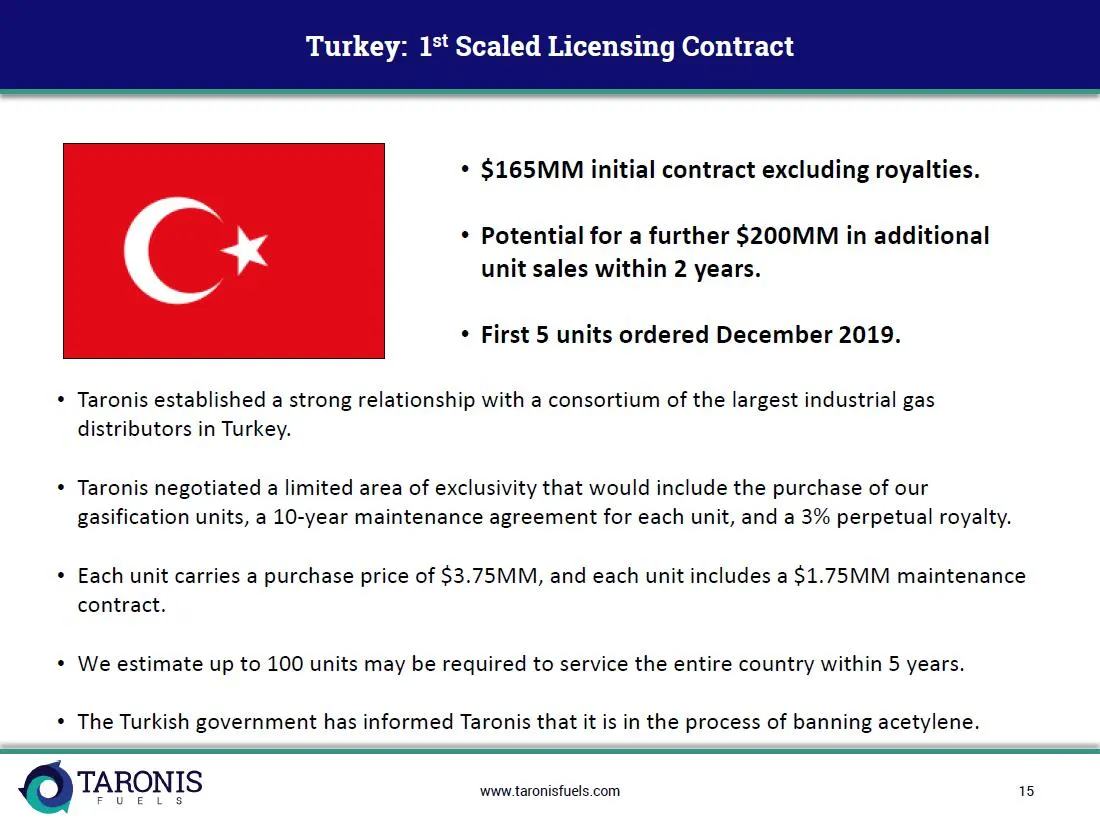
Turkey: 1t Scaled Licensing Contract * $165MM initial contract excluding royalties. = 4 * Potential for a further $200MM in additional unit sales within 2 years. * First 5 units ordered December 2019. * Taronis established a strong relationship with a consortium of the largest industrial gas distrib
Slide 16: Turkey As a Major Industrial Economy
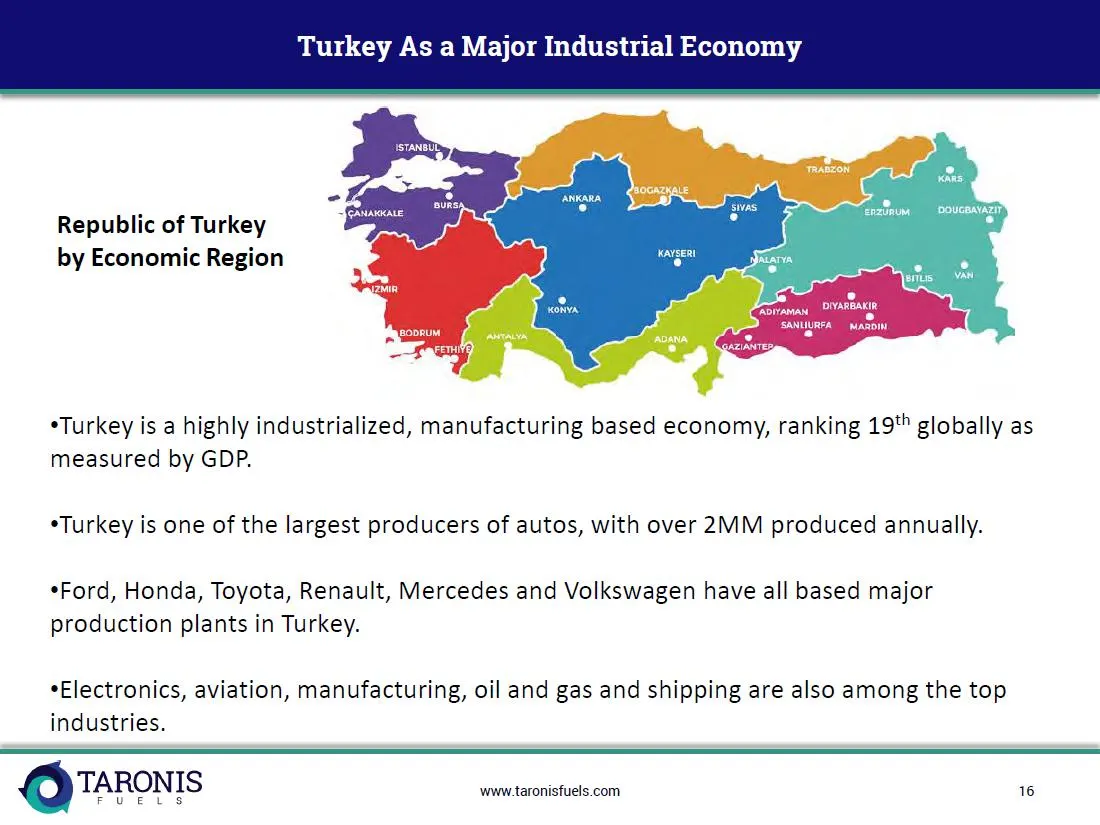
Turkey As a Major Industrial Economy Republic of Turkey by Economic Region “Turkey is a highly industrialized, manufacturing based economy, ranking 19*” globally as measured by GDP. Turkey is one of the largest producers of autos, with over 2MM produced annually. ¢Ford, Honda, Toyota, Renault, Merce
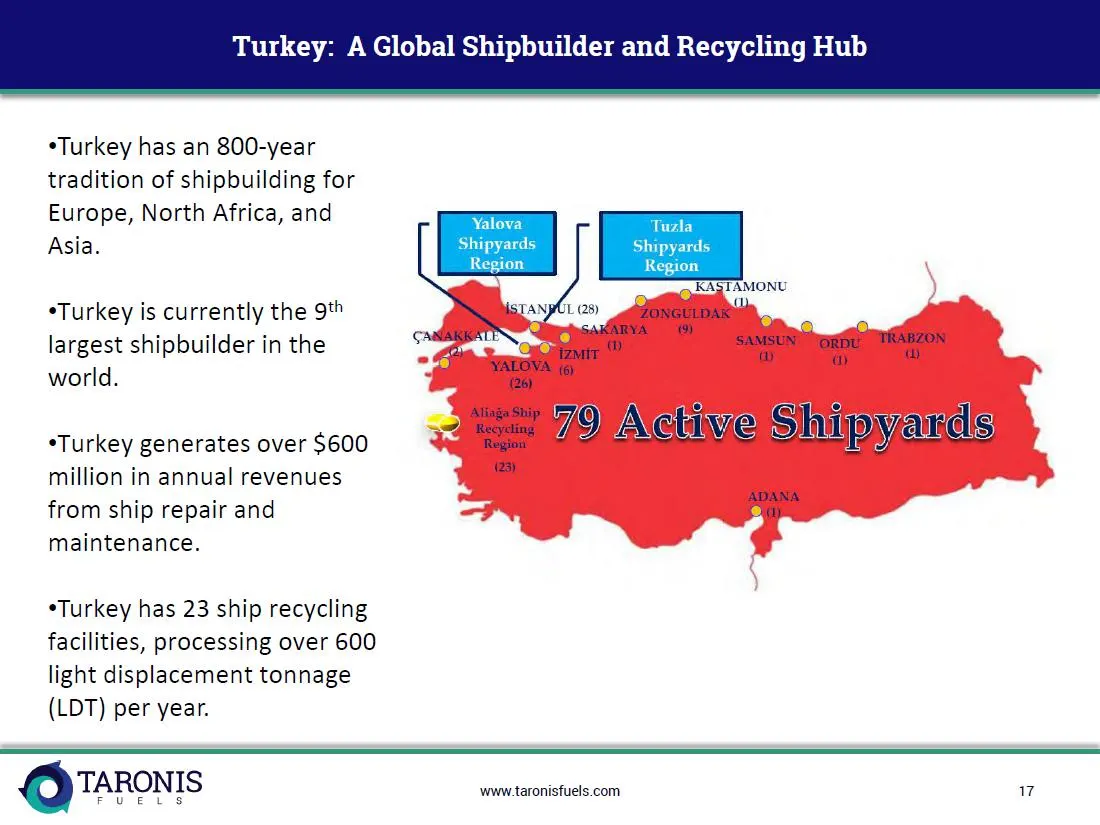
Slide 17: Turkey: A Global Shipbuilder and Recycling Hub
Turkey: A Global Shipbuilder and Recycling Hub Turkey has an 800-year tradition of shipbuilding for Europe, North Africa, and Asia. Region > KASIAMONU gr ANyCL 25) alent SAKARYA (9) o o w SAMSUN’ 7 oRpu TRABZON Turkey is currently the 9% largest shipbuilder in the - 0 izMiT a a a) world. eye *Turkey
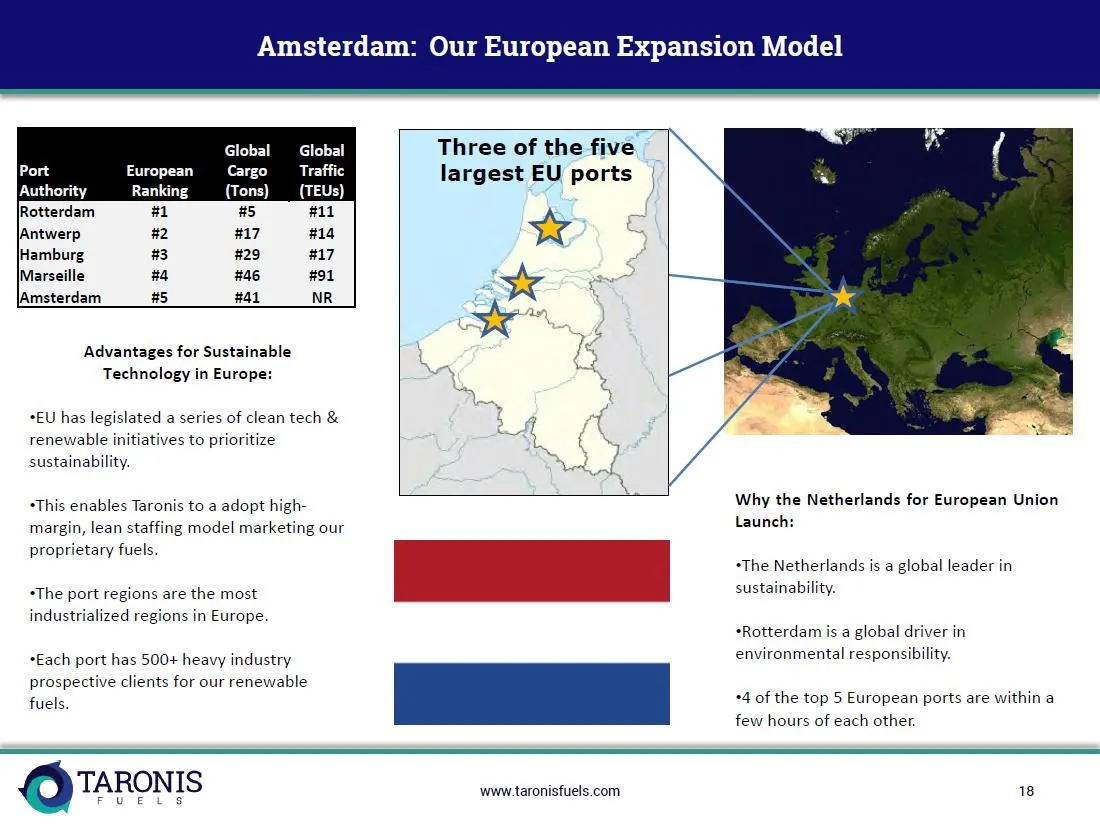
Slide 18: Amsterdam: Our European Expansion Model
Amsterdam: Our European Expansion Model European Ranking Rotterdam #1 #5 #11 lAntwerp #2 #17 #14 Hamburg #3 #29 #17 Marseille #4 #46 #91 Amsterdam #5 #41 NR Advantages for Sustainable Technology in Europe: *EU has legislated a series of clean tech & renewable initiatives to prioritize sustainability
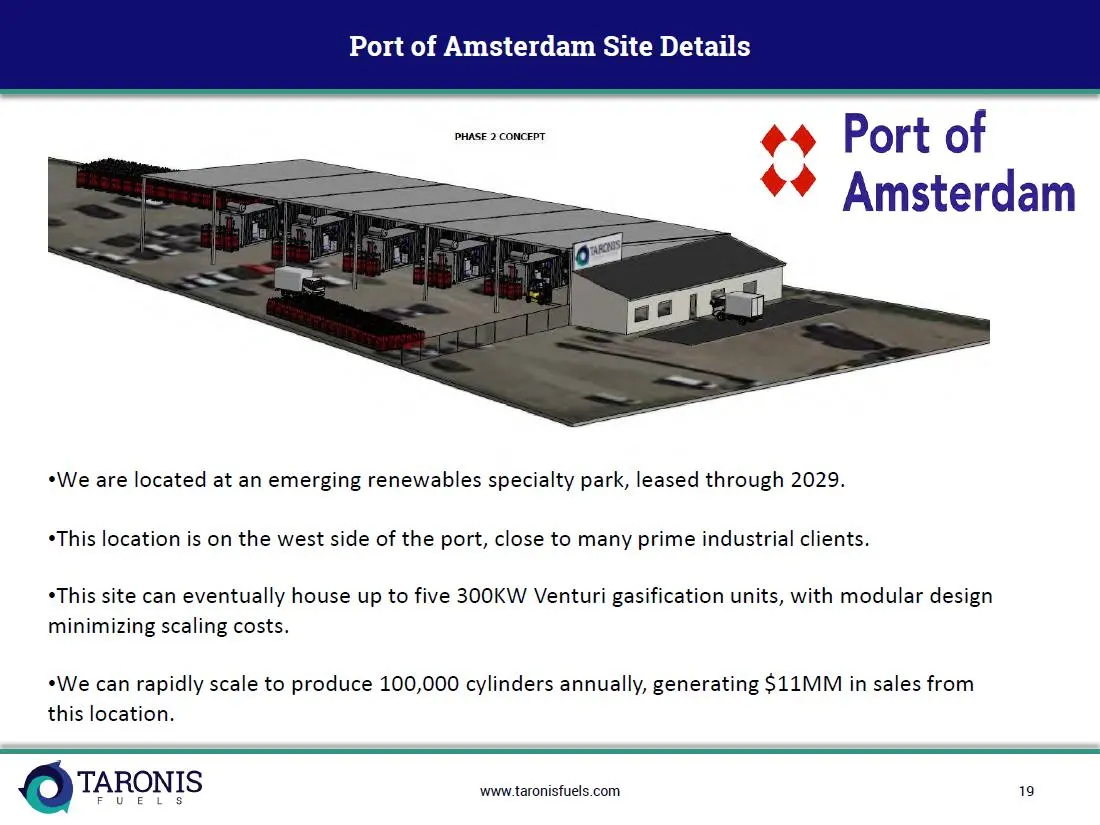
Slide 19: Port of Amsterdam Site Details
Port of Amsterdam Site Details iii 4 Port of ¢* Amsterdam *We are located at an emerging renewables specialty park, leased through 2029. *This location is on the west side of the port, close to many prime industrial clients. *This site can eventually house up to five 300KW Venturi gasification units
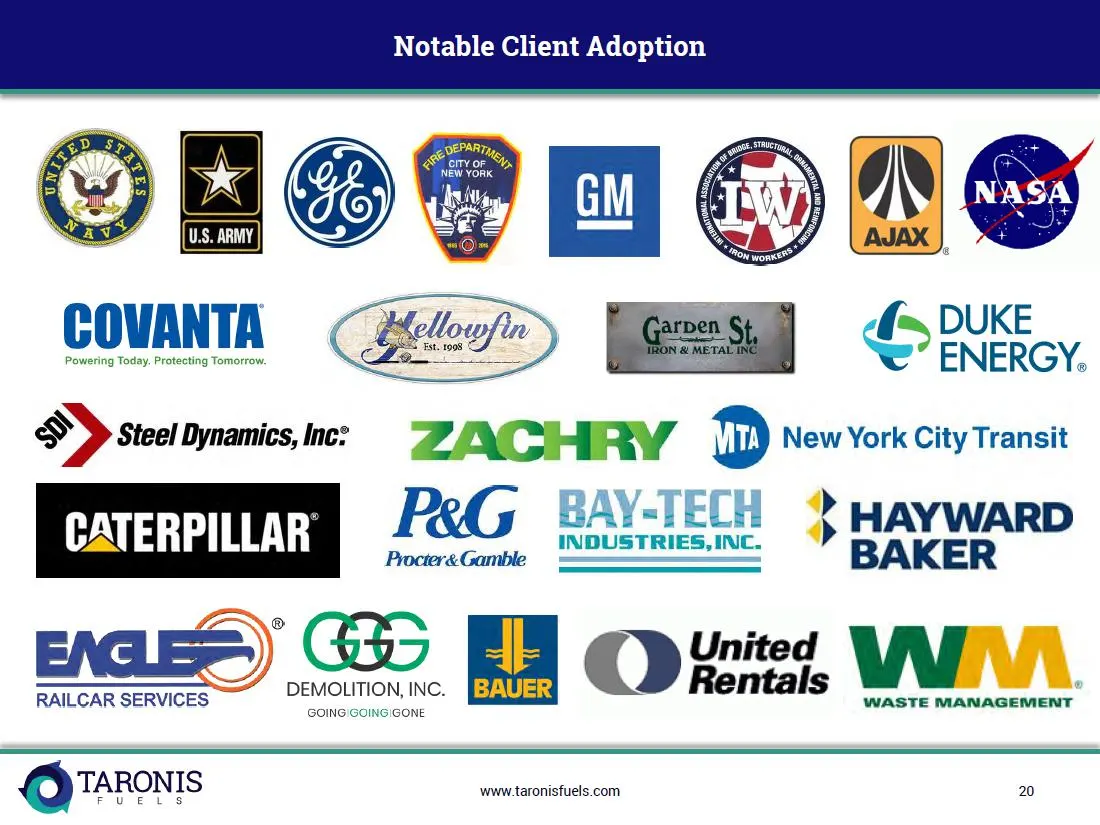
Slide 20: Notable Client Adoption
Notable Client Adoption DUKE Ww” ENERGY. S$) Steet Dynamics, me: 7, Y = q 4 { D New York City Transit : } HAYWARD CATERPILLAR > HAY We ( 7 United TARONIS FUELS www.taronisfuels.com 20
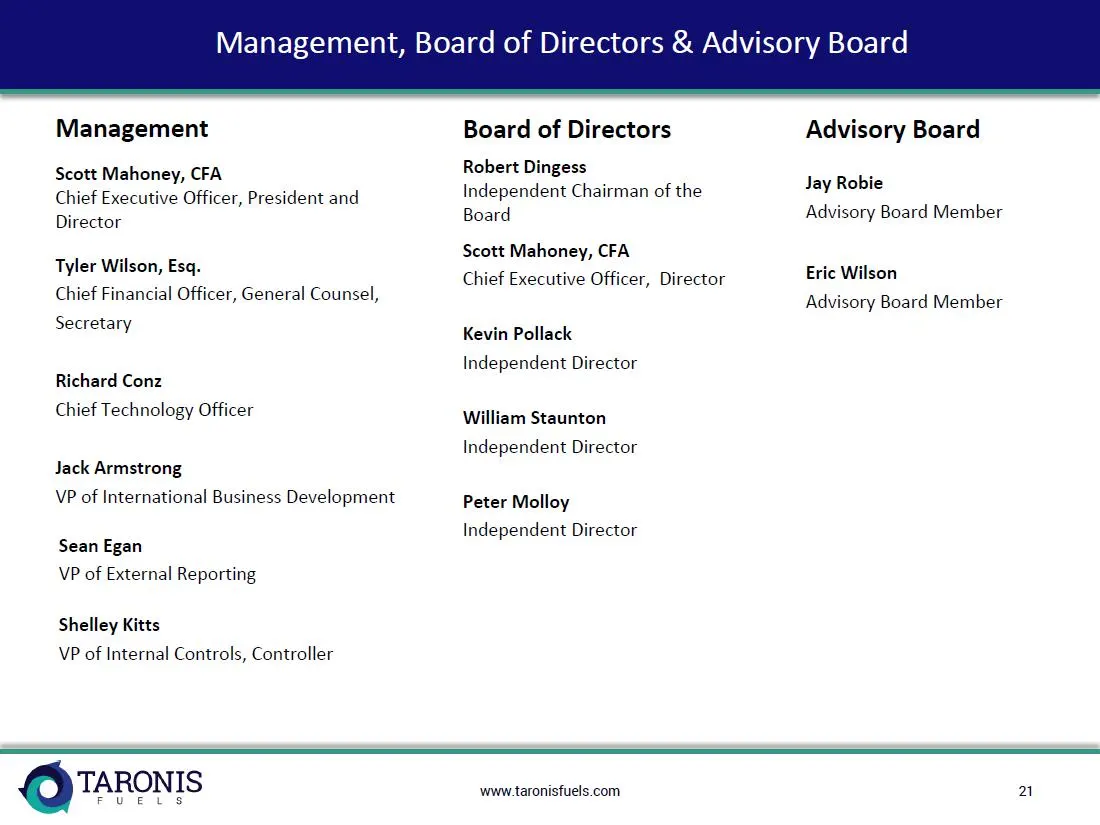
Slide 21: Management, Board of Directors & Advisory Board
agement, Board of Directors & Advisory Board Management Scott Mahoney, CFA Chief Executive Officer, President and Director Tyler Wilson, Esq. Chief Financial Officer, General Counsel, Secretary Richard Conz Chief Technology Officer Jack Armstrong VP of International Business Development Sean Egan VP
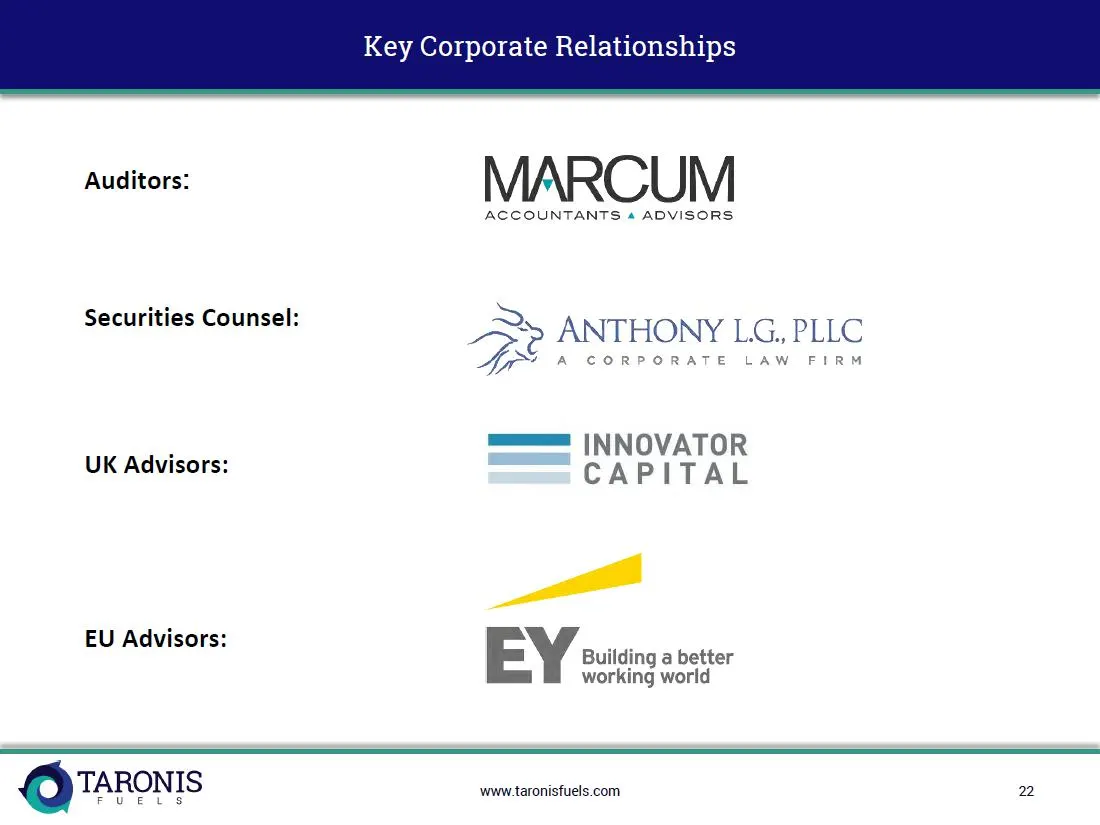
Slide 22: Key Corporate Relationships
Key Corporate Relationships auditors: MARCUM ACCOUNTANTS 4 ADVISORS Securities Counsel: Ze ANTHONY L.G., PLLC A CORPORATE LAW FIRM _—— UK Advisors: is PITA is EU Advisors: Building a better working world TARONIS www.taronisfuels.com 2 FUELS
Source: SEC EDGAR · 8-K/A filed Feb 5, 2020