Expressjet — Goldman Sachs 19th Annual Transportation Conference (February 2004)
15 slides from Expressjet's conference presentation, Feb 4, 2004
Slide 1: Goldman Sachs 19th Annual Transportation Conference
Exhibit 99.1 = Goldman Sachs 19‘ Annual Transportation Conference February 4, 2004 a
Slide 2: Forward-looking statements
=F Expressfet. The following presentation contains forward-looking statements that are not limited to historical facts, but reflect our current beliefs, expectations or intentions regarding future events. There are a number of factors that could cause actual results to differ materially fram those i
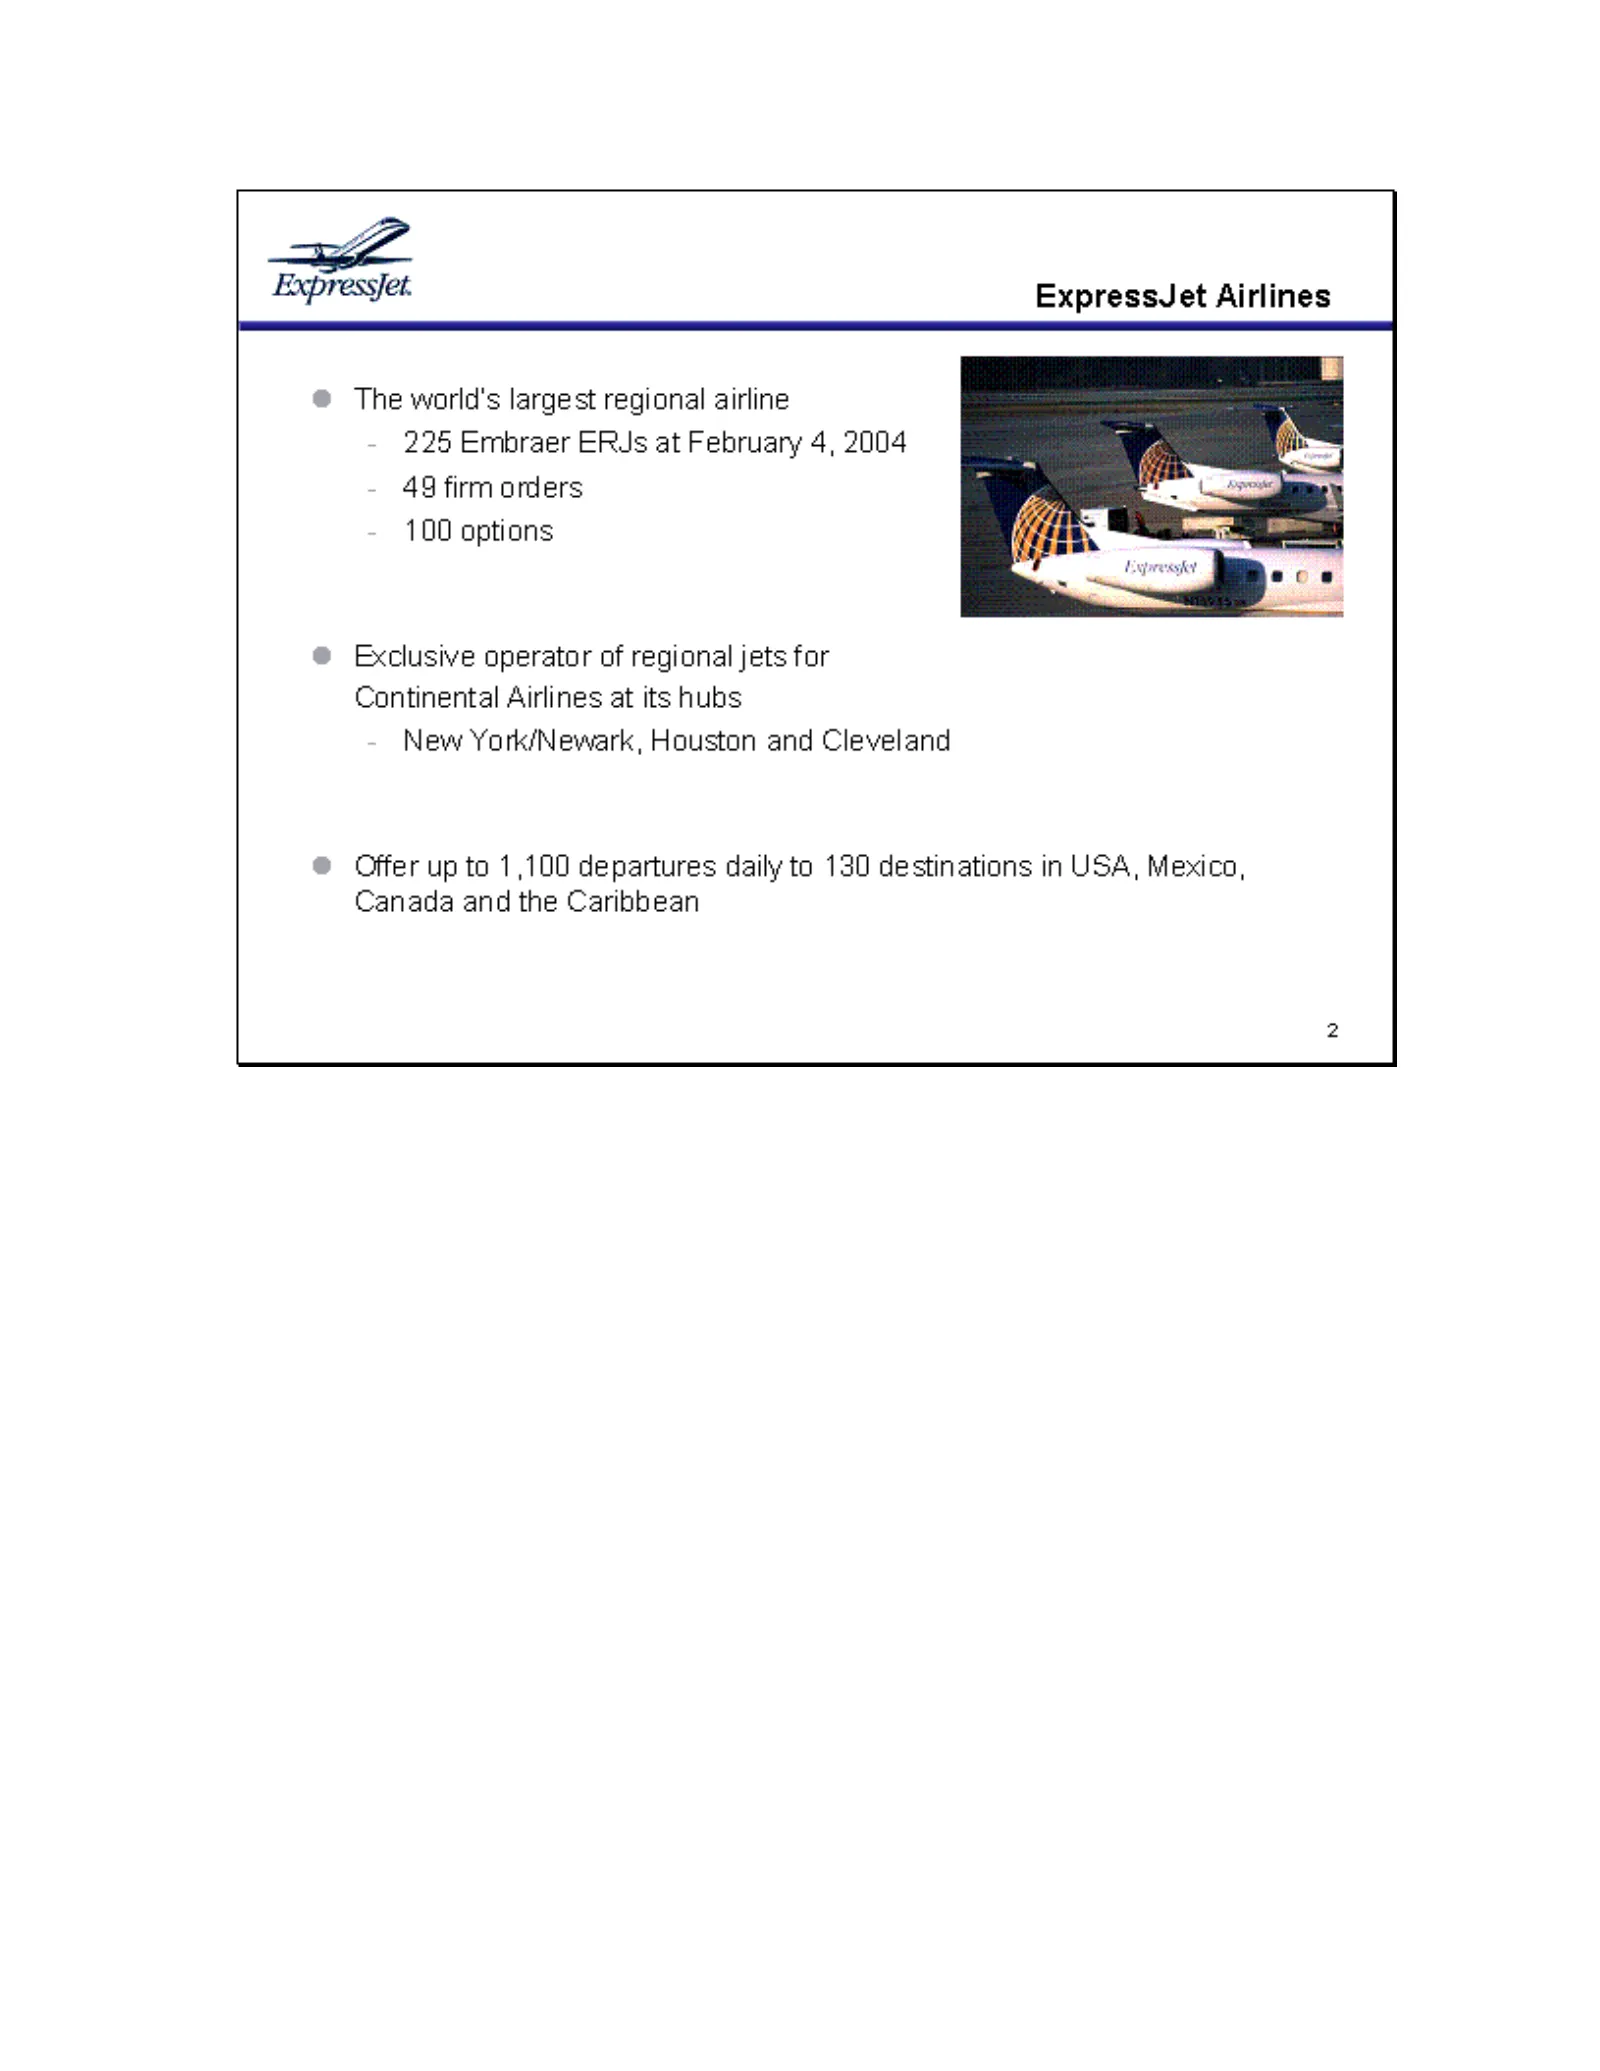
Slide 3: ExpressJet Airlines: The world's largest regional airline
Zt Expressfet. ExpressJet Airlines The world's largest regional airline 225 Embraer ERJs at February 4, 2004 49 firm orders 100 options Exclusive operator of regional jets for Continental Airlines at its hubs New York/Newark, Houston and Cleveland Offer up to 1,100 departures daily to 130 destinatio
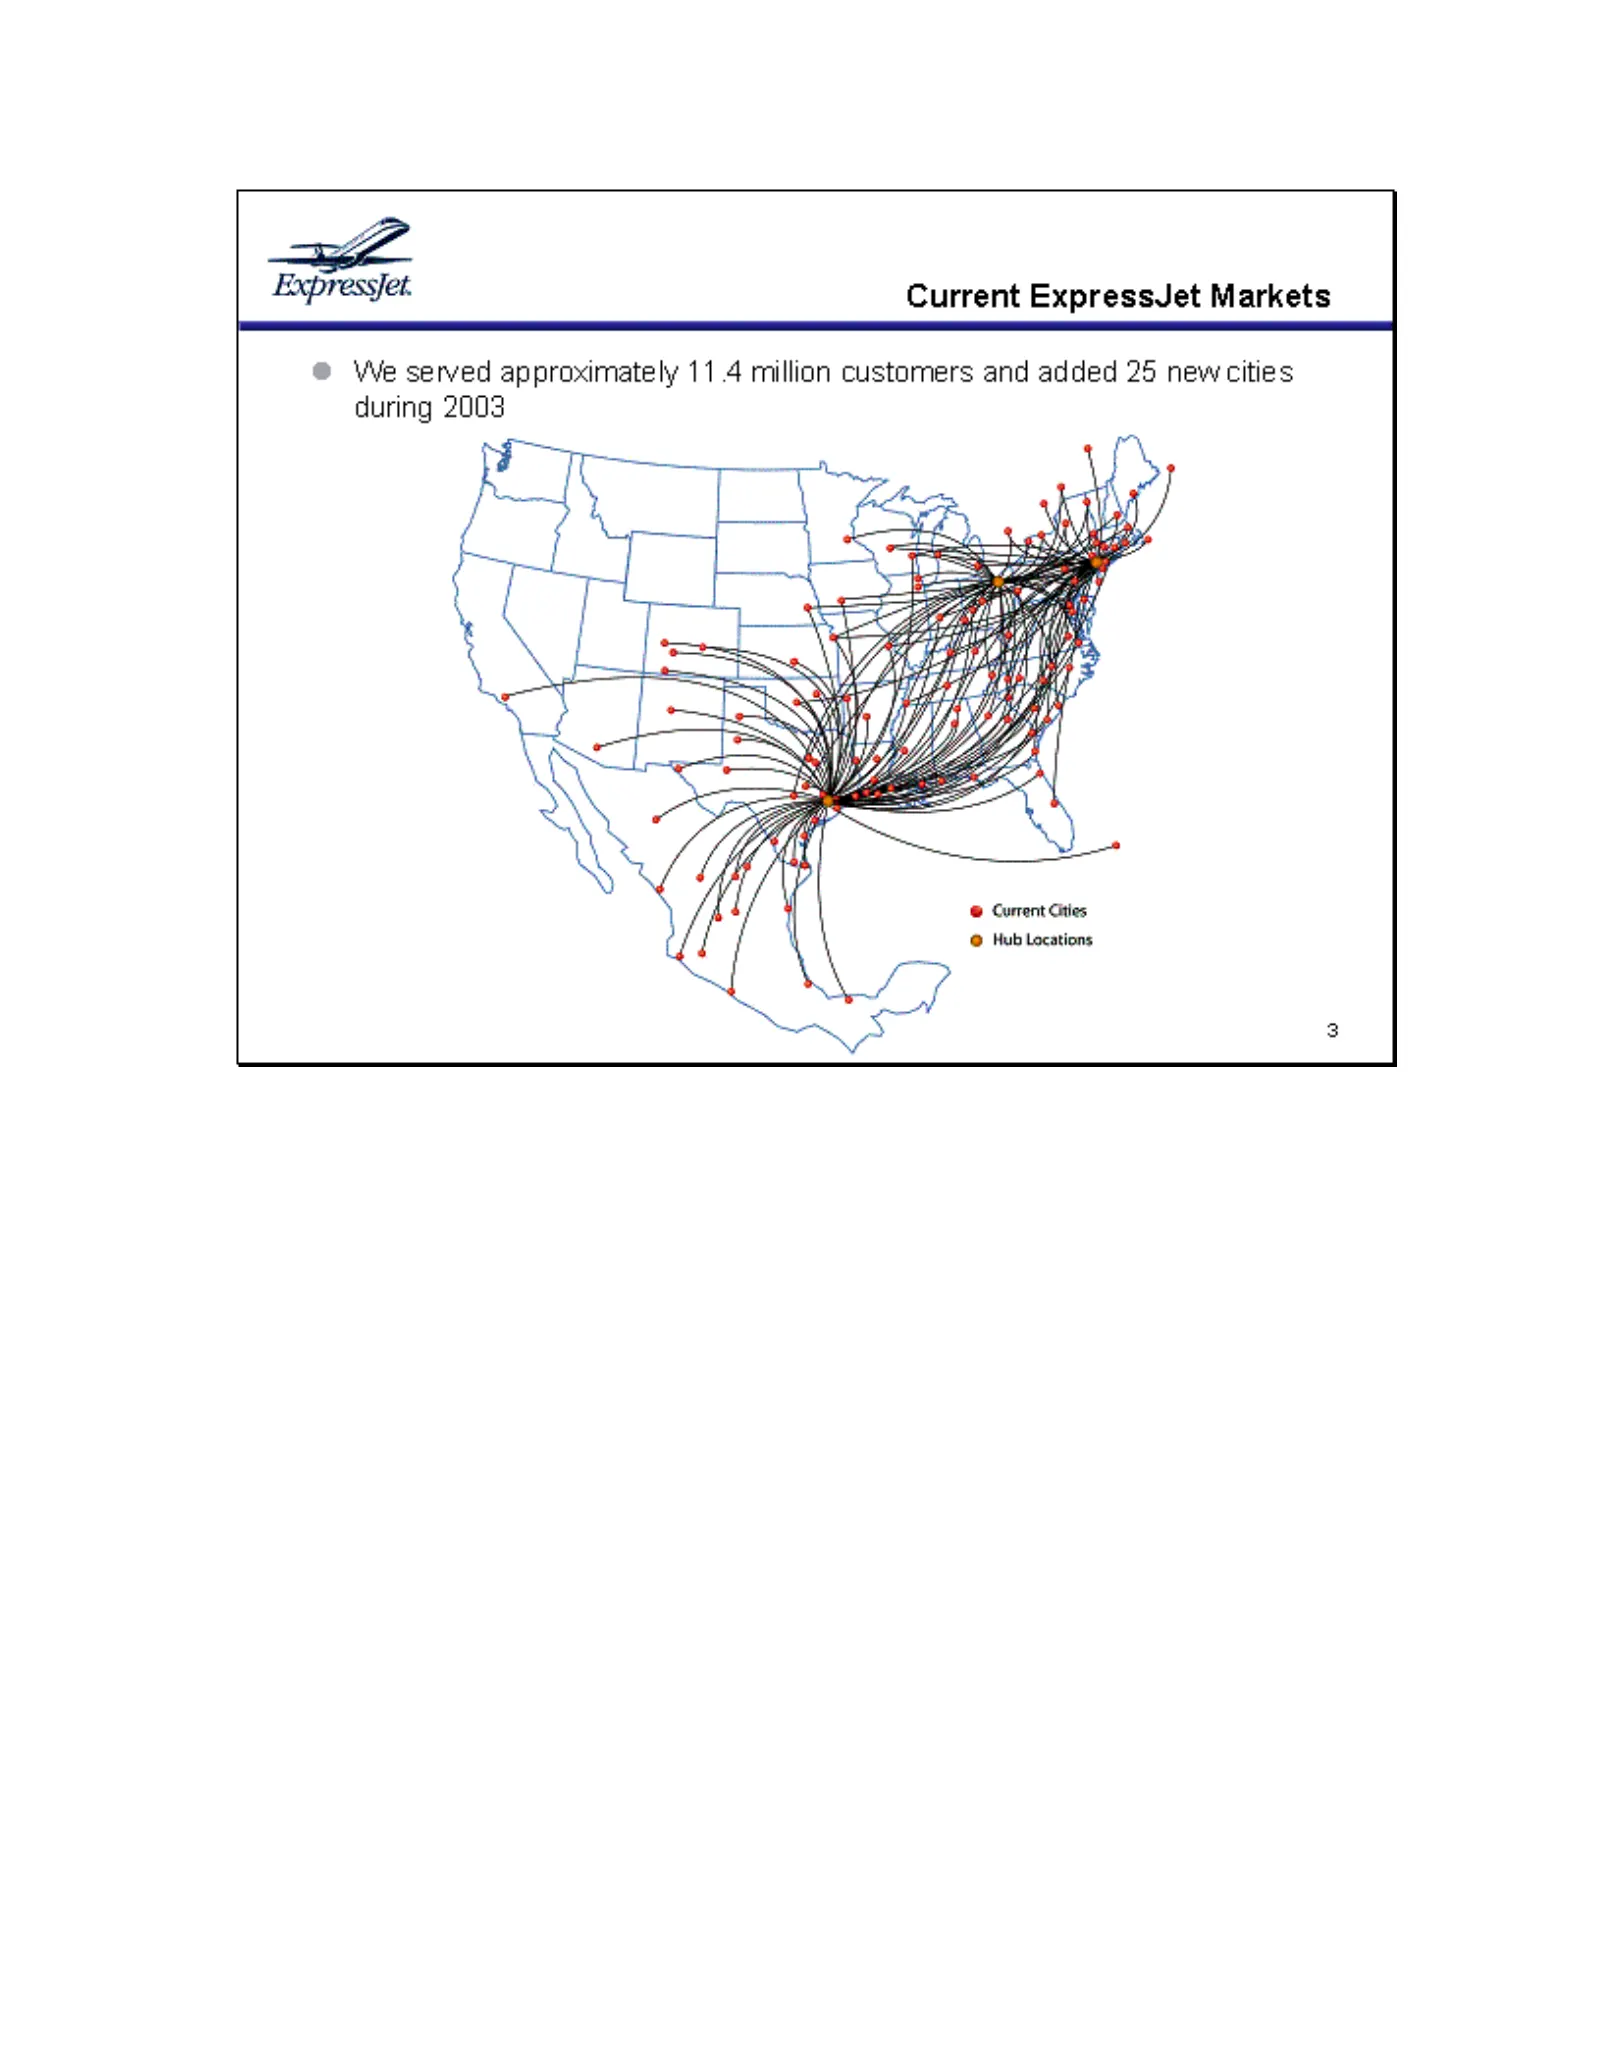
Slide 4: Current ExpressJet Markets
=F ExpressJet. Current ExpressJet Markets ® We served approximately 11.4 million customers and added 25 new cities during 2003 @ Current Gties @ Hub Locations
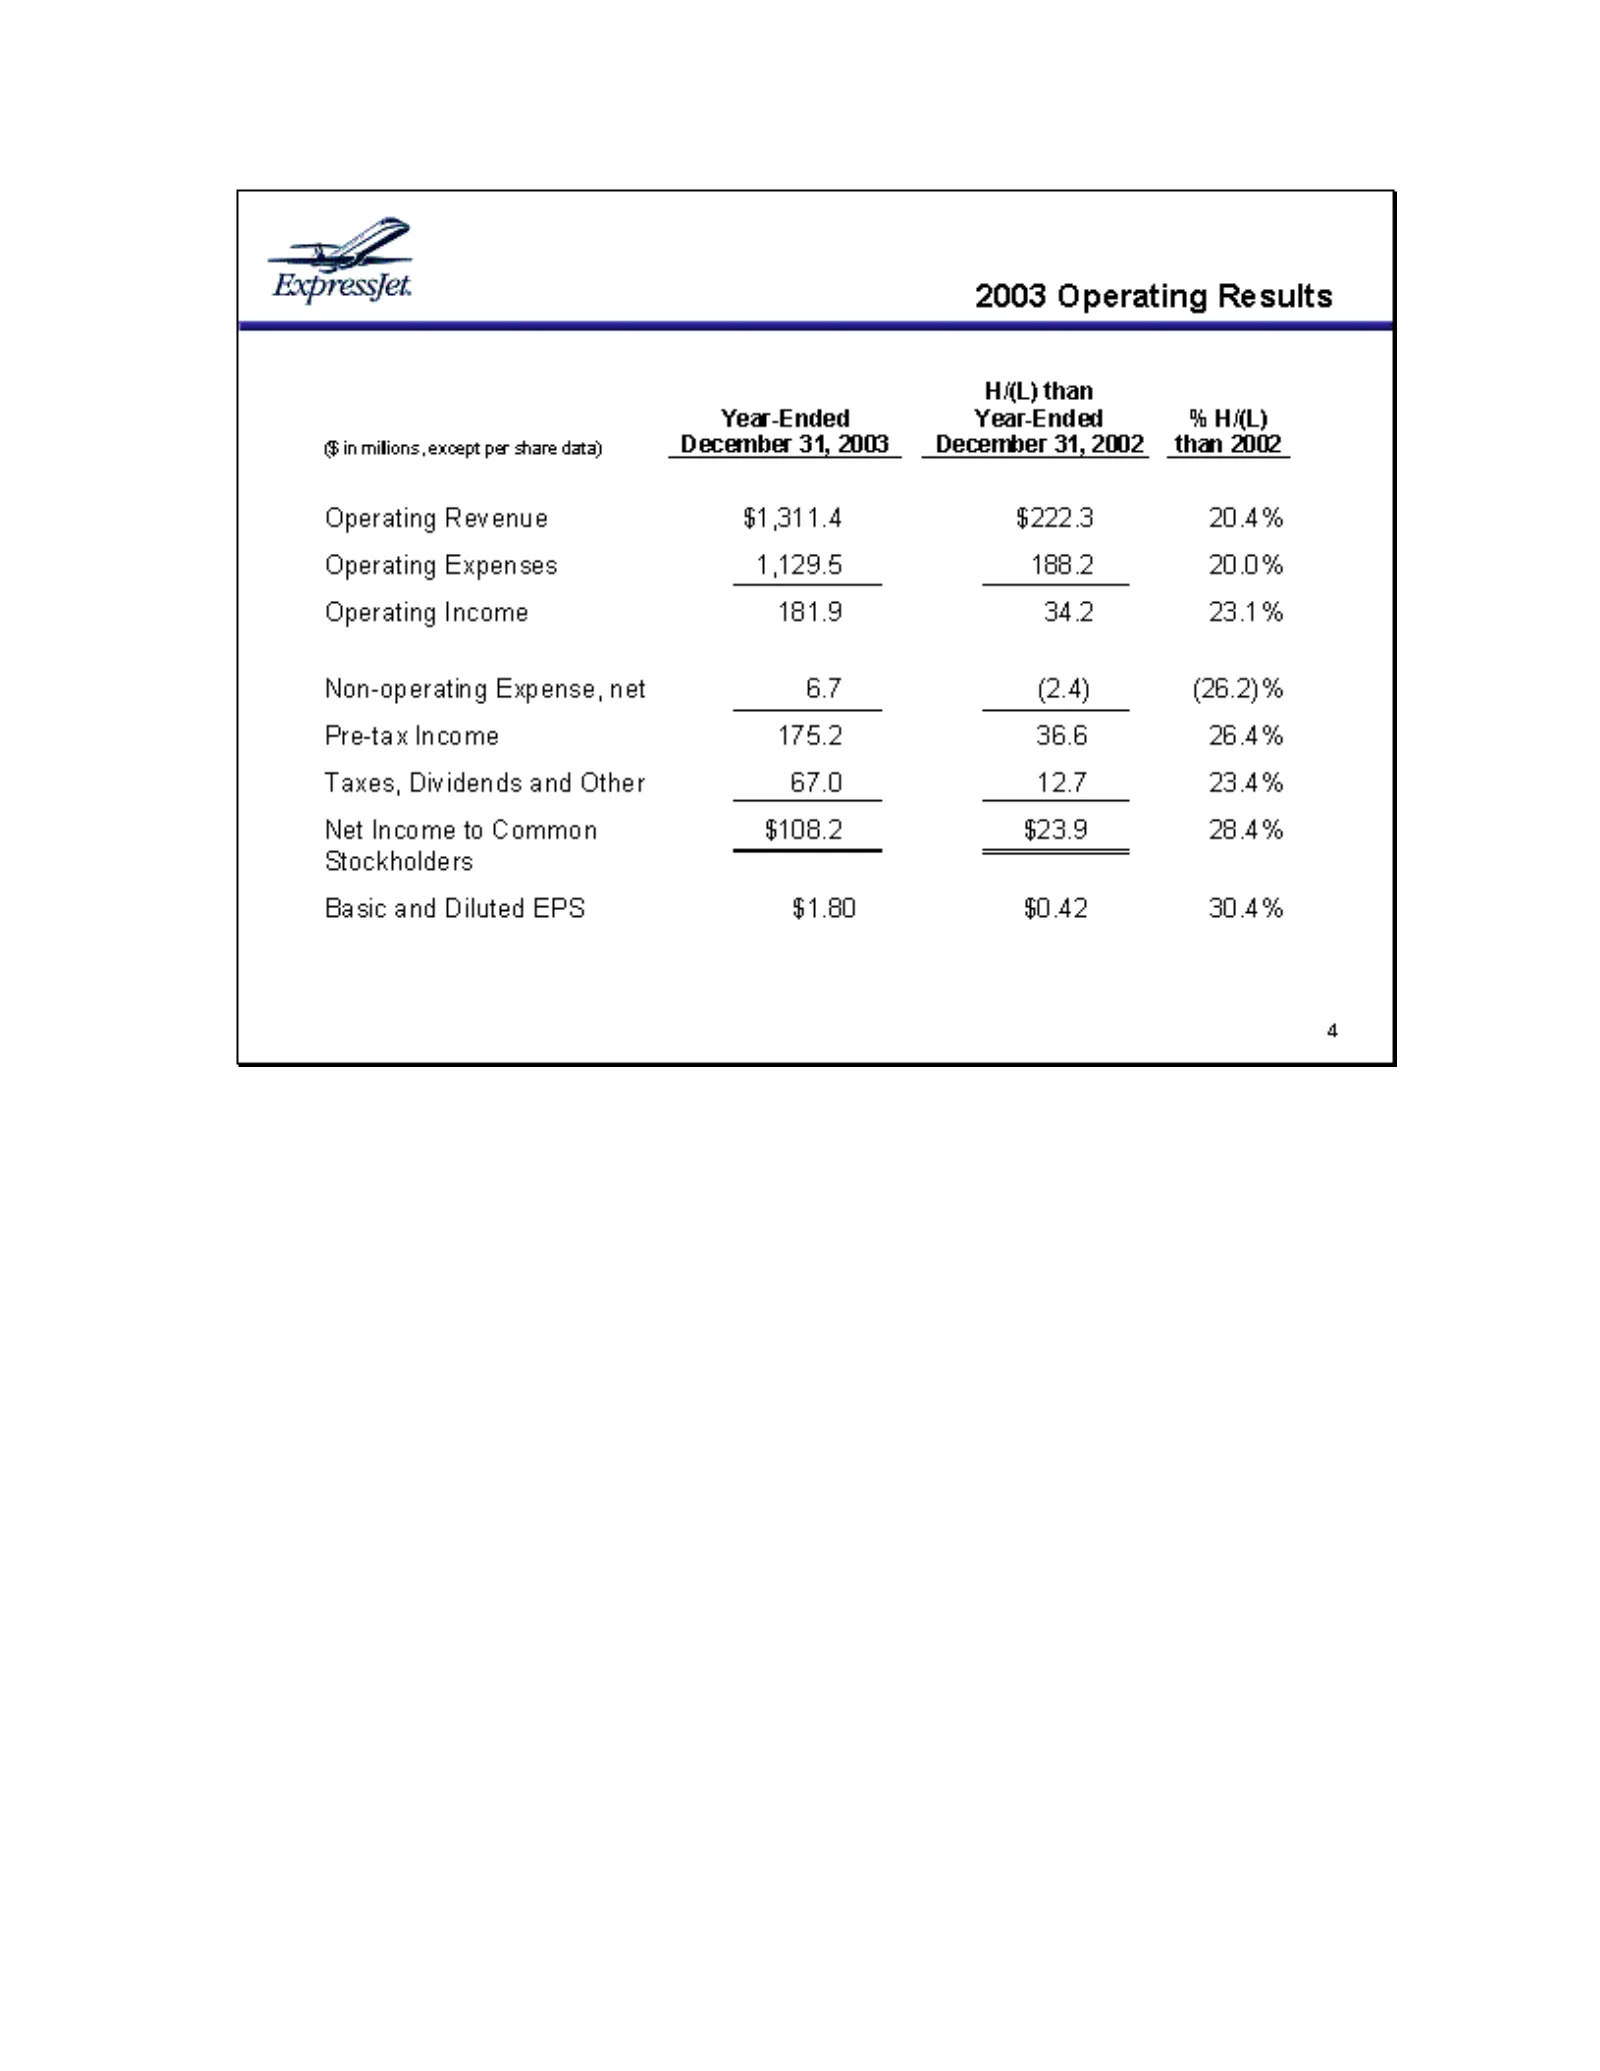
Slide 5: 2003 Operating Results
ExpressJet. 2003 Operating Results HAL) than Year-Ended Year-Ended % HAL) Gin milions, except per share data) December 31, 2003 December 31,2002 than 2002 Operating Revenue $1,311.4 $222.3 20.4% Operating Expenses 1,129.5 188.2 20.0% Operating Income 181.9 34.2 23.1% Non-operating Expense, net 67 (2
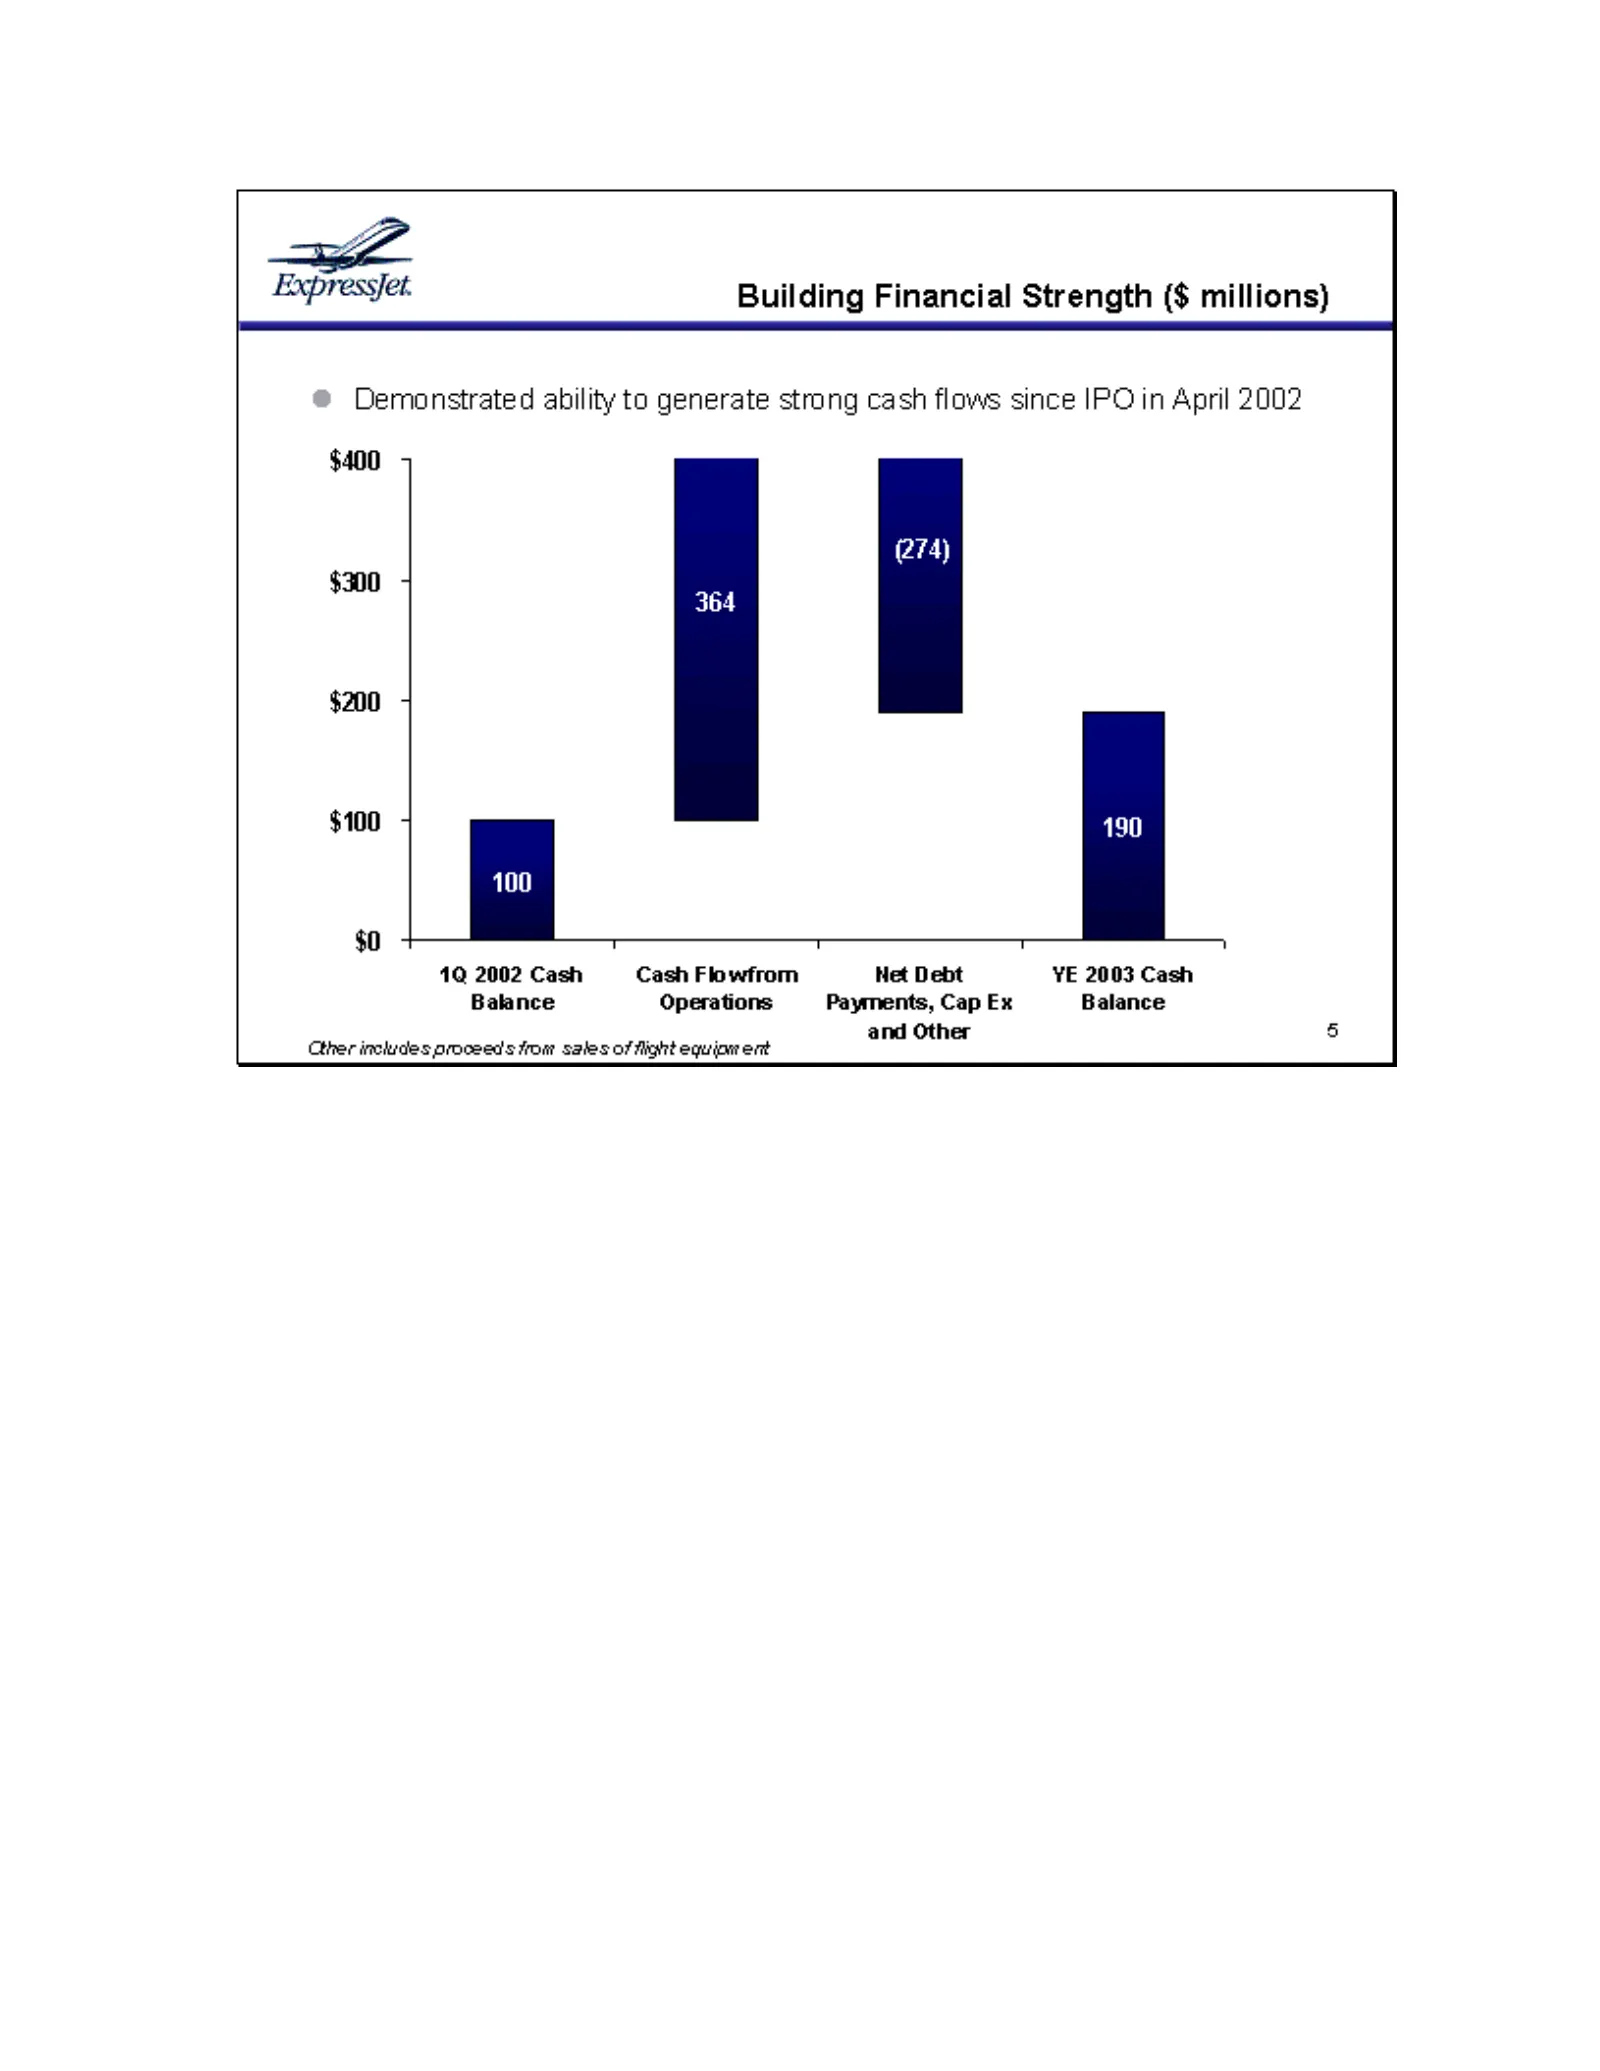
Slide 6: Building Financial Strength
Expressfet. Building Financial Strength ($ millions) Demonstrated ability to generate strong cash flows since IPO in April 2002 $400 7 (274) $300 364 $200 4 $100 5 $0 1 1 1 1 1Q 2002 Cash = Cash Flowfrom Net Debt YE 2003 Cash Balance Operations Payments, Cap Ex Balance . . . and Other 6 Cther includ
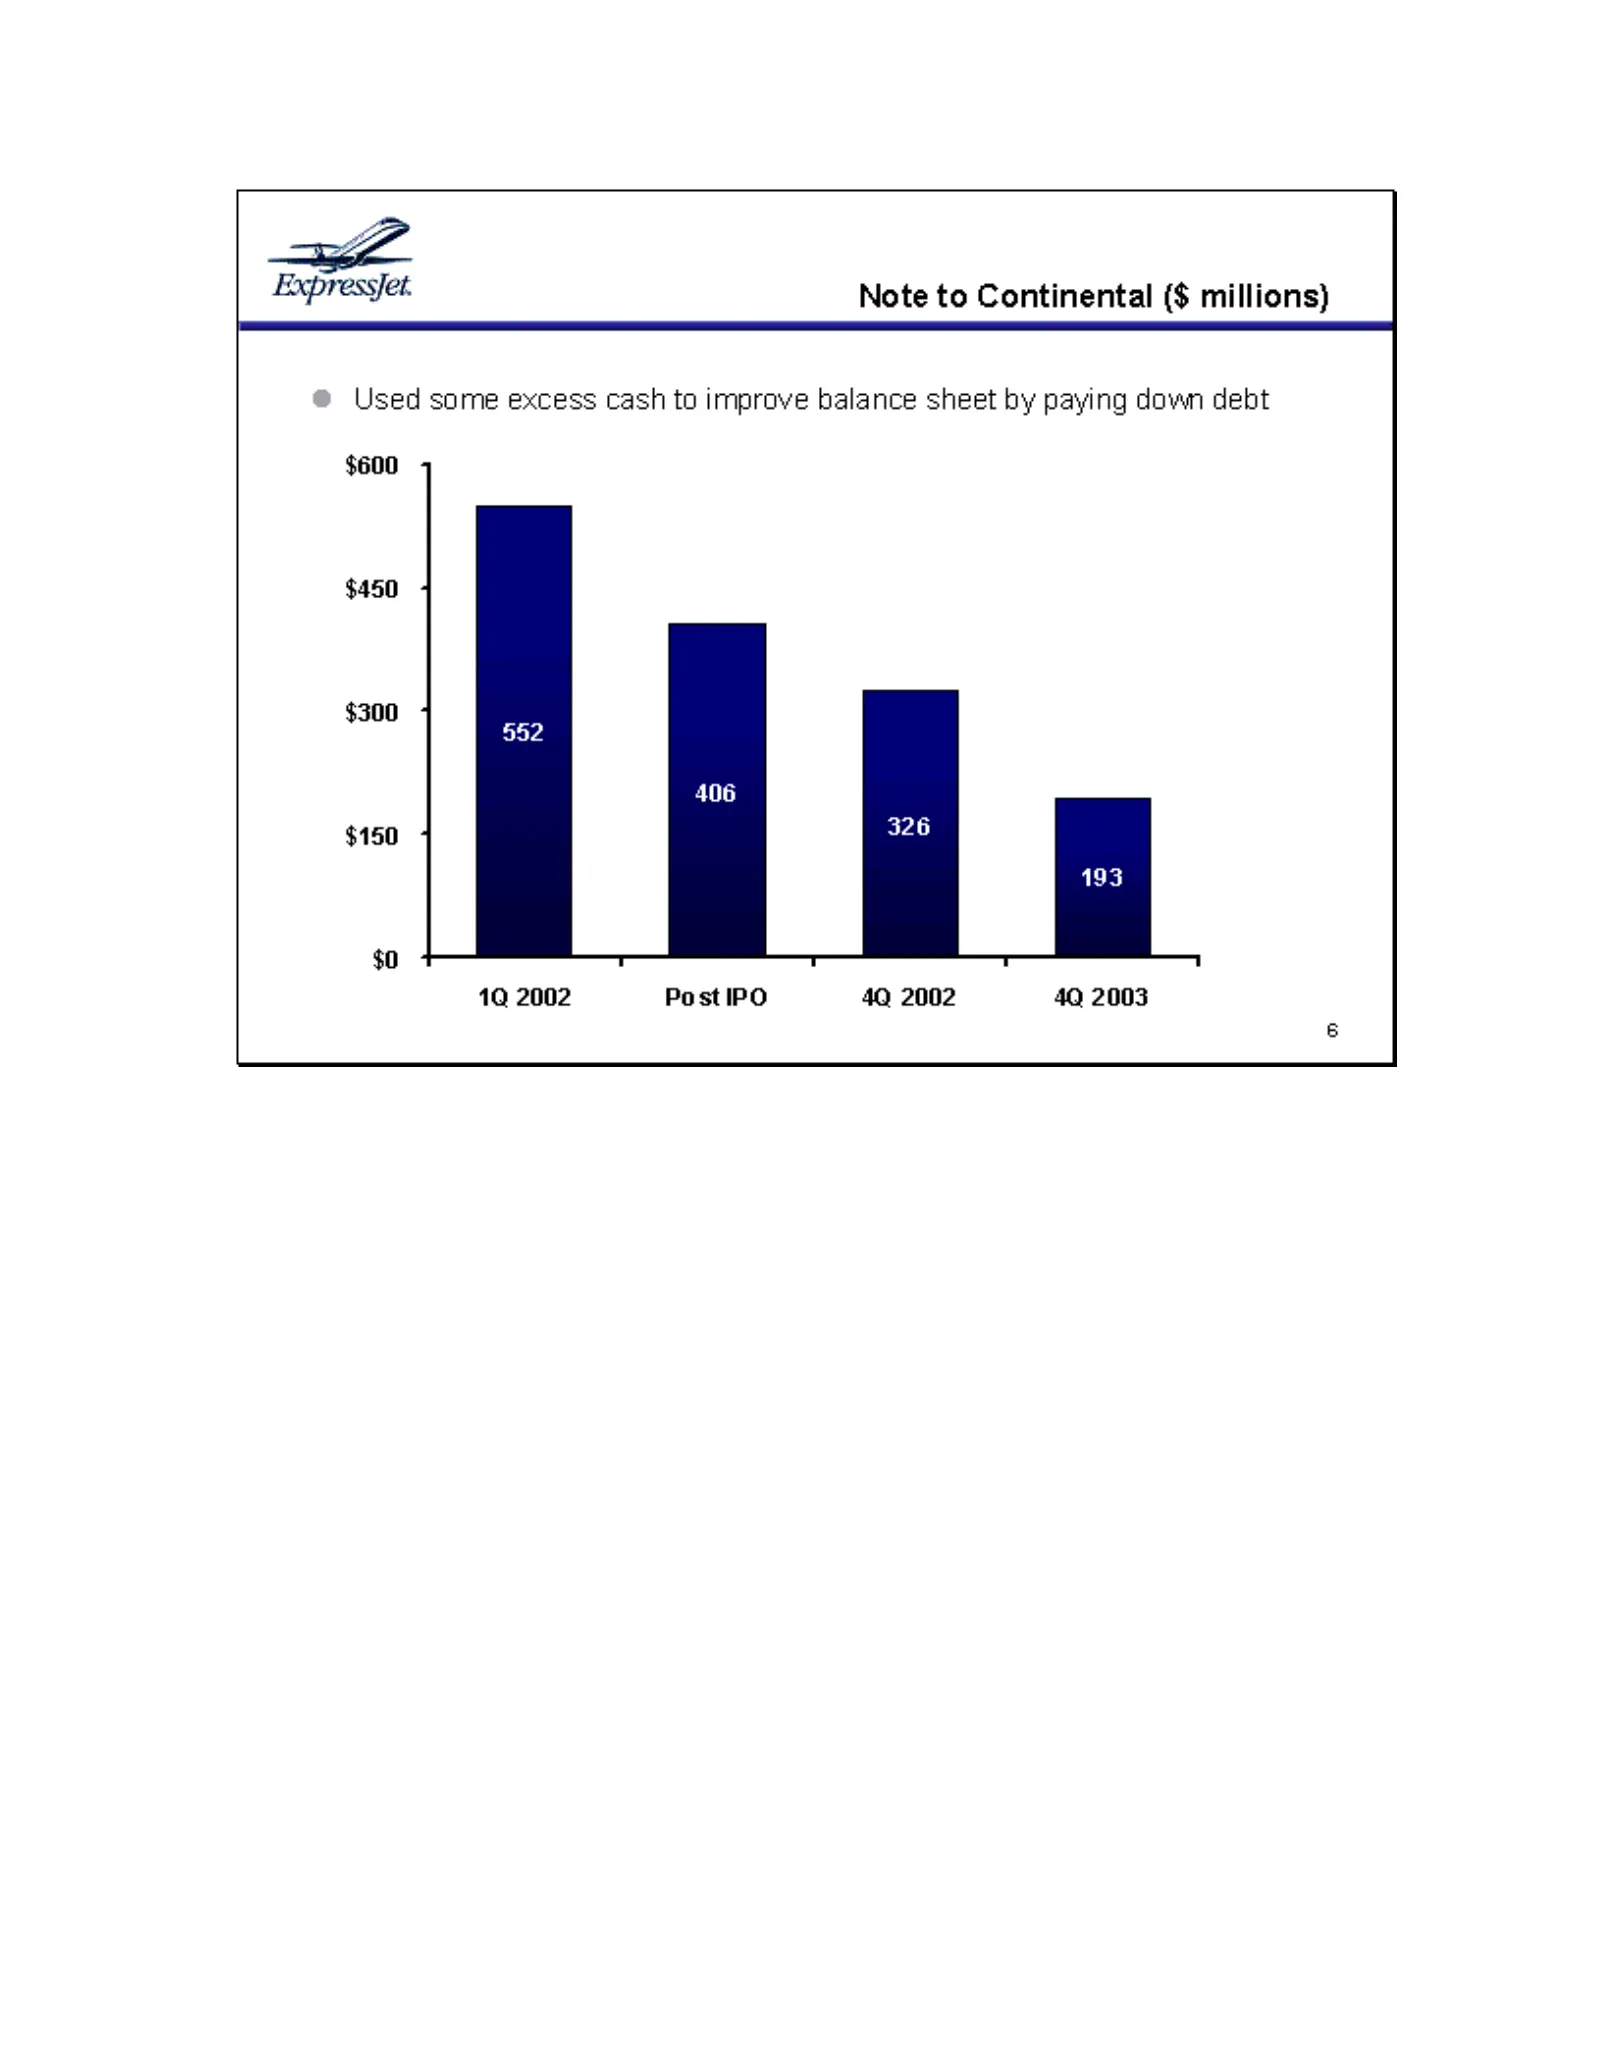
Slide 7: Note to Continental
Expressfet. Note to Continental ($ millions) ® Used some excess cash to improve balance sheet by paying down debt $600 4 $450 4 300 4 § 552 406 $150 4 326 193 $0 T T T 1 1Q 2002 Post IPO 4Q 2002 4Q 2003
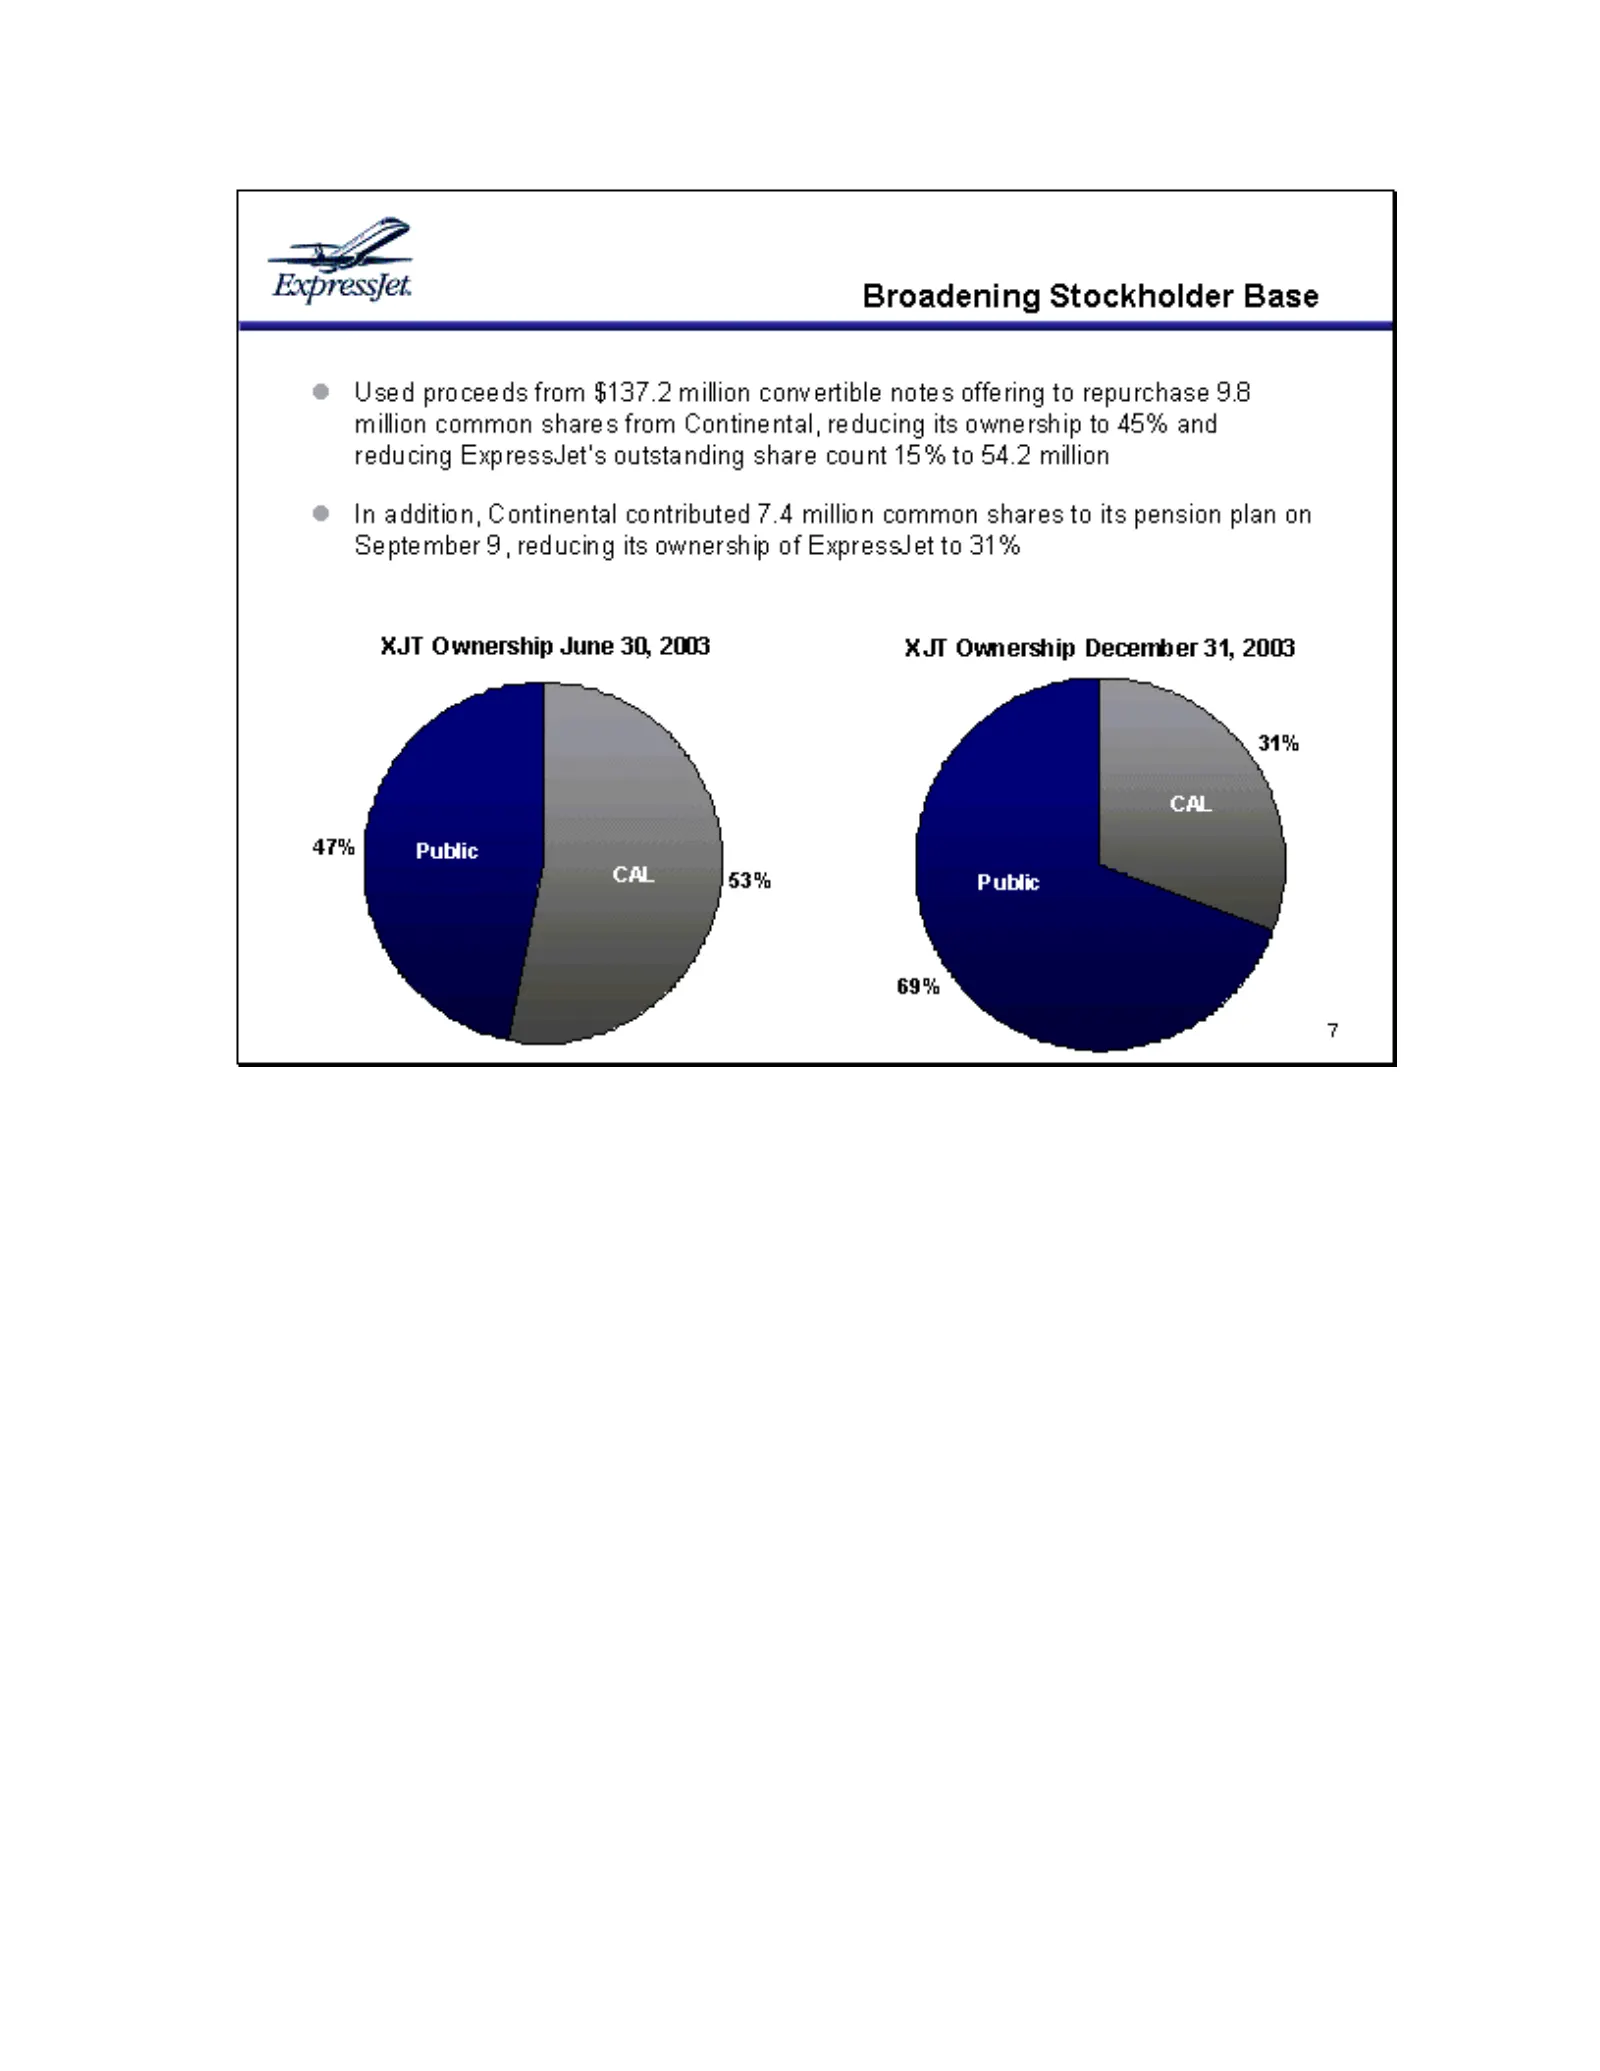
Slide 8: Broadening Stockholder Base
g sJet. Broadening Stockholder Base Used proceeds from $137.2 million convertible notes offering to repurchase 9.8 million common shares fromm Continental, reducing its ownership to 45% and reducing ExpressJet's outstanding share count 15% to 54.2 million In addition, Continental contributed 7.4 mil
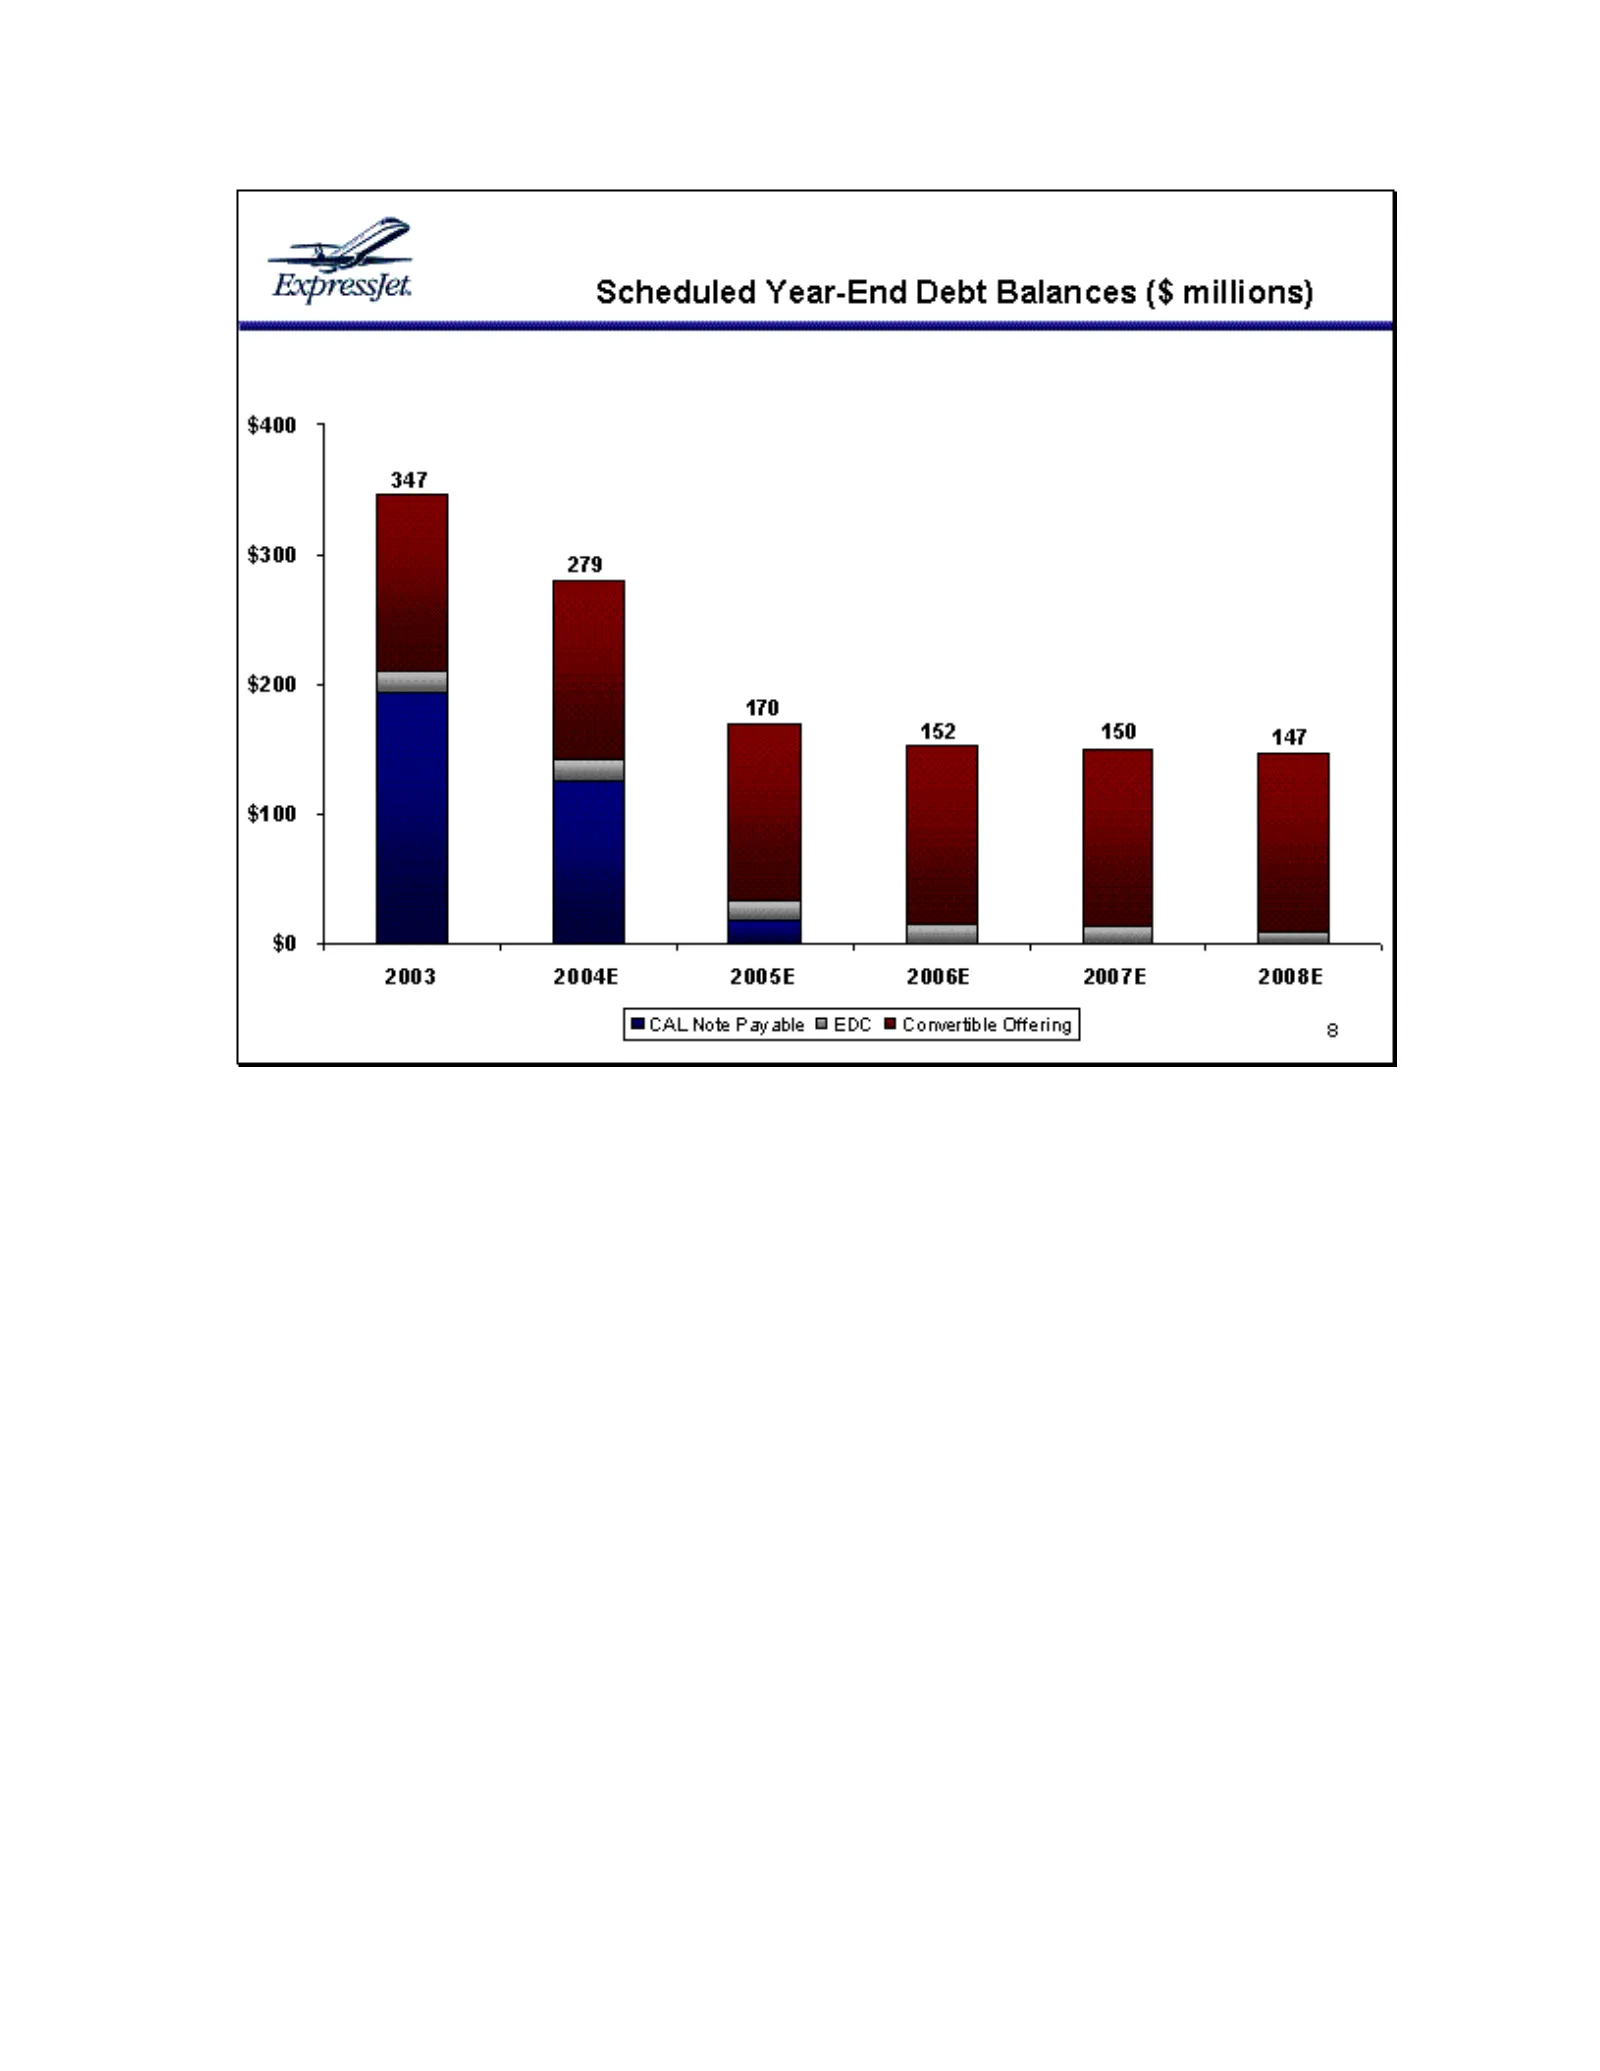
Slide 9: Scheduled Year-End Debt Balances
$400 $300 $200 $100 $0 Scheduled Year-End Debt Balances ($ millions) 347 279 170 ' 162 150 447 2003 2004E 2005E 2006E 2007E 2008E MCALNote Payable EDC @ Convertible Offering
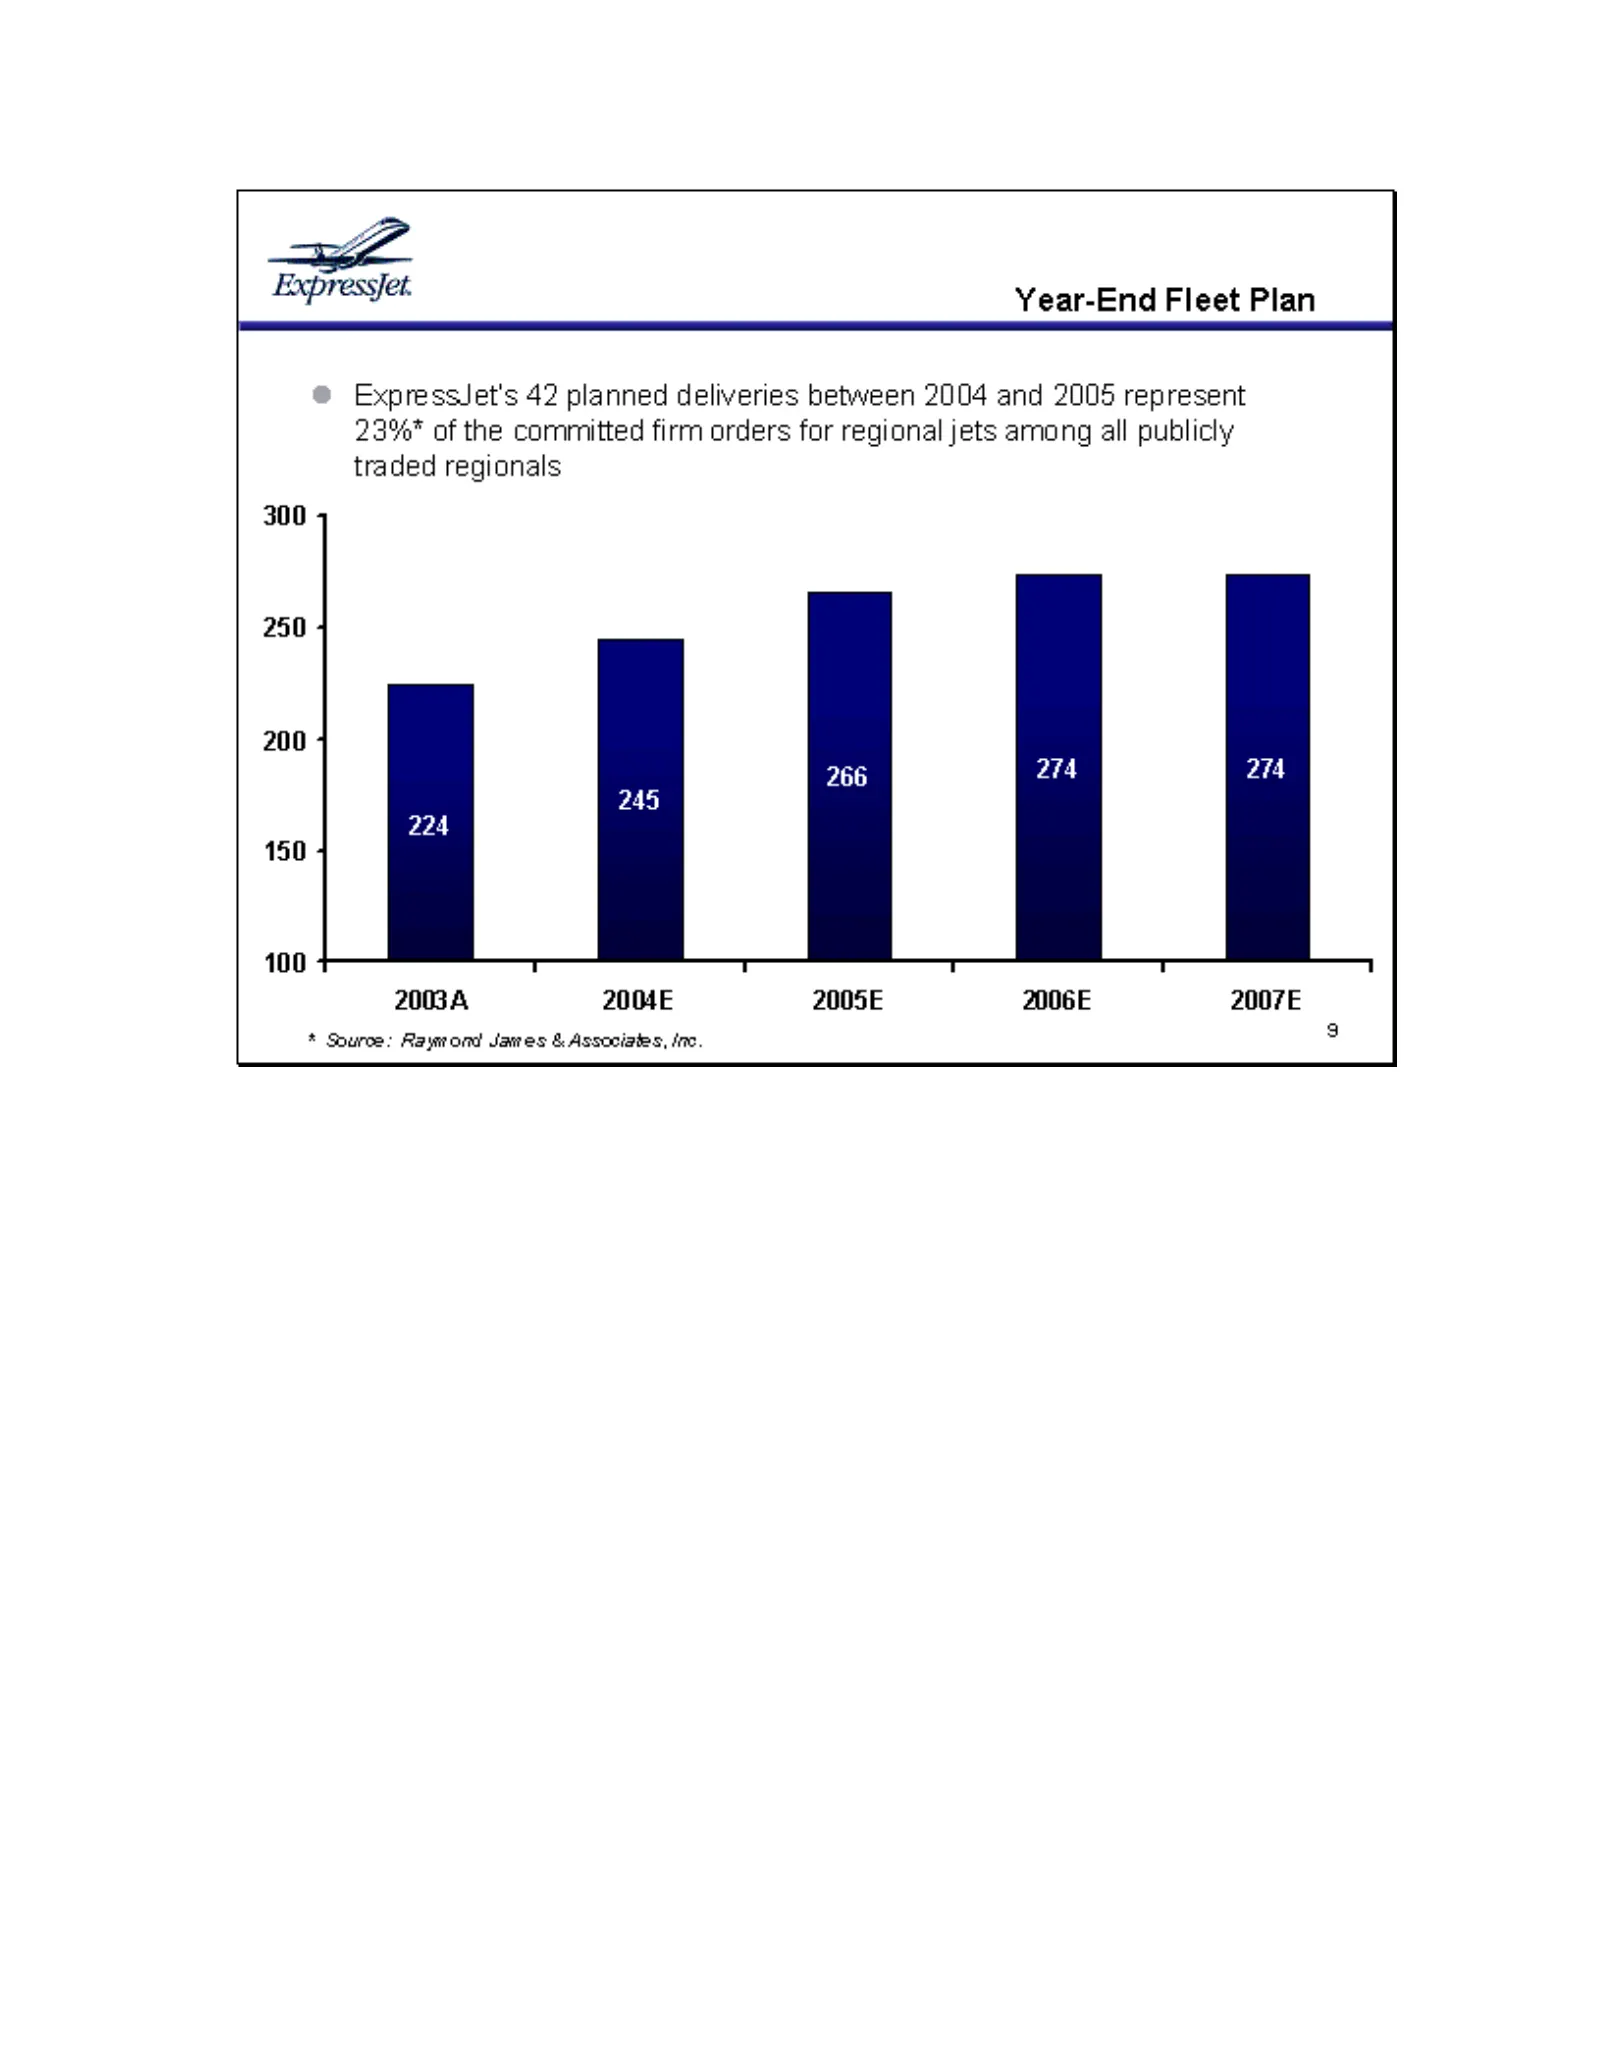
Slide 10: Year-End Fleet Plan
ExpressJet. Year-End Fleet Plan © ExpressJet's 42 planned deliveries between 2004 and 2005 represent 293%* of the committed firm orders for regional jets among all publicly traded regionals 300 4 250 4 200 4 266 274 274 245 224 150 7 100 T T T T 1 20034 2004E 2005E 2006E 2007E * Source: Raywond Jare
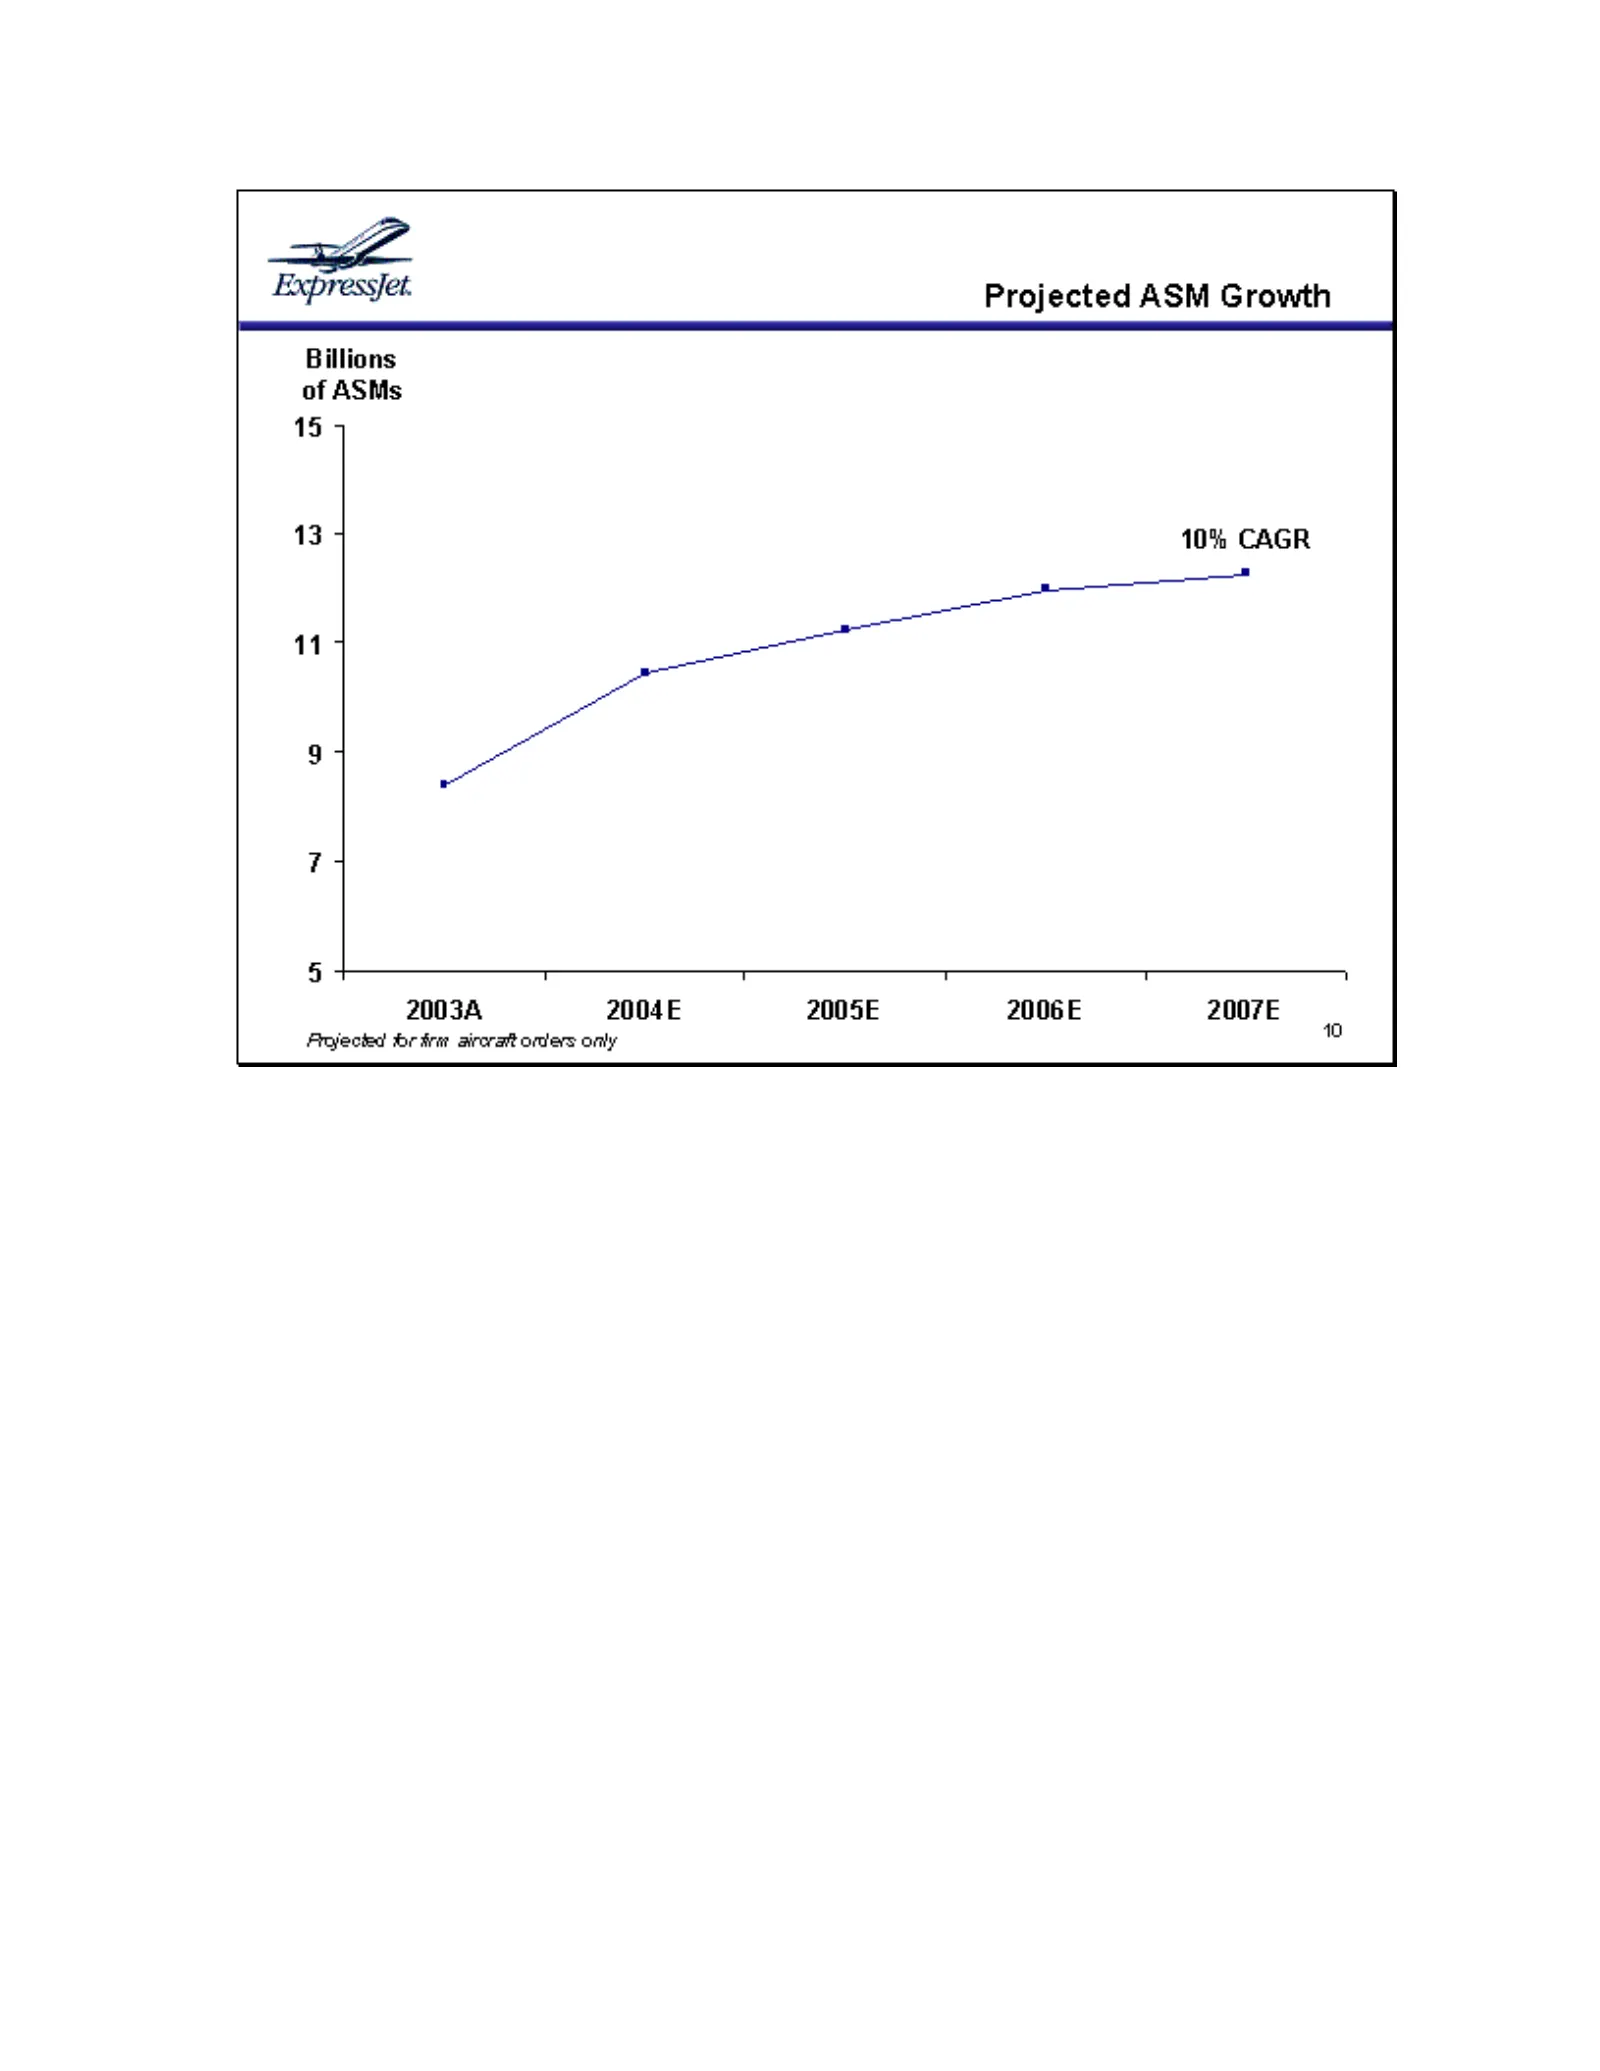
Slide 11: Projected ASM Growth
Zt ExpressJet. Projected ASM Growth Billions of ASMs 15 5 135 10% CAGR 1175 5 T T T T 1 20034 2004E 2005E 2006E 2007E Projected wr strat airoratt onlers only
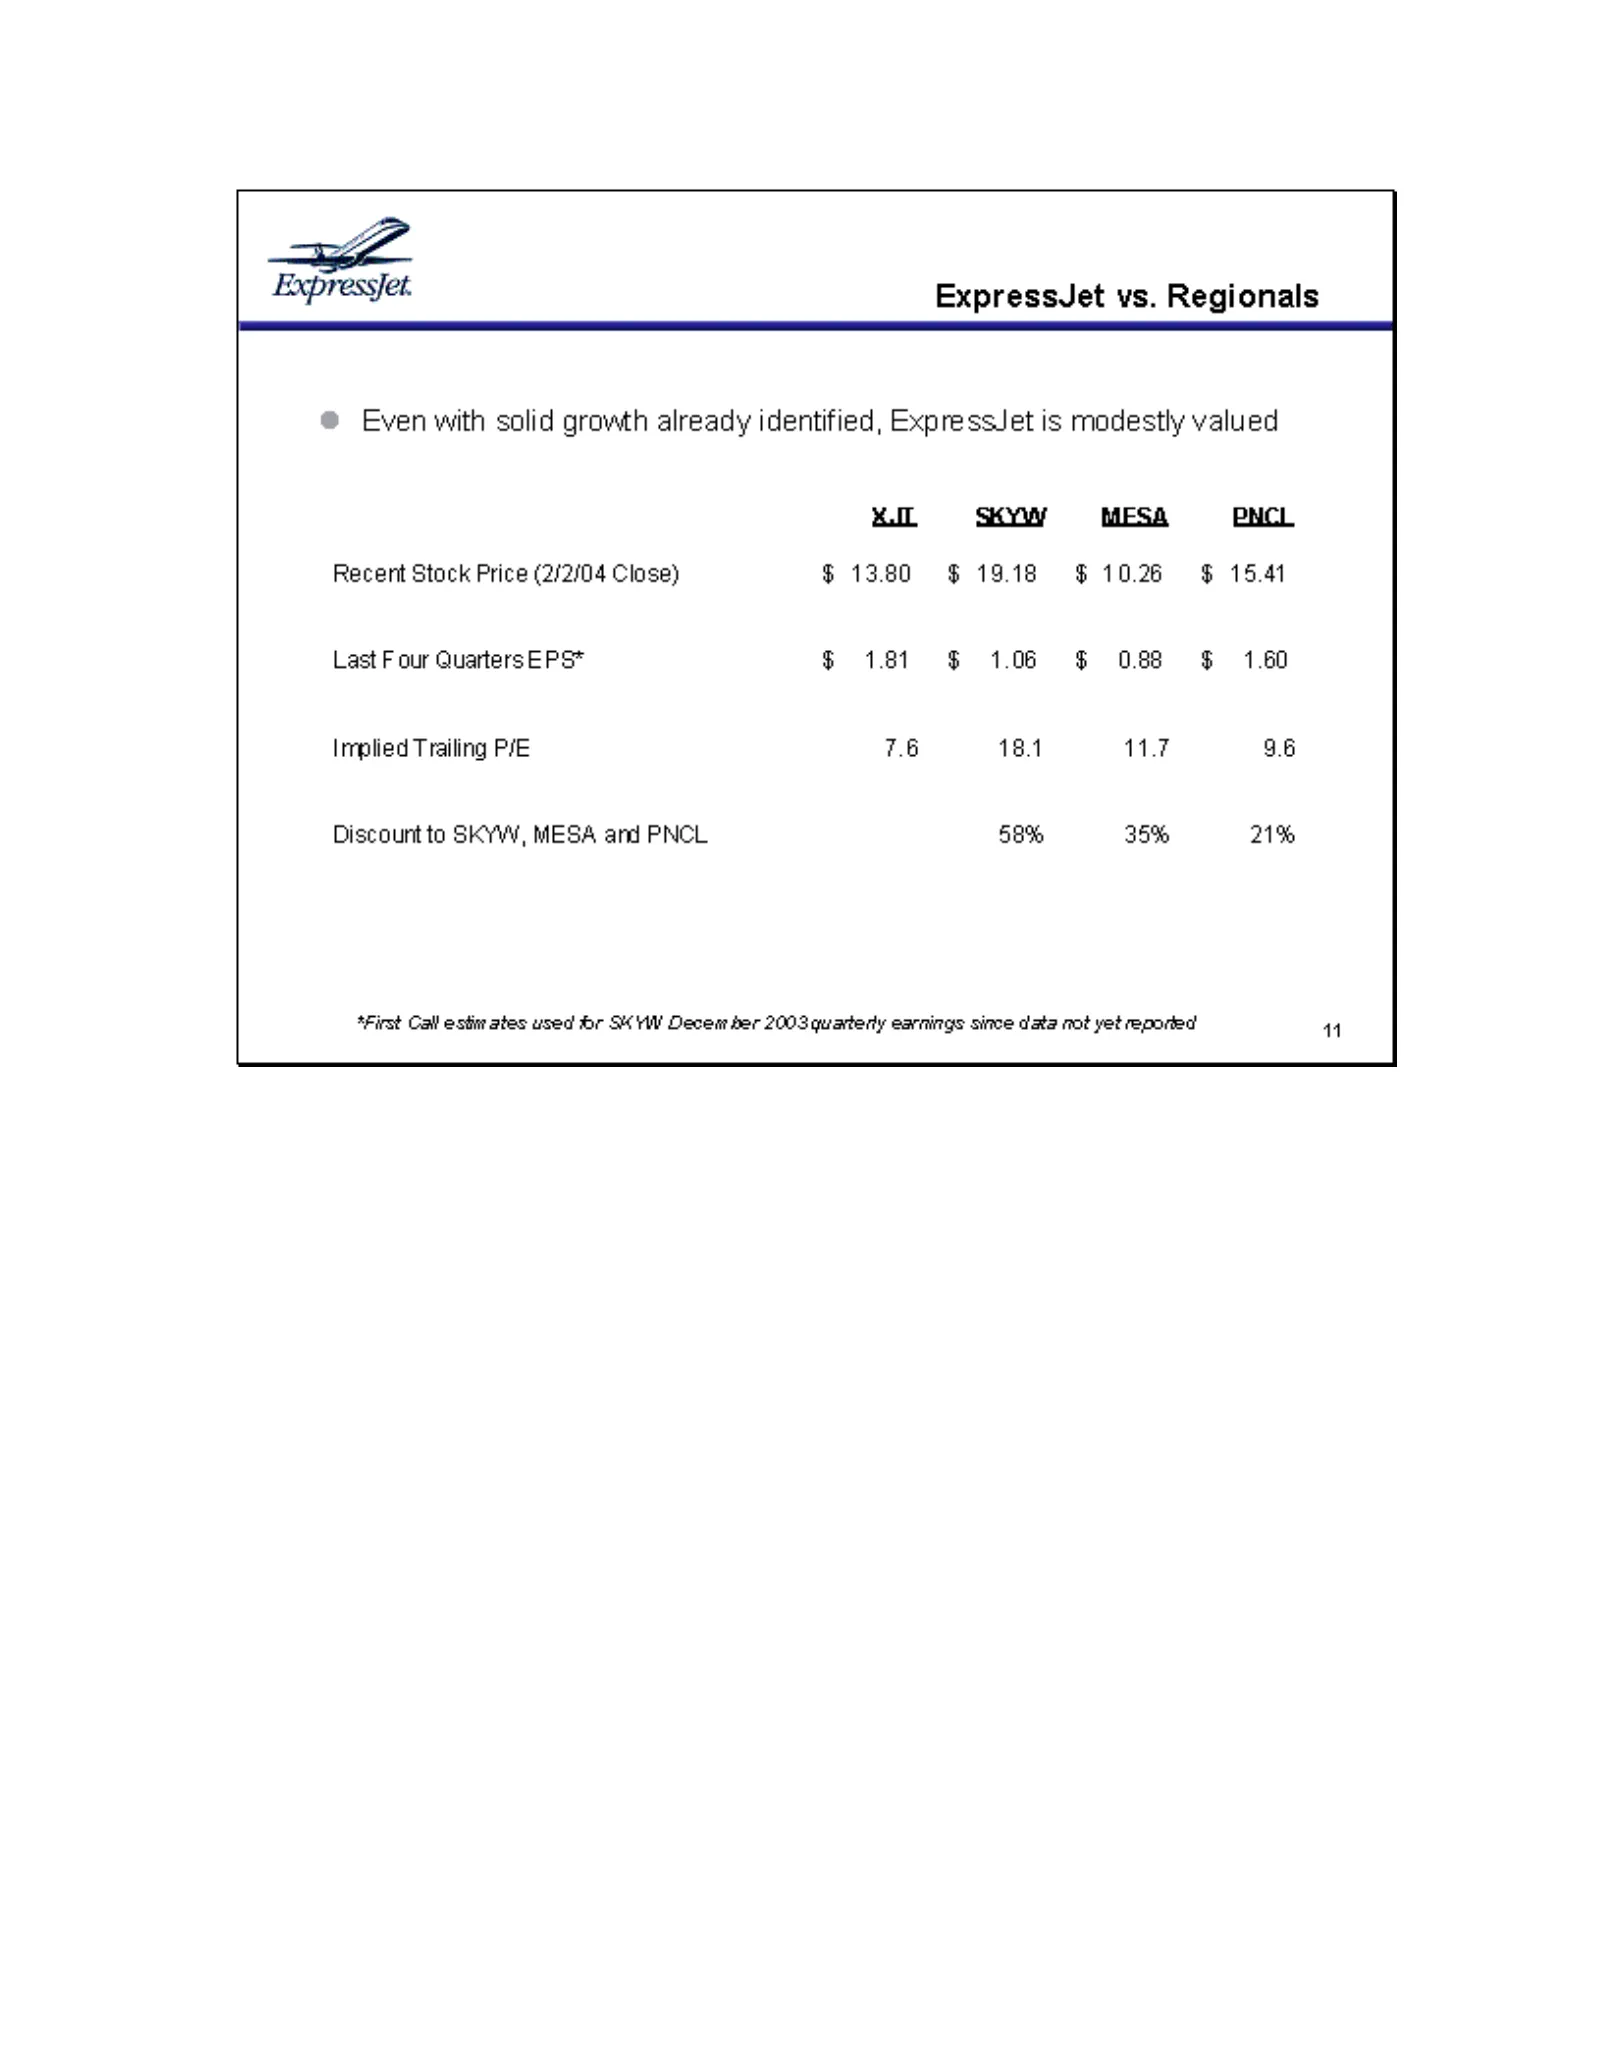
Slide 12: ExpressJet vs. Regionals valuation
a ExpressJet. Recent Stock Price (2/2/04 Close) Last F our Quarters EPS* Implied Trailing P/E Discount to SkYW, MESA and PNCL ExpressJet vs. Regionals Even with solid growth already identified, ExpressJet is modestly valued x0 8 Skyw = 6MESAOPNCL $1380 $1918 $1026 $ 15.41 $ 088 $ 1.60 7.6 18.1 W7 9.
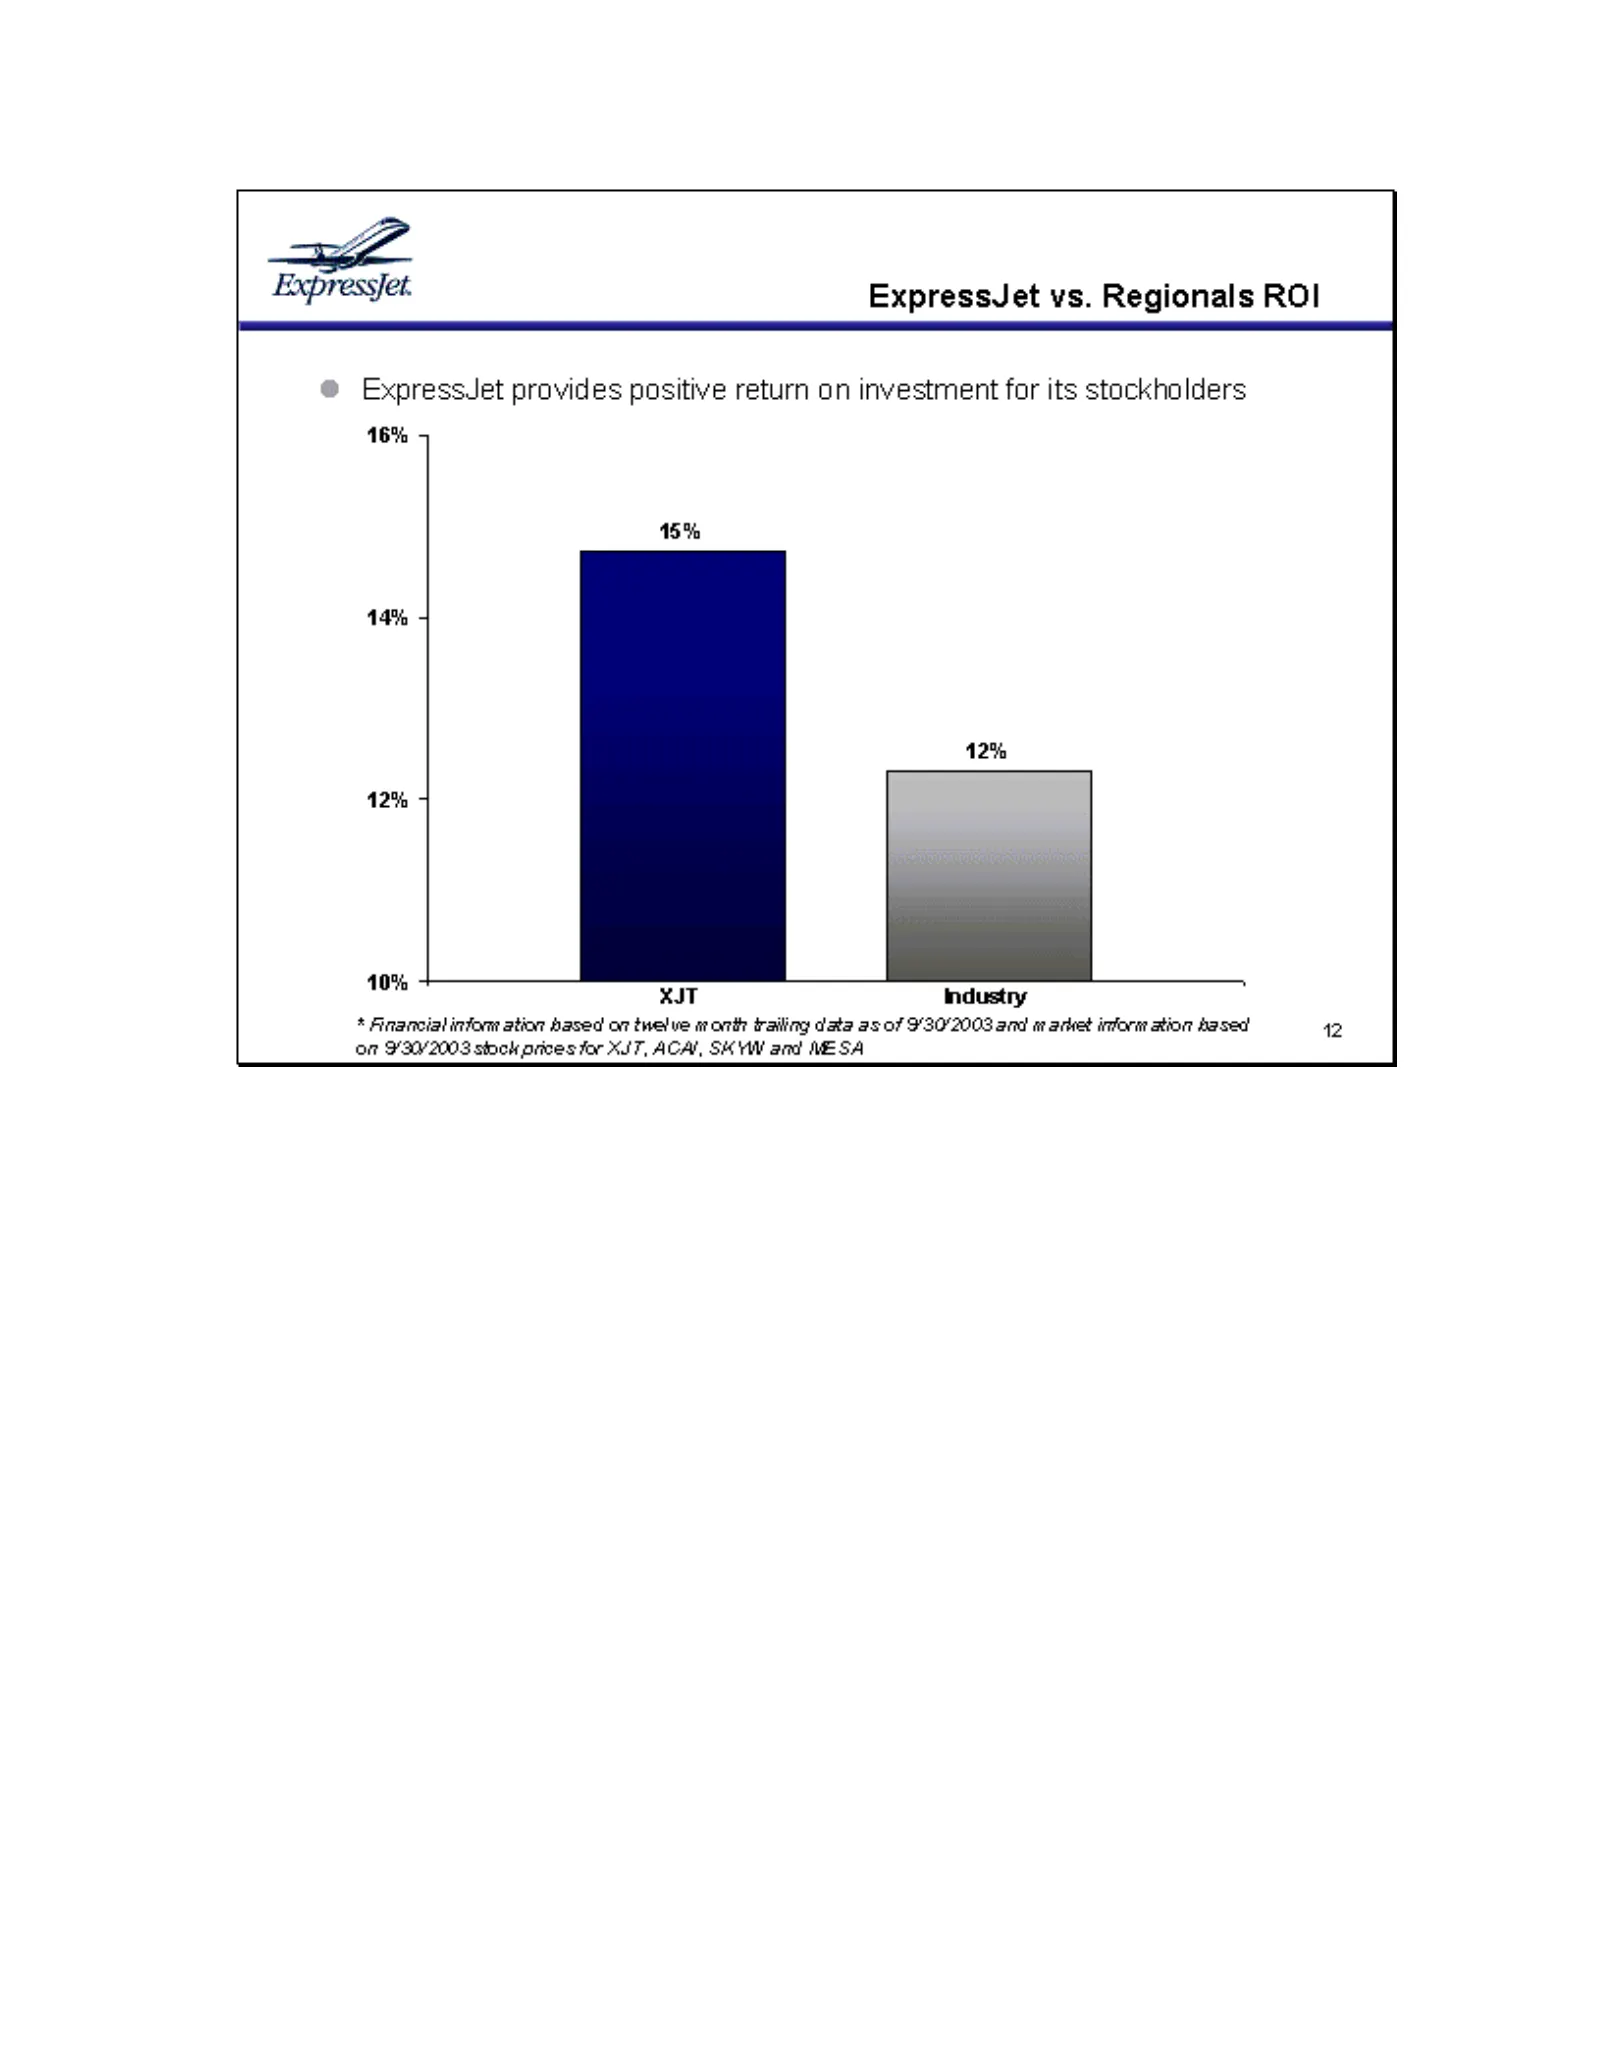
Slide 13: ExpressJet vs. Regionals ROI
Expressfet. ExpressJet vs. Regionals ROI @ ExpressJet provides positive return on investment for its stockholders 16% 5 15% 14% 4 12% 5 10% - XJT Industry * Financial infom ation based ov twelve mm orih trailing data as of 9302003 and mt arket inforat ation Aased 42 on 9'30/2003 stock prices for XJT
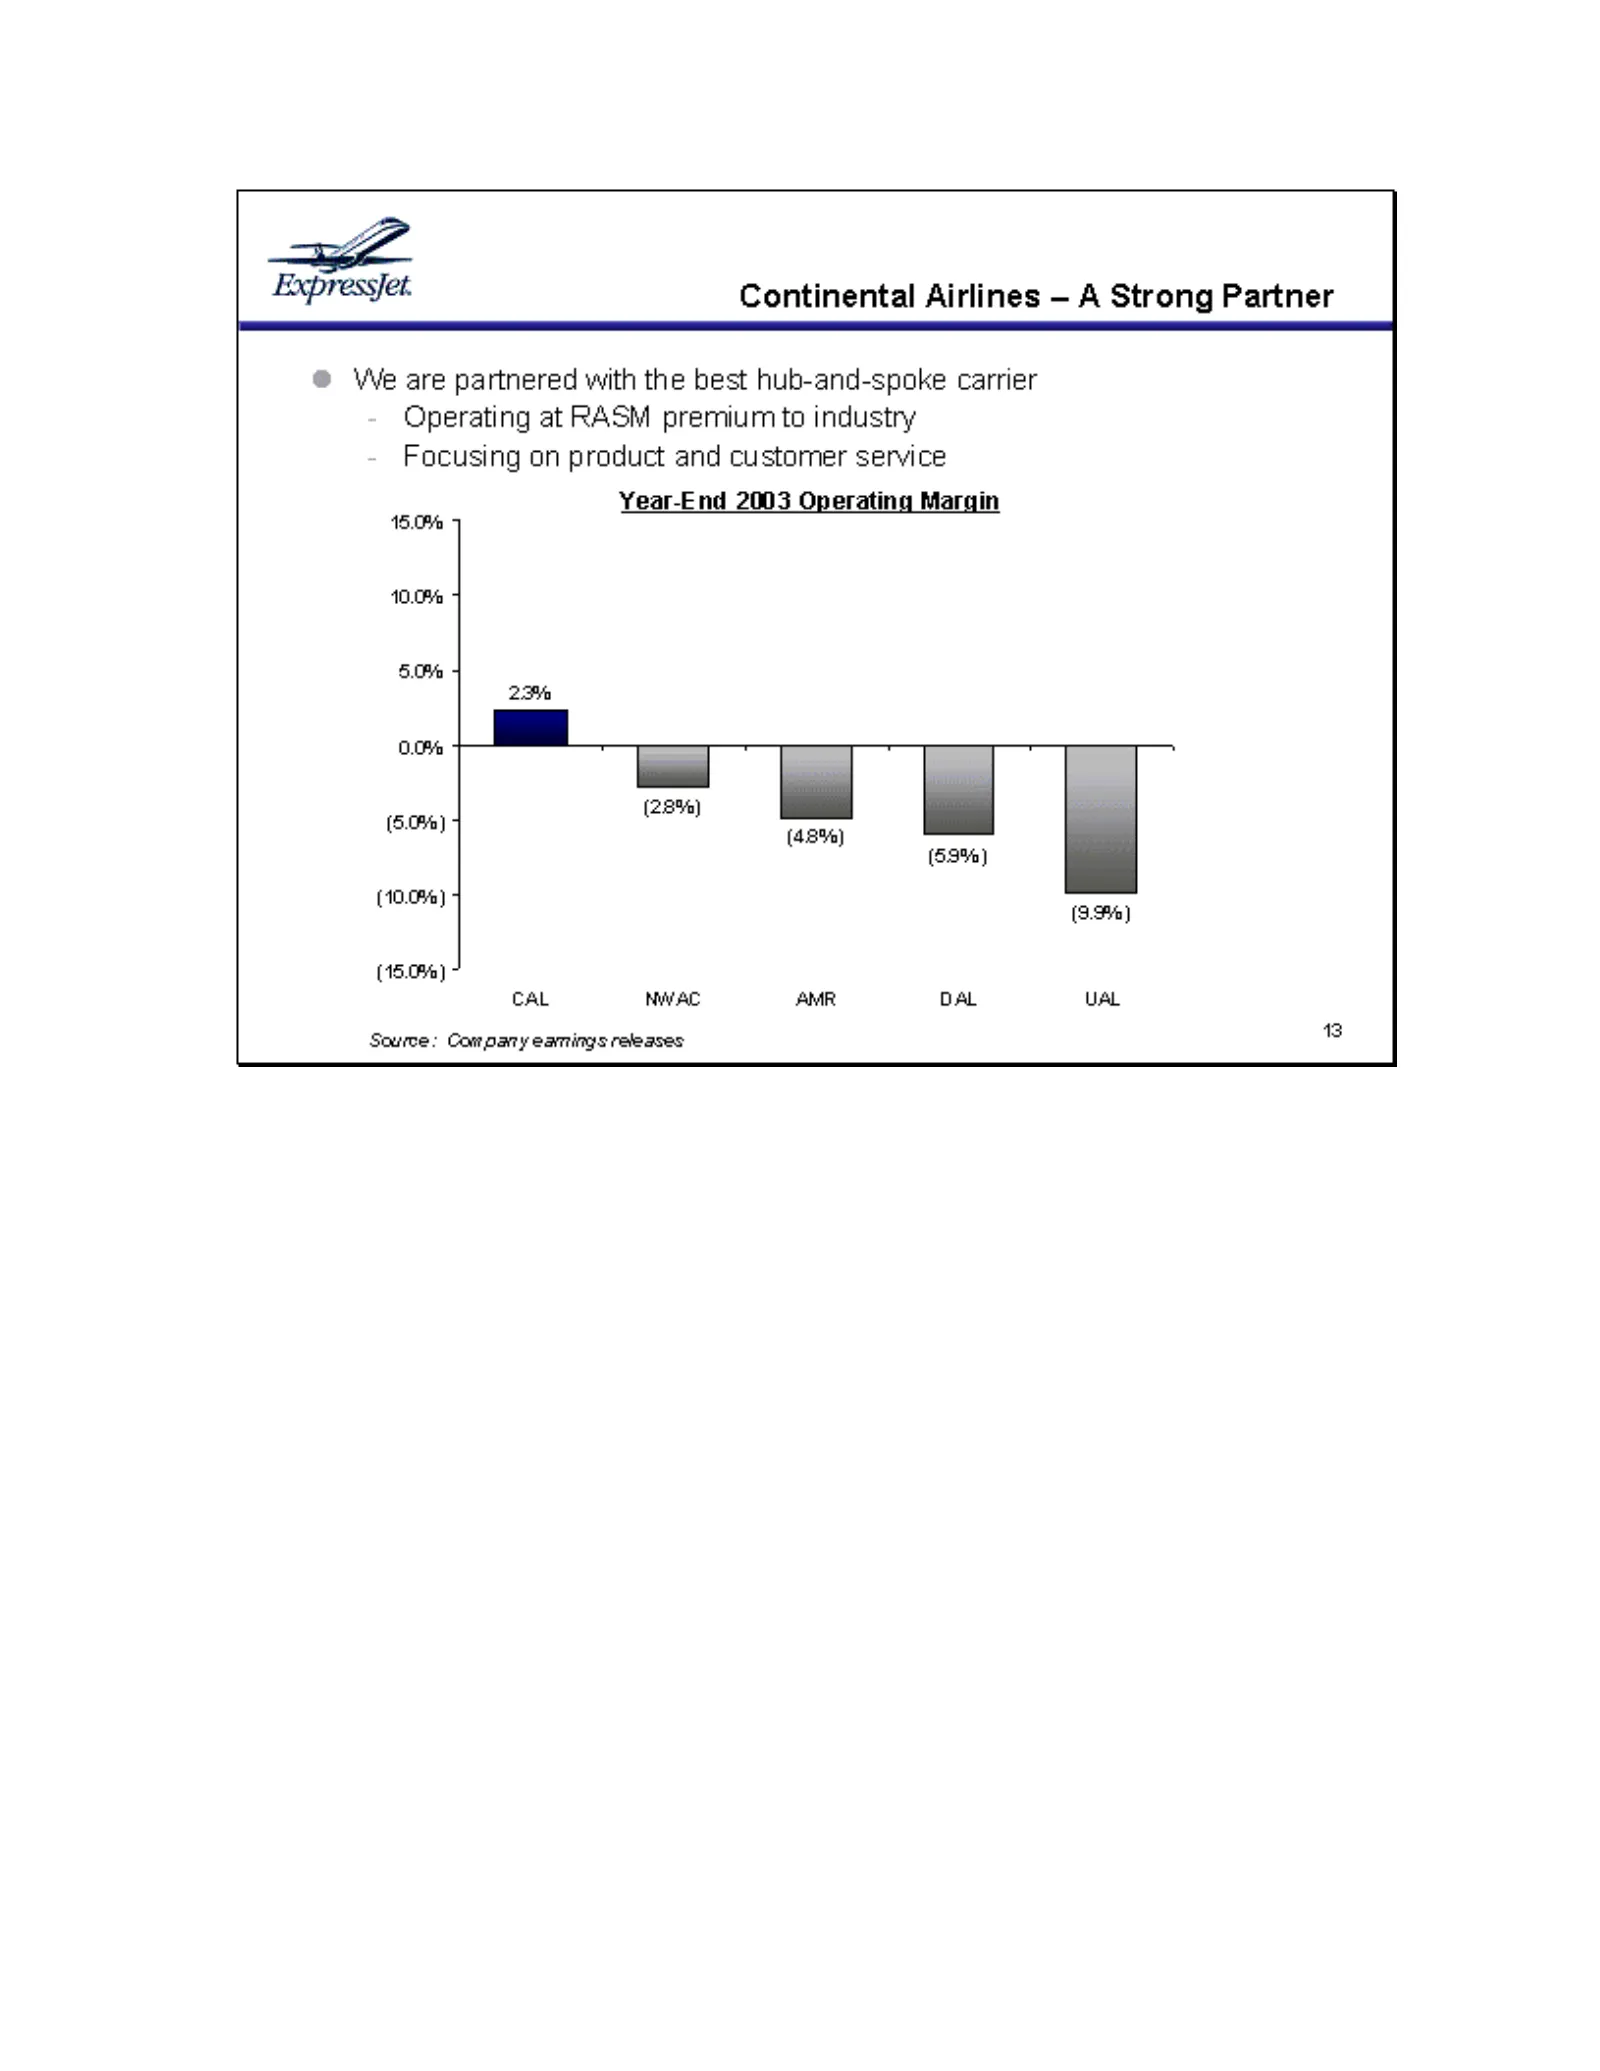
Slide 14: Continental Airlines — A Strong Partner
Expressfet. Continental Airlines — A Strong Partner ® We are partnered with the best hub-and-spoke carrier Operating at RASM premium to industry Focusing on product and customer service Year-End 2003 Operating Margin 15.0% 9 10.0% 4 5.0% 4 22% | scm) (28%) i Leal (6.0%) (48%) (53%) (10.0%) 7 (9%) (1
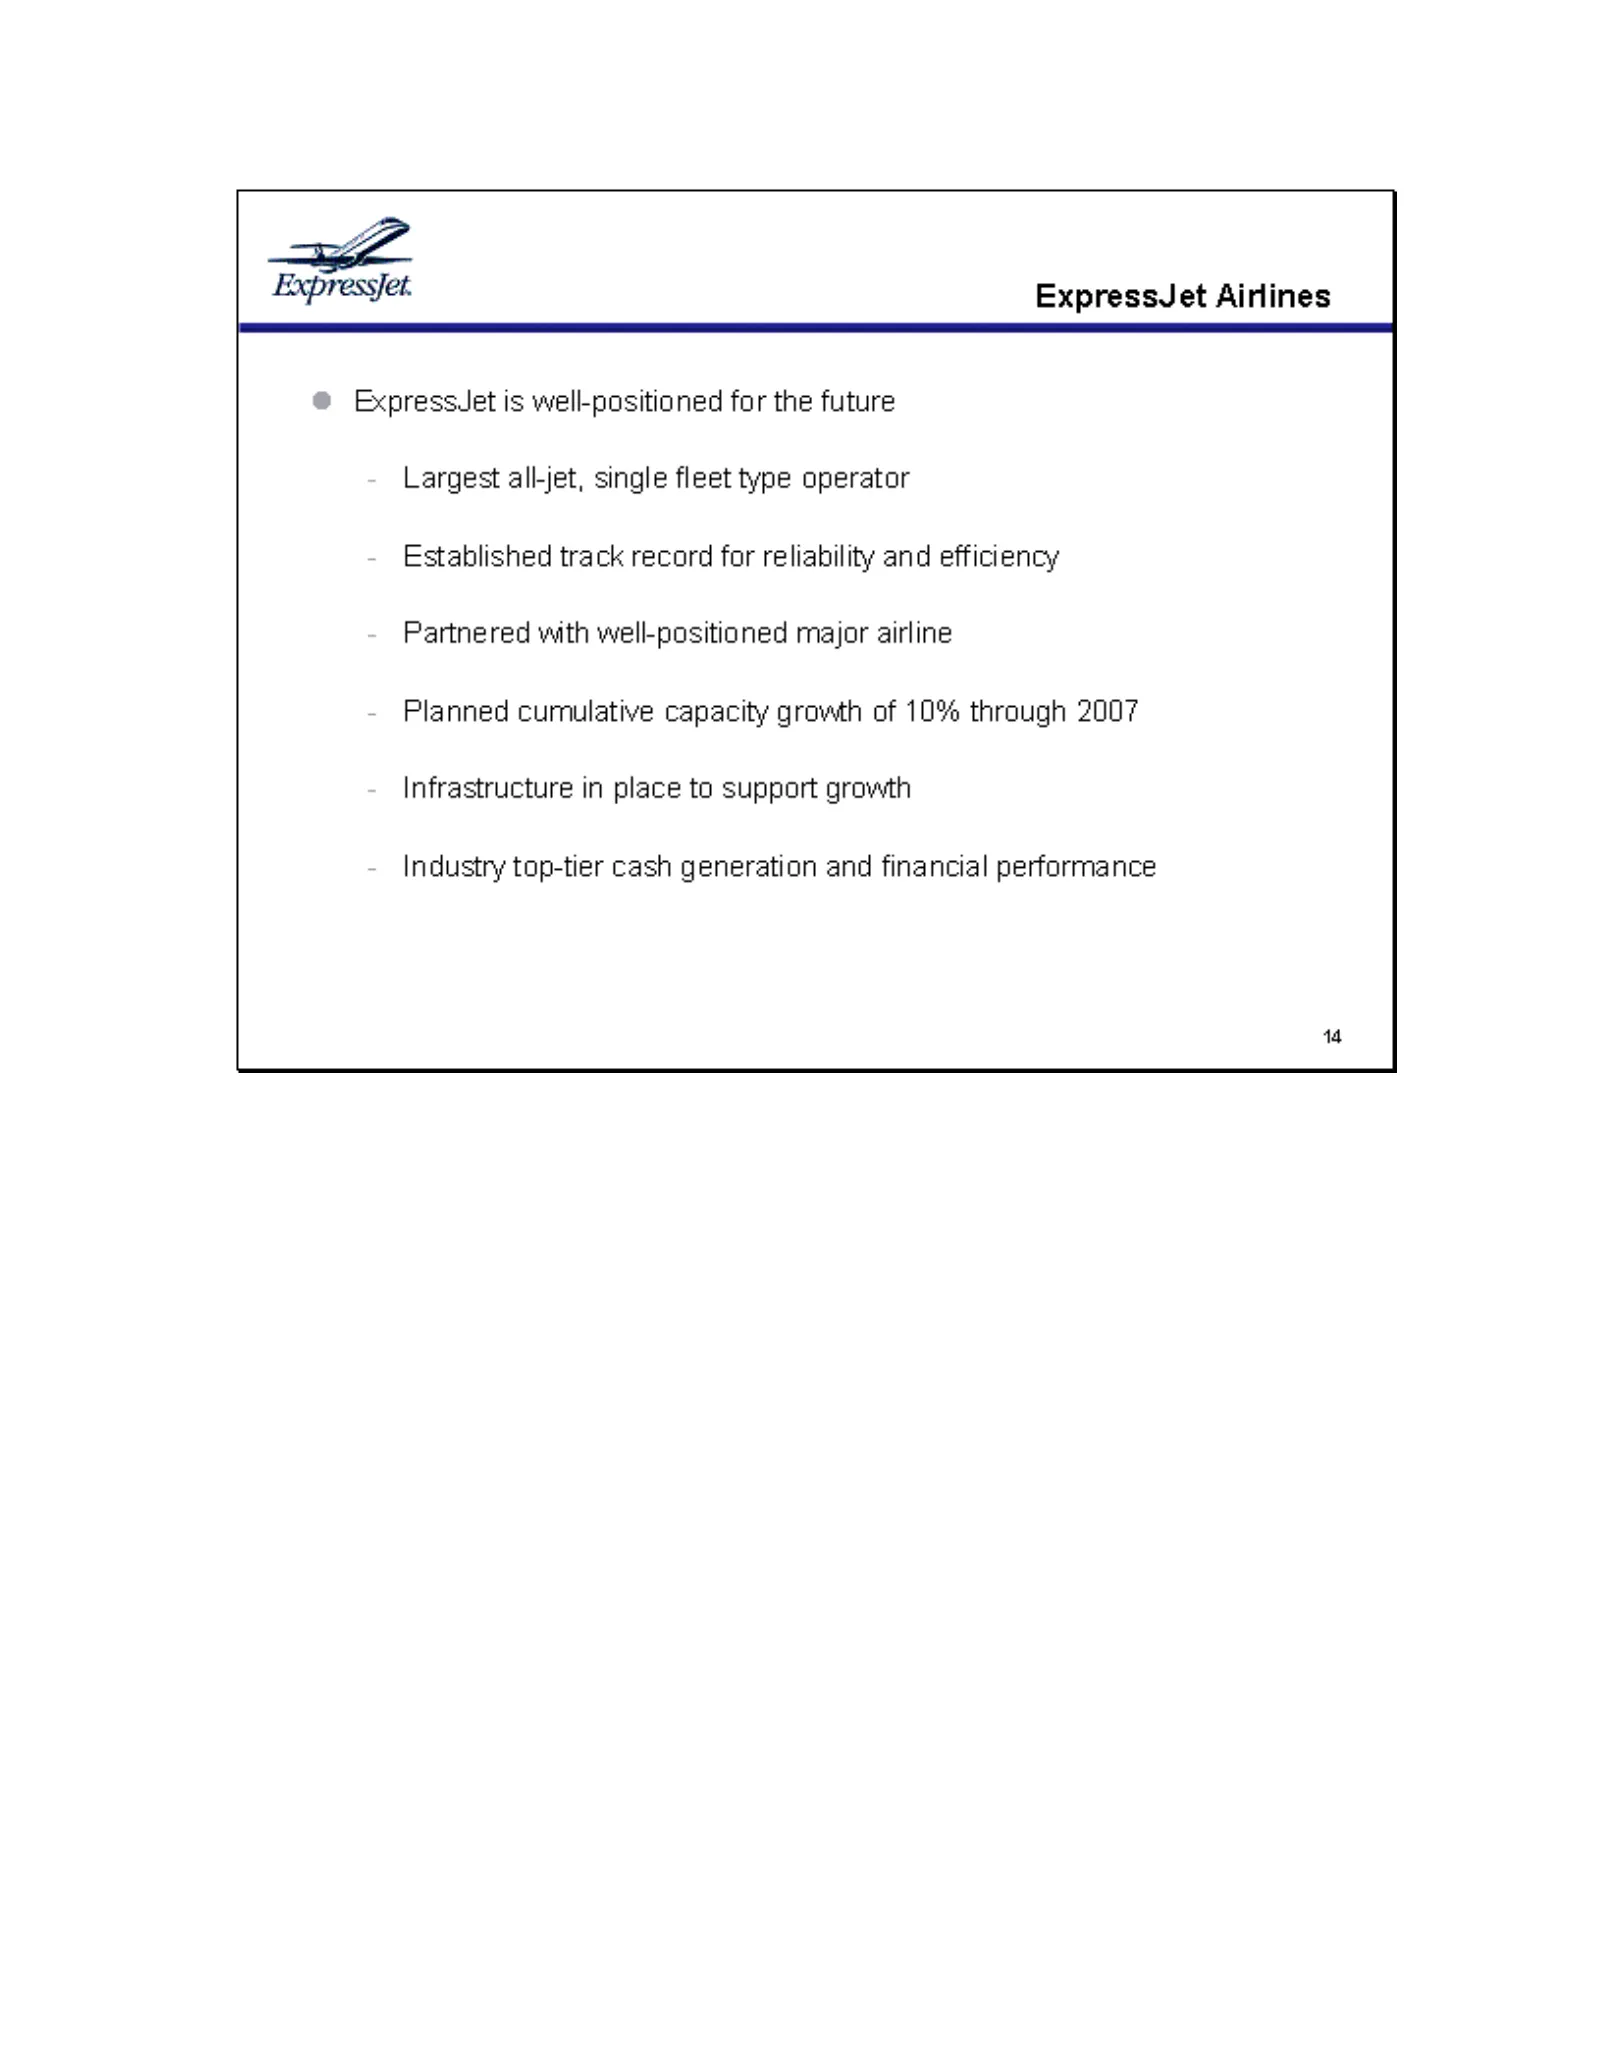
Slide 15: ExpressJet is well-positioned for the future
a Expressfet. ExpressJet Airlines ExpressJet is well-positioned for the future Largest all-jet, single fleet type operator Established track record for reliability and efficiency Partnered with well-positioned major airline Planned cumulative capacity growth of 10% through 2007 Infrastructure in pla
Source: SEC EDGAR · 8-K filed Feb 4, 2004
More decks from Expressjet Holdings Inc
 Investor Presentation (June 2010)13 slides · Jun 8, 2010
 Credit Suisse 2008 Global Airlines Conference12 slides · Dec 3, 2008
 Credit Suisse Conference February 200813 slides · Feb 27, 2008
 Raymond James Growth Airline Conference (February 2007)13 slides · Feb 1, 2007
 Smith Barney Citigroup 2004 Transportation Conference12 slides · Nov 9, 2004
 Merrill Lynch Global Transportation Conference 200412 slides · Jun 16, 2004