Southwest Bancorp — Investor Presentation (February 2011)
29 slides from Southwest Bancorp's investor presentation, Feb 3, 2011
Slide 1: Investor Presentation February 2011
Investor Presentation February 2011 (NASDAQ-OKSB)
Slide 2: Forward Looking Statements
Forward Looking Statements 1 Forward Looking Statements This presentation includes forward-looking statements such as: statements of Southwest's goals, intentions, and expectations; estimates of risks and of future costs and benefits; expectations regarding future financial performance of Southwest
Slide 3: Corporate Profile
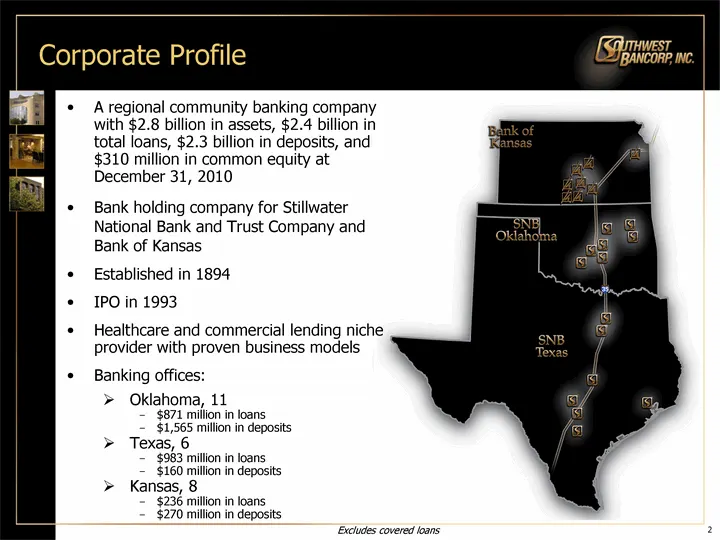
Corporate Profile 2 A regional community banking company with $2.8 billion in assets, $2.4 billion in total loans, $2.3 billion in deposits, and $310 million in common equity at December 31, 2010 Bank holding company for Stillwater National Bank and Trust Company and Bank of Kansas Established in 18
Slide 4: Pre-Provision/Pre-Tax Income
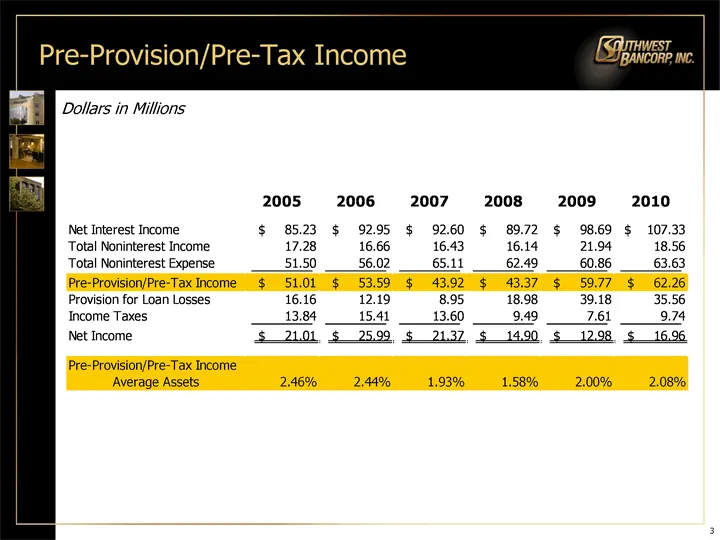
Pre-Provision/Pre-Tax Income Dollars in Millions 3
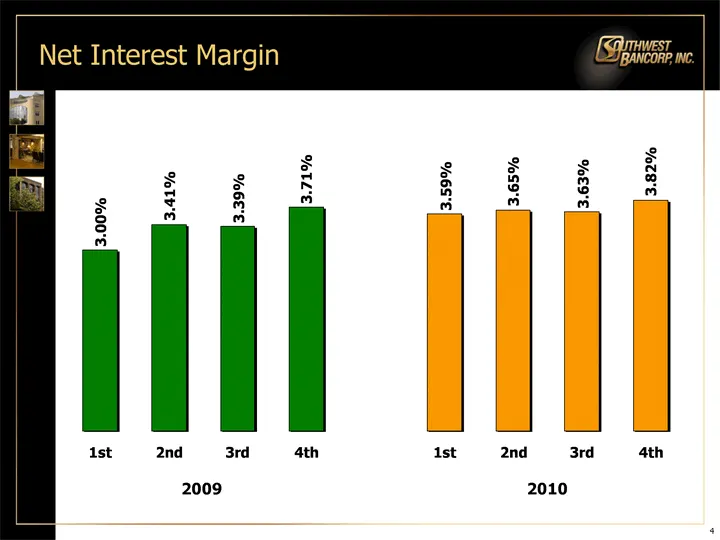
Slide 5: Net Interest Margin
Net Interest Margin 1st 2nd 3rd 4th 1st 2nd 3rd 4th SWBC 0.03 0.0341 0.0339 0.0371 0.0359 0.0365 0.0363 0.0382 2009 2010 4
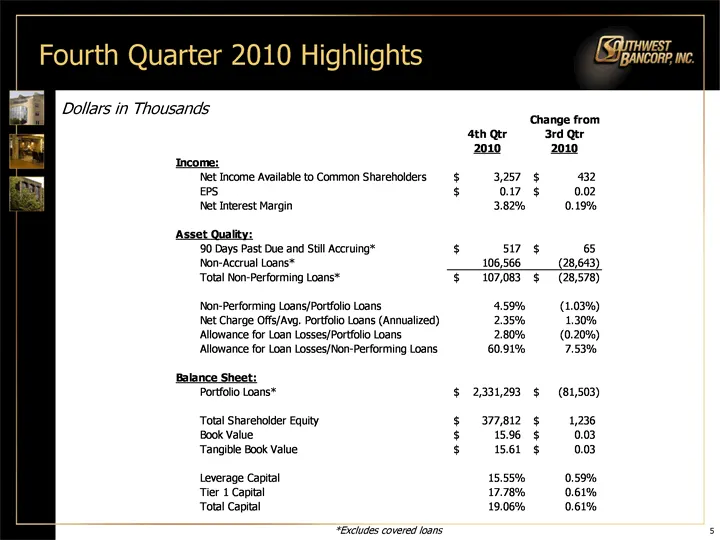
Slide 6: Fourth Quarter 2010 Highlights
5 Fourth Quarter 2010 Highlights Dollars in Thousands *Excludes covered loans
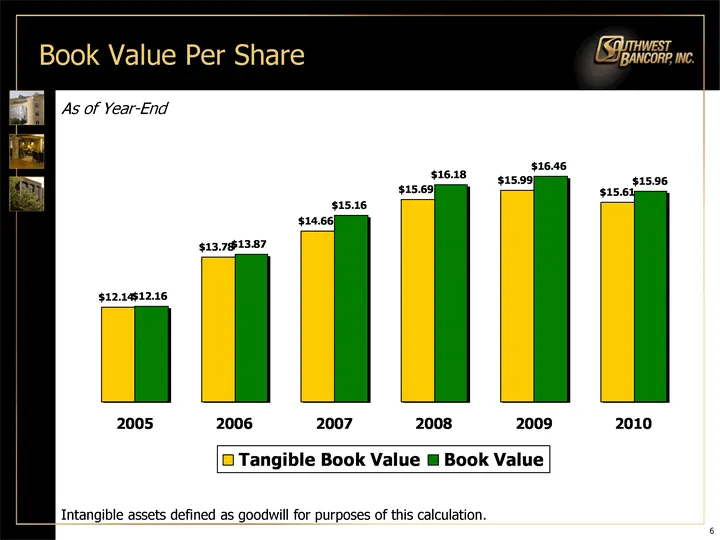
Slide 7: Book Value Per Share
6 Book Value Per Share 2005 2006 2007 2008 2009 2010 Tangible Book Value 12.14 13.78 14.66 15.69 15.99 15.61 Book Value 12.16 13.87 15.16 16.18 16.46 15.96 Intangible assets defined as goodwill for purposes of this calculation. As of Year-End
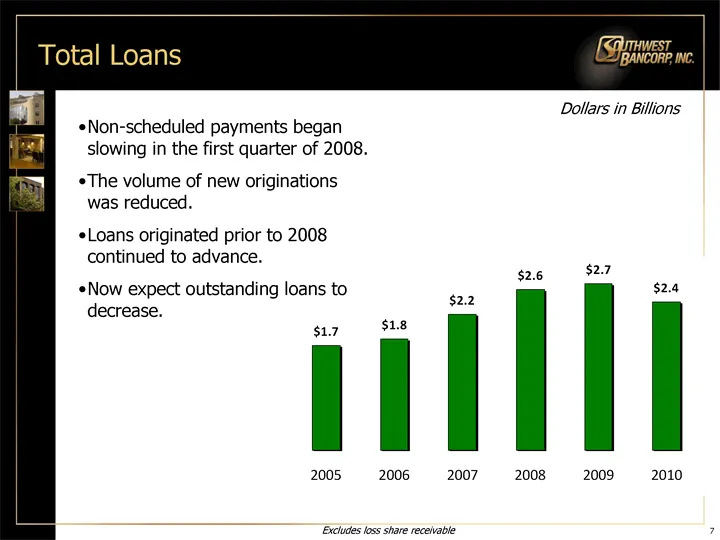
Slide 8: Total Loans
7 Total Loans Dollars in Billions Non-scheduled payments began slowing in the first quarter of 2008. The volume of new originations was reduced. Loans originated prior to 2008 continued to advance. Now expect outstanding loans to decrease. Excludes loss share receivable
Slide 9: Asset Quality Ratios
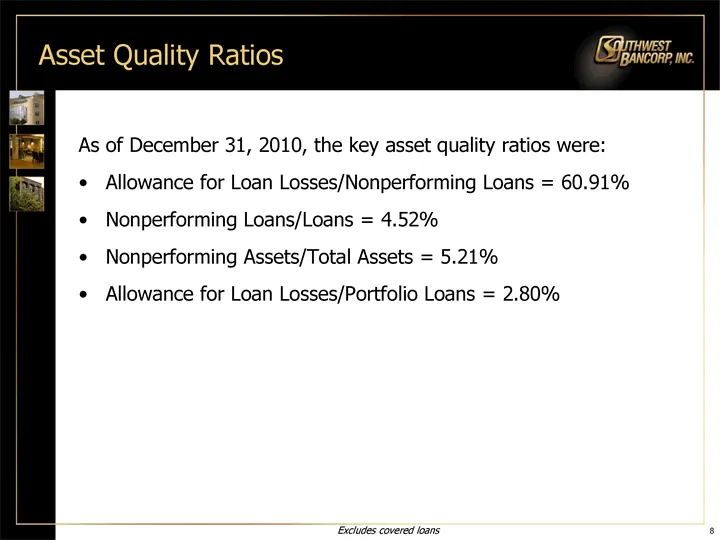
Asset Quality Ratios As of December 31, 2010, the key asset quality ratios were: Allowance for Loan Losses/Nonperforming Loans = 60.91% Nonperforming Loans/Loans = 4.52% Nonperforming Assets/Total Assets = 5.21% Allowance for Loan Losses/Portfolio Loans = 2.80% Excludes covered loans 8
Slide 10: Recap of Nonperforming Assets & Potential Nonperforming Loans
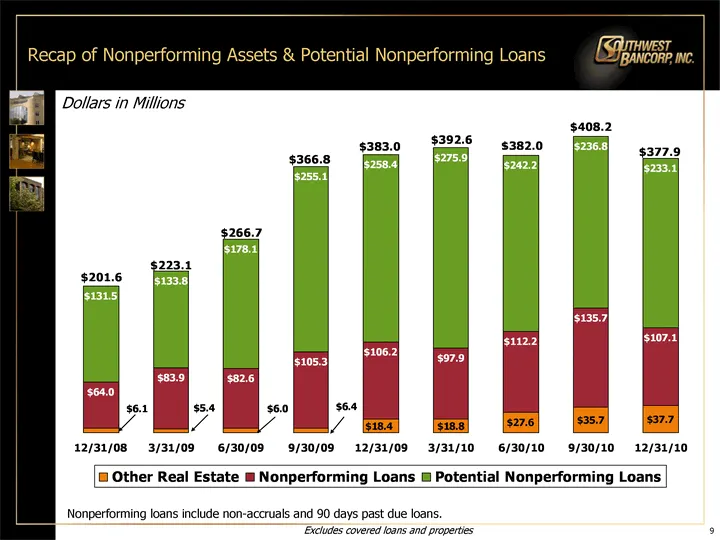
Recap of Nonperforming Assets & Potential Nonperforming Loans 12/31/08 3/31/2009 6/30/09 9/30/2009 12/31/09 3/31/2010 6/30/2010 9/30/2010 12/31/2010 Other Real Estate 6.1 5.4 6 6.4 18.4 18.809 27.634 35.723 37.7 Nonperforming Loans 64 83.9 82.6 105.3 106.2 97.9 112.2 135.7 107.1 Potential Nonperform
Slide 11: Total Nonperforming Assets
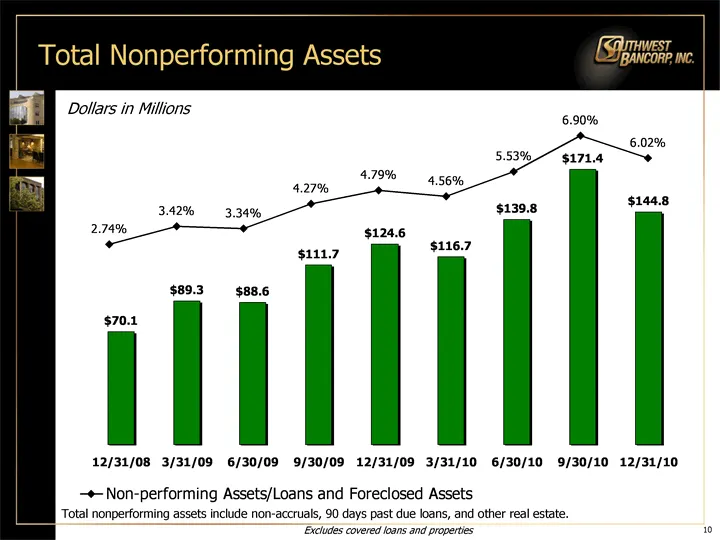
12/31/2008 3/31/2009 6/30/2009 9/30/2009 12/31/2009 3/31/2010 6/30/2010 9/30/2010 12/31/2010 East 70.1 89.3 88.6 111.7 124.6 116.671 139.838 171.384 144.8 12/31/2008 3/31/2009 6/30/2009 9/30/2009 12/31/2009 3/31/2010 6/30/2010 9/30/2010 12/31/2010 Non-performing Assets/Loans and Foreclosed Assets 0.
Slide 12: Nonperforming Loans
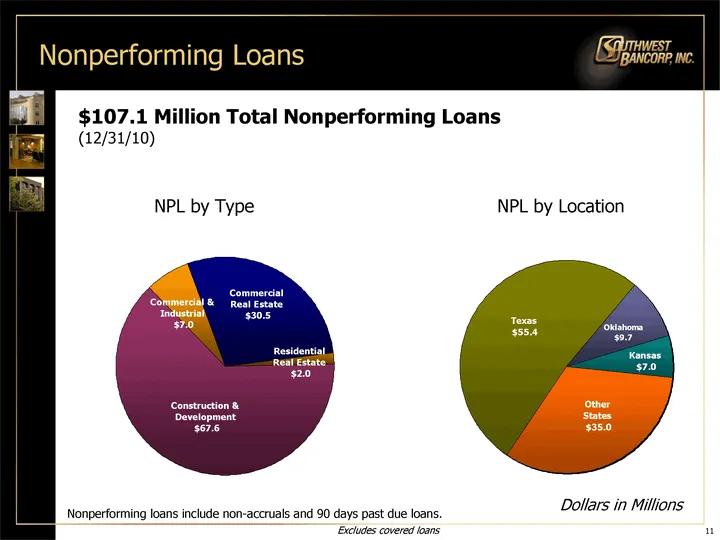
Nonperforming Loans Consumer Commercial Real Estate Residential Real Estate Construction & Development Student Loans Commercial & Industrial 0 30.5 2 67.6 0 7 NPL by Type NPL by Location $107.1 Million Total Nonperforming Loans (12/31/10) Dollars in Millions 11 Nonperforming loans include non-accrua
Slide 13: Other Real Estate
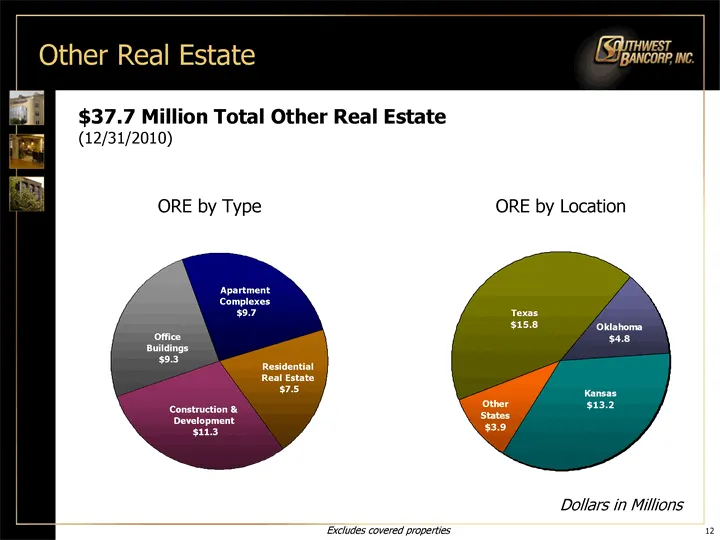
Other Real Estate Consumer Apartment Complexes Residential Real Estate Construction & Development Office Buildings Commercial & Industrial 0 9.7 7.5 11.2 9.3 0 ORE by Type ORE by Location $37.7 Million Total Other Real Estate (12/31/2010) Dollars in Millions 12 Excludes covered properties
Slide 14: Potential Problem Loans
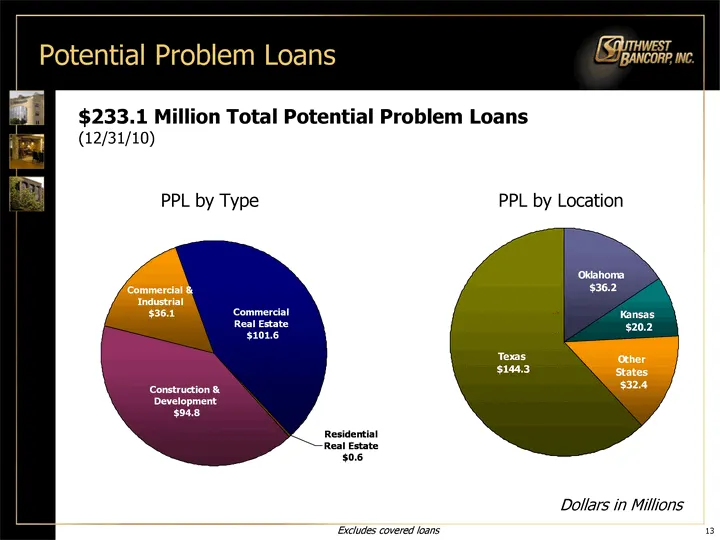
13 Potential Problem Loans $233.1 Million Total Potential Problem Loans (12/31/10) Consumer Commercial Real Estate Residential Real Estate Construction & Development Student Loans Commercial & Industrial 0.03 101.6 0.6 94.8 0 36.1 PPL by Type PPL by Location Dollars in Millions Excludes covered loan
Slide 15: Risk Trends
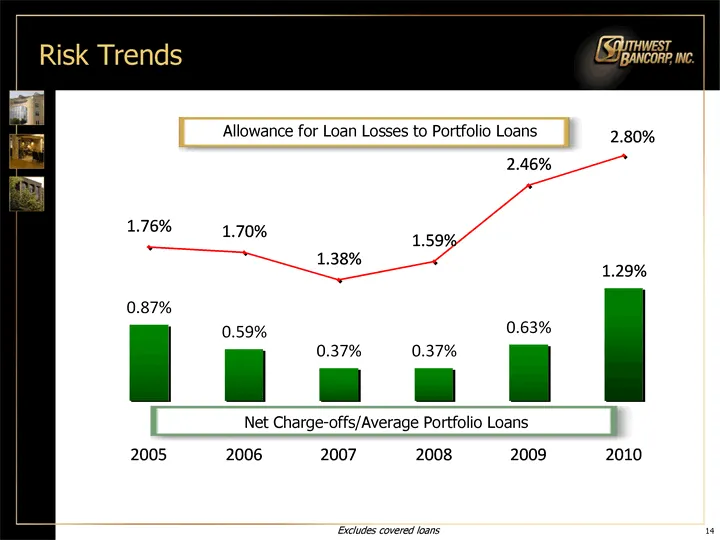
14 Risk Trends Allowance for Loan Losses to Portfolio Loans Net Charge-offs/Average Portfolio Loans Excludes covered loans
Slide 16: Allowance for Loan Losses & Nonperforming Loans
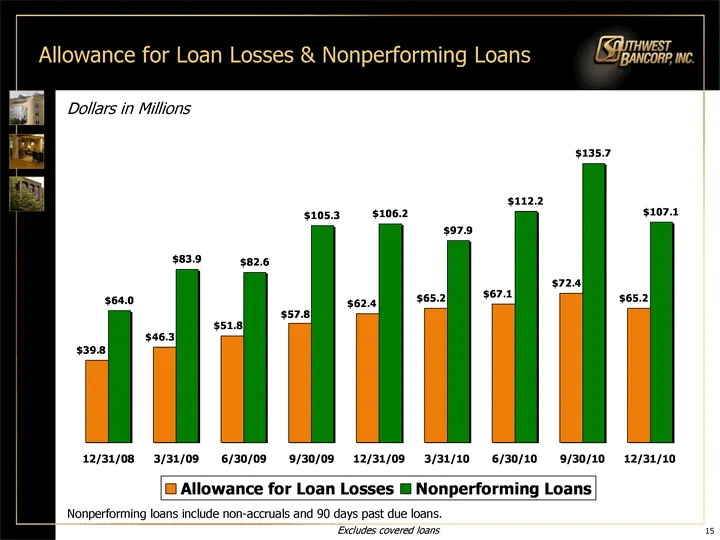
Allowance for Loan Losses & Nonperforming Loans 12/31/08 3/31/09 6/30/09 9/30/09 12/31/09 3/31/10 6/30/10 9/30/10 12/31/2010 Allowance for Loan Losses 39.773 46.262 51.753 57.777 62.413 65.168 67.055 72.418 65.2 Nonperforming Loans 63.983 83.935 82.614 105.294 106.197 97.9 112.2 135.7 107.1 Dollars
Slide 17: Provision for Loan Losses & Net Charge-offs
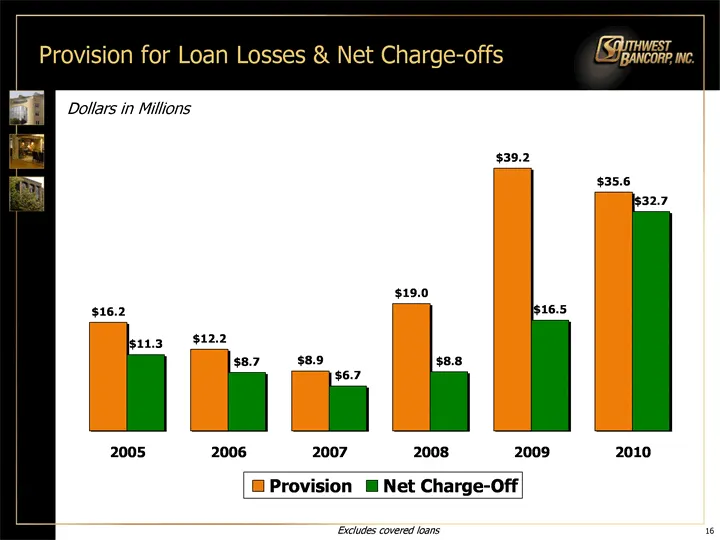
Provision for Loan Losses & Net Charge-offs 2005 2006 2007 2008 2009 2010 Provision 16.155 12.187 8.947 18.979 39.176 35.6 Net Charge-Off 11.334 8.706 6.656 8.79 16.536 32.7 Dollars in Millions Excludes covered loans 16
Slide 18: Net Charge-Offs by Type
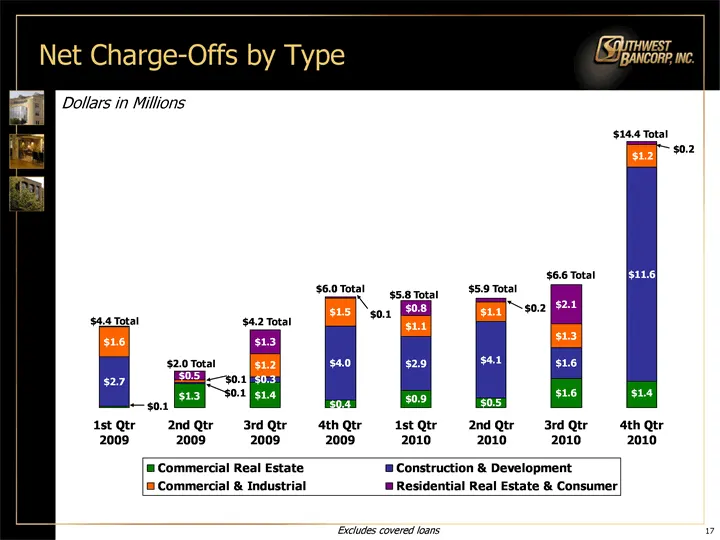
Net Charge-Offs by Type Dollars in Millions 17 Excludes covered loans 1st Qtr 2009 2nd Qtr 2009 3rd Qtr 2009 4th Qtr 2009 1st Qtr 2010 2nd Qtr 2010 3rd Qtr 2010 4th Qtr 2010 Commercial Real Estate 0.1 1.305 1.394 0.416 0.92 0.515 1.581 1.4 Construction & Development 2.672 0.068 0.269 4 2.919 4.126 1
Slide 19: Loan Segmentation
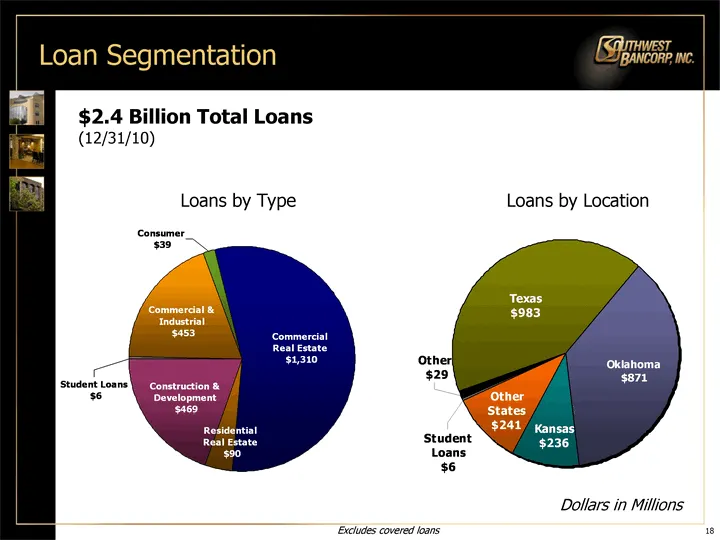
18 Loan Segmentation $2.4 Billion Total Loans (12/31/10) Consumer Commercial Real Estate Residential Real Estate Construction & Development Student Loans Commercial & Industrial 39.1 1310 89.8 468.7 5.8 452.6 Loans by Type Loans by Location Dollars in Millions Excludes covered loans
Slide 20: Commercial Real Estate Loans
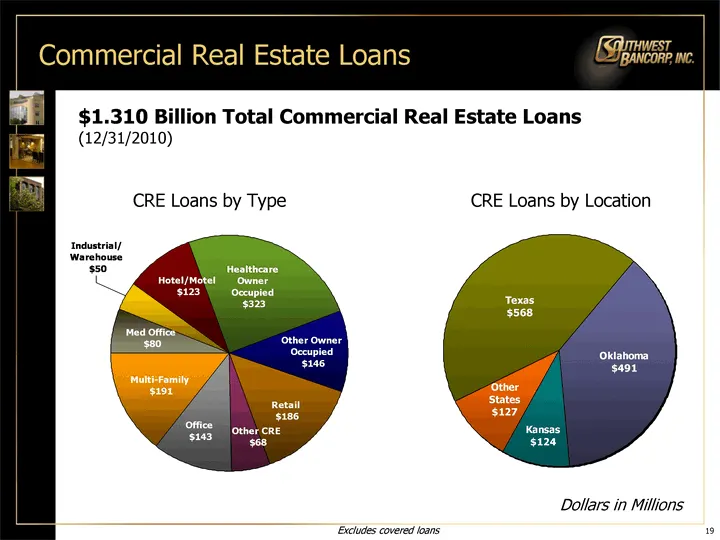
19 Commercial Real Estate Loans $1.310 Billion Total Commercial Real Estate Loans (12/31/2010) Healthcare Owner Occupied Other Owner Occupied Retail Other CRE Office Multi-Family Med Office Ind/Warehouse Hotel/Motel 323 146 186 68 143 191 80 50 123 CRE Loans by Type CRE Loans by Location Dollars in
Slide 21: Construction Loans
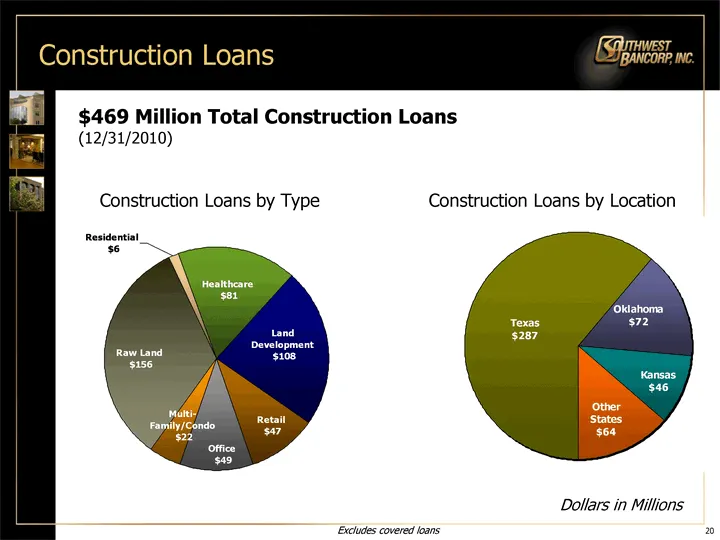
20 Construction Loans $469 Million Total Construction Loans (12/31/2010) Healthcare Land Development Retail Other Office Multi-Family/Condo Raw Land Warehouse Hotel/Motel Residential 81 108 47 0 49 22 156 0.154 0 6 Construction Loans by Type Construction Loans by Location Dollars in Millions Exclude
Slide 22: Commercial Loans
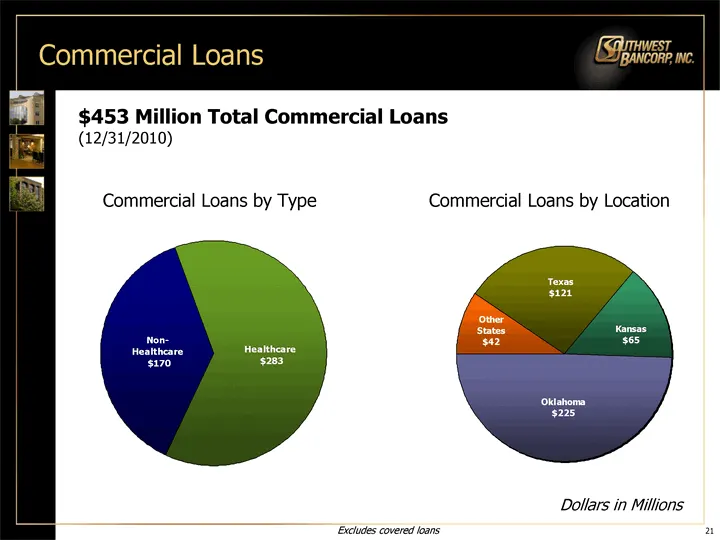
21 Commercial Loans $453 Million Total Commercial Loans (12/31/2010) Healthcare Non-Healthcare 283 170 Commercial Loans by Type Commercial Loans by Location Dollars in Millions Excludes covered loans
Slide 23: Residential Real Estate Loans
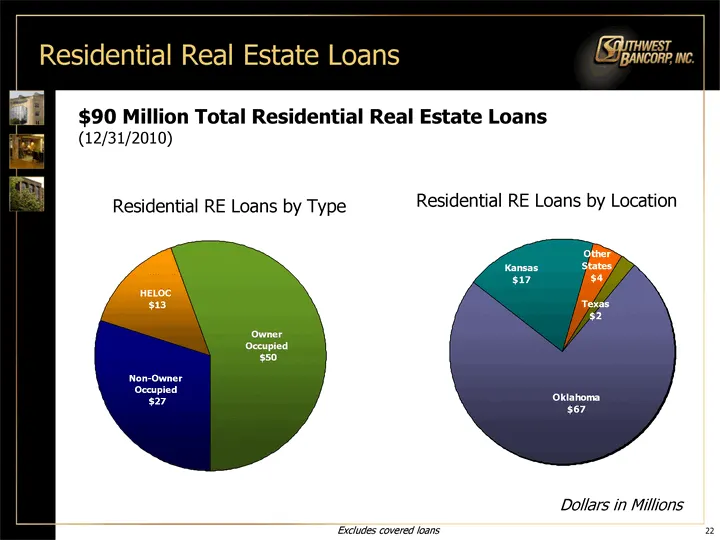
22 Residential Real Estate Loans $90 Million Total Residential Real Estate Loans (12/31/2010) Residential RE Loans by Location Dollars in Millions Owner Occupied Non-Owner Occupied HELOC 50 27 13 Residential RE Loans by Type Excludes covered loans
Slide 24: Other Loans
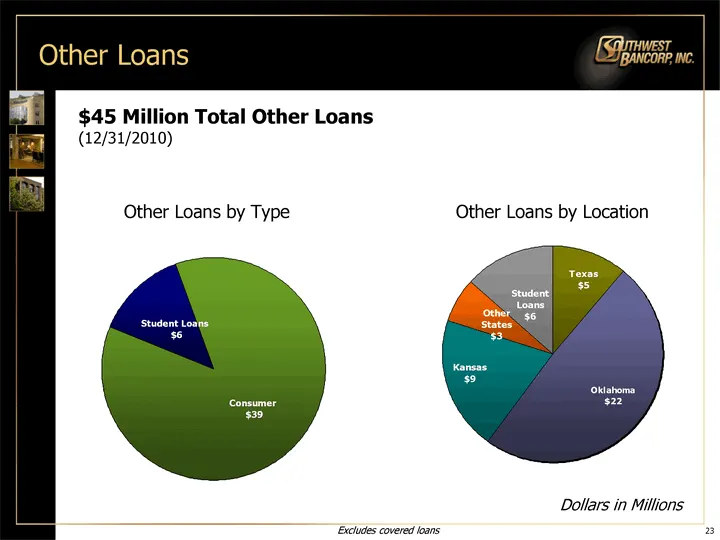
23 Other Loans $45 Million Total Other Loans (12/31/2010) Other Loans by Location Dollars in Millions Consumer Student Loans 39 6 Other Loans by Type Excludes covered loans
Slide 25: Other State Loans
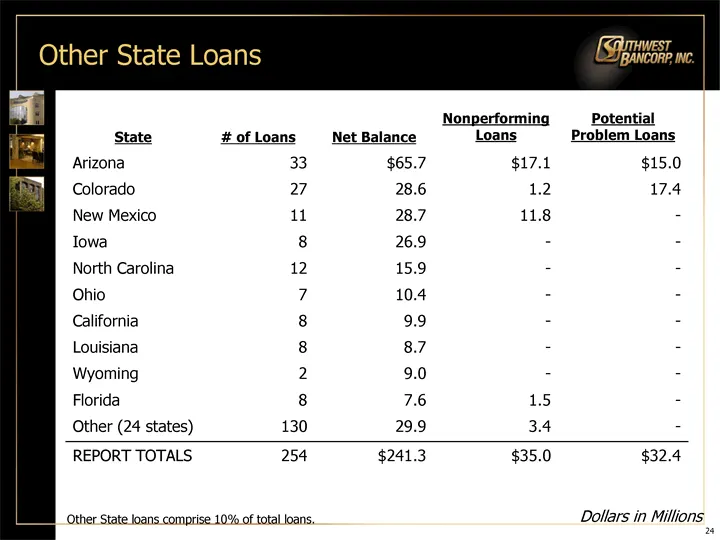
Other State Loans State # of Loans Net Balance Nonperforming Loans Potential Problem Loans Arizona 33 $65.7 $17.1 $15.0 Colorado 27 28.6 1.2 17.4 New Mexico 11 28.7 11.8 - Iowa 8 26.9 - - North Carolina 12 15.9 - - Ohio 7 10.4 - - California 8 9.9 - - Louisiana 8 8.7 - - Wyoming 2 9.0 - - Florida 8
Slide 26: Deposits
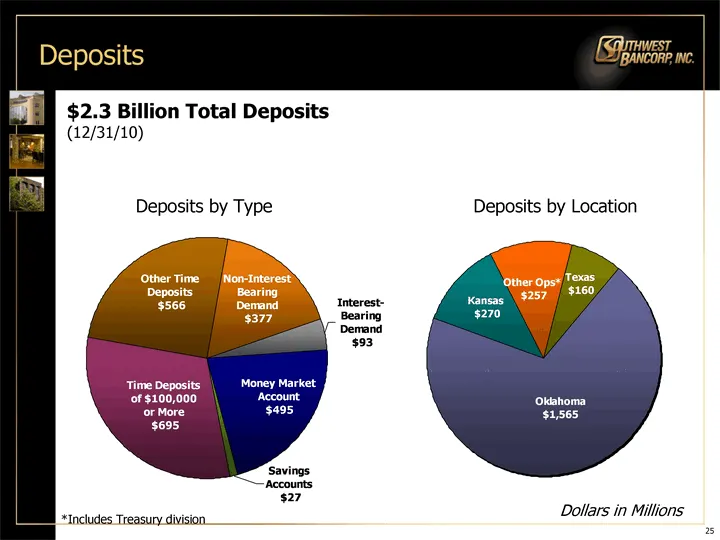
Deposits 25 $2.3 Billion Total Deposits (12/31/10) Other Time Deposits Non-Interest Bearing Demand Interest-Bearing Demand Money Market Account Savings Accounts Time Deposits of $100,000 or More 566 377 93 495 27 695 Deposits by Type Deposits by Location *Includes Treasury division Dollars in Millio
Slide 27: Net Income
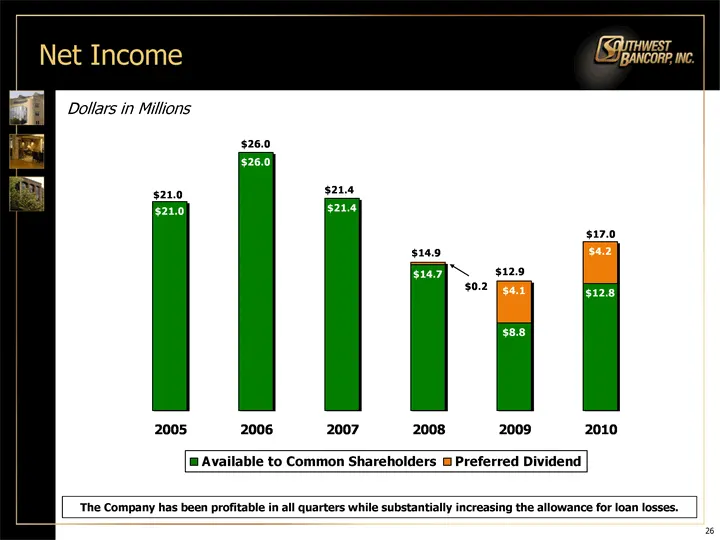
Net Income 2005 2006 2007 2008 2009 2010 Available to Common Shareholders 21.014 25.997 21.378 14.658 8.837 12.8 Preferred Dividend 0 0 0 0.243 4.145 4.2 Dollars in Millions The Company has been profitable in all quarters while substantially increasing the allowance for loan losses. 26
Slide 28: Southwest's Regulatory Capital
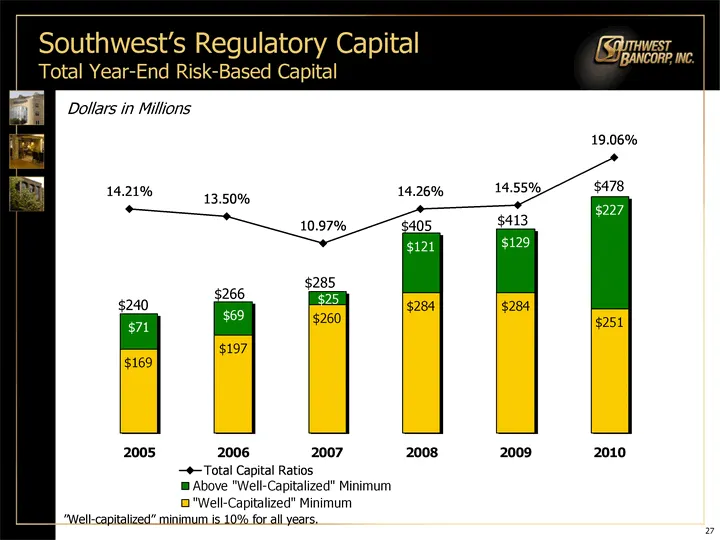
2005 2006 2007 2008 2009 2010 "Well-Capitalized" Minimum 169 197 260 284 284 251 Above "Well-Capitalized" Minimum 71 69 25 121 129 227 2005 2006 2007 2008 2009 2010 Total Capital Ratios 0.1421 0.135 0.1097 0.1426 0.1455 0.1906 Southwest's Regulatory Capital Total Year-End Risk-Based Capital 27 $240
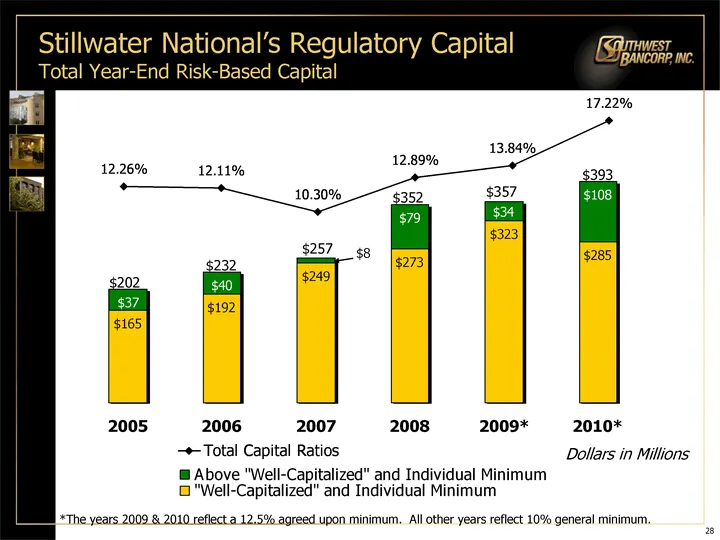
Slide 29: Stillwater National's Regulatory Capital
2005 2006 2007 2008 2009* 2010* "Well-Capitalized" and Individual Minimum 165 192 249 273 323 285 Above "Well-Capitalized" and Individual Minimum 37 40 8 79 34 108 2005 2006 2007 2008 2009 2010 Total Capital Ratios 0.1226 0.1211 0.103 0.1289 0.1384 0.1722 Stillwater National's Regulatory Capital Tot
Source: SEC EDGAR · 8-K filed Feb 3, 2011
More decks from Southwest Bancorp Inc
 Merger or Acquisition (September 2017)41 slides · Sep 5, 2017
 Q2 2017 Earnings Presentation31 slides · Jul 25, 2017
 Merger or Acquisition (May 2017)43 slides · May 15, 2017
 Q1 2017 Earnings Presentation31 slides · Apr 25, 2017
 Merger or Acquisition (February 2017)45 slides · Feb 8, 2017
 Q4 2016 Earnings Presentation32 slides · Jan 24, 2017