Plains Exploration & Production Company
Plains Exploration & Production — Barclays Energy-Power Conference 2010
30 slides from Plains Exploration & Production's conference presentation, Sep 16, 2010

Slide 1: Barclays Energy-Power Conference
Barclays Energy-Power Conference September 2010 Exhibit 99.1
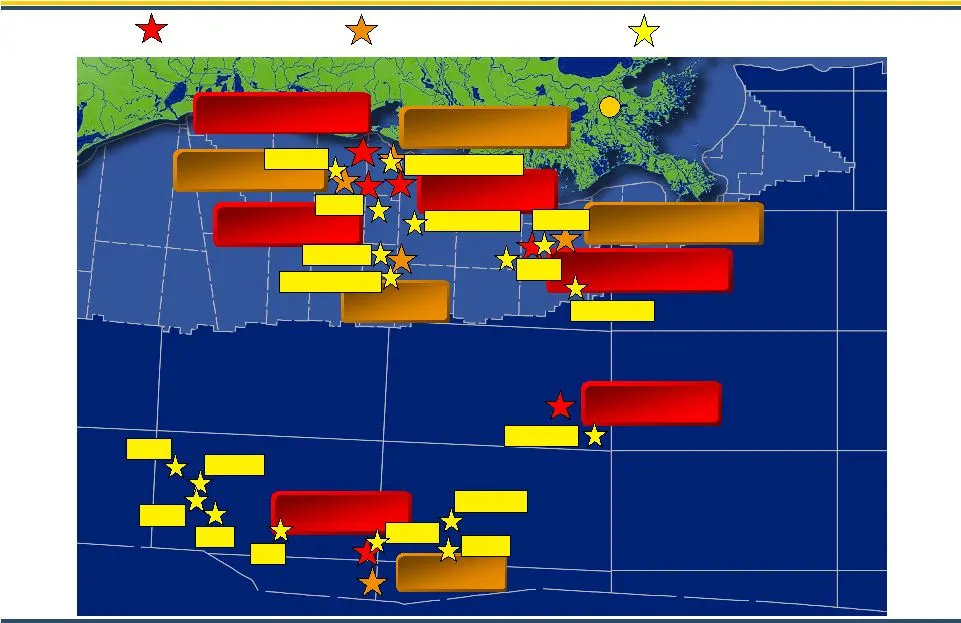
Slide 2: Gulf of Mexico Discoveries, Current Operations and Prospects
New Orleans Davy Jones Flatrock Field Blueberry Hill Blackbeard West Friesian Lucius John Paul Jones Phobos Davy Jones 2 Blackbeard East Lafitte Gulf of Mexico Discoveries, Current Operations and Prospects Discoveries 2010-2012 Drilling Prospects Calico Jack Drake Barataria Flying Dutchman Hook Bonn

Slide 3: Gulf of Mexico Divestiture
Gulf of Mexico Divestiture • Distributed overview materials and confidentiality agreements to select group of companies • Data room process underway • Offers due late October to mid November • Effective date September 1, 2010 • PXP will work very closely with successful bidders in order to close by
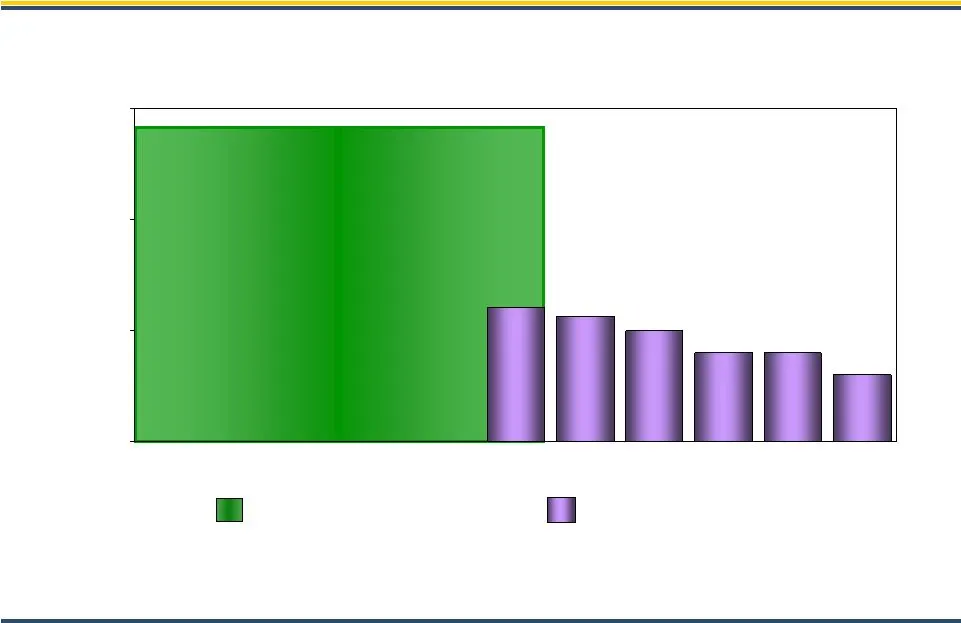
Slide 4: Strong Liquidity With No Near Term Debt Maturities
$1.4B (1) Available Liquidity $400 $600 $400 $500 $300 $565 $0 $500 $1,000 $1,500 Strong Liquidity With No Near Term Debt Maturities Revolver Availability Senior Notes Millions (1) As of August 3, 2010 upon closing of Amended and Restated Revolving Credit Facility.
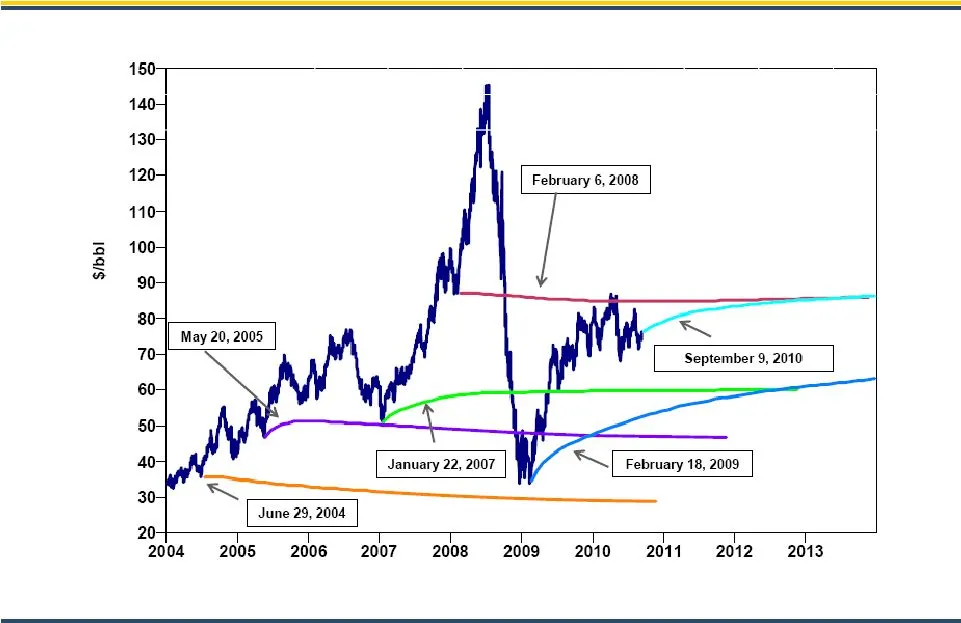
Slide 5: WTI NYMEX Historical Prices and Forward Curves
WTI NYMEX Historical Prices and Forward Curves ($/bbl) Source: Goldman Sachs, NYMEX

Slide 6: PXP Today
PXP Today • $5.6 billion enterprise value (1) • 360 MMBOE proved reserves YE 2009 • 85.1 MBOE per day production for 1H 2010 • +1.4 billion BOE resource potential (2) • 140.1 million shares outstanding (3) • 45% net debt-to-total capitalization (3) (1) Reflects stock price and total debt as of June
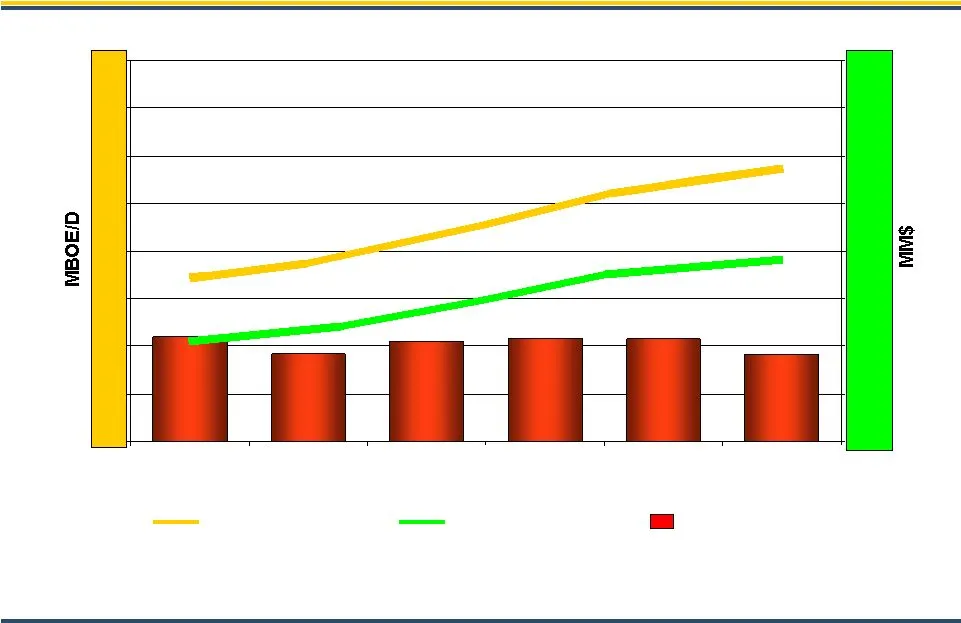
Slide 7: Operational Plan
$1040 MM $920 MM $1077 MM $1093 MM $1078 MM $904 MM Operational Plan $0 $500 $1,000 $1,500 $2,000 $2,500 $3,000 $3,500 $4,000 PXP Net Production PXP Net Cash Flow (1) Capital - After Divest Cash Flow - After Divest Production - After Divest (1) Net revenue minus net expenses. Assumes Strip pricing i
Slide 8: Proved Reserves Target Growth
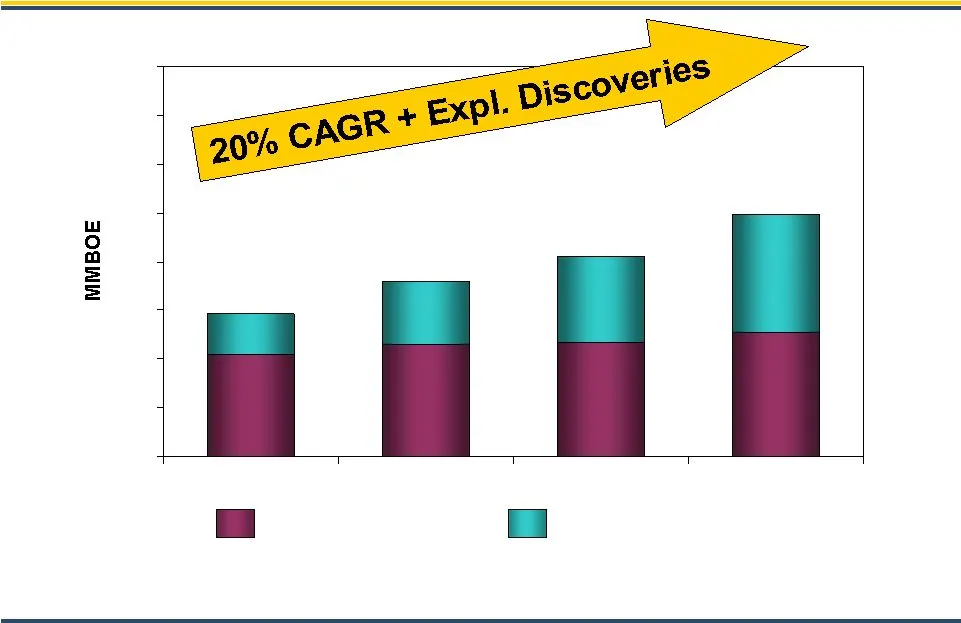
209 230 234 253 83 130 178 245 72% 64% 51% 57% Proved Developed Proved Undeveloped Proved Reserves Target Growth (1) 72% 64% 51% (1) Illustrates estimated reserves using NYMEX pricing. 57% (1)
Slide 9: Capex Profile
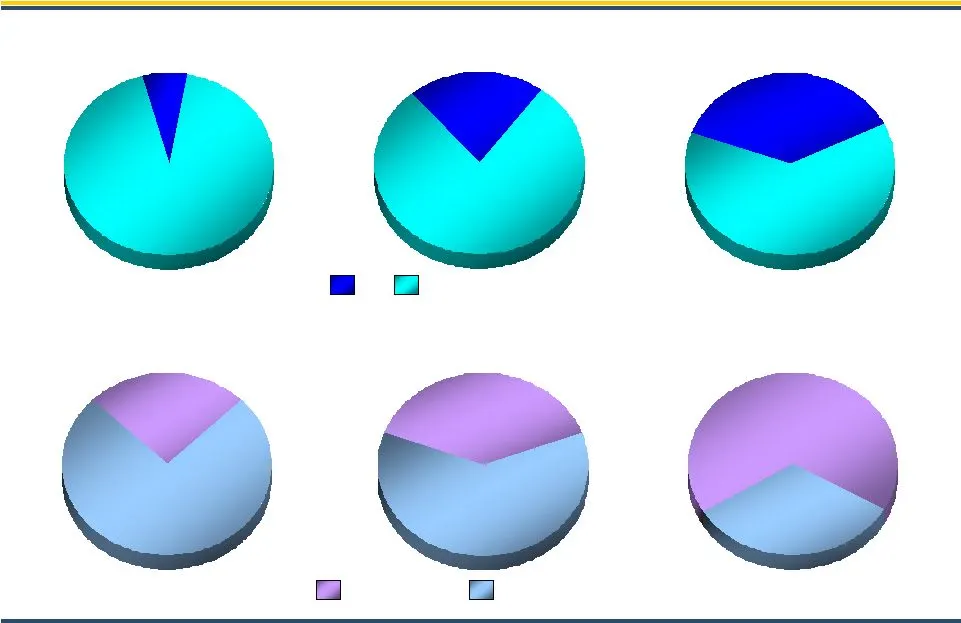
21% 37% 7% Capex Profile Oil vs. Gas Operated vs. Non-Operated 79% Oil Gas + Exploration 75% 25% 39% 61% Operated Non-Operated 33% 67% 63% 93%
Slide 10: Capital Allocation
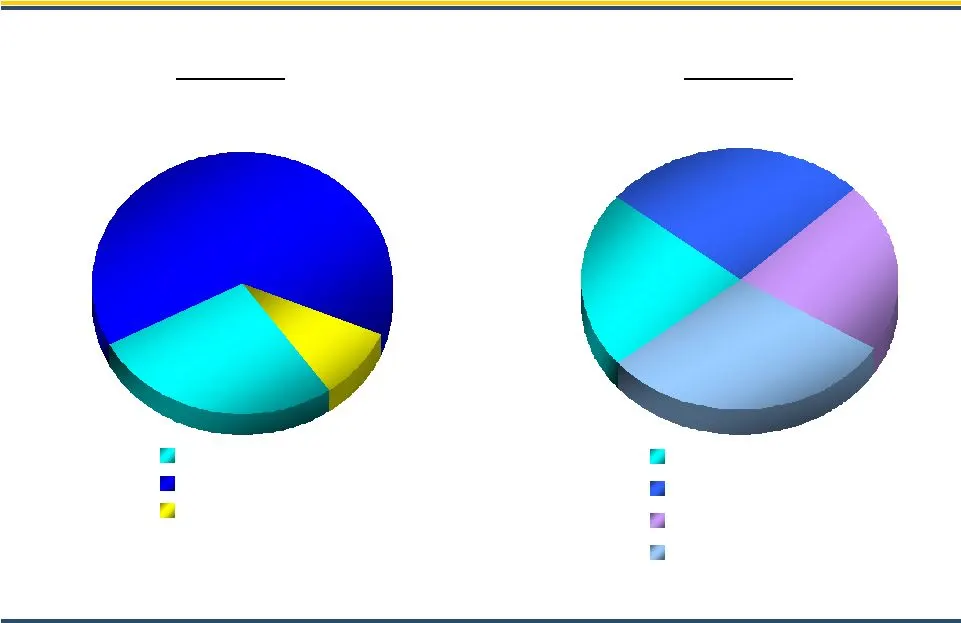
27% 64% Capital Allocation 2010E $1.1 billion 2011E Targeting $1 billion 22% 21% 30% Haynesville California Granite Wash Other Capital Capital Program 27% 9% Haynesville Development Exploration (1) Includes development, exploitation, real estate, capitalized interest and G&A costs but does not inclu

Slide 11: Operational Strategy
Operational Strategy Focused Oil Growth Strategy • Operate substantially all oil assets • Maintain total company liquids volumes between 50% and 60% of total production • Hedging strategy protects high oil margins that preserve excellent returns Targeted High Liquids/Natural Gas Strategy • Granite W

Slide 12: Oil Assets
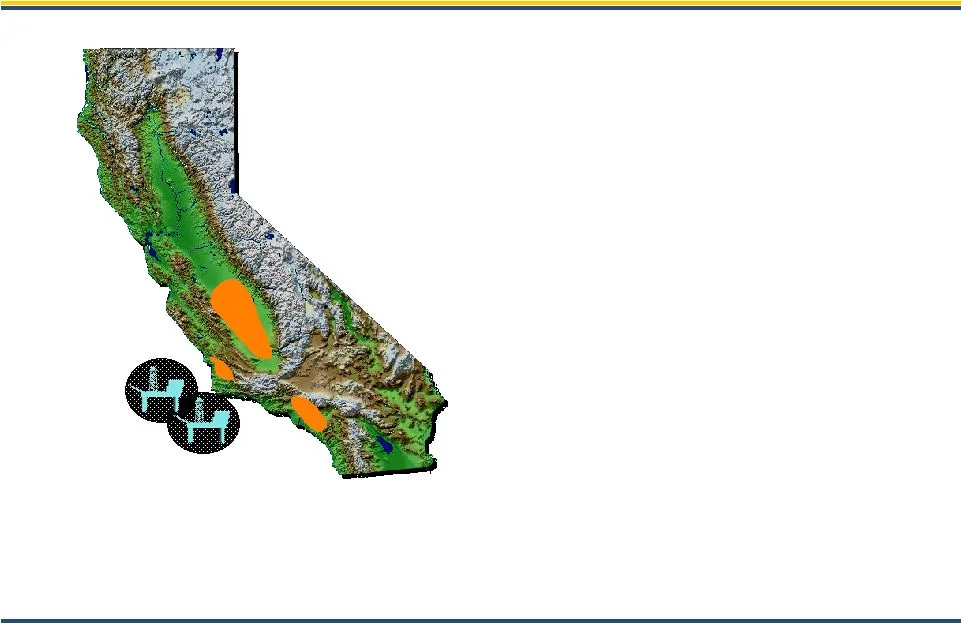
Oil Assets 88% 1% Monterey Shale 75% 2% Mowry Shale 88% 27% California $% of NYMEX Oil Est. % of 2011 Capital Operator Asset
Slide 13
Slide 14: California Operational Plan
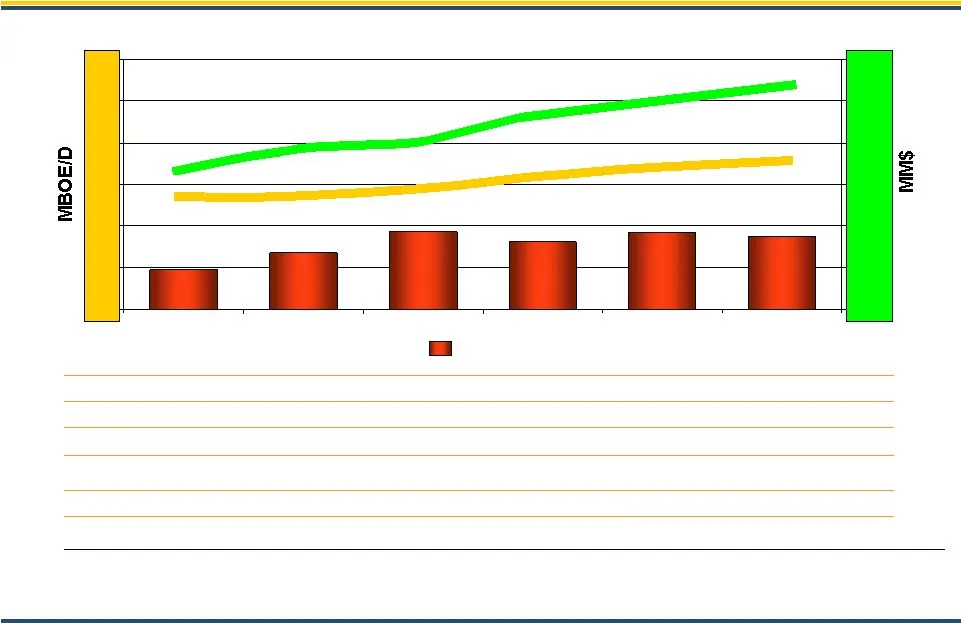
$349 MM $367 MM $190 MM $323 MM $272 MM $374 MM California Operational Plan $0 $200 $400 $600 $800 $1,000 $1,200 PXP Net Production PXP Net Cash Flow (1) $9.87/BOE (2) January 1, 2010 Project Cost Forward F&D: 135 MBOE Average Gross EUR per Well: $1.2 MM Average Gross Well Cost: 275 MMBOE Net Develo
Slide 15: Mowry Shale Horizontal Oil Play
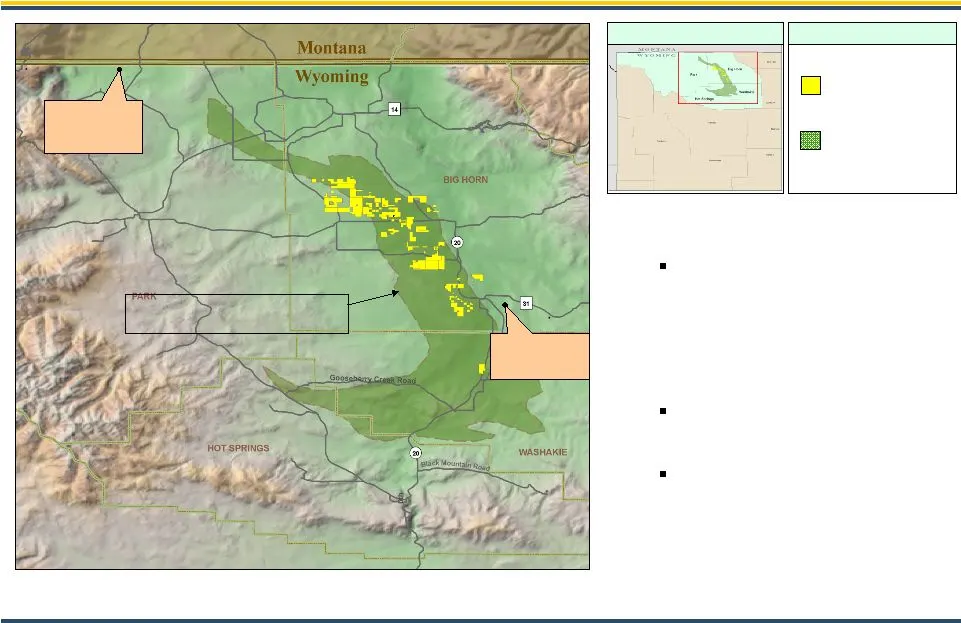
Mowry Shale Horizontal Oil Play Big Horn Basin, Wyoming • PXP acreage position 54,000 net acres • Proven Source Rock • Petrophysical characteristics of successful oil shale plays • Depth Range ~6,000' to 10,000' • Shale Thickness Range ~250' to 400' • Expected first drilling late 2010 Legend PXP ACR
Slide 16: Monterey Shale Oil Play
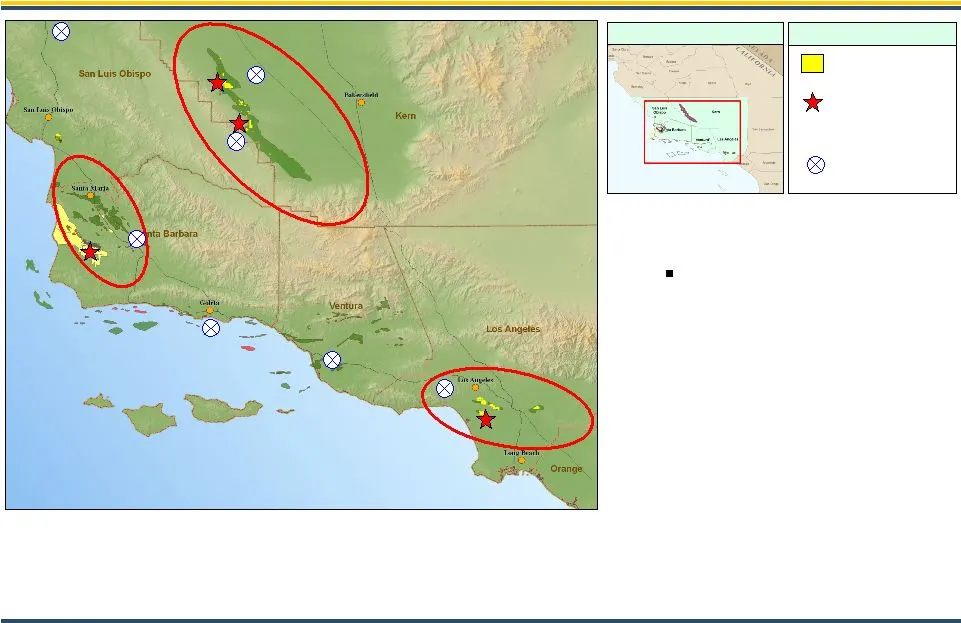
Legend PXP ACREAGE Los Angeles Basin Los Angeles Basin MONTEREY PRODUCTION OXY DISCOVERY VENOCO ACTIVITY * • PXP acreage position 86,000 net • Acquiring 3D seismic data over key assets • Exploratory wells planned in 2011 Point Pedernales Point Arguello Rocky Point Arroyo Grande Lompoc Cymric Belridg

Slide 17: Natural Gas Assets
Natural Gas Assets Dry Gas 1% COP Madden Dry Gas 1% South Texas High Liquids 21% Granite Wash Dry Gas 22% CHK Haynesville Production Characteristics Est. % of 2011Capital Operator Assets
Slide 18: Haynesville Shale Activity Map
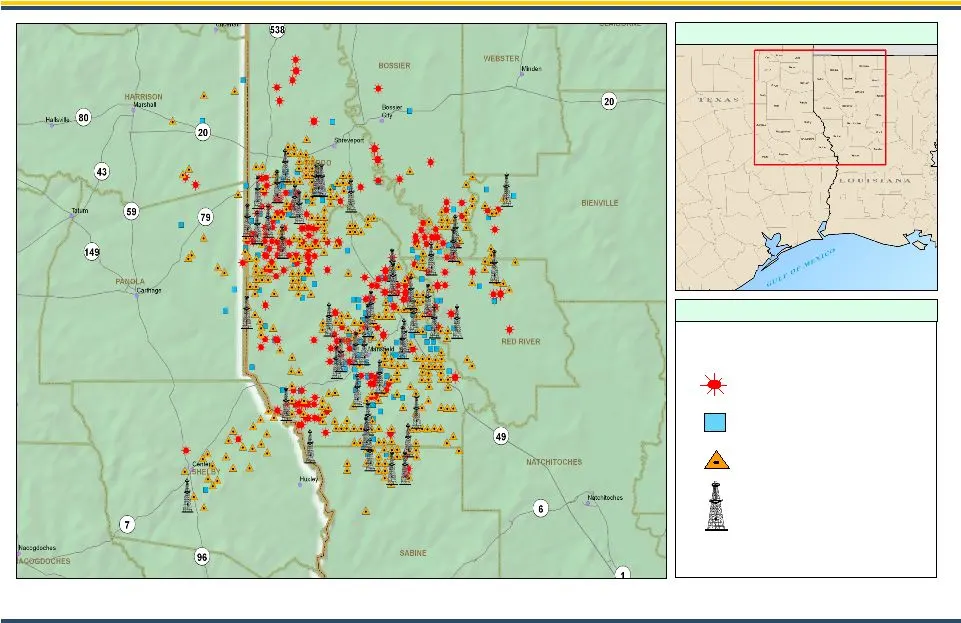
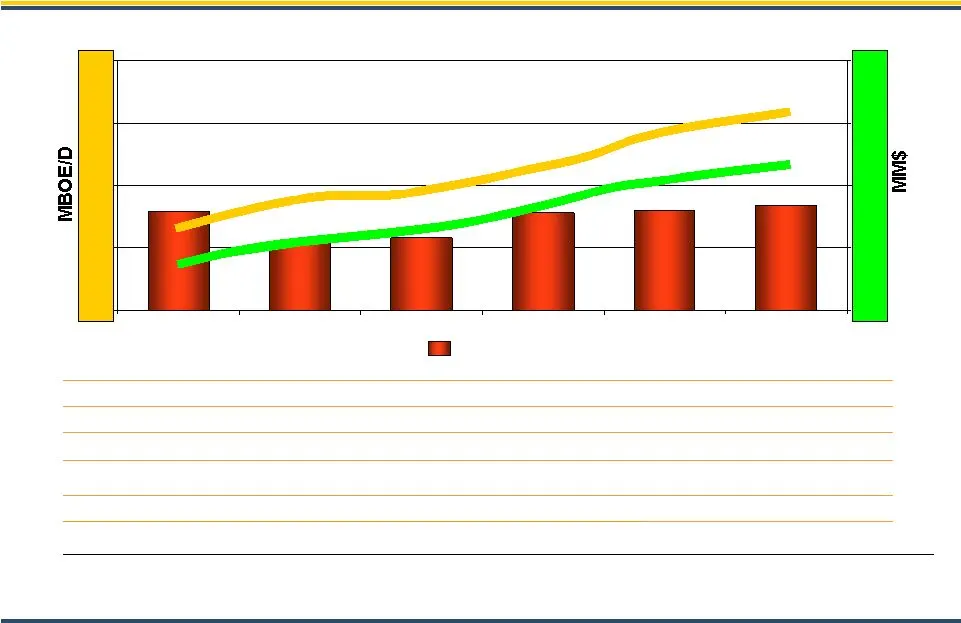
PRODUCING AWAITING COMPLETION 2010 DRILL LOCATIONS ACTIVE DRILLING Haynesville Shale Activity Map TEXAS LOUISIANA Location Map Legend
Slide 19: Haynesville Shale Operational Plan
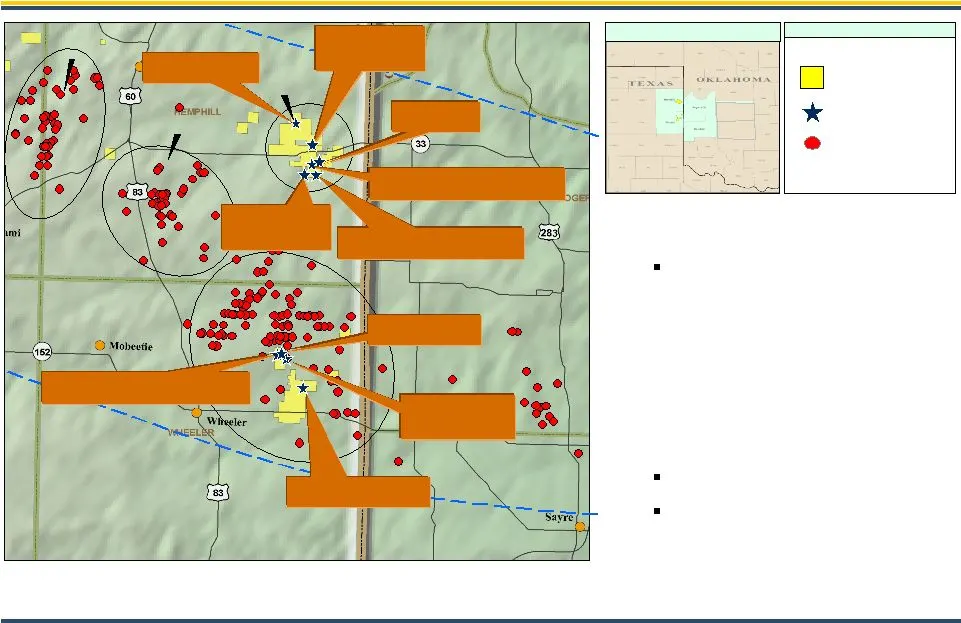
$312 MM $319 MM $336 MM $218 MM $232 MM $315 MM $0 $200 $400 $600 $800 Haynesville Shale Operational Plan $8.24/BOE (3) or $1.37/Mcfe January 1, 2010 Project Cost Forward F&D: (1) Net revenue minus net expenses. (2) Assumes D&C costs for first 4 years = $7.5 MM per well, after 4 years = $6 MM per we
Slide 20: Granite Wash Horizontal Play
PXP Hanson #29-2H 18MMCFED PXP Britt Caldwell #9026H Drilling PXP Thomas #1003H PTD 18,300’ WOC PXP Thomas #903H PXP Sanders #74-1H PTD 15600’ md WOC Thomas 1103H Drilling JO Well 96-6H Drilling PXP Hanson #40-4H PXP Cook 39-2H Drilling PXP Hanson #29-3H PTD 16000’ md Drilling Granite Wash Horizonta
Slide 21: Granite Wash Horizontal Potential Operational Plan
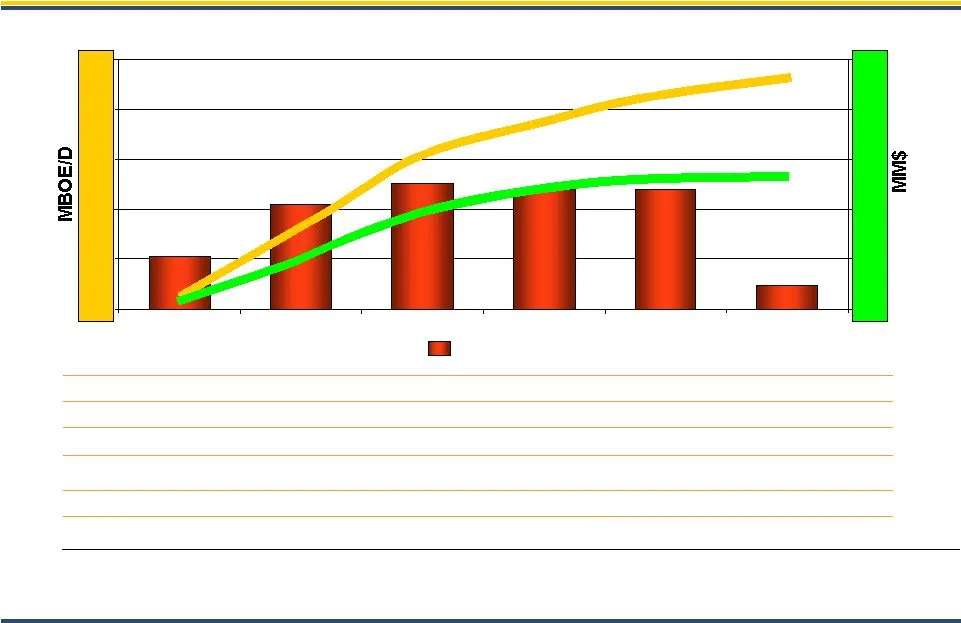
$48 MM $105 MM $240 MM $240 MM $210 MM $253 MM CAPEX PXP Net Production PXP Net Cash Flow (1) $0 $100 $200 $300 $400 $500 Granite Wash Horizontal Potential Operational Plan (1) Net revenue minus net expenses. (2) Assumes Strip pricing in 2010, $85/Bbl of oil and natural gas pricing of $5.00/MMBtu in

Slide 22: +1.4 Billion BOE Resource Potential
950 MMBOE 275 MMBOE 100 MMBOE 10 MMBOE Haynesville California Granite Wash Rockies 90 MMBOE 30 MMBOE Mowry Shale Monterey Shale +1.4 Billion BOE Resource Potential Potential Reserves +1.3 Billion BOE Development Resource Potential Region +100 Million BOE Exploration Resource Potential Potential Rese
Slide 23: Revenue Per MCFE
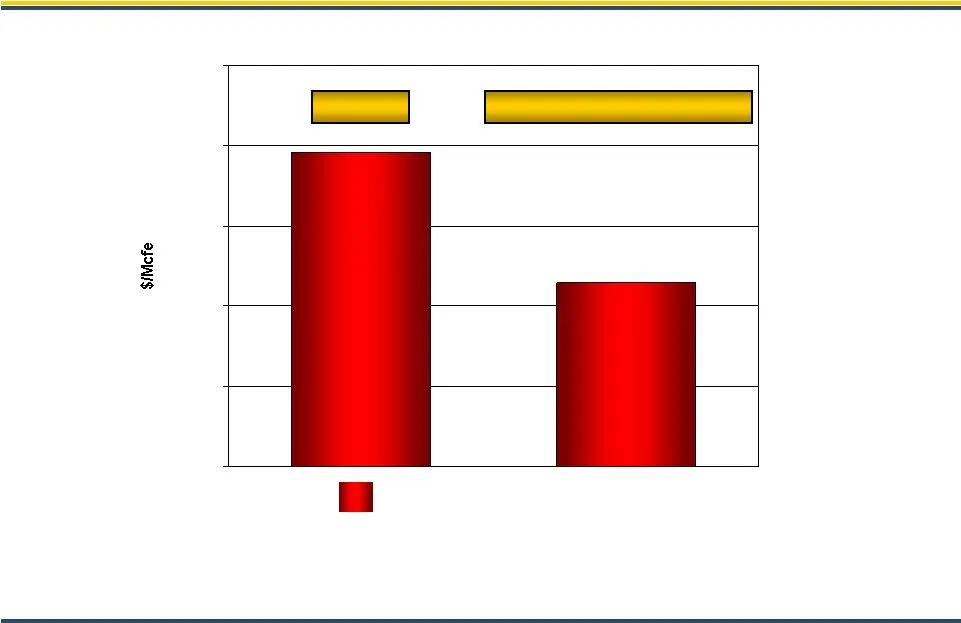
$4.58/ MCFE $7.84/ MCFE Revenue Per MCFE Revenue Per MCFE (3) $0.00 $2.00 $4.00 $6.00 $8.00 $10.00 Gas Peer Group Avg. (1)(2) 2Q 2010 (1) Revenues for non oil and gas producing operations servicing third parties not included. (2) Peer group average includes the following peers: COG, HK, RRC, SD, UPL
Slide 24: Debt-Adjusted Cash Operating Margin
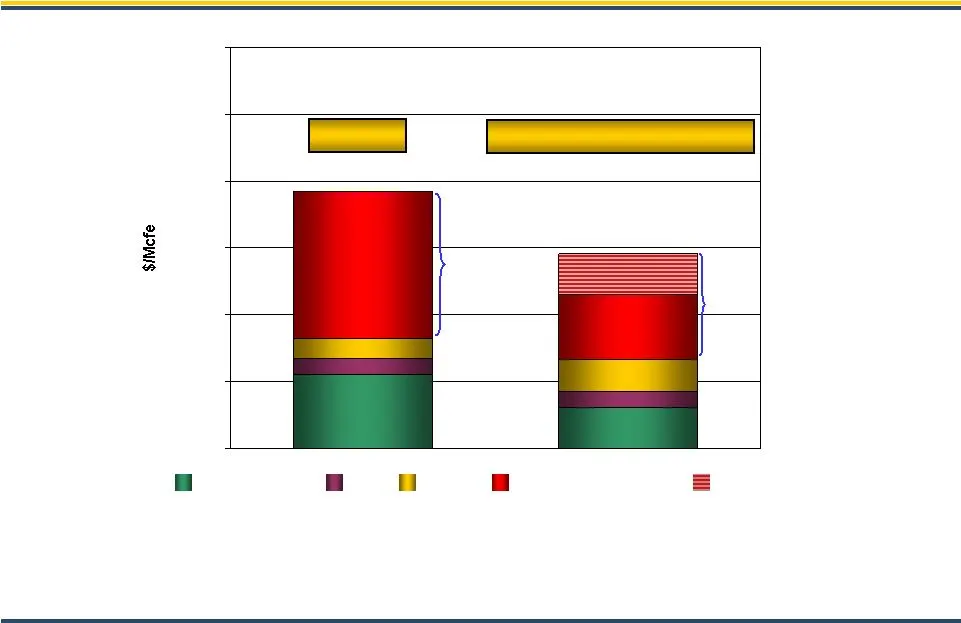
$2.22 $1.23 $0.47 $0.46 $0.60 $0.98 $1.92 $1.24 $4.40 (4) Debt-Adjusted Cash Operating Margin (1)(8) (1) Debt-Adjusted Cash Operating Margin calculated as revenue (excluding hedging), less production expenses, less cash G&A (excluding capitalized G&A and noncash compensation), less interest (excludi

Slide 25: PXP Targets Over Next Years
PXP Targets Over Next 3 Years • Grow reserves 15% to 20% per year over the next 3 years • Grow production 10% to 15% per year over the next 3 years • Efficiently manage business focusing on cost reduction and profitability • Maintain conservative balance sheet with active hedging program • Maintain

Slide 26: Addendum
Addendum

Slide 27: Commodity Price Protection
Commodity Price Protection Oil and Natural Gas Derivative Positions (1) All of our derivative instruments are settled monthly. (2) In addition to the deferred premium, an upfront payment of $3.86 per barrel was paid upon entering into these derivative contracts. (3) PXP receives difference between f

Slide 28: Income Statement Summary
(Millions) 3 mo. ended 6/30/10 3 mo. ended 6/30/09 Revenues $ 364.6 $ 278.7 Production Costs (100.7) (105.8) General & Administrative Expenses (30.3) (37.6) DD&A & Accretion Expense (128.2) (94.4) Impairment of Oil & Gas Properties (59.5) - Legal Recovery - 87.3 Other Operating Income (Expense) 3.9

Slide 29: Reconciliation of Debt-Adjusted Cash Operating Margin
Reconciliation of Debt-Adjusted Cash Operating Margin (Non-GAAP) to Net Cash Provided by Operating Activities (GAAP) The following table reconciles the debt-adjusted operating margin (non-GAAP) to the net cash provided by operating activities (GAAP) for the three months ended June 30, 2010. Manageme

Slide 30: Plains Exploration & Production Company
PLAINS EXPLORATION & PRODUCTION COMPANY
Source: SEC EDGAR · 8-K filed Sep 16, 2010
More decks from Plains Exploration & Production Company
 Global Metals, Mining & Steel Conference 201333 slides · May 14, 2013
 Q1 2013 Earnings Presentation46 slides · Apr 19, 2013
 Merger or Acquisition (February 2013)35 slides · Feb 25, 2013
 2013 Credit Suisse Energy Summit10 slides · Feb 5, 2013
 Merger or Acquisition (January 2013)30 slides · Jan 17, 2013
 Credit Suisse 2012 Energy Summit32 slides · Feb 7, 2012