Cascade Bancorp — KBW 9th Annual Community Bank Investor Conference 2008
22 slides from Cascade Bancorp's conference presentation, Jul 30, 2008
Slide 1: Cascade Bancorp: CACB
Cascade Bancorp: CACB KBW 9 th Annual Community Bank Investor Conference July 29 & 30, 2008 Patricia L. Moss, CEO

Slide 2: Forward Looking Statements
Forward Looking Statements The following presentation contains forward-looking statements, which are not historical facts and pertain to our future operating results. These statements include, but are not limited to, our plans, objectives, expectations and intentions and are not statements of histor
Slide 3: Cascade Bancorp Profile
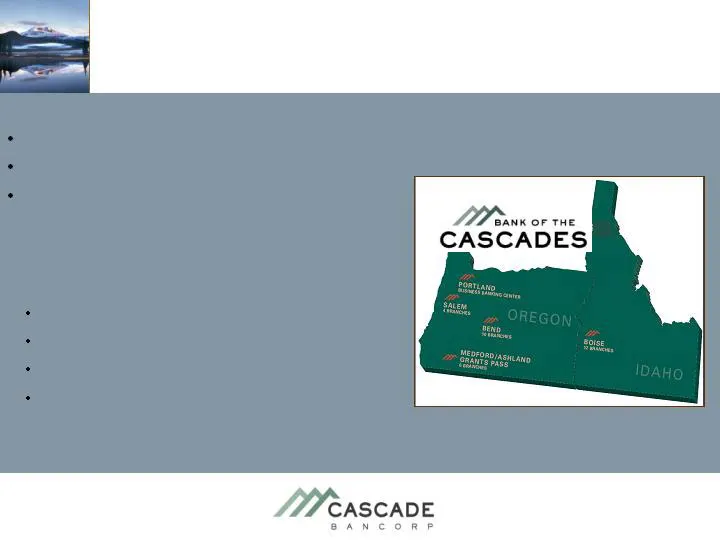
Cascade Bancorp Profile Serving Premier NW Growth Markets Employ Top Tier Bankers Advanced Services and Technology NASDAQ: CACB $2.4 Billion Assets 28.1 million Shares Outstanding Public Offering 1994; Original Charter 1976
Slide 4: Premier NW Franchise
Premier NW Franchise Sustainable Fast Growth Markets Long-term Target of Double Digit Growth Exceptional Core Deposit Franchise History of Top-Tier Performance Outperform in Up-Cycle
Slide 5: Top Tier Markets: Growth Market Footprint
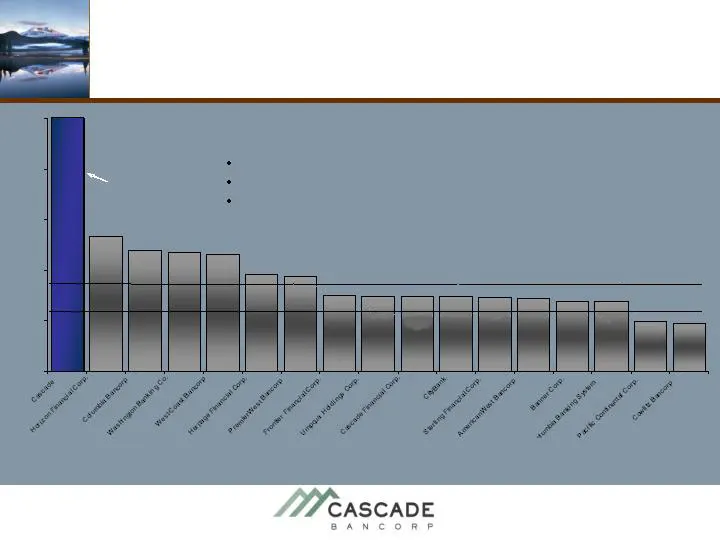
Cascade 0.5% 1.0% 1.5% 2.0% 2.5% 3.0% Average Northwest CAGR 1.4% Average National CAGR 1.2% (1) Deposit - Weighted Population CAGR 2005-2010. All public banks nationally ex M&A targets; assets $2B - $10B, franchise footprint population growth by MSA weighted by franchise deposits; Source SNL Financ
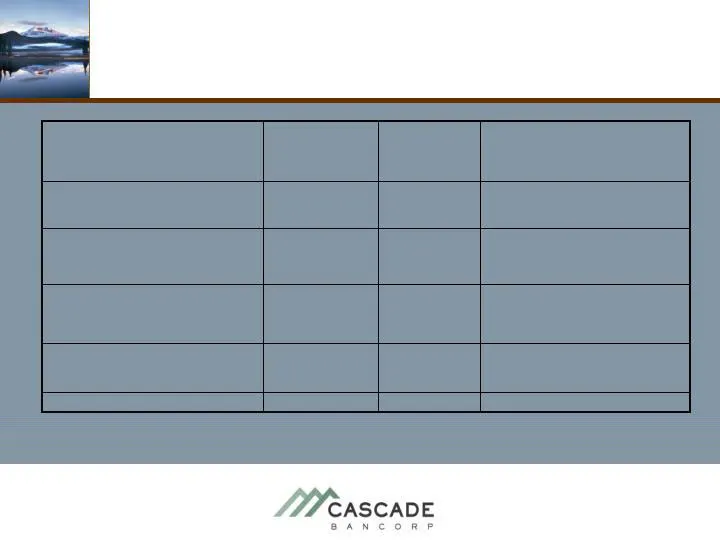
Slide 6: Second Quarter 2008 Highlights: Balance Sheet
Comment Q1-08 Q2-08 Balance Sheet Second Quarter 2008 Highlights Muted growth with Slowing Economy $ 2.04 Billion $ 2.07 Billion Loans Exceed “Well-Capitalized” $259 Million/ 11.42% $257 Million/ 11.24% Risk Based Capital/Total Capital Ratio Ample core capital $164.9 Million 6.9% Assets $162.3 Milli
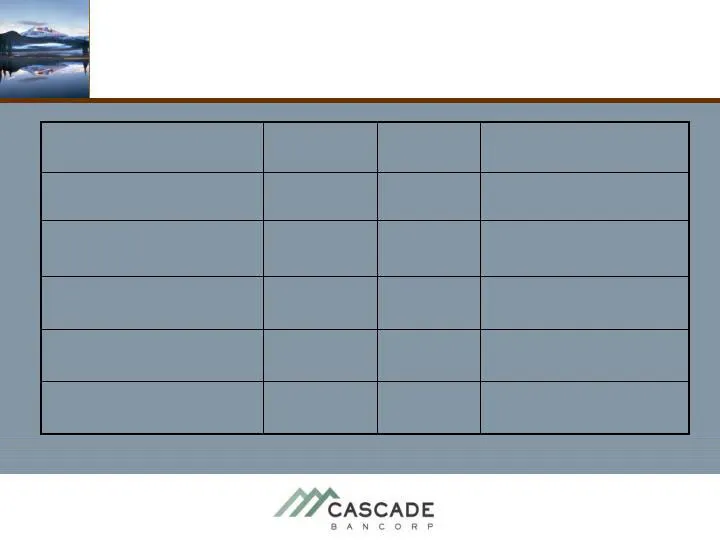
Slide 7: Second Quarter 2008 Highlights: Income Statement
Comment Q1-08 Q2-08 Income Statement Second Quarter 2008 Highlights Expect Flat Except ORE Items 17.4 Million 16.8 Million Non – Interest Expense Half of NIM Decline is Reversal of Interest on NPA’s $ 25.1 Million 4.68% NIM $ 24.2 Million 4.52% NIM NIM Positive $6.0 Million $0.22/shr $.2 Million $0.
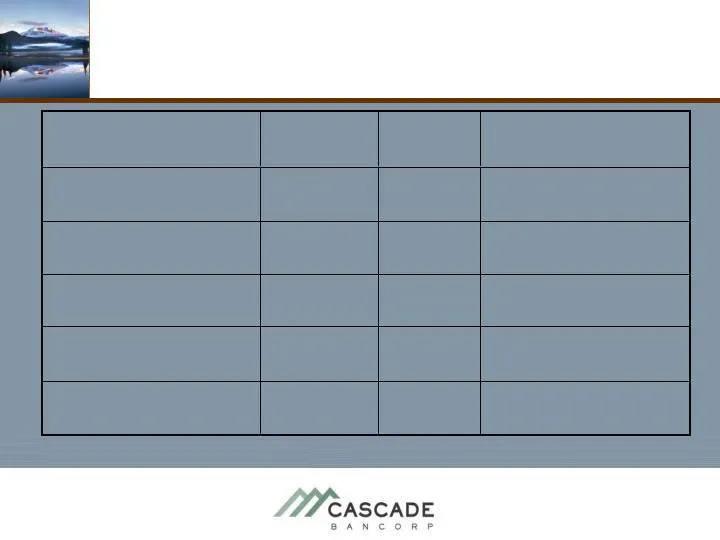
Slide 8: Second Quarter 2008 Highlights: Credit Metrics
Comment Q1-08 Q2-08 Credit Metrics Second Quarter 2008 Highlights Provision in Excess of C/O $ 4.5 Million 0.9% Loans (annualized) $ 12.6 Million 2.4 % of loans (annualized) Provision for Credit Losses Valuation Related – Land Development $ 4.2 Million 0.81% loans (annualized) $ 9.9 Million 1.93% lo
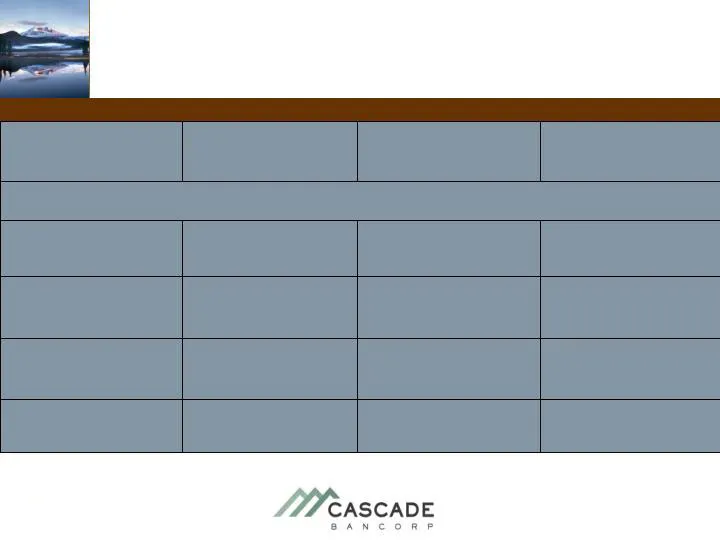
Slide 9: Residential Market: Boise, ID and Bend, OR
--------- 2008 Activity vs. Year Ago Level --------- Comment Boise, ID (Ada) Bend, OR Residential Market Current Environment Adjusting to Supply 89% 209k 85% $315k Median Price - June Responding to Excess Inventory 62% 35% Permits - YTD May Inventory Steady but Sales Slower 134% (9.6 Mo) 134% (14.4
Slide 10: Diversified Loan Portfolio by Loan Type
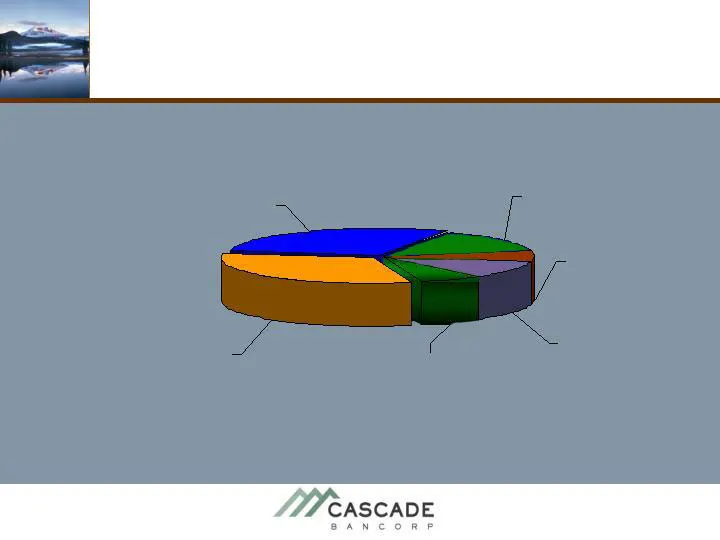
Reflects Cascade’s Growth Markets Distribution by Loan Type CREDIT: Diversified Loan Portfolio Com’l & Indust. 30% Cml. Constr. 11% Res. Constr. 6% Consumer/Other 7% Com’l Real Estate 32% Res. Development 15% June 30, 2008
Slide 11: Total Construction (ADC) Portfolio Geographic Distribution
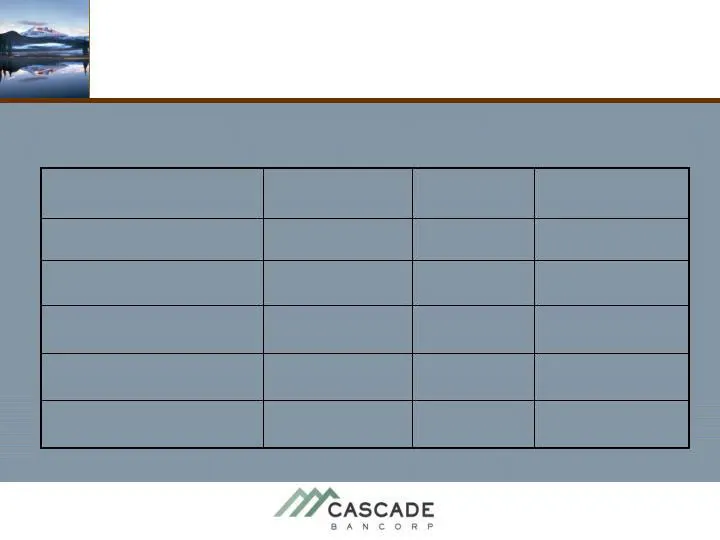
Geographic Distribution (% Total Loans) Commercial Construction Residential Construction Land Development CREDIT: Total Construction (ADC) Portfolio 11% 6% 14% % Total Loans $227 Mill $128 Mill $298 Mill Portfolio Amount 2% 2% 8% Idaho 3% 3% 5% Central OR NW & Southern Oregon 6% 1% 1% June 30, 2008
Slide 12: Residential Land Development
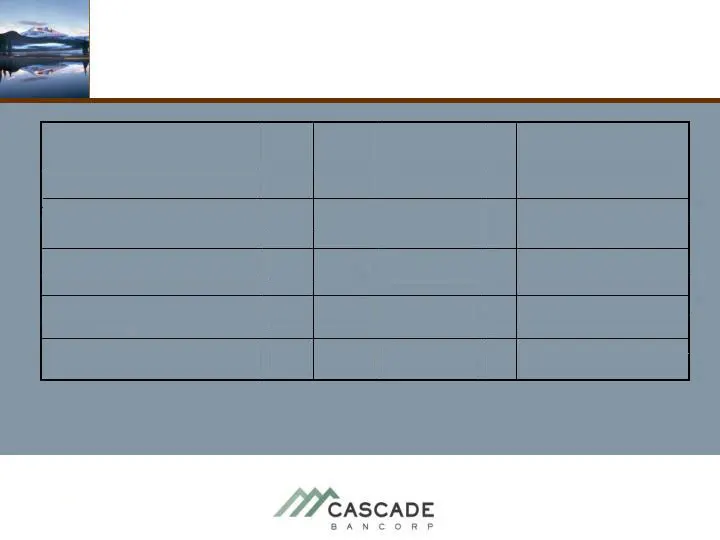
% Gross Loans Amount Category - Risk Largely Confined to Development Loans - 45% Oregon - 55% Idaho CREDIT: Residential Land Development 14% $298M Total 5% $106M Raw Land 8% $171M Development 1% $ 21M Res Lots June 30, 2008
Slide 13: Residential Construction
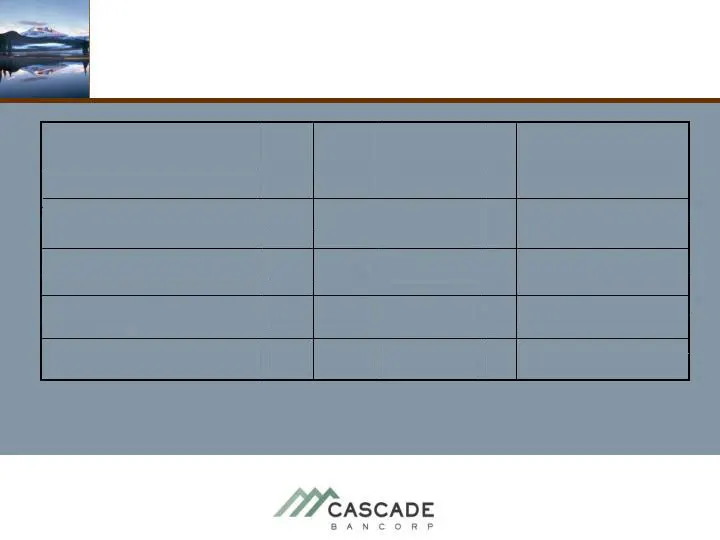
% Gross Loans Amount Category - No loans w/ balance > $3 million - 72% Oregon - 28% Idaho CREDIT: Residential Construction 6% $128M Total 3% $65M Pre-sold 1% $19M Lots 2% $ 45M Speculative June 30, 2008
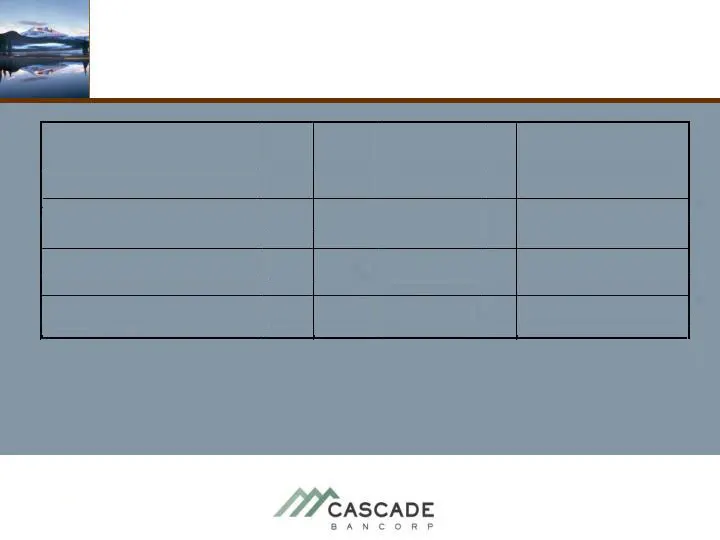
Slide 14: Commercial Construction
80% Oregon (Mainly Bend & Portland) 20% Idaho % Gross Loans Amount Category CREDIT: Commercial Construction June 30, 2008 11% $227M Total 3% $60M Owner Occupied 8% $167M Non-Owner Occupied
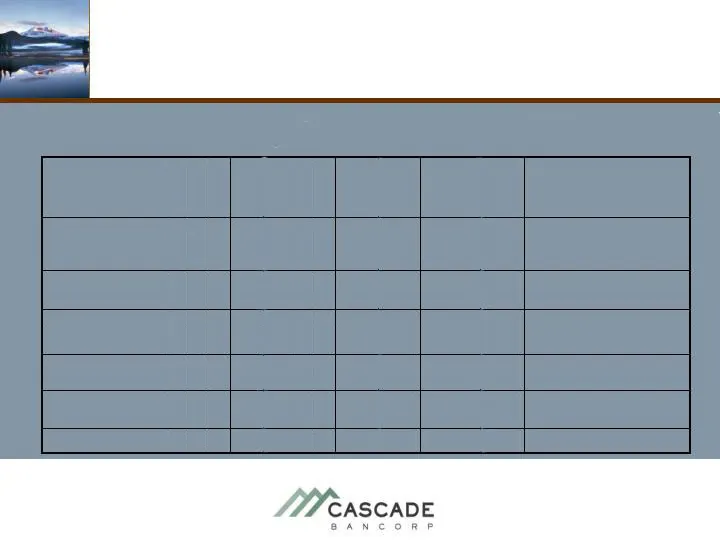
Slide 15: Credit: Non-Performing Assets by Loan Type
Credit: Non-Performing Assets NPAs by Loan Type 100% 5.6% 9.1% 15.9% 5.0% 64.4% % NPAs 6.2% 1.1% 1.8% 8.9%/1.8% (x- Ptd ORE) 4.9% 27.5% % Portfolio Negligible Contagion $11.6 Commercial RE $16M Portland area property – leased $20.2 Commercial Construction $127.1 Total $6.3 Res Construction Risk Main
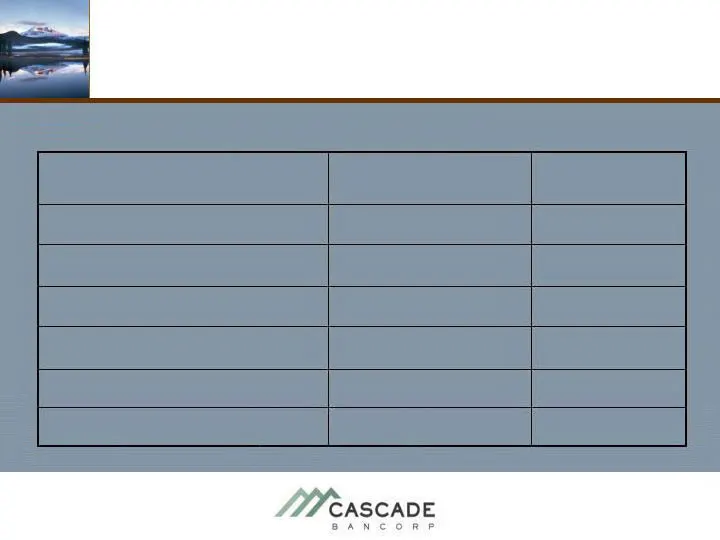
Slide 16: Credit: NPAs by Region
NPAs by Region Region % of total NPAs 6/30/2008 Credit: Non-Performing Assets 56% $71.4M Total Oregon 21% $26.3M Southern OR 100% $127.1M Grand Total 14% $17.5M Northwest OR 22% $27.6M Central OR Idaho 44% $55.8M
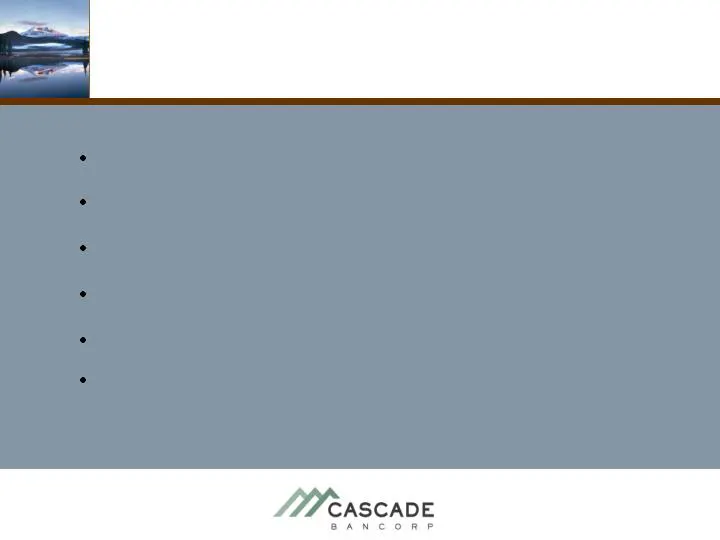
Slide 17: Managing/Assessing Credit Risk
Managing/Assessing Credit Risk Solid Reserve Aggressive Risk Rating Pro-Active Valuation Loss Given Default Assessment Stress Test Portfolio Special Assets Group: focused on resolution
Slide 18: Mitigating Credit Risk
Mitigating Credit Risk Core Earnings Power Pre-tax / Pre-Provision Q2 Earnings @ $12.5 million Nearly 10% of NPA balance per quarter Ample Reserve for Credit Losses 1.94% of Total Loans Exceed “Well Capitalized” Regulatory Standards 11.24% Total Risk-Based Capital Desirable In-Migration Markets Rela
Slide 19: Reserve for Credit Losses % Loans vs. Peers
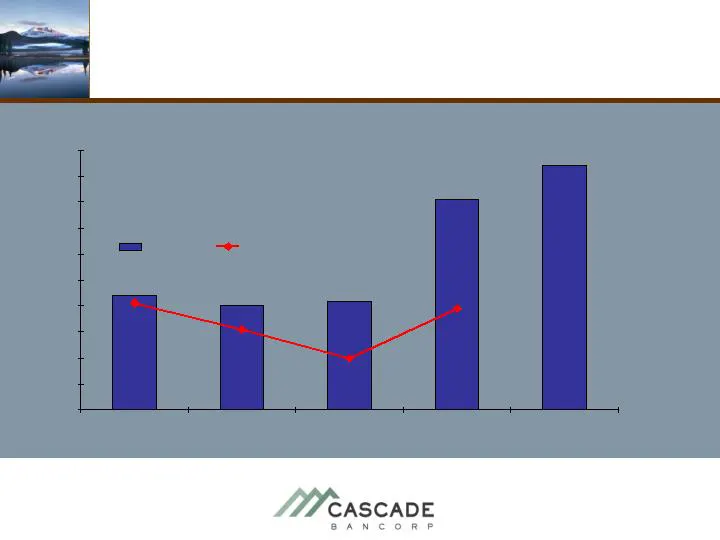
Reserve for Credit Losses % Loans Mitigating Credit Risk 1.44% 1.40% 1.42% 1.81% 1.94% 1.41% 1.31% 1.39% 1.20% 1.00% 1.10% 1.20% 1.30% 1.40% 1.50% 1.60% 1.70% 1.80% 1.90% 2.00% Q2-08 CACB Peers Peers: 15 High performing community banks in the west.
Slide 20: Exceptional Deposit Franchise
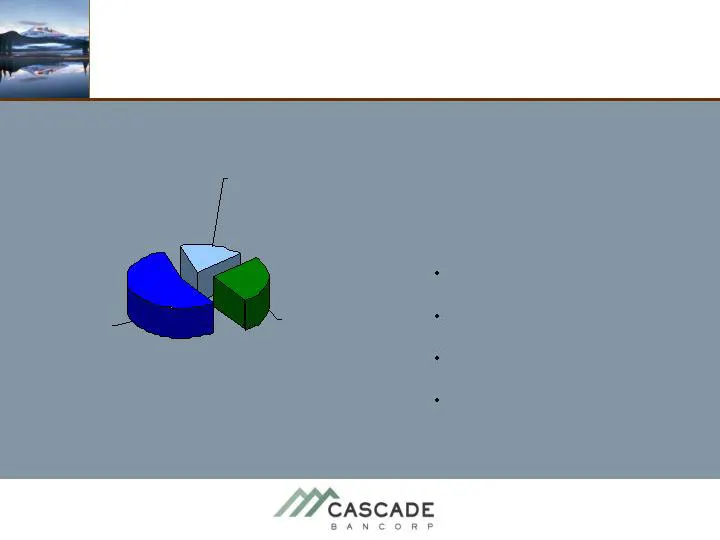
Exceptional Deposit Franchise Interest Bearing Demand/Sav 55% Time 19% Non-Interest Checking 26% June 30, 2008 Relationship Deposits: (x-broker & >100k CDs) $1.5 billion 92% of total deposits 1.51% rate paid (June) 1.90% Overall COF (Q2 avg)
Slide 21: Financially Sound in a Challenging Market
Financially Sound in a Challenging Market $12.6 million Pre-tax pre-provision Q2-08 $40 million Reserve for Credit Losses 11.24% Total Risk-Based Capital Top Growth Market Footprint Top Core Deposit Franchise Commitment to Long-Term Growth & Performance Compelling Core Holding A High Performance Fra
Slide 22: Cascade Bancorp: CACB
Cascade Bancorp: CACB Patricia L. Moss, CEO 1100 NW Wall Street, Bend, Oregon 97701 • 541.385.6205 • www.botc.com
Source: SEC EDGAR · 8-K filed Jul 30, 2008
More decks from Cascade Bancorp
 Shareholder Meeting (May 2017)19 slides · May 24, 2017
 Merger or Acquisition (November 2016)14 slides · Nov 17, 2016
 Merger or Acquisition (November 2016)14 slides · Nov 17, 2016
 D.A. Davidson – Denver (May 10-11, 2016)24 slides · May 9, 2016
 Investor Presentation (December 2015)20 slides · Dec 7, 2015
 Merger or Acquisition (October 2015)6 slides · Oct 29, 2015