Sun Healthcare — UBS 2007 Leveraged Finance Conference
28 slides from Sun Healthcare's conference presentation, May 9, 2007

Slide 1: UBS 2007 Leveraged Finance Conference May 2007
UBS 2007 Leveraged Finance Conference May 2007 UBS Leveraged Finance Conference May

Slide 2: Forward-Looking Statements
Forward-Looking Statements Statements made in this presentation may contain “forward-looking” information, such as forecasts of future financial performance. Such statements involve risks and uncertainties and are subject to change at any time. Factors that could cause actual results to differ mater

Slide 3: Investment Highlights
Investment Highlights t Attractive industry fundamentals and reimbursement outlook t Nationally diversified portfolio of facilities t Focus on high-acuity patients t Harborside acquisition creates one of the largest U.S. operators t Demonstrated integration track record t Strong financial performanc
Slide 4: Attractive Industry Fundamentals
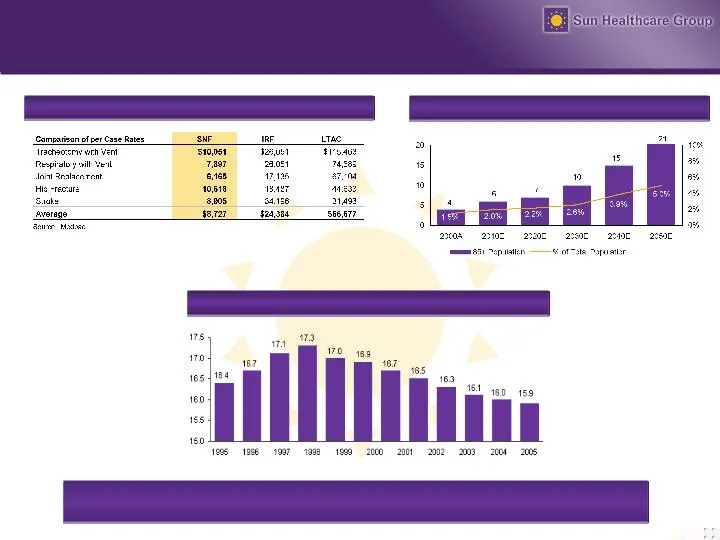
SNFs- Lowest Cost Setting for Rehab and Recovery 85+ Population Growth Declining Number of Nursing Facilities The long-term healthcare industry continues to grow due to demographic demand with limited construction of new inpatient facilities. Attractive Industry Fundamentals Source: US Census Bureau
Slide 5: Sun is a Leading Long-Term Healthcare Provider
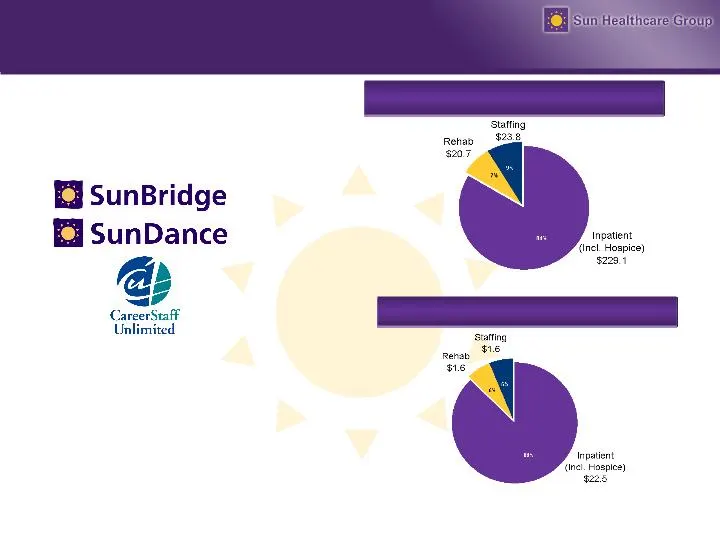
Q1 2007 Sun Standalone Revenues by Segment (1) Q1 2007 Sun Standalone EBITDA by Segment Sun is a Leading Long-Term Healthcare Provider (Inpatient) (Staffing) Total: $273.6 million Total: $12.7 million (1) Includes corporate eliminations and excludes sales to affiliates. ($ in millions) ($ in million
Slide 6: Sun's Recent Developments
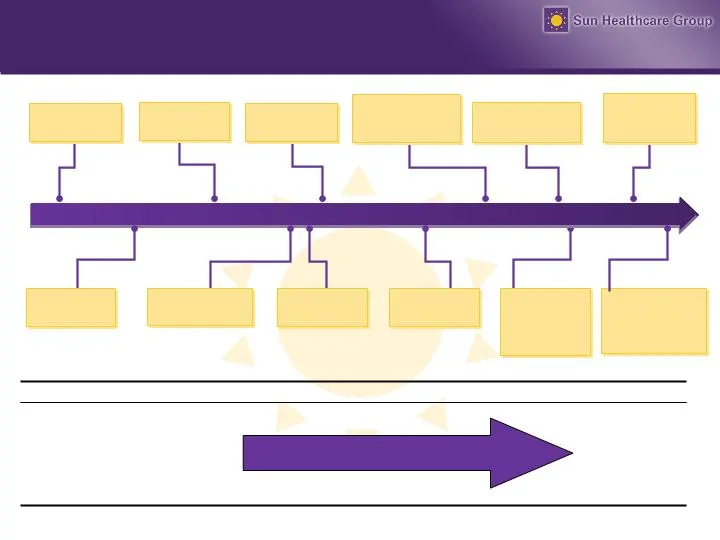
2001 2002 2003 2004 2005 2006 2007 Sun’s Recent Developments November Rick Matros joined Sun as Chairman & CEO February Exited bankruptcy December Completed restructuring February Commenced second restructuring May Announced acquisition of Peak December Closed Peak acquisition and completed equity o
Slide 7: Improving Inpatient Performance Metrics
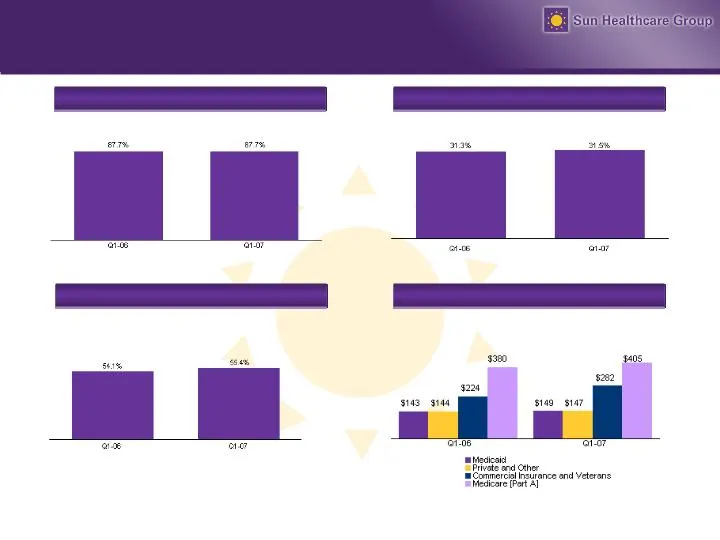
Medicare as a % of Revenue Inpatient Revenue Quality Mix (1) Inpatient Revenue Per Patient Day Occupancy Improving Inpatient Performance Metrics (1) Quality mix includes all non-Medicaid inpatient revenues.
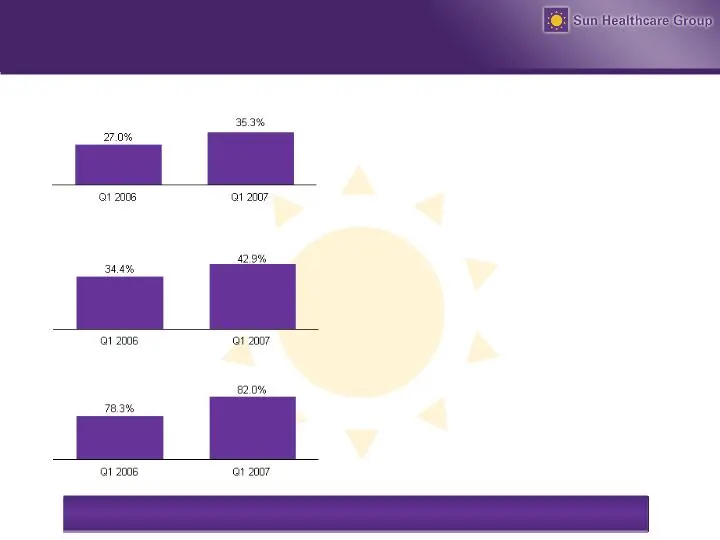
Slide 8: Sun's High Acuity Strategy Drives Margins
The inpatient business has a continued opportunity to improve acuity and increase margins. Sun’s High Acuity Strategy Drives Margins Note: REX defined as Rehab with Extensive Days. t Sun’s rehabilitation therapy segment helps drive Medicare inpatient days § Attracts high-acuity patients who require

Slide 9: Proven Integration Track Record with Peak Medical
Same dedicated integration team is now focusing on the Harborside integration. Proven Integration Track Record with Peak Medical Sun acquired Peak Medical Corporation in December 2005 t $151.6 million acquisition consideration in stock and assumed debt t Operator of 56 inpatient facilities (17 owned

Slide 10: Harborside Healthcare Overview
Harborside Healthcare Overview
Slide 11: Harborside's High Quality Portfolio
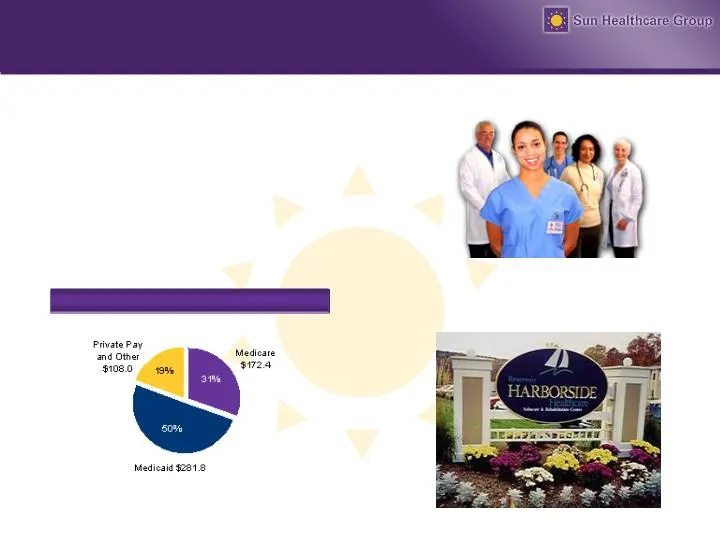
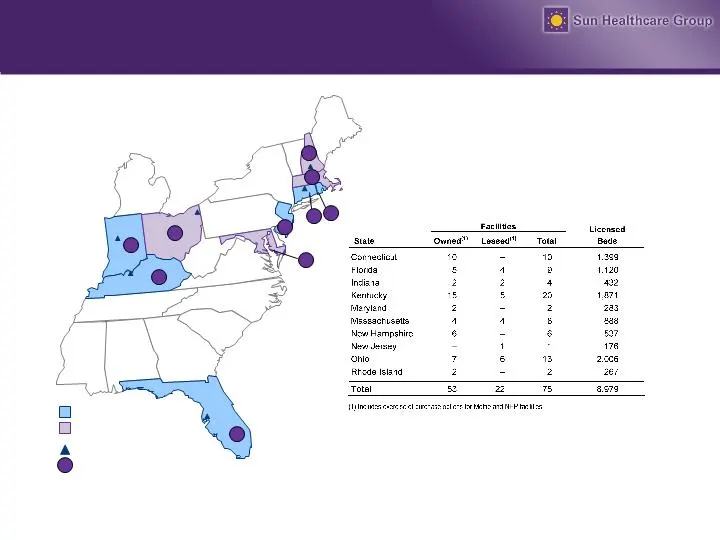
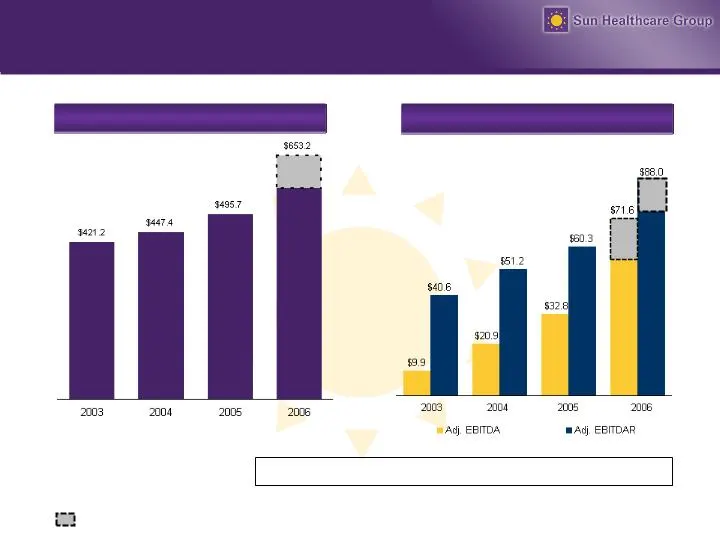
FY 2006 Inpatient Revenue by Payor Harborside’s High Quality Portfolio t SNFs and 2 ALFs/ILFs located in 10 states § 53 (1) owned and 22 leased § 8,979 licensed beds § pro forma revenues and Adjusted EBITDA of $653.2 million and $71.6 million, respectively t FY occupancy of 91% t FY Medicare revenue
Slide 12: Regionally Focused Footprint
9 20 4 13 2 1 6 8 10 2 # Regionally Focused Footprint Overlapping State Regional Office Harborside State Number of Facilities
Slide 13: Harborside's Strong Financial Performance
Adjusted EBITDAR and EBITDA Revenues Harborside’s Strong Financial Performance ($ in millions) ($ in millions) Adj. EBITDAR % Margin 9.6% 11.5% 12.2% 13.5% Adj. EBITDA % Margin 2.4% 4.7% 6.6% 11.0% Represents the full year impact of acquisitions completed during 2006 and the exercise of the Moffie a
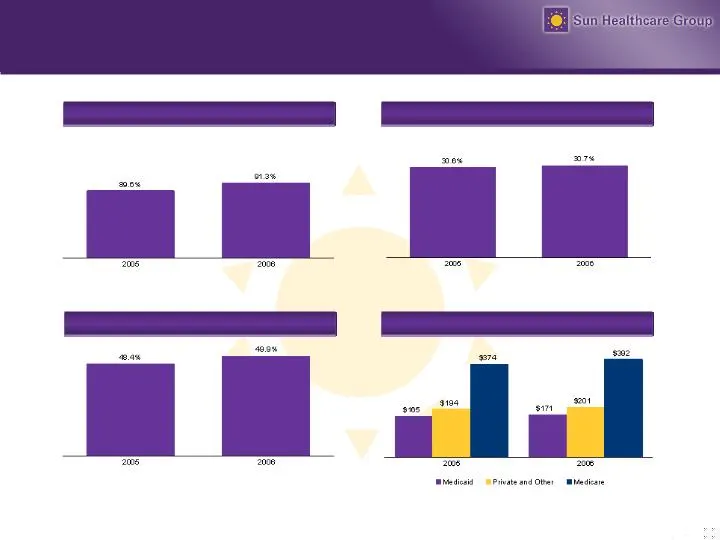
Slide 14: Harborside Inpatient Performance Metrics
Medicare as a % of Revenue Occupancy Inpatient Revenue Quality Mix (2) Inpatient Revenue PPD Harborside Inpatient Performance Metrics (1) Actual year results, including the impact of 2006 acquisitions from the date they closed. (2) Quality mix includes all non-Medicaid inpatient revenues. (1) (1) (1

Slide 15: Combined Company Overview
Combined Company Overview
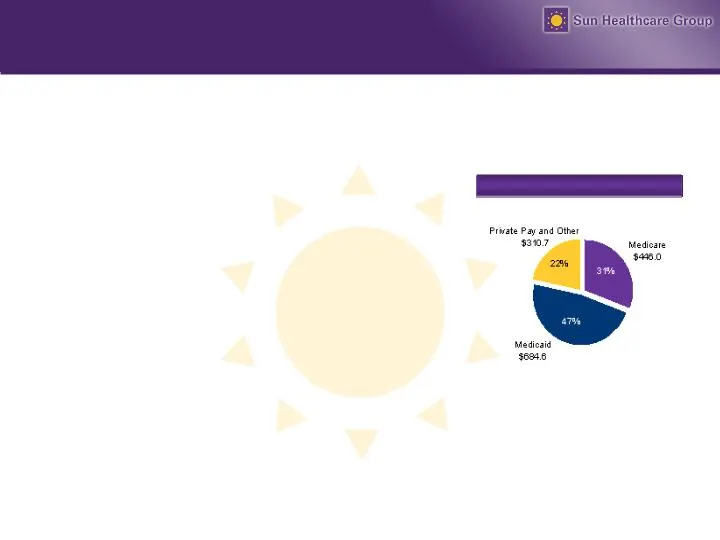
Slide 16: Sun Pro Forma for Harborside Acquisition
FY 2006 Inpatient Payor Mix Sun Pro Forma for Harborside Acquisition (1) Includes exercise of Moffie and NHP purchase options. Total: $1,441.3 million t Strong asset base of 216 inpatient facilities across states t High CON concentration provides barriers to entry § of 25 states t Significant facili
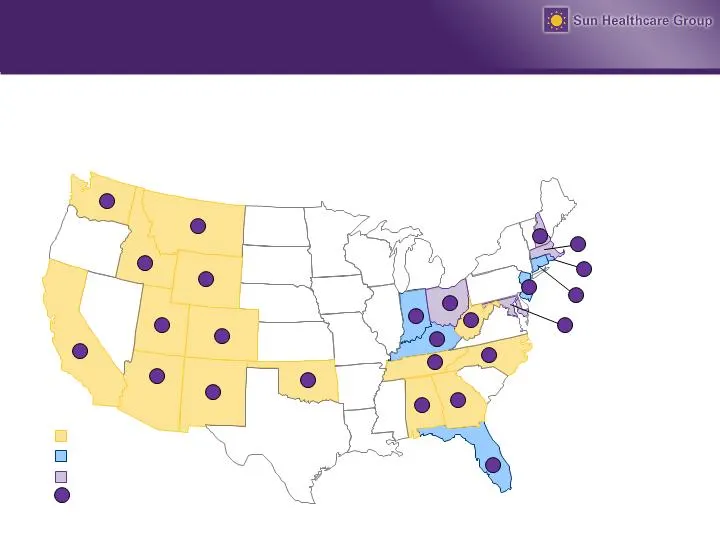
Slide 17: Nationally Diversified Portfolio of Facilities
6 5 10 1 17 3 9 1 12 12 7 9 9 9 8 3 10 2 19 15 4 7 20 1 # 17 Nationally Diversified Portfolio of Facilities 24,426 Licensed Beds in 25 States Existing Sun State Harborside State Overlapping State Number of Facilities (1) Includes the exercise of Harboside’s purchase options on the Moffie portfolio (
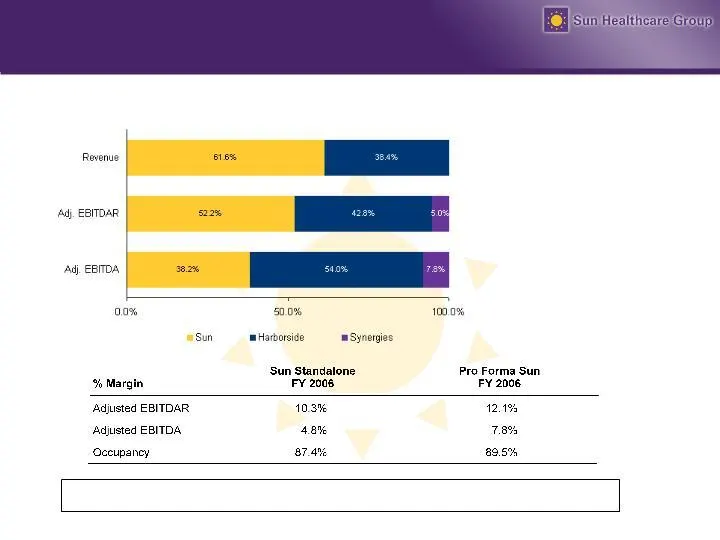
Slide 18: Improved Scale, Margins and Occupancy
Improved Scale, Margins and Occupancy Consolidated Company Financials Adjusted Pro Forma for the Fiscal Year ended December 31, 2006 $1,698.8 million Consolidated $205.7 million $132.4 million Note: Adjusted Pro Forma combines Sun and Harborside results for 2006 annualizing transactions that took pl

Slide 19: Harborside Integration Plan
Harborside Integration Plan t Sun management has the experience and skill necessary to integrate large multi-facility acquisitions without disrupting existing operations t Dedicated transition team in place with detailed integration planning under way t Quickly identified and communicated with key H

Slide 20: Financial Performance
Financial Performance
Slide 21: 2007 Guidance
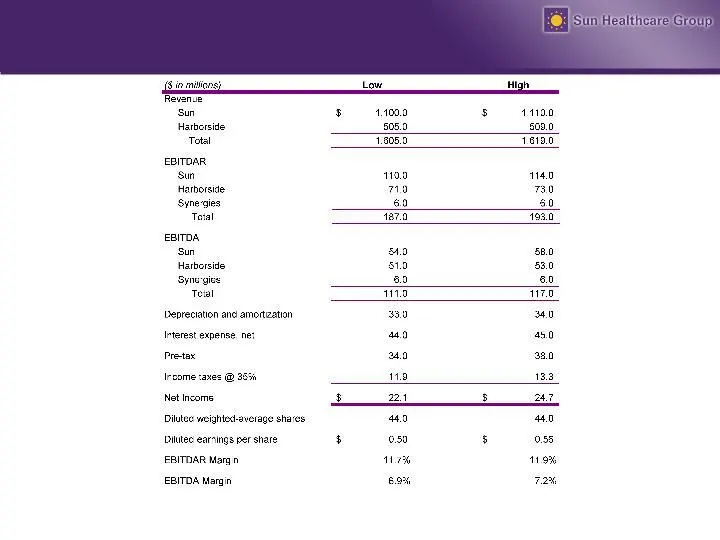
2007 Guidance Sun’s 2007 full-year guidance includes only nine months of impact from the Harborside acquisition. As such, Sun anticipates annual 12 month run rates for depreciation and amortization to be approximately $39 to $41 million and annual 12 month run rates for net interest expense to be ap
Slide 22: Adjusted Pro Forma EBITDA Bridge
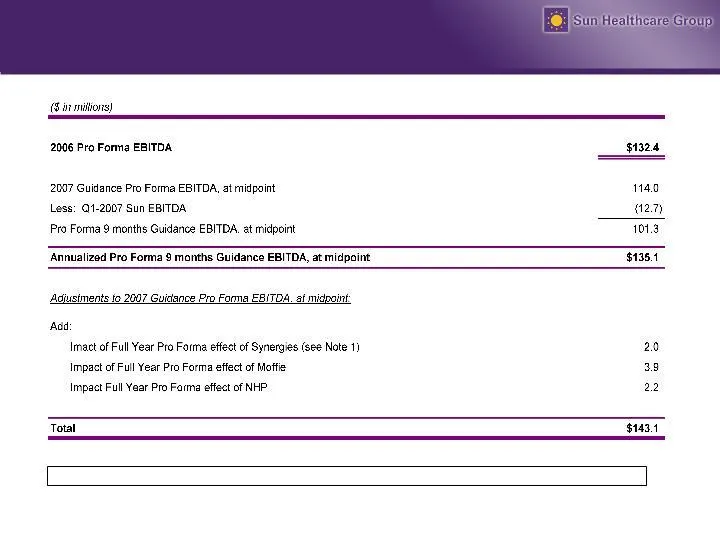
Adjusted Pro Forma EBITDA Bridge Note 1: $10mm estimated first year synergies. $6mm guidance synergies. $8mm in nine month annualized guidance synergies
Slide 23: Pro Forma Capitalization Table
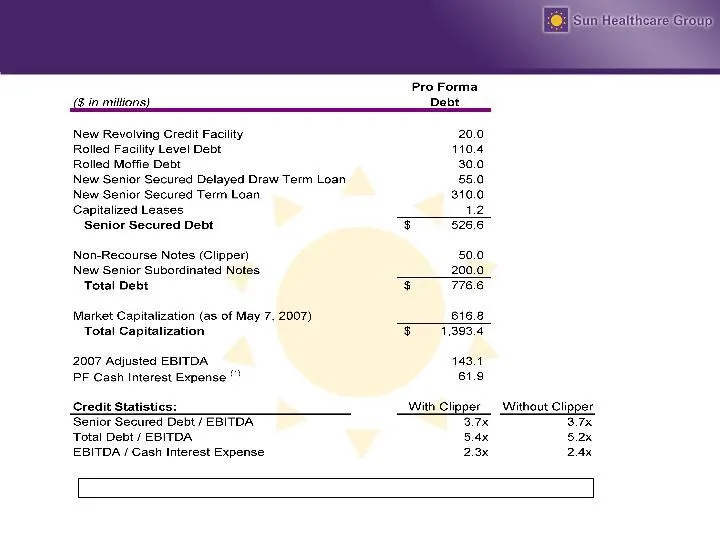
Pro Forma Capitalization Table (1) Pro forma for a full year of interest on debt to be assumed with the exercise of Moffie / NHP purchase options.

Slide 24: Investment Highlights
Investment Highlights t Attractive industry fundamentals and reimbursement outlook t Nationally diversified portfolio of facilities t Focus on high-acuity patients t Harborside acquisition creates one of the largest U.S. operators t Demonstrated integration track record t Strong financial performanc

Slide 25: Reconciliations
Reconciliations

Slide 26: Reconciliation Section
Reconciliation Section Definitions of EBITDA and EBITDAR EBITDA is defined as earnings before depreciation, amortization, interest, net, loss on asset impairment, loss on lease termination, (gain) loss on sale of assets, reorganization gain, net, restructuring costs, net, income tax expense (benefit
Slide 27: Reconciliation Section
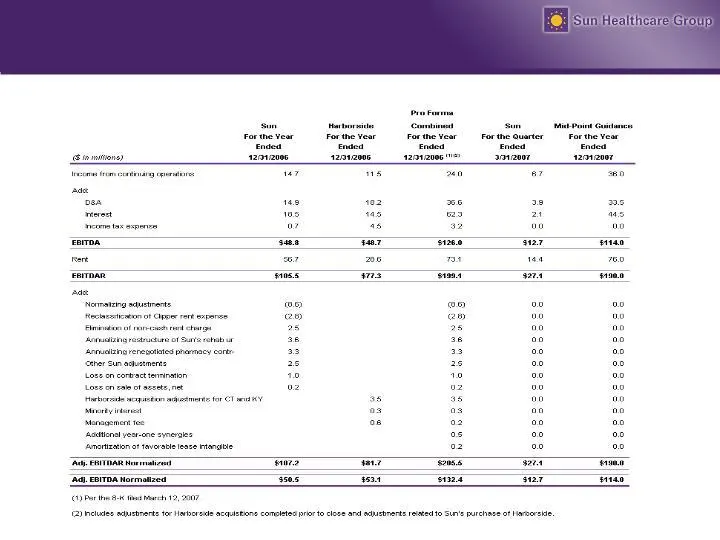
Reconciliation Section Reconciliation to Normalized Pro Forma Sun EBITDA(R)

Slide 28
Source: SEC EDGAR · 8-K filed May 9, 2007
More decks from Sun Healthcare Group Inc
 Jefferies 2012 Global Healthcare Conference17 slides · Jun 6, 2012
 J.P. Morgan Healthcare Conference 201219 slides · Jan 10, 2012
 Investor Presentation (March 2011)36 slides · Mar 29, 2011
 JPMorgan Healthcare Conference (January 2011)27 slides · Jan 10, 2011
 Non-Deal Roadshow (July 2010)33 slides · Jul 12, 2010
 Wells Fargo Securities 2010 Healthcare Conference25 slides · Jun 24, 2010