Temple-Inland — UBS Paper and Forest Products Conference 2002
34 slides from Temple-Inland's conference presentation, Sep 26, 2002
Slide 1: UBS Paper and Forest Products Conference
UBS Paper and Forest Products Conference September 26, 2002 1
Slide 2: Forward-looking statements
This presentation contains forward looking statements that involve risk and uncertainties. The actual results achieved by Temple-Inland may differ significantly from the results discussed in the forward-looking statements. Factors that might cause such differences include general economic, market, o
Slide 3: Transformation of Temple-Inland
Transformation of Temple-Inland Over the past 2 years, we have been transforming Temple-Inland into a market-driven, customer-focused company to improve financial performance Our goal is to deliver a superior rate of return over economic cycles 3
Slide 4: Transformation of Temple-Inland: Key Actions To Date
Transformation of Temple-Inland Key Actions To Date: Shifted from manufacturing / production orientation to market-driven / customer-oriented focus Established ROI pre-tax target of 18.5% (EBIT / Investment) with compensation tied to ROI Sold bleached paperboard operation to focus on corrugated pack
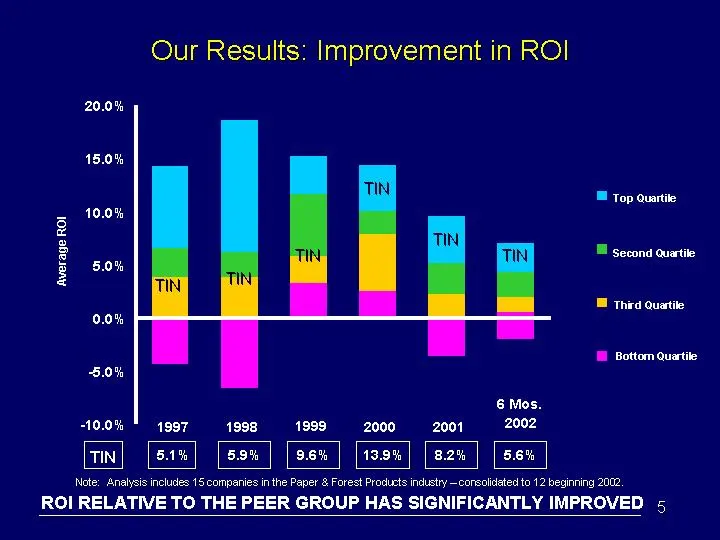
Slide 5: Our Results: Improvement in ROI
6 Mos. 2002 5.6% Our Results: Improvement in ROI ROI RELATIVE TO THE PEER GROUP HAS SIGNIFICANTLY IMPROVED - -10.0% - -5.0% 0.0% 5.0% 10.0% 15.0% 20.0% 1997 1998 1999 2000 2001 Average ROI Top Quartile Second Quartile Third Quartile Bottom Quartile 5.1% 5.9% 9.6% 13.9% 8.2% TIN TIN TIN TIN TIN Note:
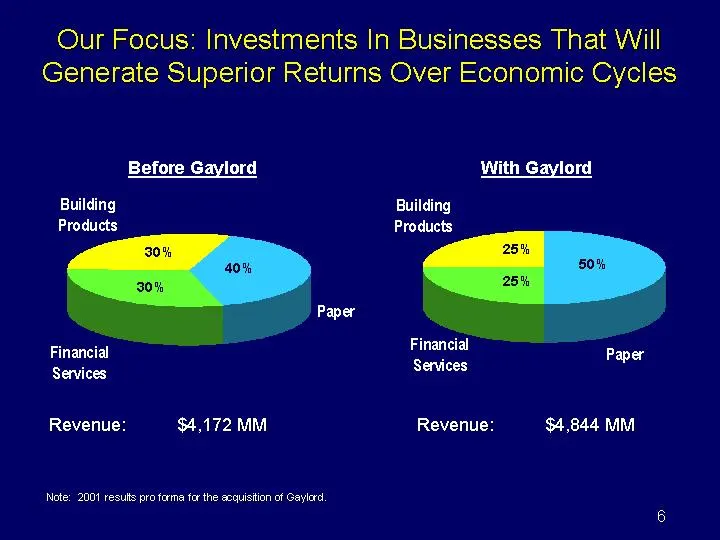
Slide 6: Our Focus: Investments In Businesses With Superior Returns
Our Focus: Investments In Businesses That Will Generate Superior Returns Over Economic Cycles Paper Financial Services Building Products 0.4 0.3 0.3 Paper Financial Services Building Products 0.5 0.25 0.25 30% 40% 30% 50% 25% 25% Before Gaylord With Gaylord Revenue: $4,844 MM Revenue: $4,172 MM Note
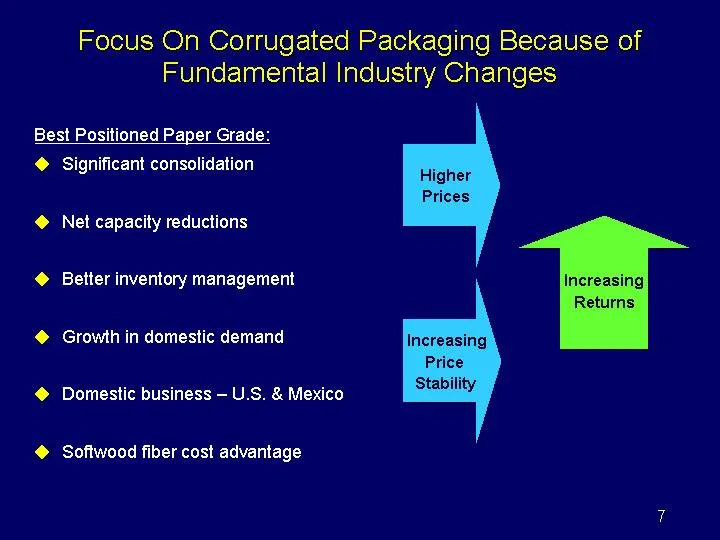
Slide 7: Focus On Corrugated Packaging Because of Fundamental Industry Changes
Focus On Corrugated Packaging Because of Fundamental Industry Changes Best Positioned Paper Grade: Significant consolidation Net capacity reductions Better inventory management Growth in domestic demand Domestic business - U.S. & Mexico Softwood fiber cost advantage Higher Prices Increasing Price St
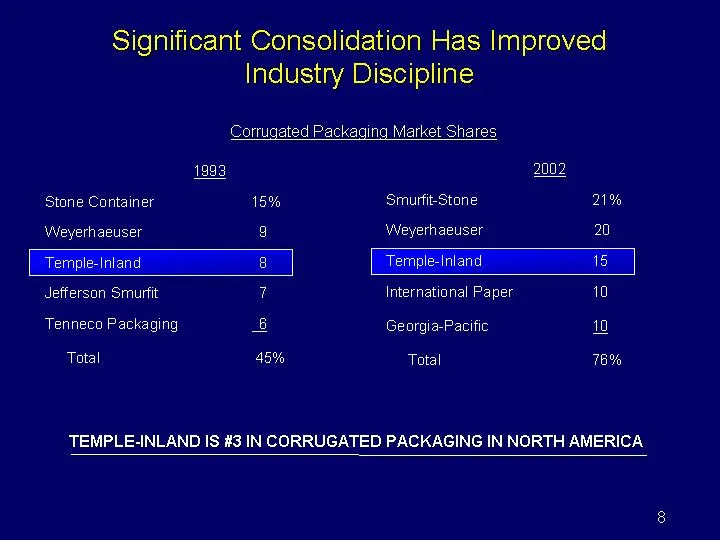
Slide 8: Significant Consolidation Has Improved Industry Discipline
Significant Consolidation Has Improved Industry Discipline TEMPLE-INLAND IS #3 IN CORRUGATED PACKAGING IN NORTH AMERICA 1993 Stone Container 15% Weyerhaeuser 9 Temple-Inland 8 Jefferson Smurfit 7 Tenneco Packaging 6 Total 45% 2002 Smurfit-Stone 21% Weyerhaeuser 20 Temple-Inland 15 International Pape
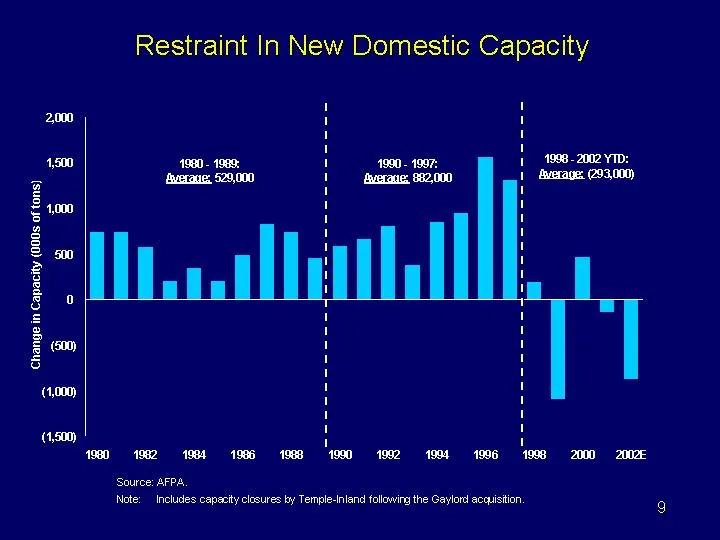
Slide 9: Restraint In New Domestic Capacity
Restraint In New Domestic Capacity Source: AFPA. Note: Includes capacity closures by Temple-Inland following the Gaylord acquisition. 9
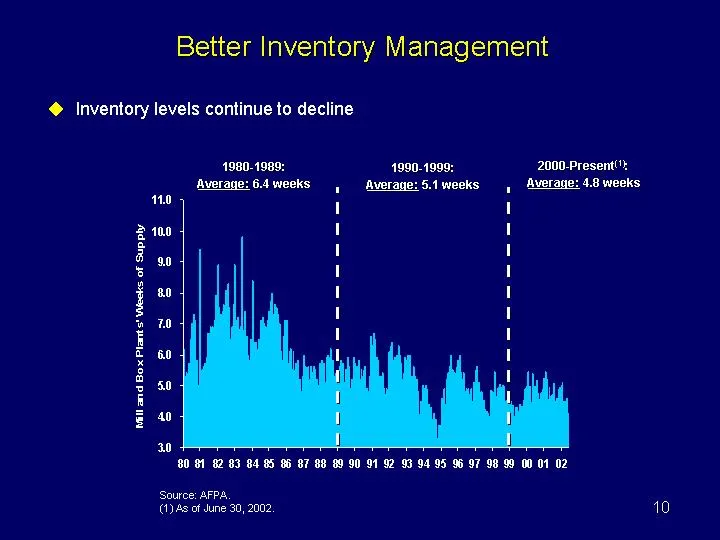
Slide 10: Better Inventory Management
Better Inventory Management Source: AFPA. (1) As of June 30, 2002. Inventory levels continue to decline 1980-1989: Average: 6.4 weeks 1990-1999: Average: 5.1 weeks 2000-Present(1): Average: 4.8 weeks 10
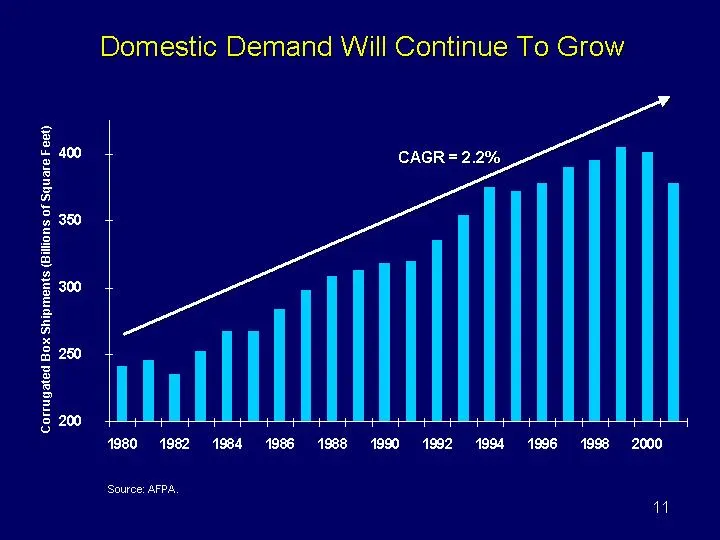
Slide 11: Domestic Demand Will Continue To Grow
Domestic Demand Will Continue To Grow Source: AFPA. CAGR = 2.2% 11
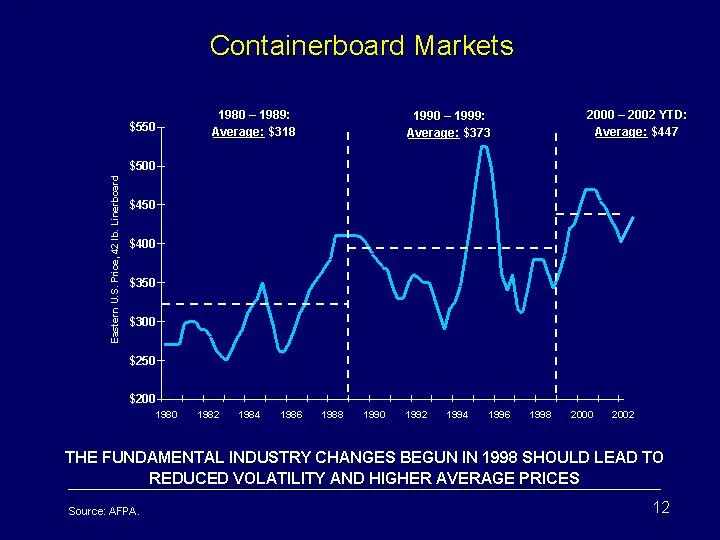
Slide 12: Containerboard Markets
Containerboard Markets THE FUNDAMENTAL INDUSTRY CHANGES BEGUN IN 1998 SHOULD LEAD TO REDUCED VOLATILITY AND HIGHER AVERAGE PRICES $200 $250 $300 $350 $400 $450 $500 $550 1980 1982 1984 1986 1988 1990 1992 1994 1996 1998 2000 2002 Eastern U.S. Price, 42 lb. Linerboard 1980 - 1989: Average: $318 1990
Slide 13: Overview of Gaylord Container
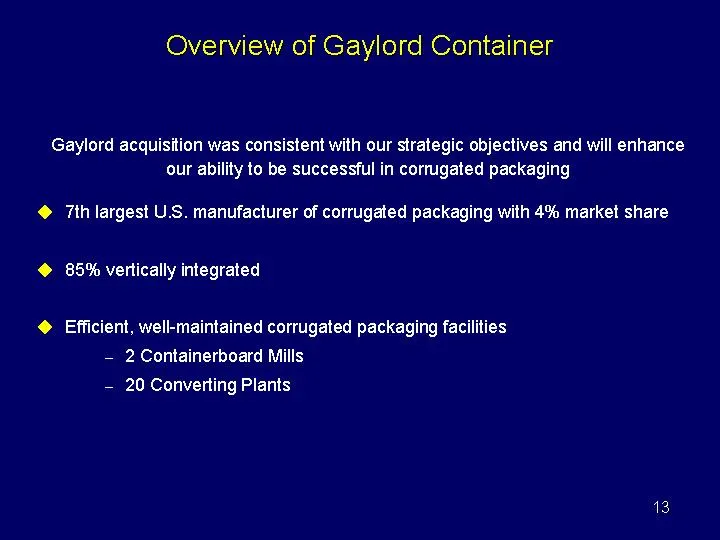
Overview of Gaylord Container Gaylord acquisition was consistent with our strategic objectives and will enhance our ability to be successful in corrugated packaging 7th largest U.S. manufacturer of corrugated packaging with 4% market share 85% vertically integrated Efficient, well-maintained corruga
Slide 14: Extends Market Reach
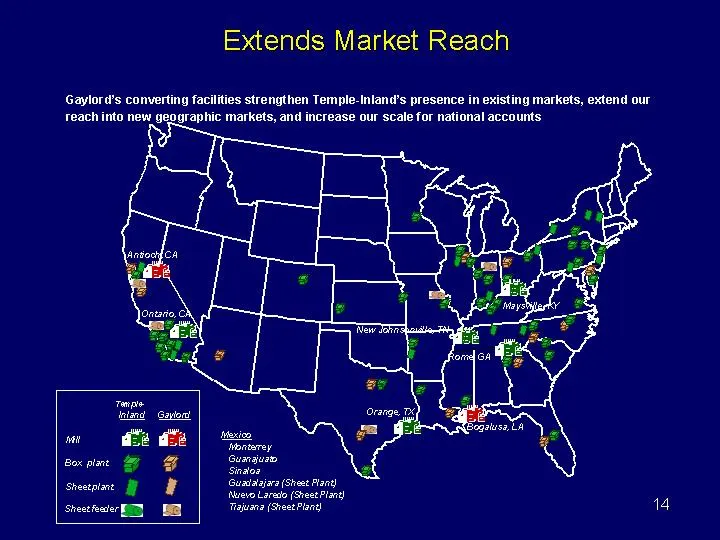
Extends Market Reach Gaylord's converting facilities strengthen Temple-Inland's presence in existing markets, extend our reach into new geographic markets, and increase our scale for national accounts Bogalusa, LA Maysville, KY Ontario, CA Orange, TX Antioch, CA New Johnsonville, TN Rome, GA Box pla
Slide 15: Improves Corrugated Packaging Customer Mix
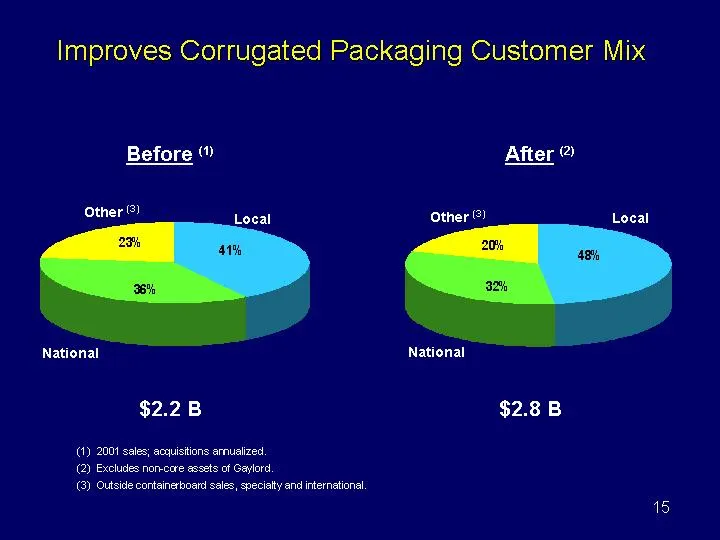
Improves Corrugated Packaging Customer Mix Local National Other Inland 0.48 0.32 0.2 Local National Other Inland 0.41 0.36 0.23 (1) 2001 sales; acquisitions annualized. (2) Excludes non-core assets of Gaylord. (3) Outside containerboard sales, specialty and international. Other (3) Local National Ot
Slide 16: Capacity Rationalization
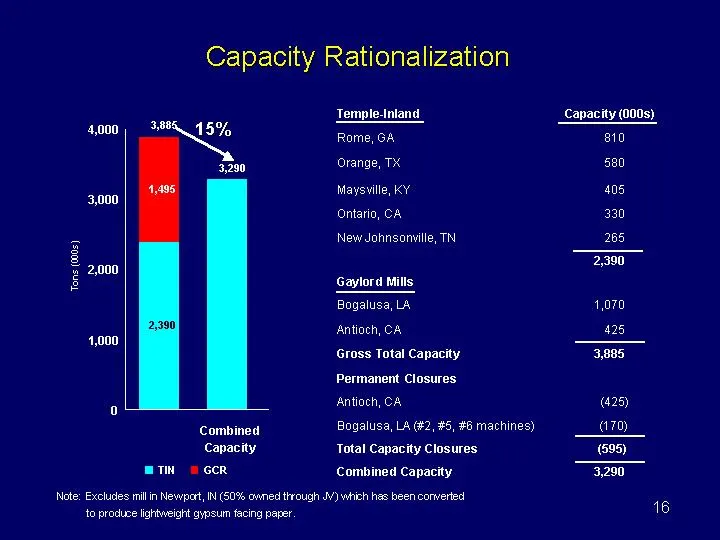
Capacity Rationalization Note: Excludes mill in Newport, IN (50% owned through JV) which has been converted to produce lightweight gypsum facing paper. Temple-Inland Capacity (000s) Rome, GA 810 Orange, TX 580 Maysville, KY 405 Ontario, CA 330 New Johnsonville, TN 265 Gaylord Mills 2,390 Bogalusa, L
Slide 17: Increased Integration Through Acquisitions
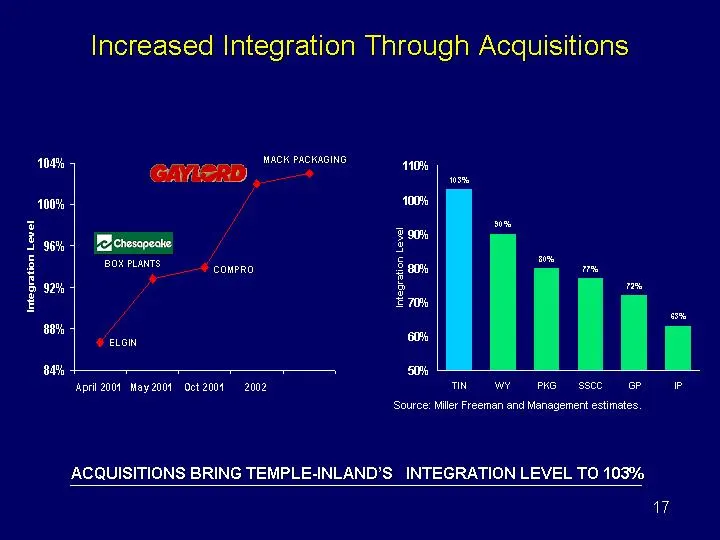
Increased Integration Through Acquisitions April 2001 May 2001 Oct 2001 2002 East 0.867 0.928 0.939 1.02 1.03 ELGIN BOX PLANTS COMPRO ACQUISITIONS BRING TEMPLE-INLAND'S INTEGRATION LEVEL TO 103% Source: Miller Freeman and Management estimates. 17 MACK PACKAGING
Slide 18: Provides Significant Opportunities for Synergies
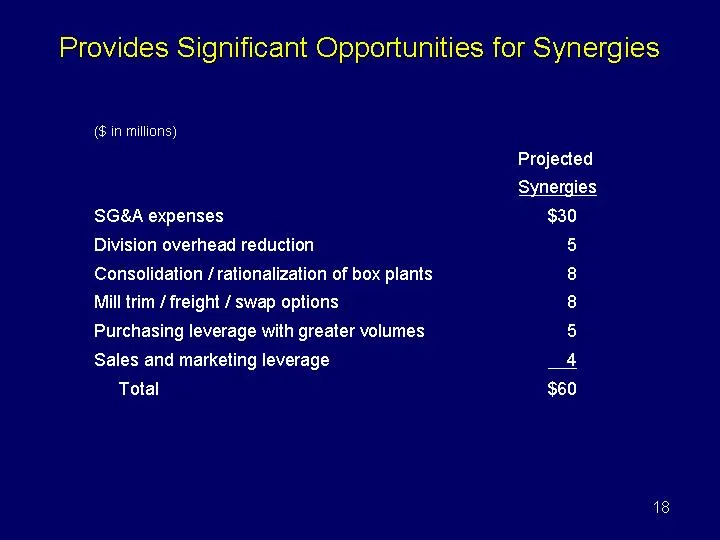
Provides Significant Opportunities for Synergies ($ in millions) Projected Synergies SG&A expenses $30 Division overhead reduction 5 Consolidation / rationalization of box plants 8 Mill trim / freight / swap options 8 Purchasing leverage with greater volumes 5 Sales and marketing leverage 4 Total $6
Slide 19: Reduces Investment from Sale of Non-Core Assets
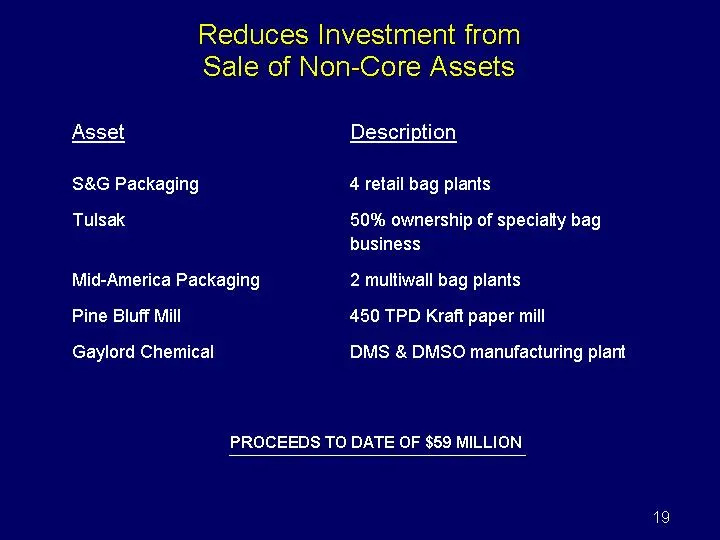
Reduces Investment from Sale of Non-Core Assets Asset Description S&G Packaging 4 retail bag plants Tulsak 50% ownership of specialty bag business Mid-America Packaging 2 multiwall bag plants Pine Bluff Mill 450 TPD Kraft paper mill Gaylord Chemical DMS & DMSO manufacturing plant PROCEEDS TO DATE OF
Slide 20: Maintain Financial Flexibility
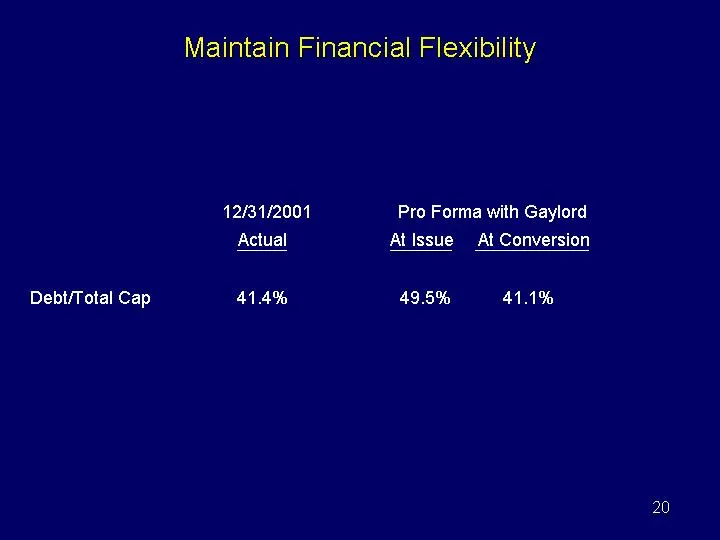
Maintain Financial Flexibility 20 12/31/2001 Pro Forma with Gaylord Actual At Issue At Conversion Debt/Total Cap 41.4% 49.5% 41.1%
Slide 21: Significant Pro Forma EPS Accretion
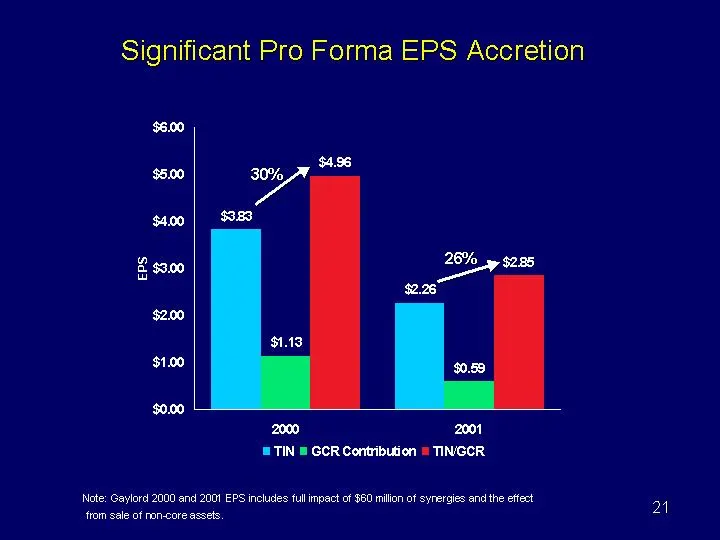
Significant Pro Forma EPS Accretion Note: Gaylord 2000 and 2001 EPS includes full impact of $60 million of synergies and the effect from sale of non-core assets. 30% 30% 26% 21
Slide 22: Average ROI (1992-2001)
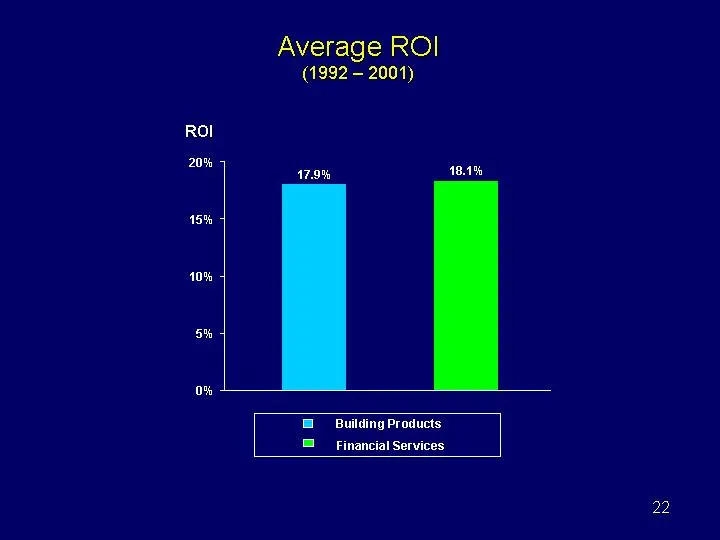
Average ROI (1992 - 2001) 22 ROI Building Products Financial Services 17.9% 0% 5% 10% 15% 20% 18.1%
Slide 23: Building Products Group
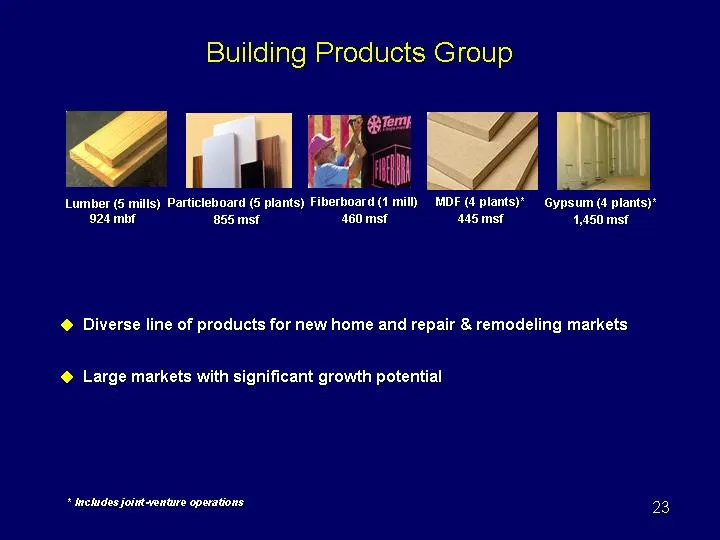
Building Products Group Lumber (5 mills) 924 mbf Particleboard (5 plants) 855 msf Fiberboard (1 mill) 460 msf MDF (4 plants)* 445 msf Gypsum (4 plants)* 1,450 msf Diverse line of products for new home and repair & remodeling markets Large markets with significant growth potential 23 * Includes joint
Slide 24: Historical and Projected Housing Activity
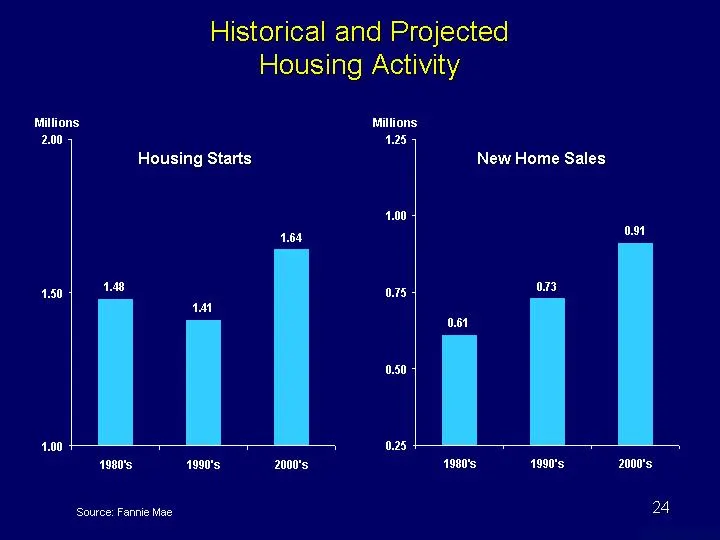
1980's 1990's 2000's 4th Qtr East 1.48 1.41 1.64 20.4 West 30.6 38.6 34.6 31.6 North 45.9 46.9 45 43.9 Historical and Projected Housing Activity Housing Starts Source: Fannie Mae 24 1980's 1990's 2000's 4th Qtr East 0.61 0.73 0.91 20.4 West 30.6 38.6 34.6 31.6 North 45.9 46.9 45 43.9 New Home Sales
Slide 25: Minority Homeownership Rates Will Continue to Climb Fastest
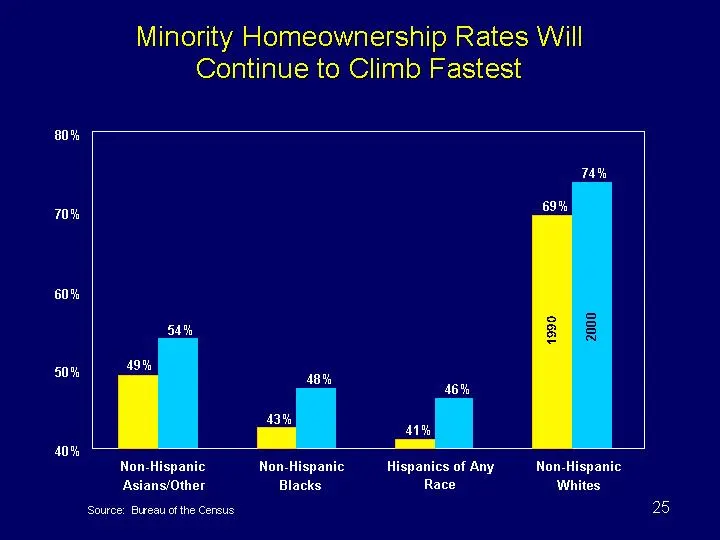
Minority Homeownership Rates Will Continue to Climb Fastest Source: Bureau of the Census 49% 43% 41% 69% 54% 48% 46% 74% 40% 50% 60% 70% 80% Non-Hispanic Asians/Other Non-Hispanic Blacks Hispanics of Any Race Non-Hispanic Whites 1990 2000 25
Slide 26: Immigrants' Homeownership Rates Climb Sharply Over Time
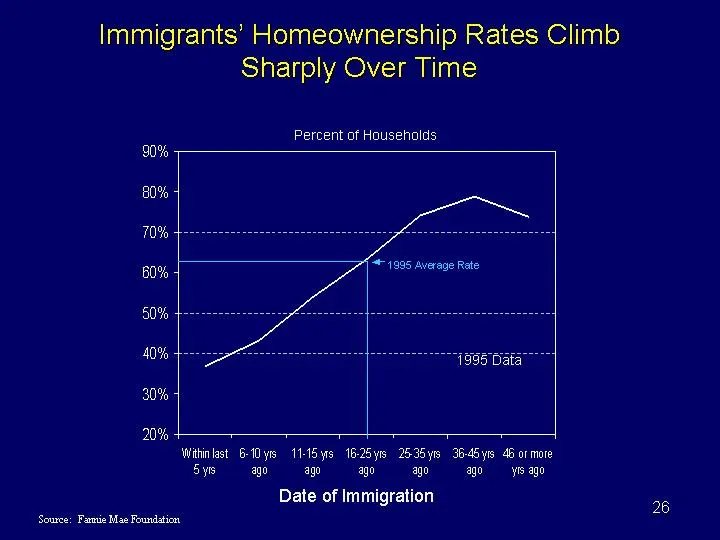
Immigrants' Homeownership Rates Climb Sharply Over Time Source: Fannie Mae Foundation Renters Within last 5 yrs 0.368 6-10 yrs ago 0.431 11-15 yrs ago 0.54 16-25 yrs ago 0.634 25-35 yrs ago 0.741 36-45 yrs ago 0.788 46 or more yrs ago 0.738 1995 Average Rate 1995 Data Date of Immigration Percent of
Slide 27: Aging Baby Boomers Will Boost Homeownership
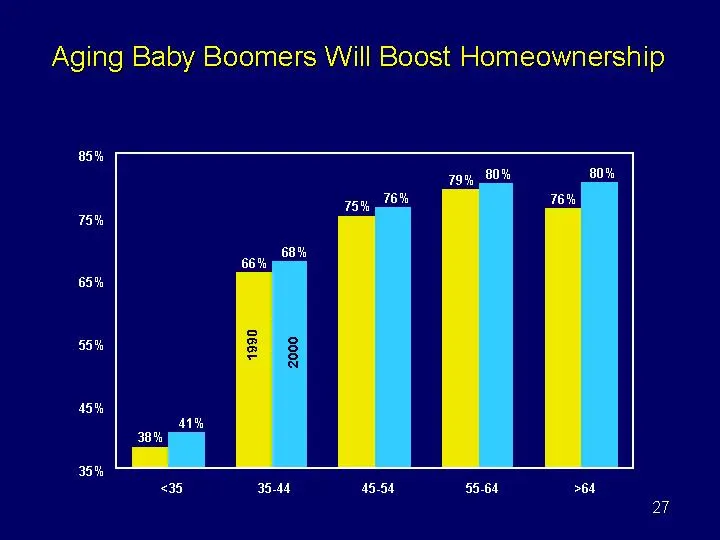
Aging Baby Boomers Will Boost Homeownership 1st Qtr 2nd Qtr 3rd Qtr 4th Qtr East 20.4 27.4 90 20.4 West 30.6 38.6 34.6 31.6 North 45.9 46.9 45 43.9 38% 66% 75% 79% 76% 41% 68% 76% 80% 80% 35% 45% 55% 65% 75% 85% <35 35-44 45-54 55-64 >64 1990 2000 27
Slide 28: Timberlands
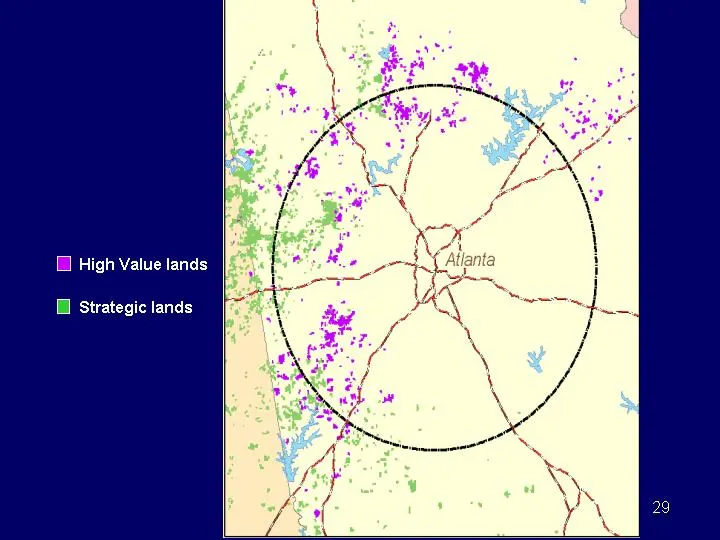
Timberlands 2.1 million acres of timberland in Texas, Louisiana, Georgia and Alabama Strategic (1.8 million acres): - 45% of virgin fiber for containerboard mills - 60% of raw materials for building products High Value (160,000 acres): - Higher value as developed real estate Non-Strategic (110,000 a
Slide 29: Timberlands map
Map 29 High Value lands Strategic lands
Slide 30: Financial Services Group
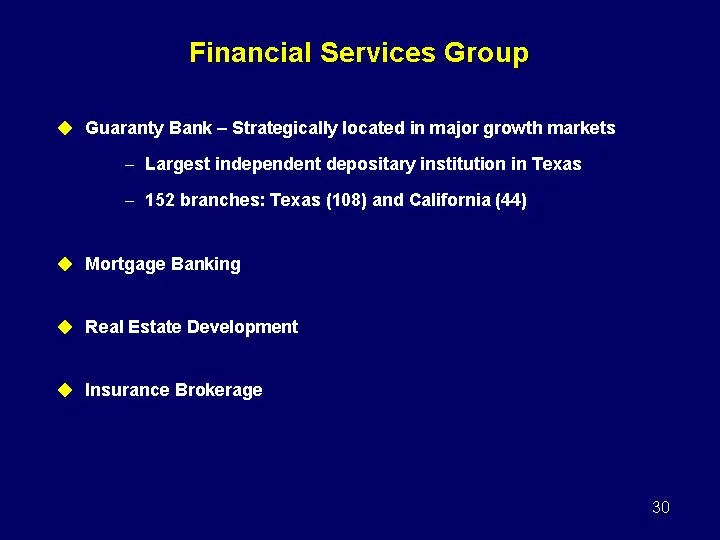
Financial Services Group Guaranty Bank - Strategically located in major growth markets Largest independent depositary institution in Texas 152 branches: Texas (108) and California (44) Mortgage Banking Real Estate Development Insurance Brokerage 30
Slide 31: Financial Services Highlights
Financial Services Highlights Retail Deposits: Focus on customers who value high touch, high service - - Largest segment of financial services market - - Poised for continued growth because of demographic trends Lending: National platform Diversified by geography and product Conservative credit cult
Slide 32: Financial Services: Earnings Growth & High Returns
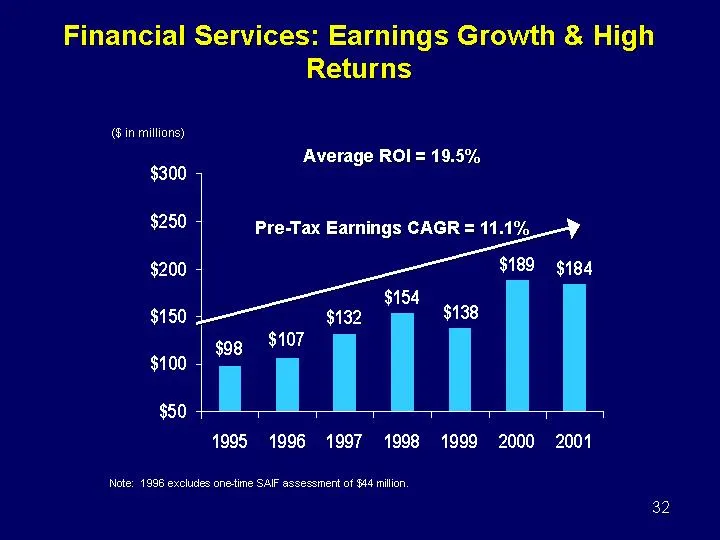
Financial Services: Earnings Growth & High Returns 1995 1996 1997 1998 1999 2000 2001 Pre-tax Earnings 98 107 132 154 138 189 184 ($ in millions) Average ROI = 19.5% Pre-Tax Earnings CAGR = 11.1% Note: 1996 excludes one-time SAIF assessment of $44 million. 32
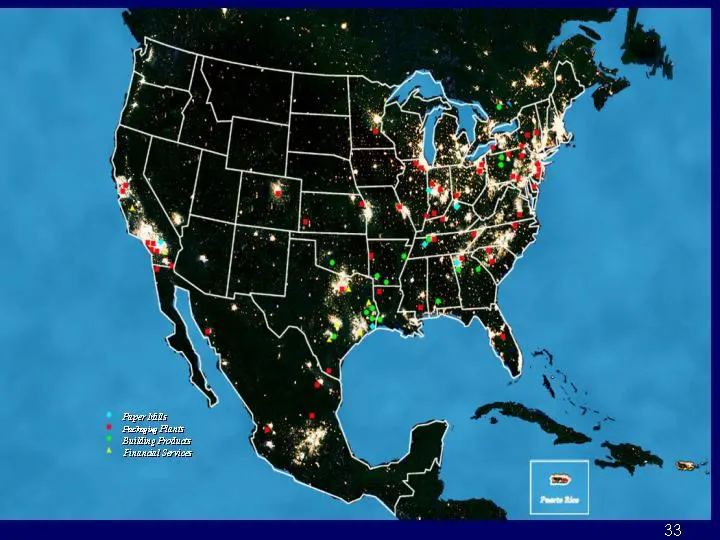
Slide 33: Paper Mills, Packaging Plants, Building Products, Financial Services
Paper Mills Packaging Plants Building Products Financial Services 33

Slide 34: 34
34
Source: SEC EDGAR · 8-K filed Sep 26, 2002
More decks from Temple-Inland Inc
 Q2 2011 Earnings Presentation17 slides · Jul 21, 2011
 Proxy Contest (June 2011)43 slides · Jun 20, 2011
 Merger or Acquisition (June 2011)38 slides · Jun 6, 2011
 Q1 2011 Earnings Presentation16 slides · Apr 20, 2011
 Investor Presentation (February 2011)35 slides · Feb 14, 2011
 Q4 2010 Earnings Presentation28 slides · Feb 8, 2011