Ntelos — Investor Presentation (March 2010)
28 slides from Ntelos's investor presentation, Mar 4, 2010

Slide 1: Investor Presentation Year End 2009 Update
Exhibit 99.1 Investor Presentation Year End 2009 Update
Slide 2: Use of Non-GAAP Financial Measures
Use of Non-GAAP Financial Measures Included in this presentation are certain non-GAAP financial measures that are not determined in accordance with US generally accepted accounting principles. These financial performance measures are not indicative of cash provided or used by operating activities an
Slide 3: Special Note Regarding Forward-Looking Statements
Special Note Regarding Forward-Looking Statements Any statements contained in this presentation that are not statements of historical fact, including statements about our beliefs and expectations, are forward-looking statements and should be evaluated as such. The words "anticipates," "believes," "e
Slide 4: Special Note Regarding Forward-Looking Statements (cont.)
Special Note Regarding Forward-Looking Statements (cont.) include, but are not limited to: rapid development and intense competition in the telecommunications industry; adverse economic conditions; operating and financial restrictions imposed by our senior credit facilities and other indebtedness; o

Slide 5: Company Overview
* * * * * * * * * * * * * * * * ***** ***** Company Overview ***** ***
Slide 6: Company Overview
Company Overview • Leading provider of wireless and wireline communicationsservicesin Virginia, Pennsylvania and West Virginia • Strategies • Facilities based • Retail & Wholesale • Multiple products • Leverage brand • Leverage common cost • Wireless revenue 5-year CAGR of 11% • Exclusive strategic
Slide 7: Regionally-Focused Service Provider
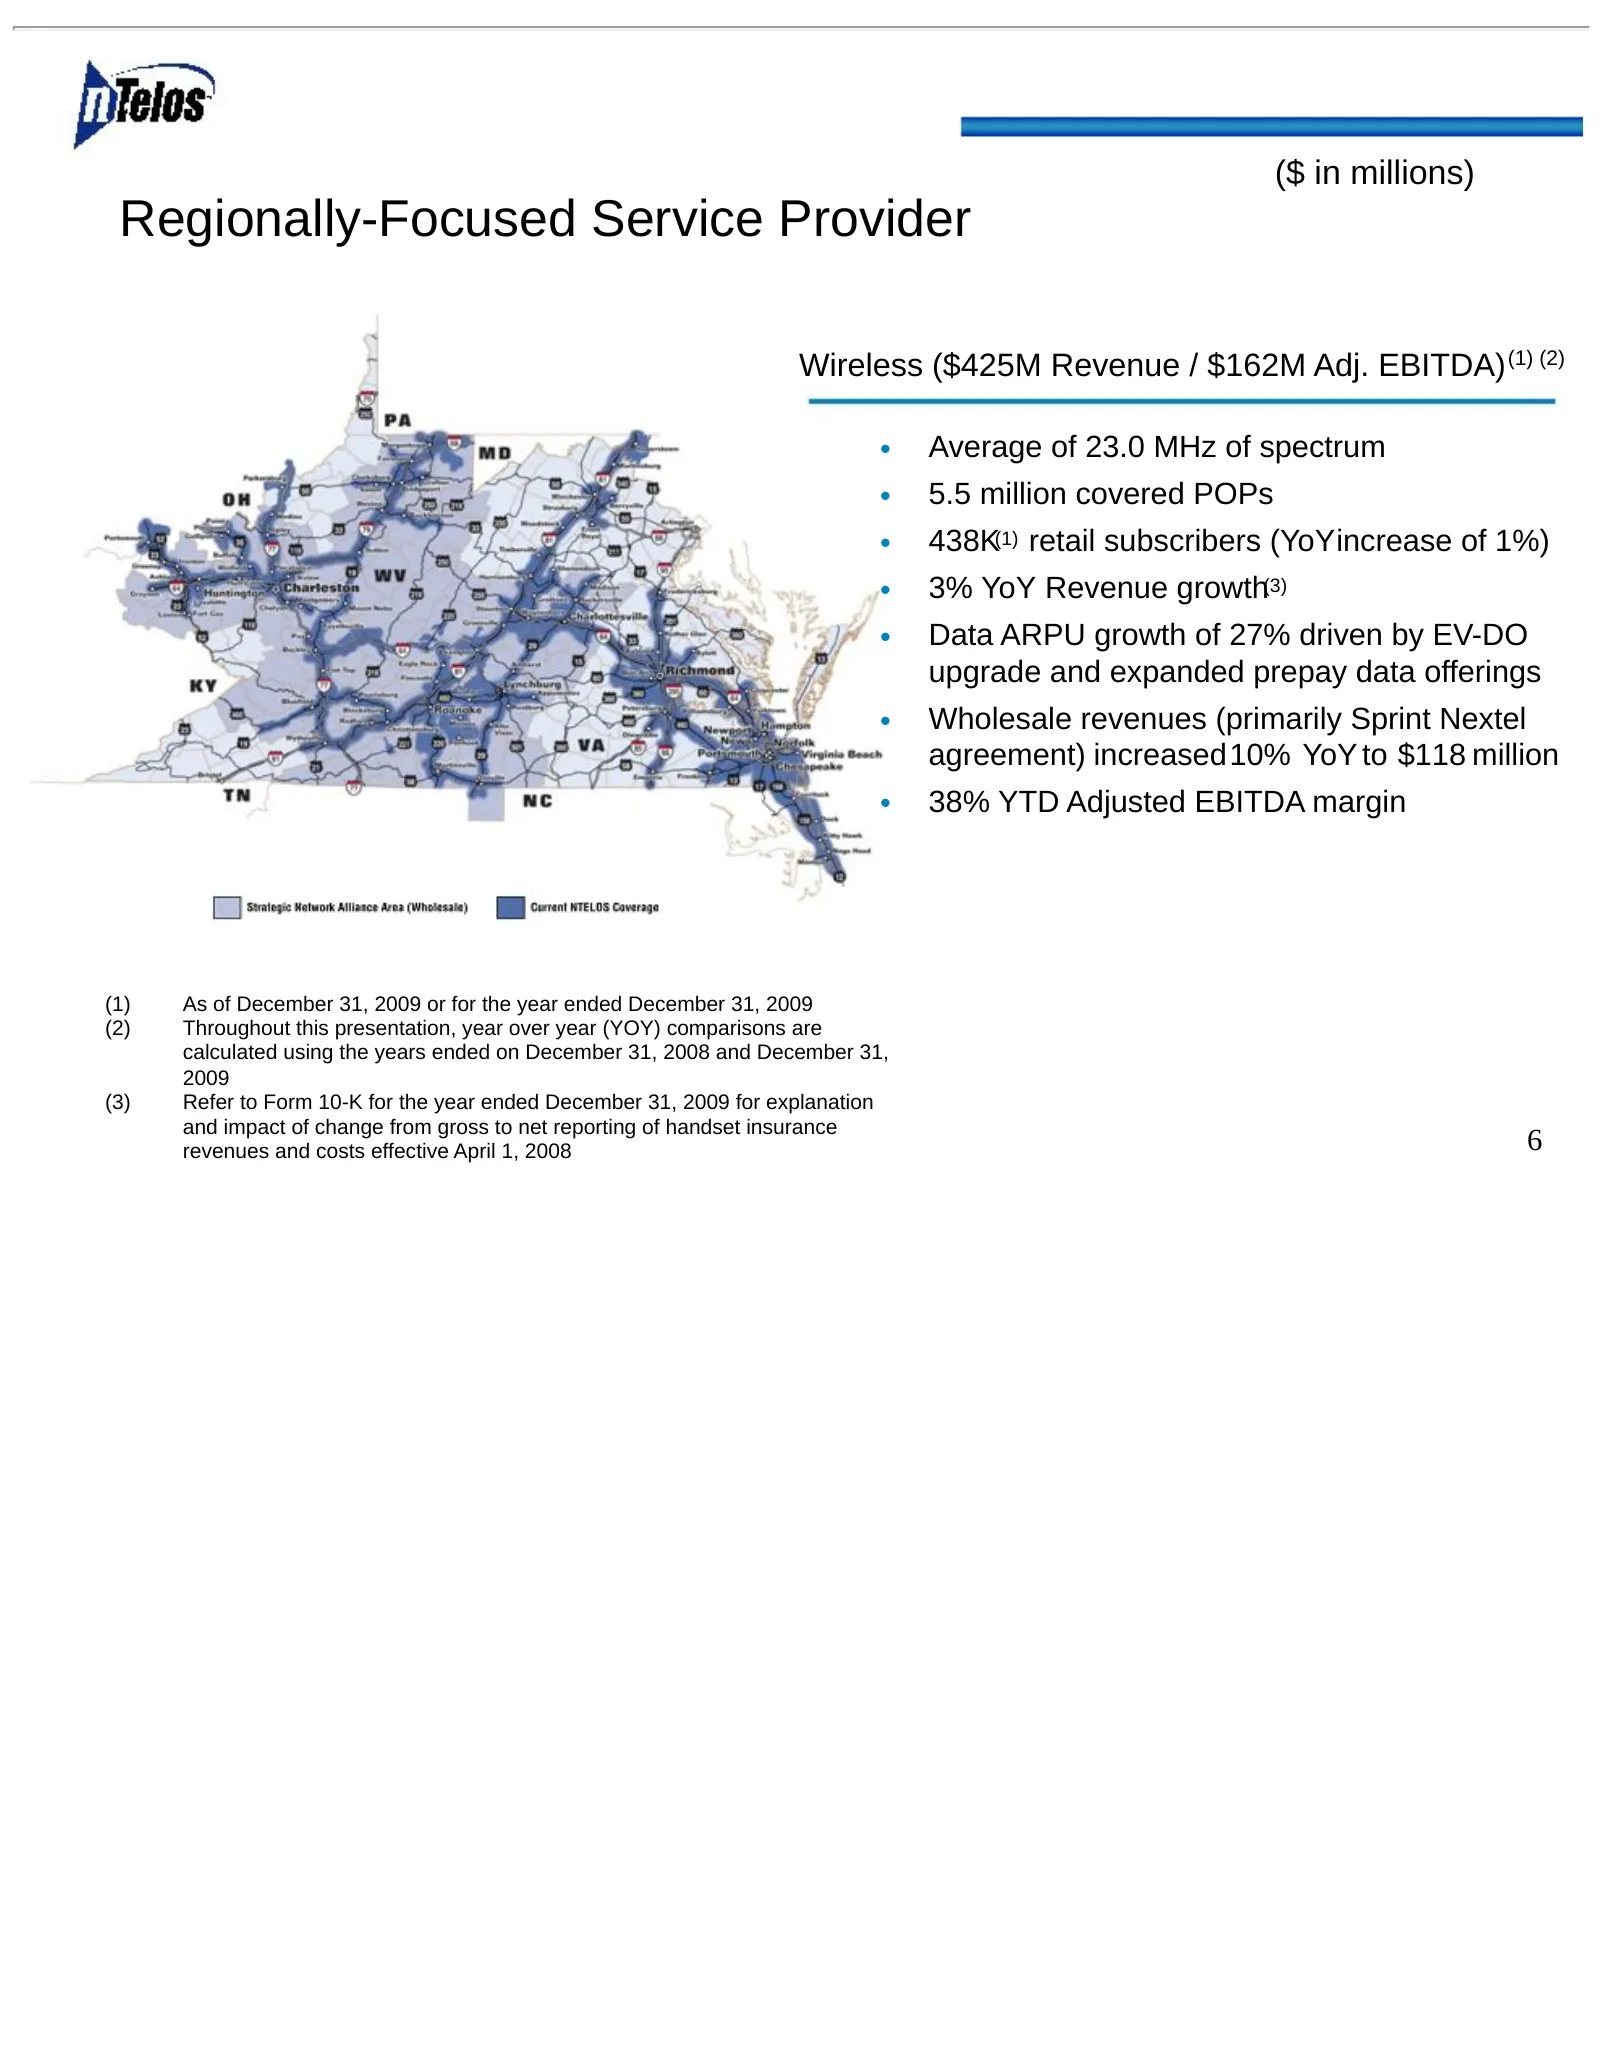
($ in millions) Regionally-Focused Service Provider Wireless ($425M Revenue / $162M Adj. EBITDA) (1) (2) • Average of 23.0 MHz of spectrum • 5.5 million covered POPs • 438K(1) retail subscribers (YoYincrease of 1%) • 3% YoY Revenue growth(3) • Data ARPU growth of 27% driven by EV-DO upgrade and expa
Slide 8: Wireline: Repositioning as High Speed Data Provider
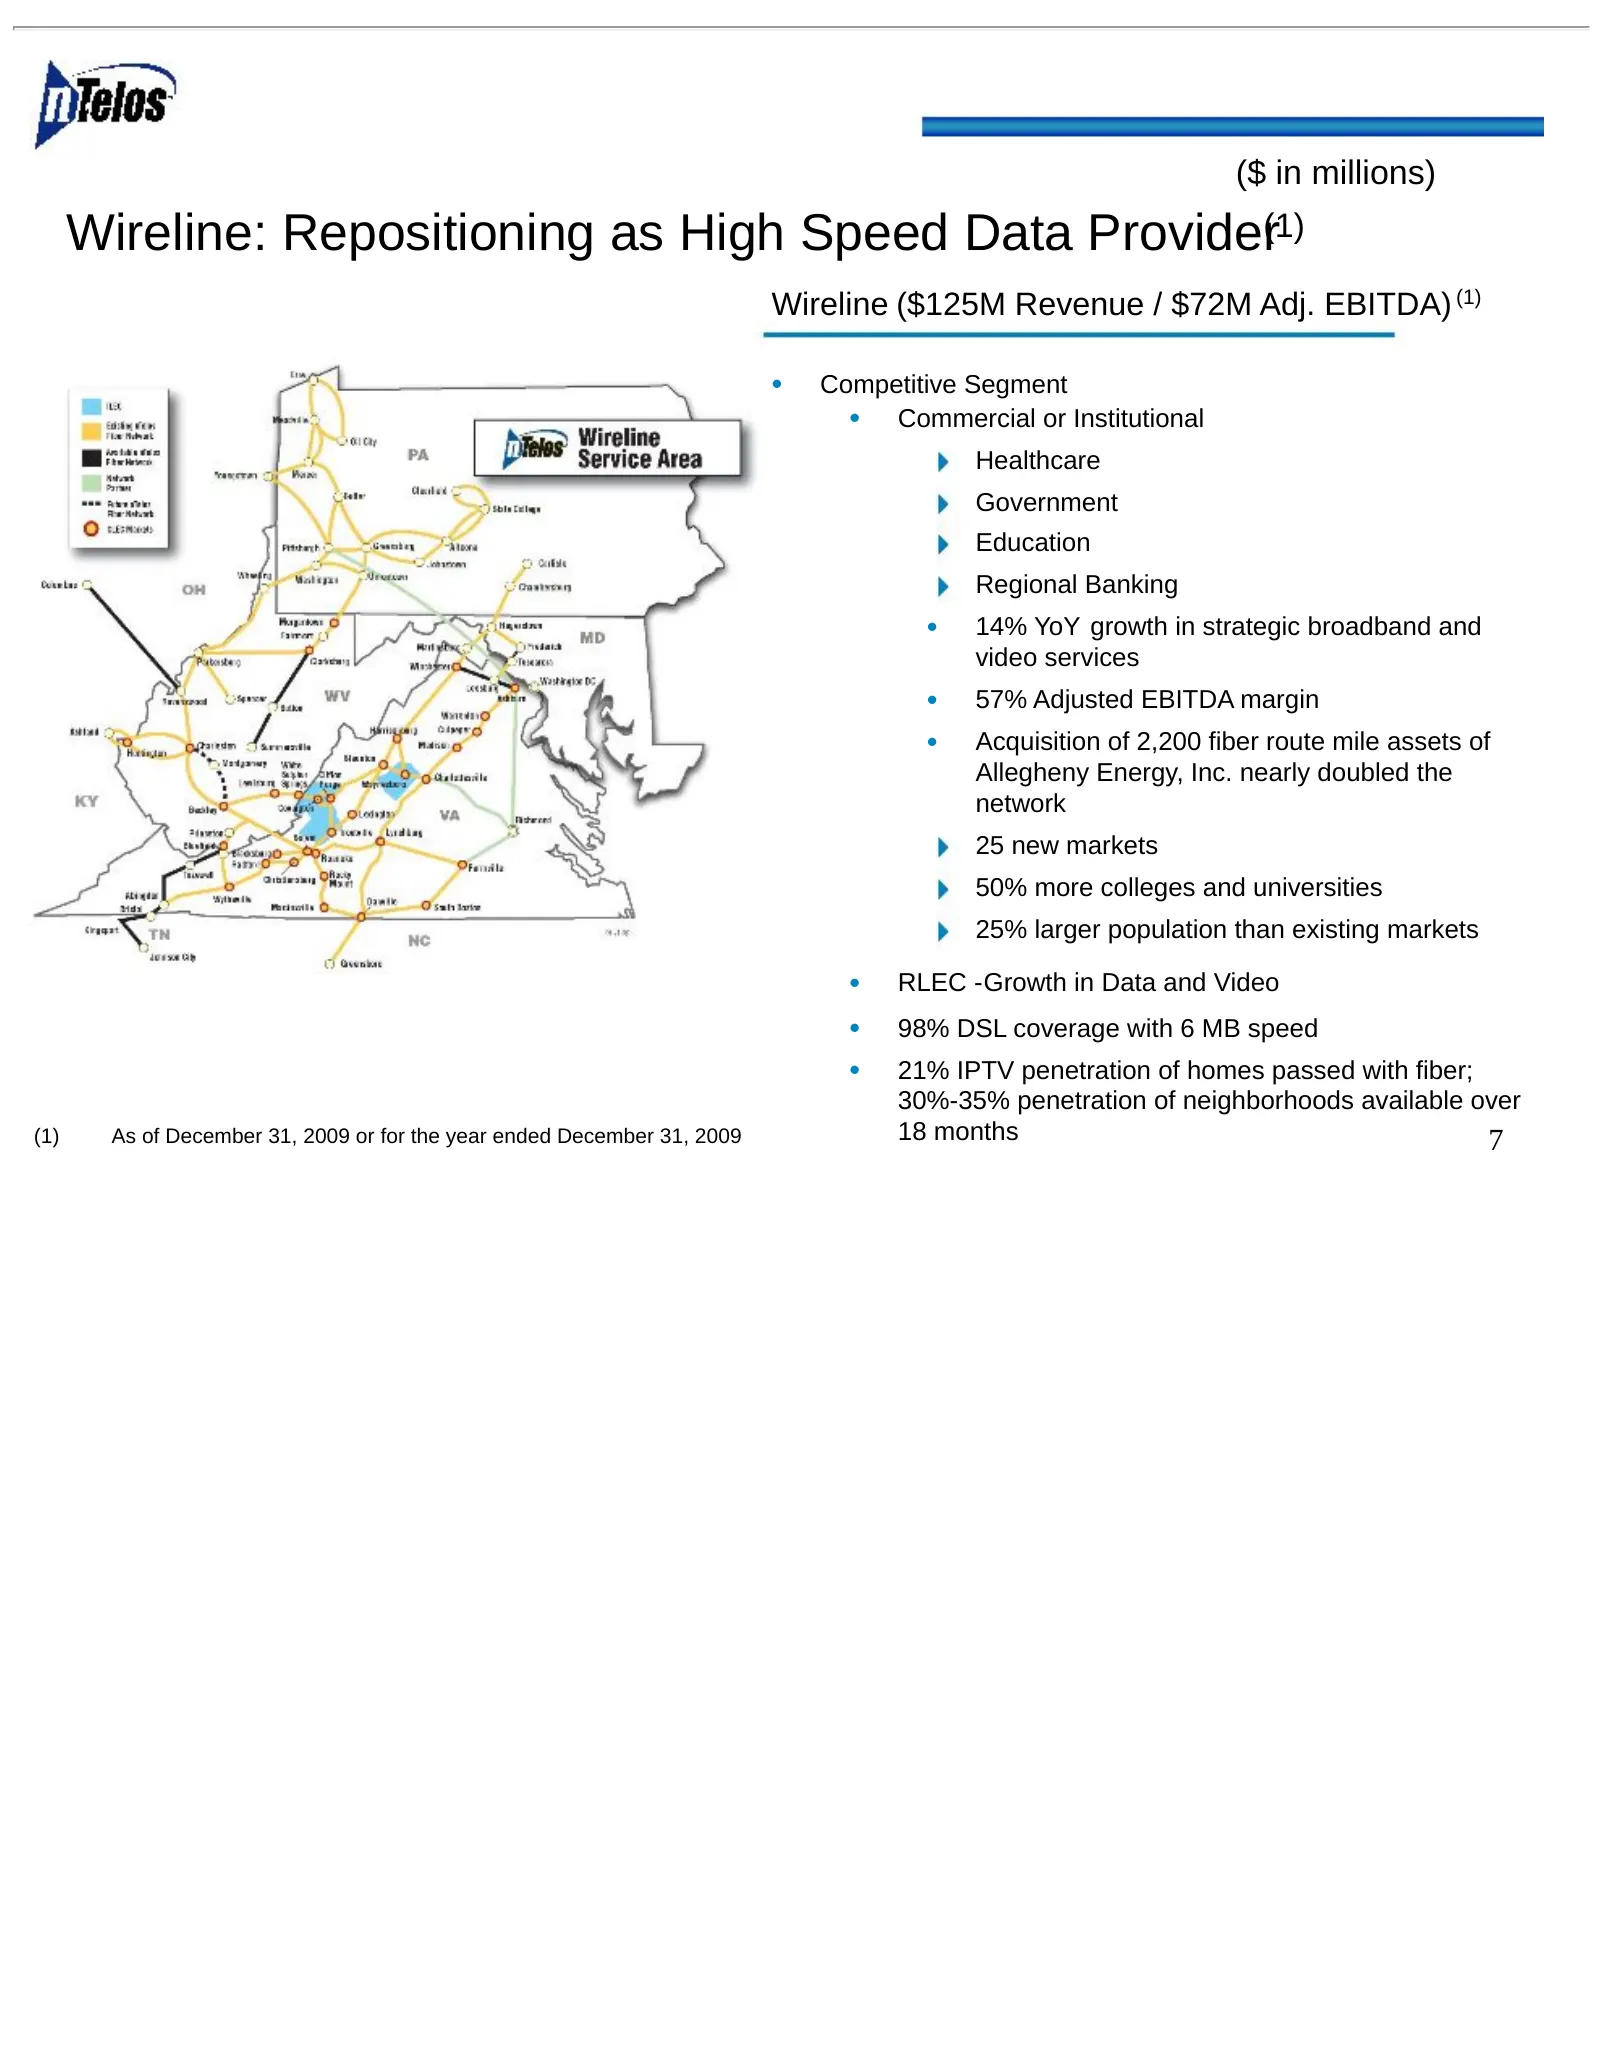
($ in millions) Wireline: Repositioning as High Speed Data Provider(1) Wireline ($125M Revenue / $72M Adj. EBITDA) (1) • Competitive Segment • Commercial or Institutional Healthcare Government Education Regional Banking • 14% YoY growth in strategic broadband and video services • 57% Adjusted EBITDA
Slide 9: Focused on Growth Opportunities
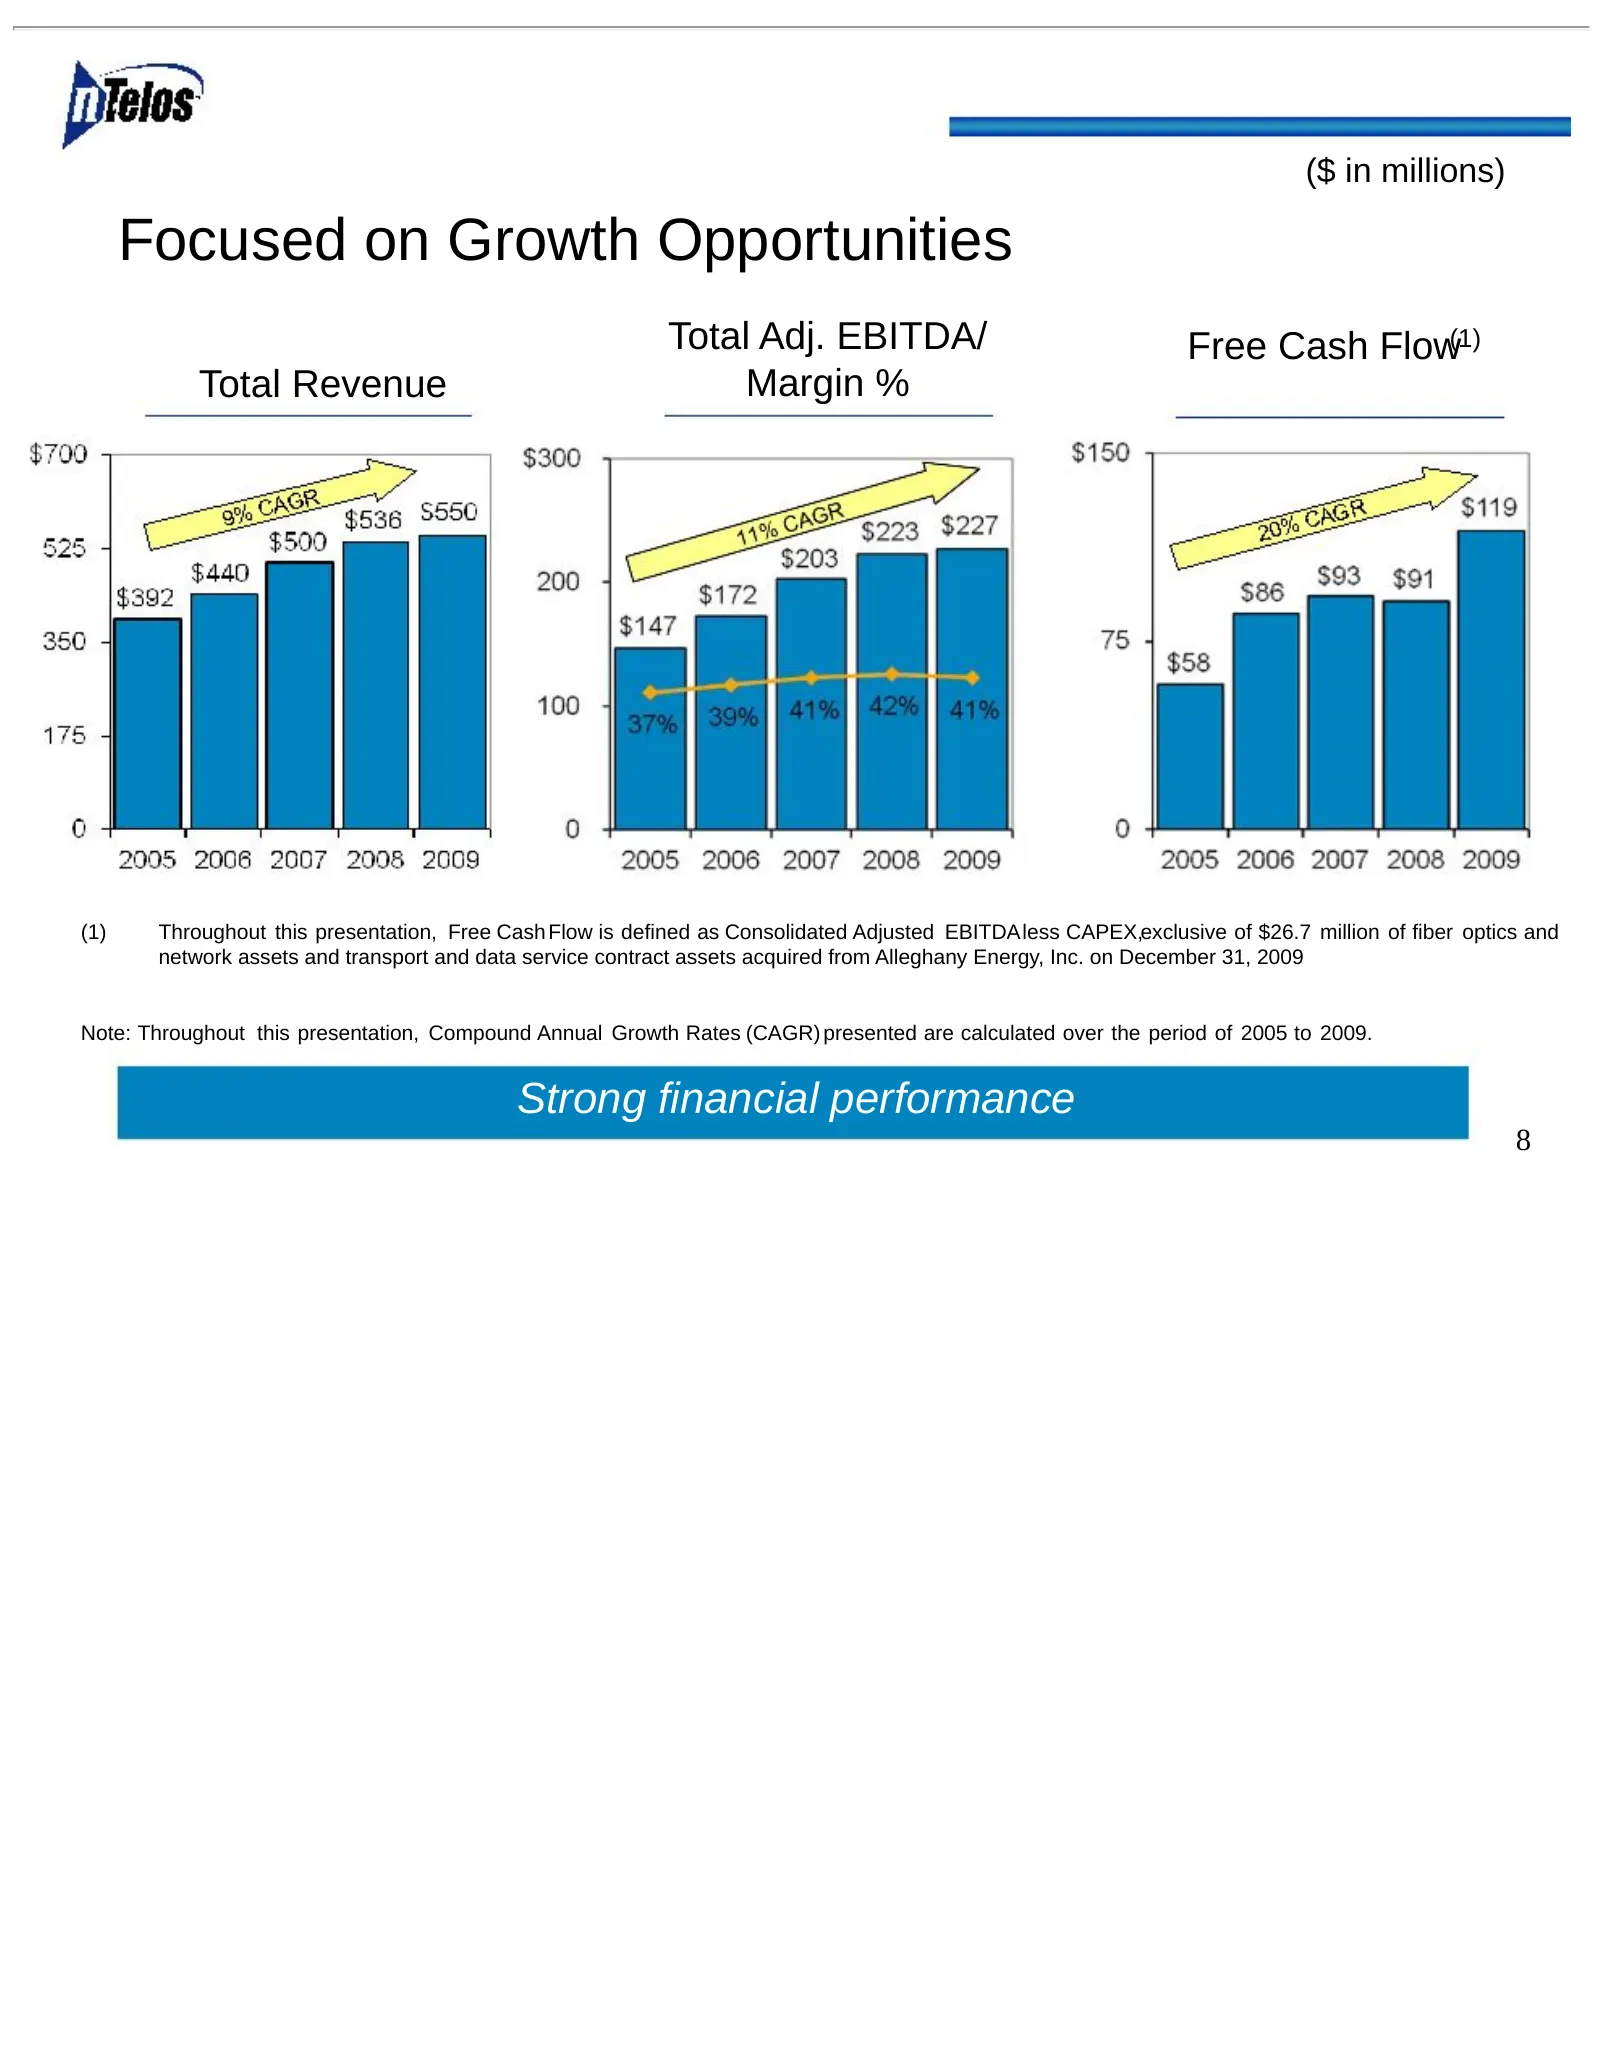
($ in millions) Focused on Growth Opportunities Total Adj. EBITDA/ Free Cash Flow(1) Total Revenue Margin % (1) Throughout this presentation, Free Cash Flow is defined as Consolidated Adjusted EBITDAless CAPEX,exclusive of $26.7 million of fiber optics and network assets and transport and data servi
Slide 10: Network Upgrade and Data Drives Wireless Growth
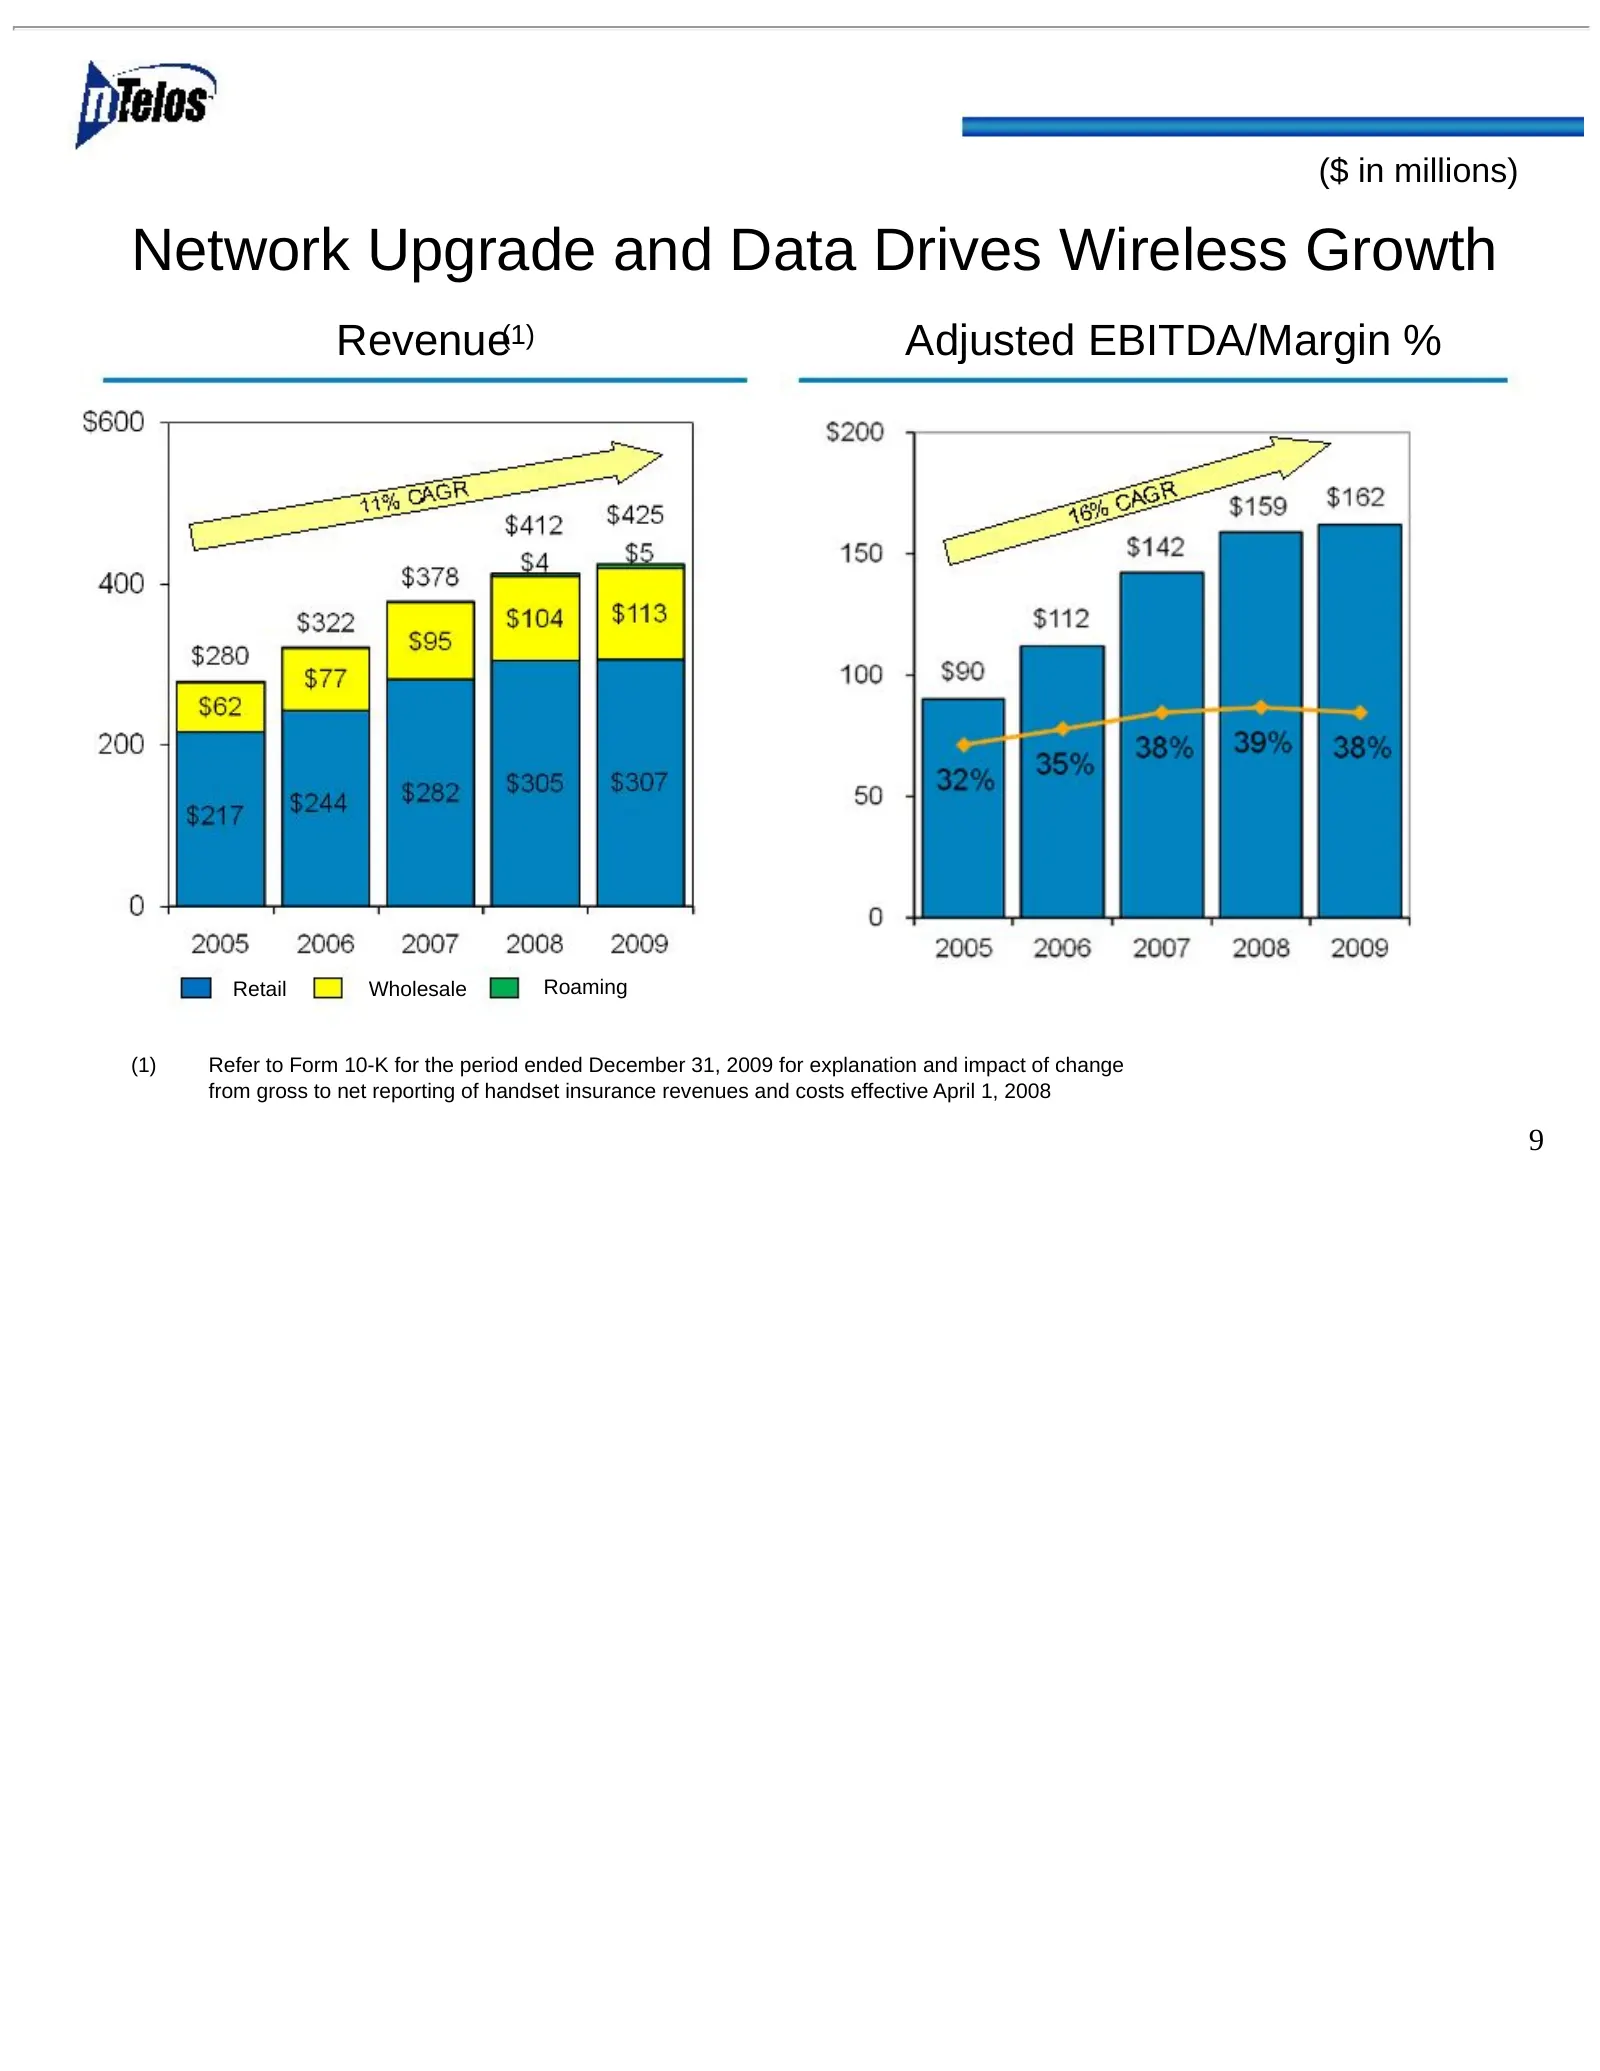
($ in millions) Network Upgrade and Data Drives Wireless Growth Revenue(1) Adjusted EBITDA/Margin % Retail Wholesale Roaming (1) Refer to Form 10-K for the period ended December 31, 2009 for explanation and impact of change from gross to net reporting of handset insurance revenues and costs effectiv
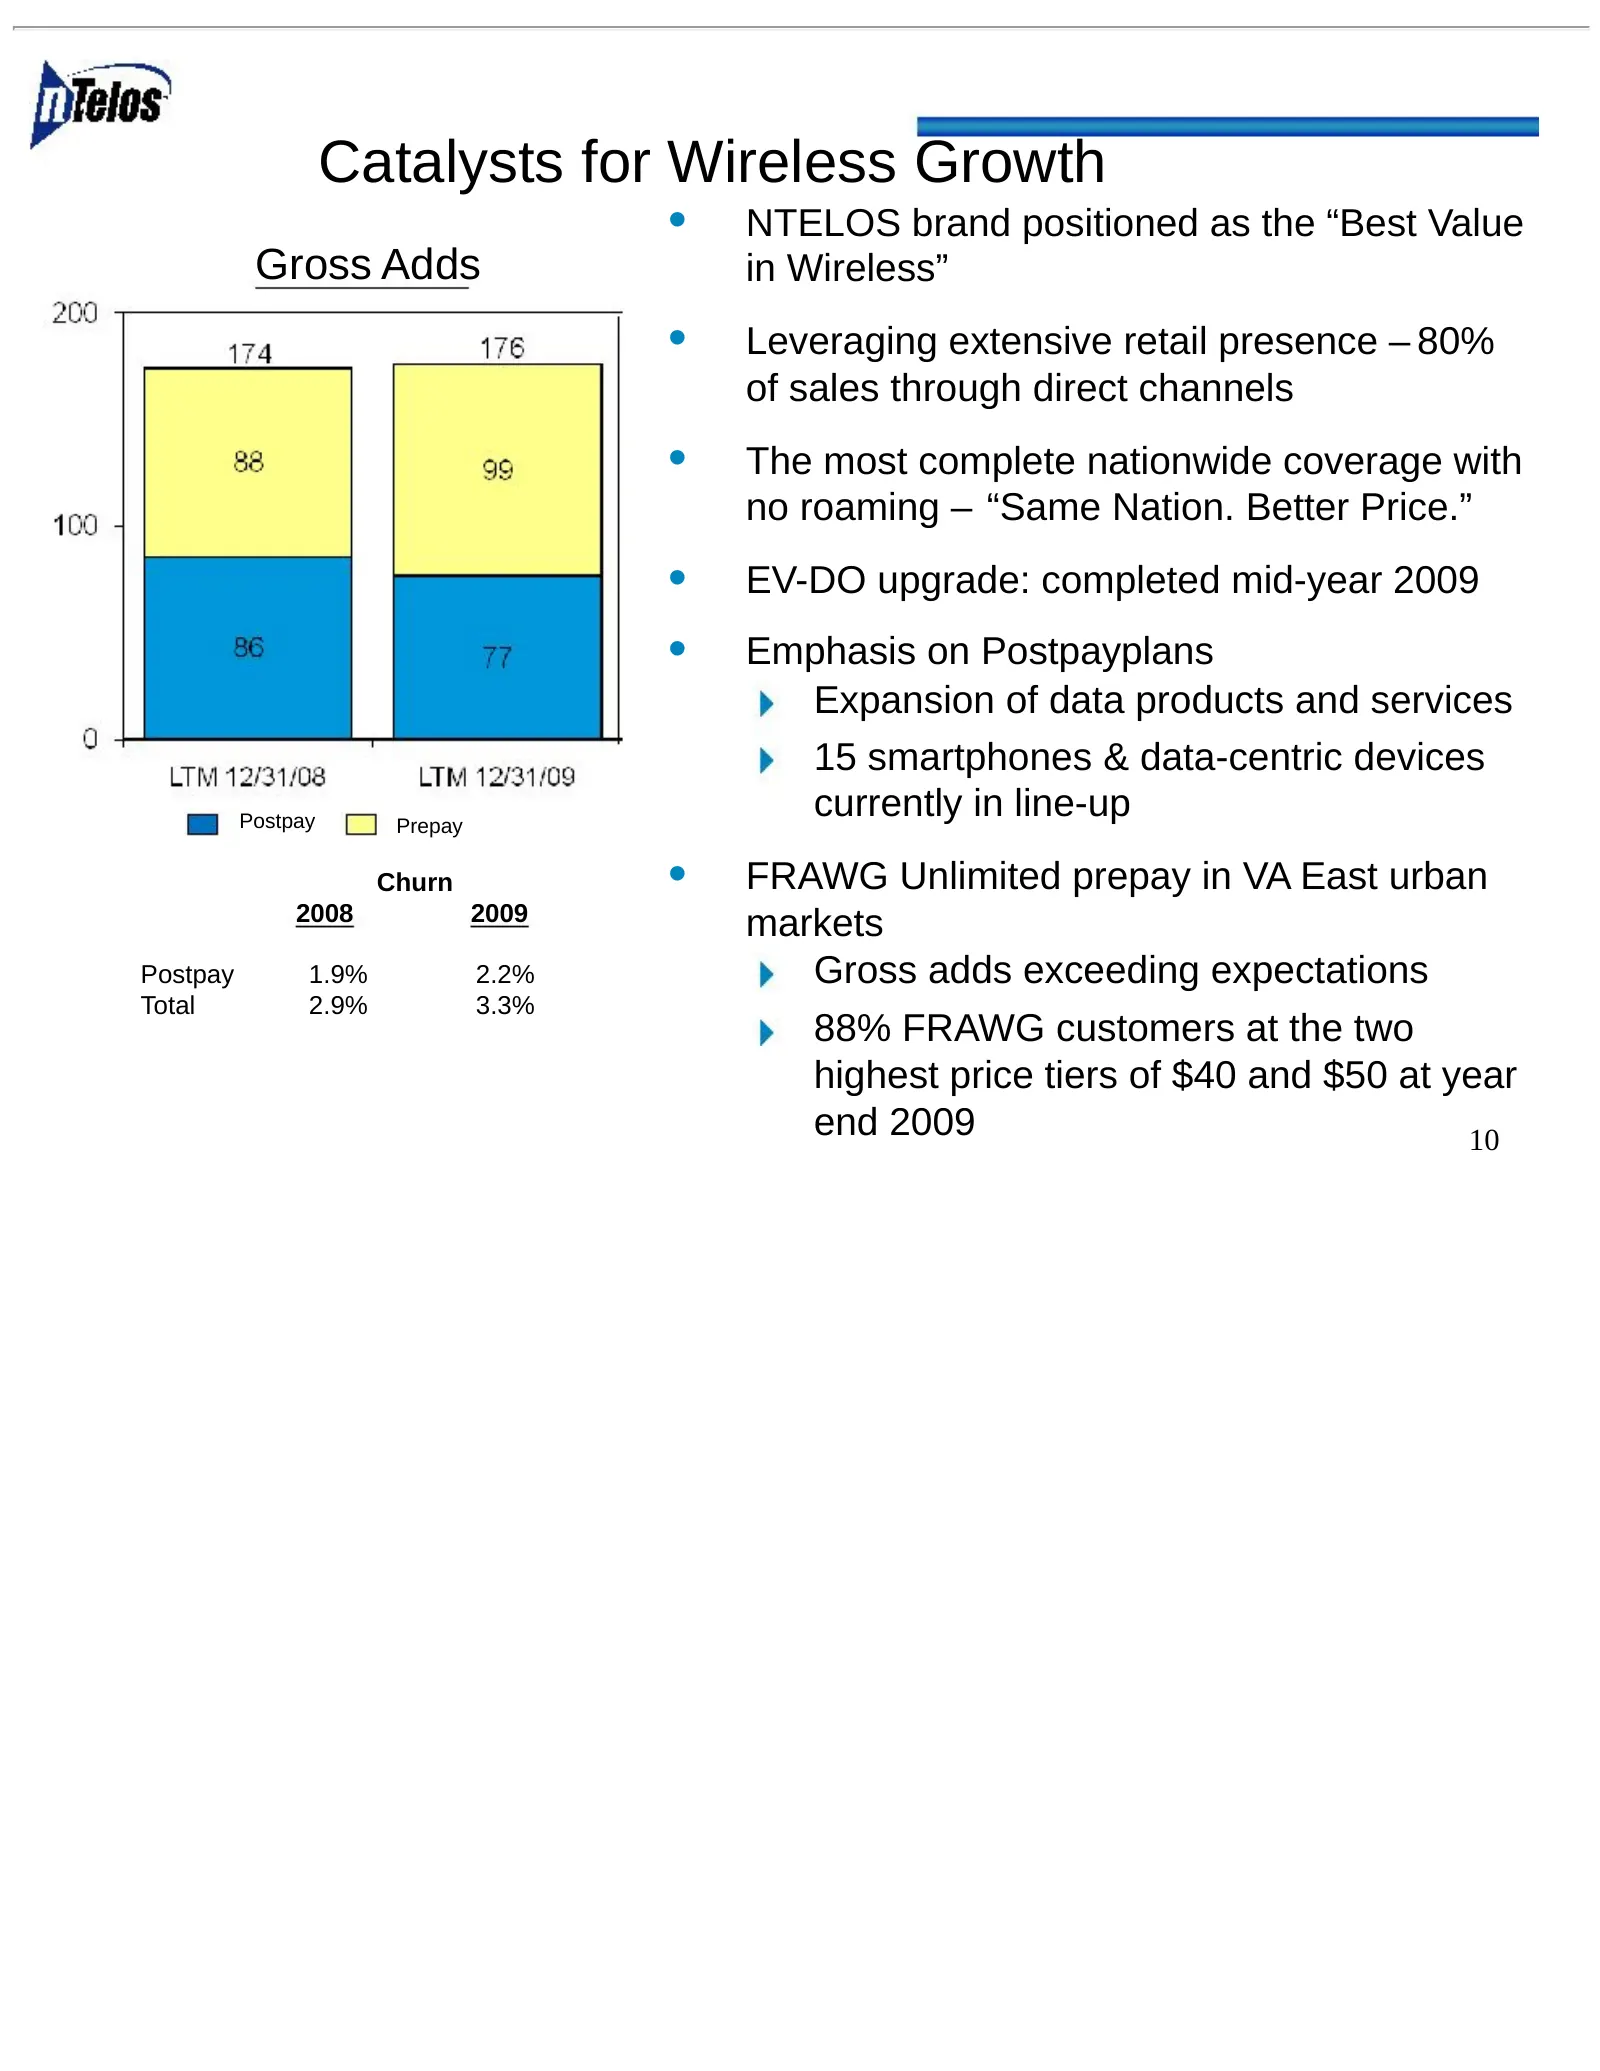
Slide 11: Catalysts for Wireless Growth
Catalysts for Wireless Growth • NTELOS brand positioned as the “Best Value Gross Adds in Wireless” • Leveraging extensive retail presence – 80% of sales through direct channels • The most complete nationwide coverage with no roaming – “Same Nation. Better Price.” • EV-DO upgrade: completed mid-year
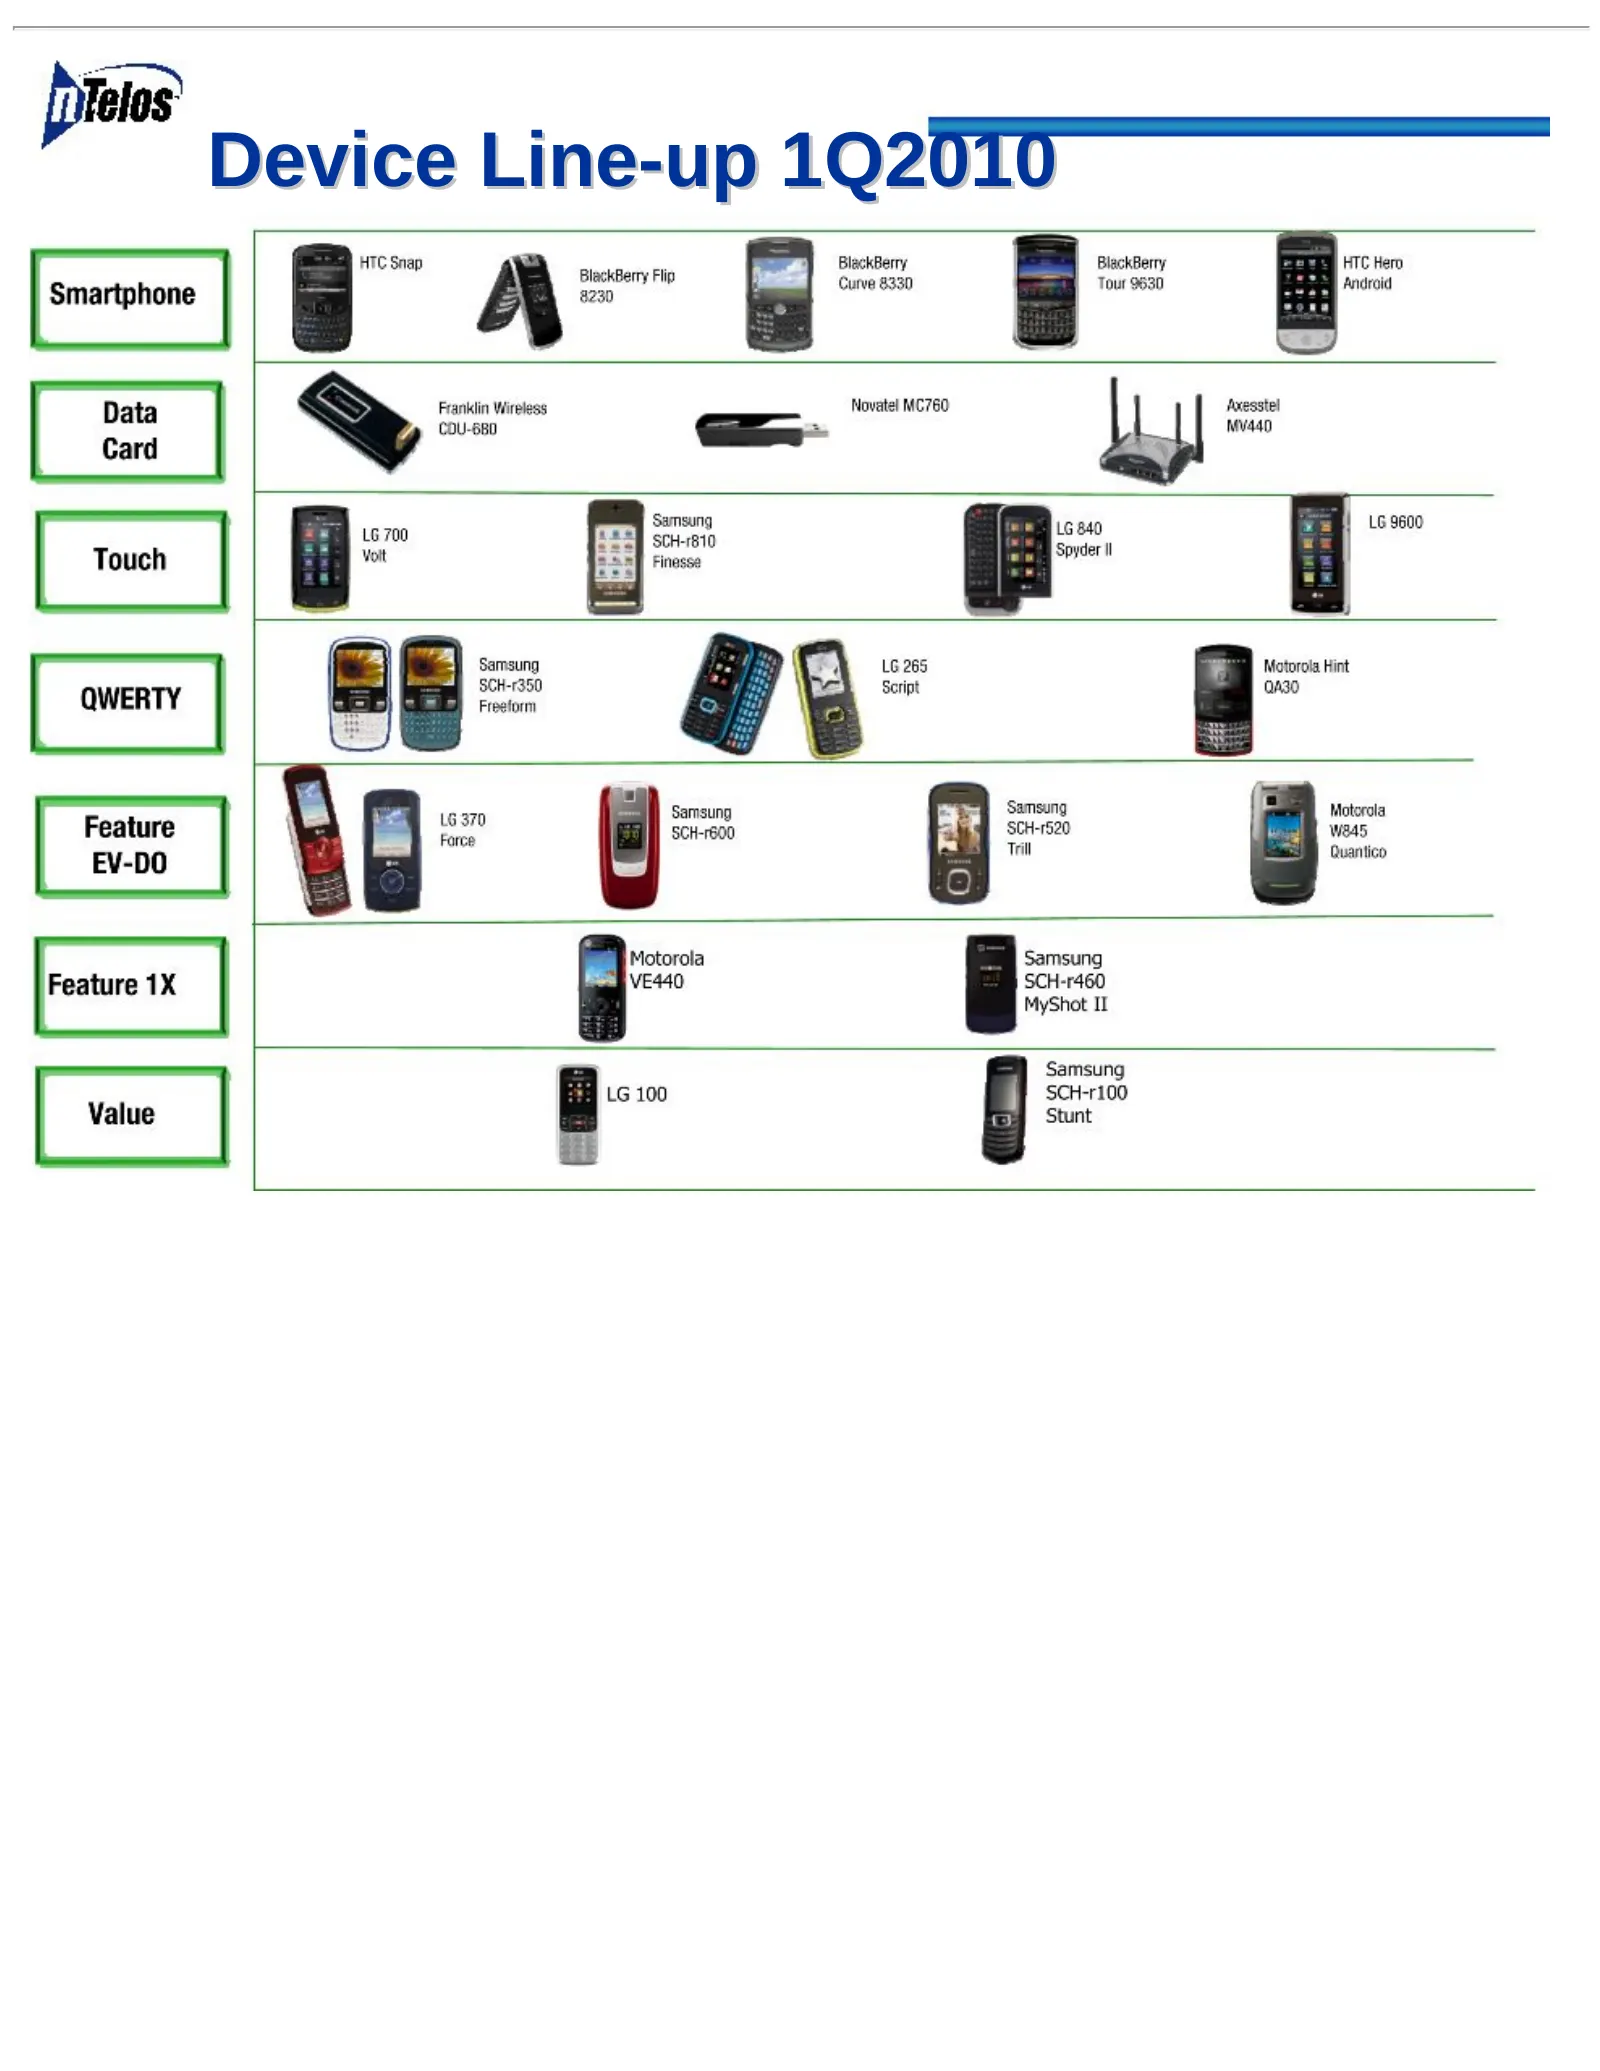
Slide 12: Device Line-up 1Q2010
Dons Smartphone Data Card Touch QWERTY Feature EV-DO Feature 1X Device Line-up 1Q2010 HTC Snap BlackBerry BlackBerry HTC Hero BlackBerry Flip Curve 8330 Tour 9630 Android 8230 Franklin Wireless Novatel MC760 Axesstel COU-680 a vaao ‘Samsung LG 9600 6700 SCH-1810 pa 4 Vott Finesse Samsung LG 265 Moto
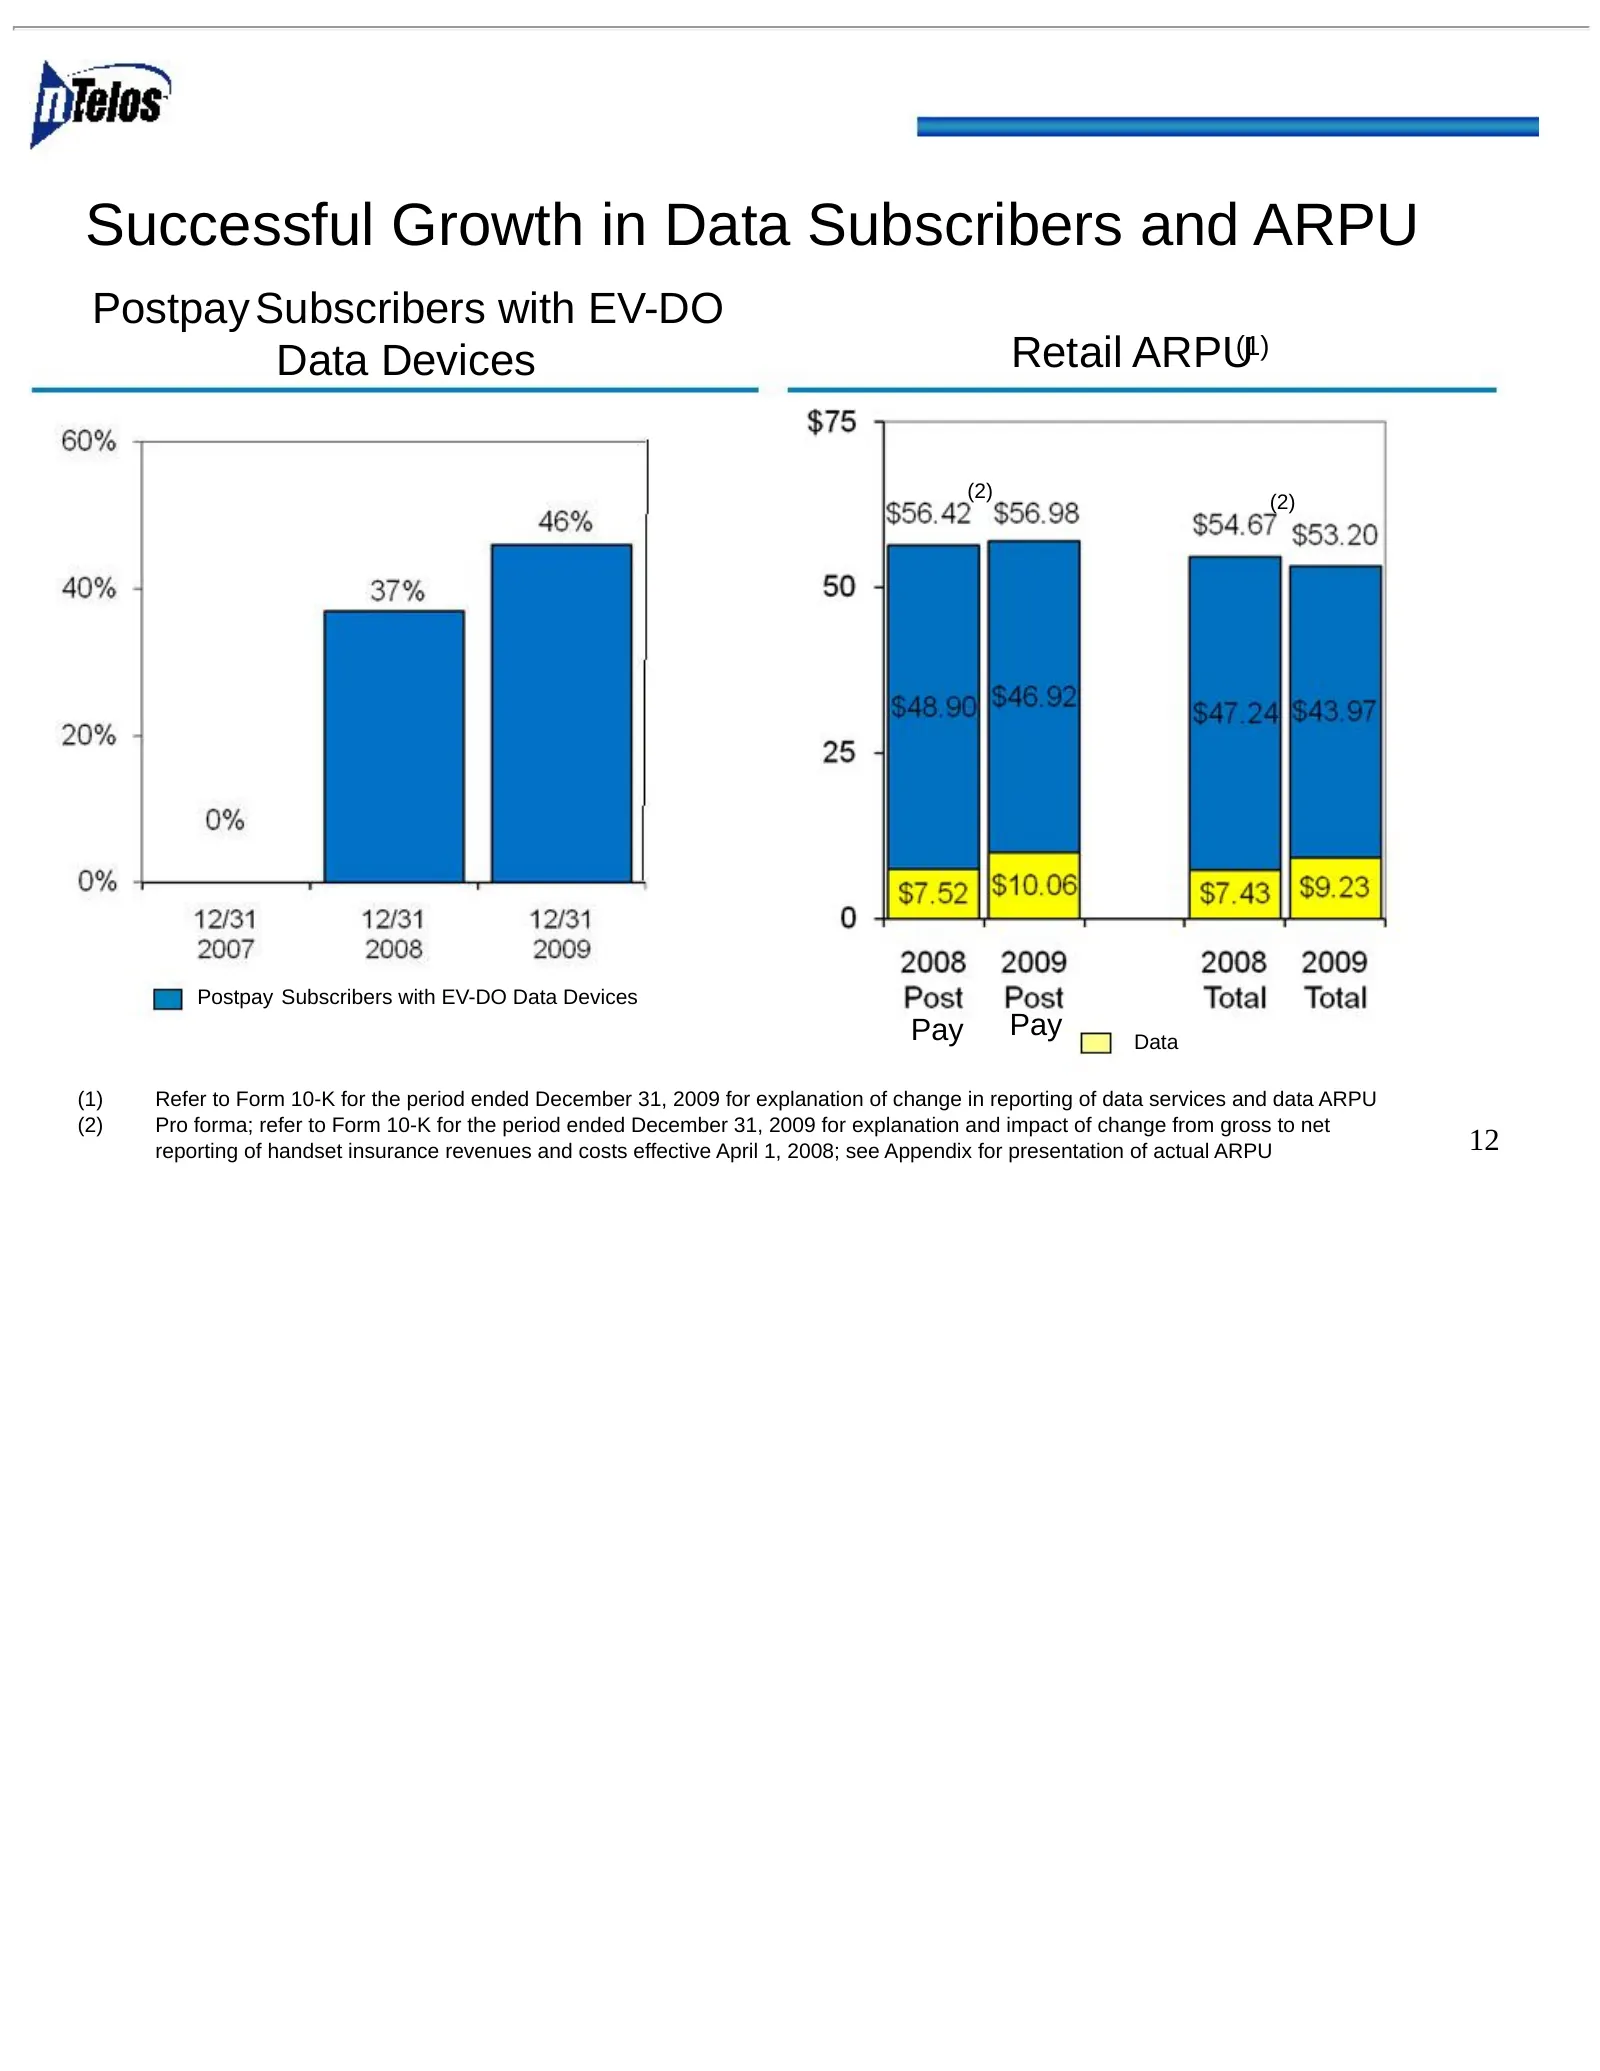
Slide 13: Successful Growth in Data Subscribers and ARPU
Successful Growth in Data Subscribers and ARPU Postpay Subscribers with EV-DO Data Devices Retail ARPU(1) (2) (2) Postpay Subscribers with EV-DO Data Devices Pay Pay Data (1) Refer to Form 10-K for the period ended December 31, 2009 for explanation of change in reporting of data services and data AR
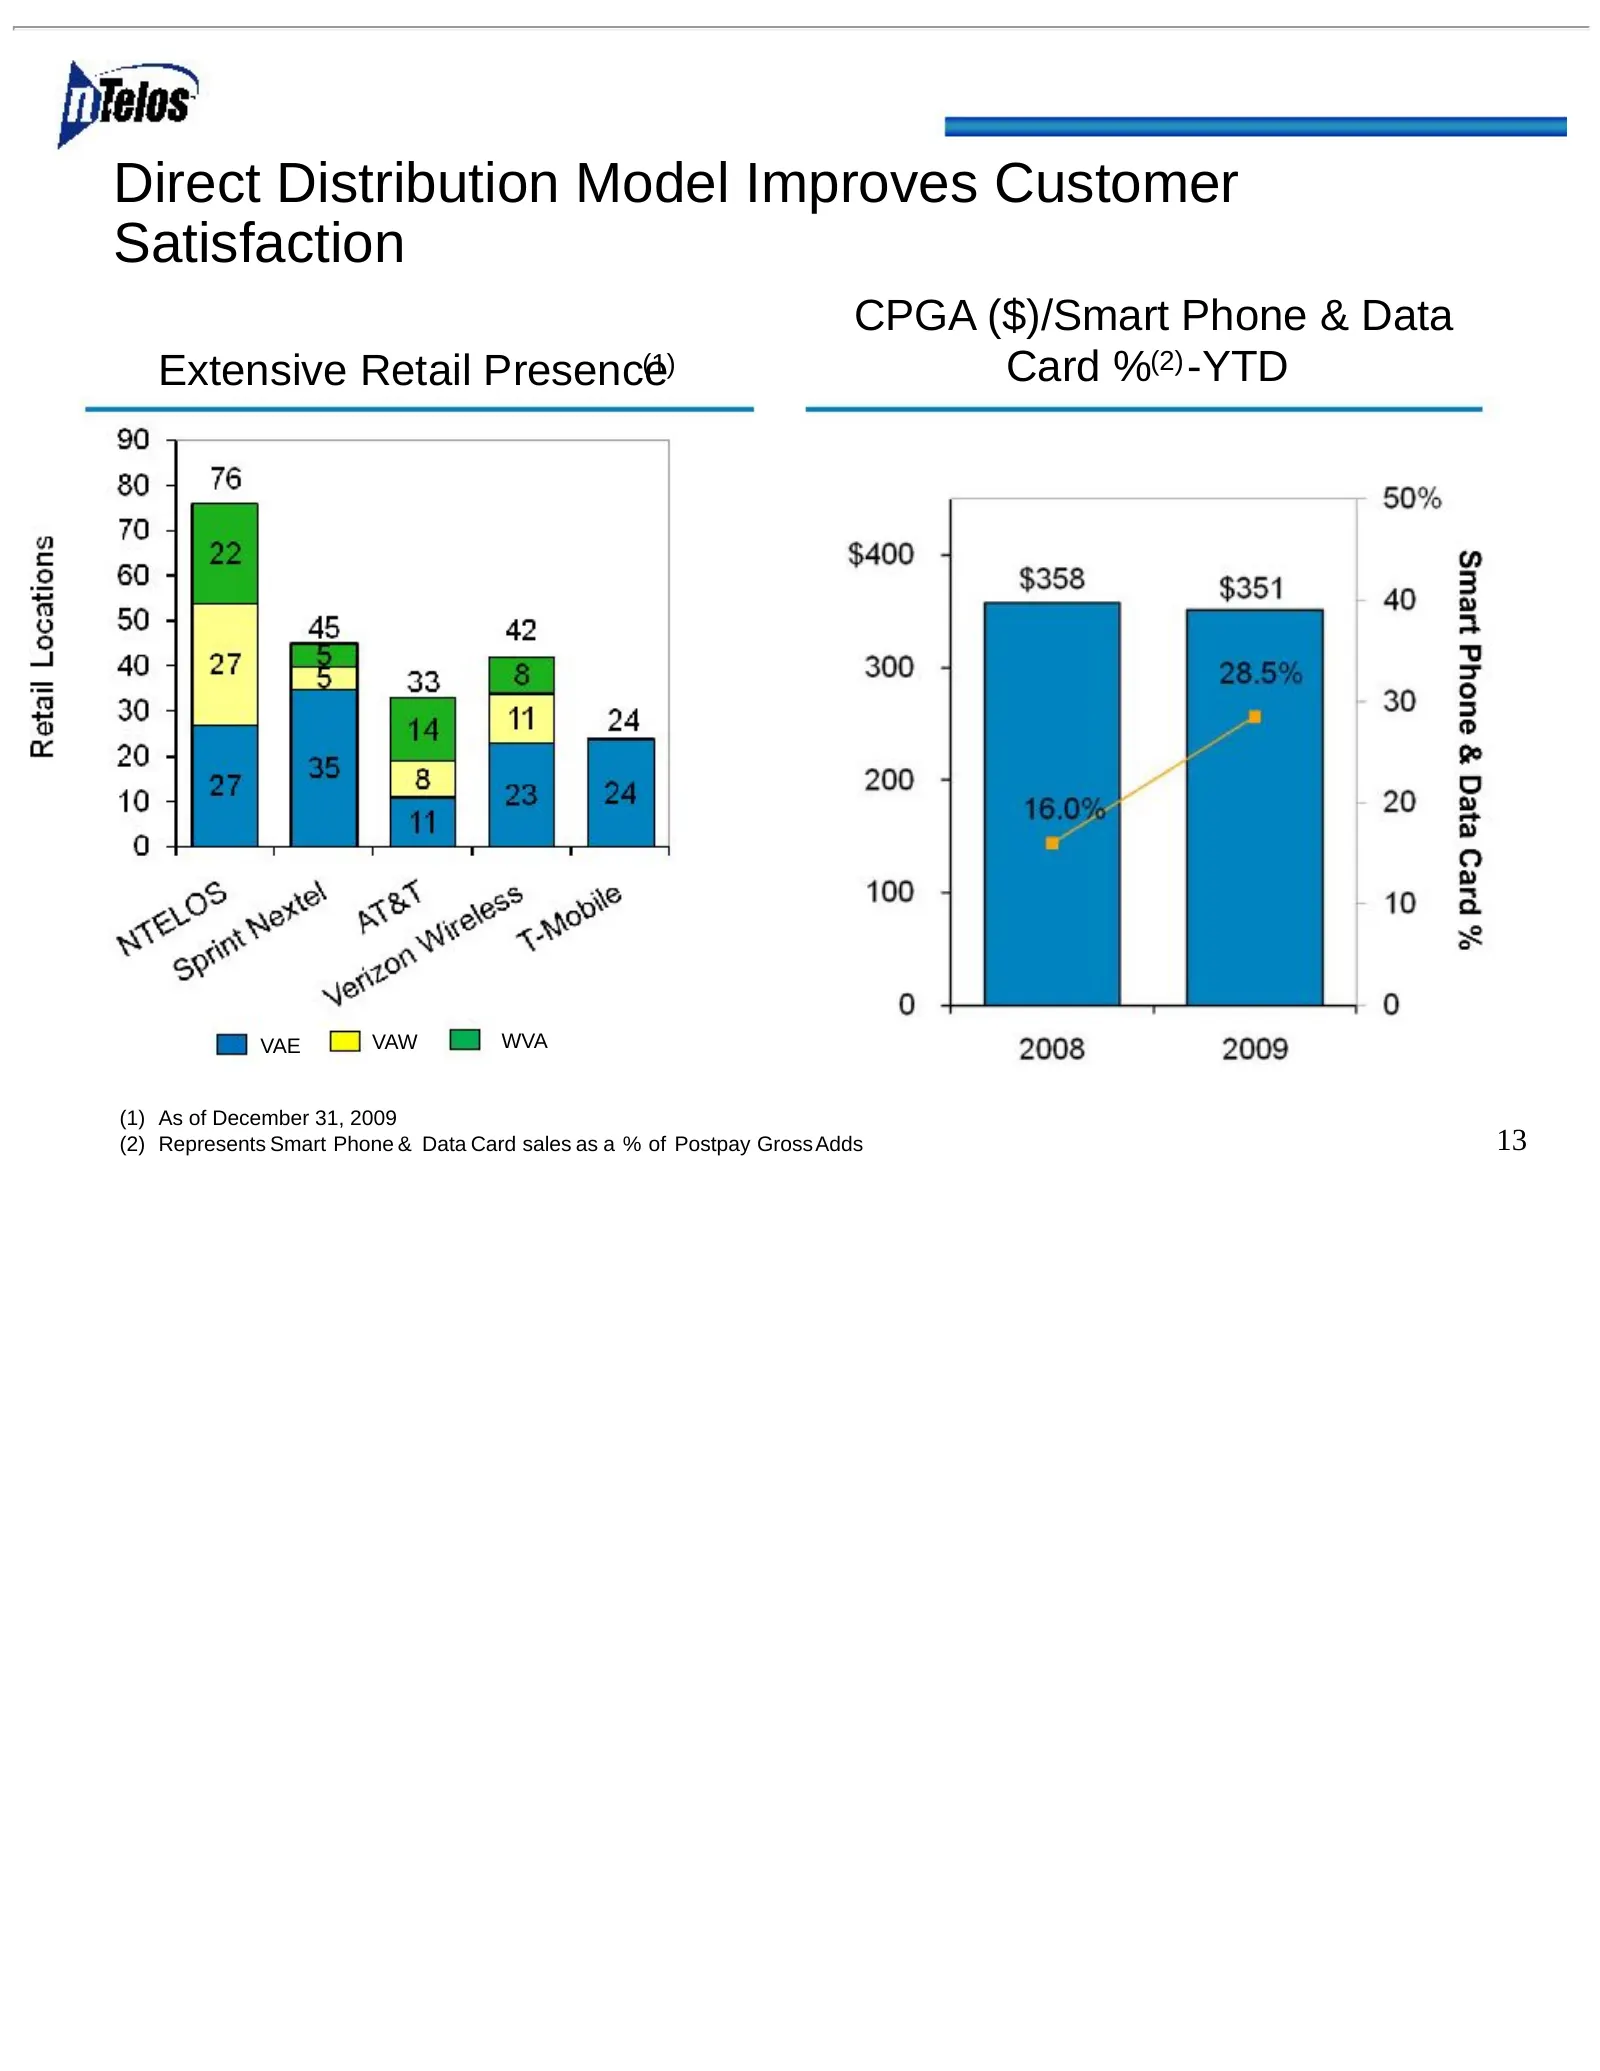
Slide 14: Direct Distribution Model Improves Customer Satisfaction
Direct Distribution Model Improves Customer Satisfaction CPGA ($)/Smart Phone & Data Extensive Retail Presence (1) Card %(2) -YTD VAE VAW WVA (1) As of December 31, 2009 (2) Represents Smart Phone & Data Card sales as a % of Postpay Gross Adds 13
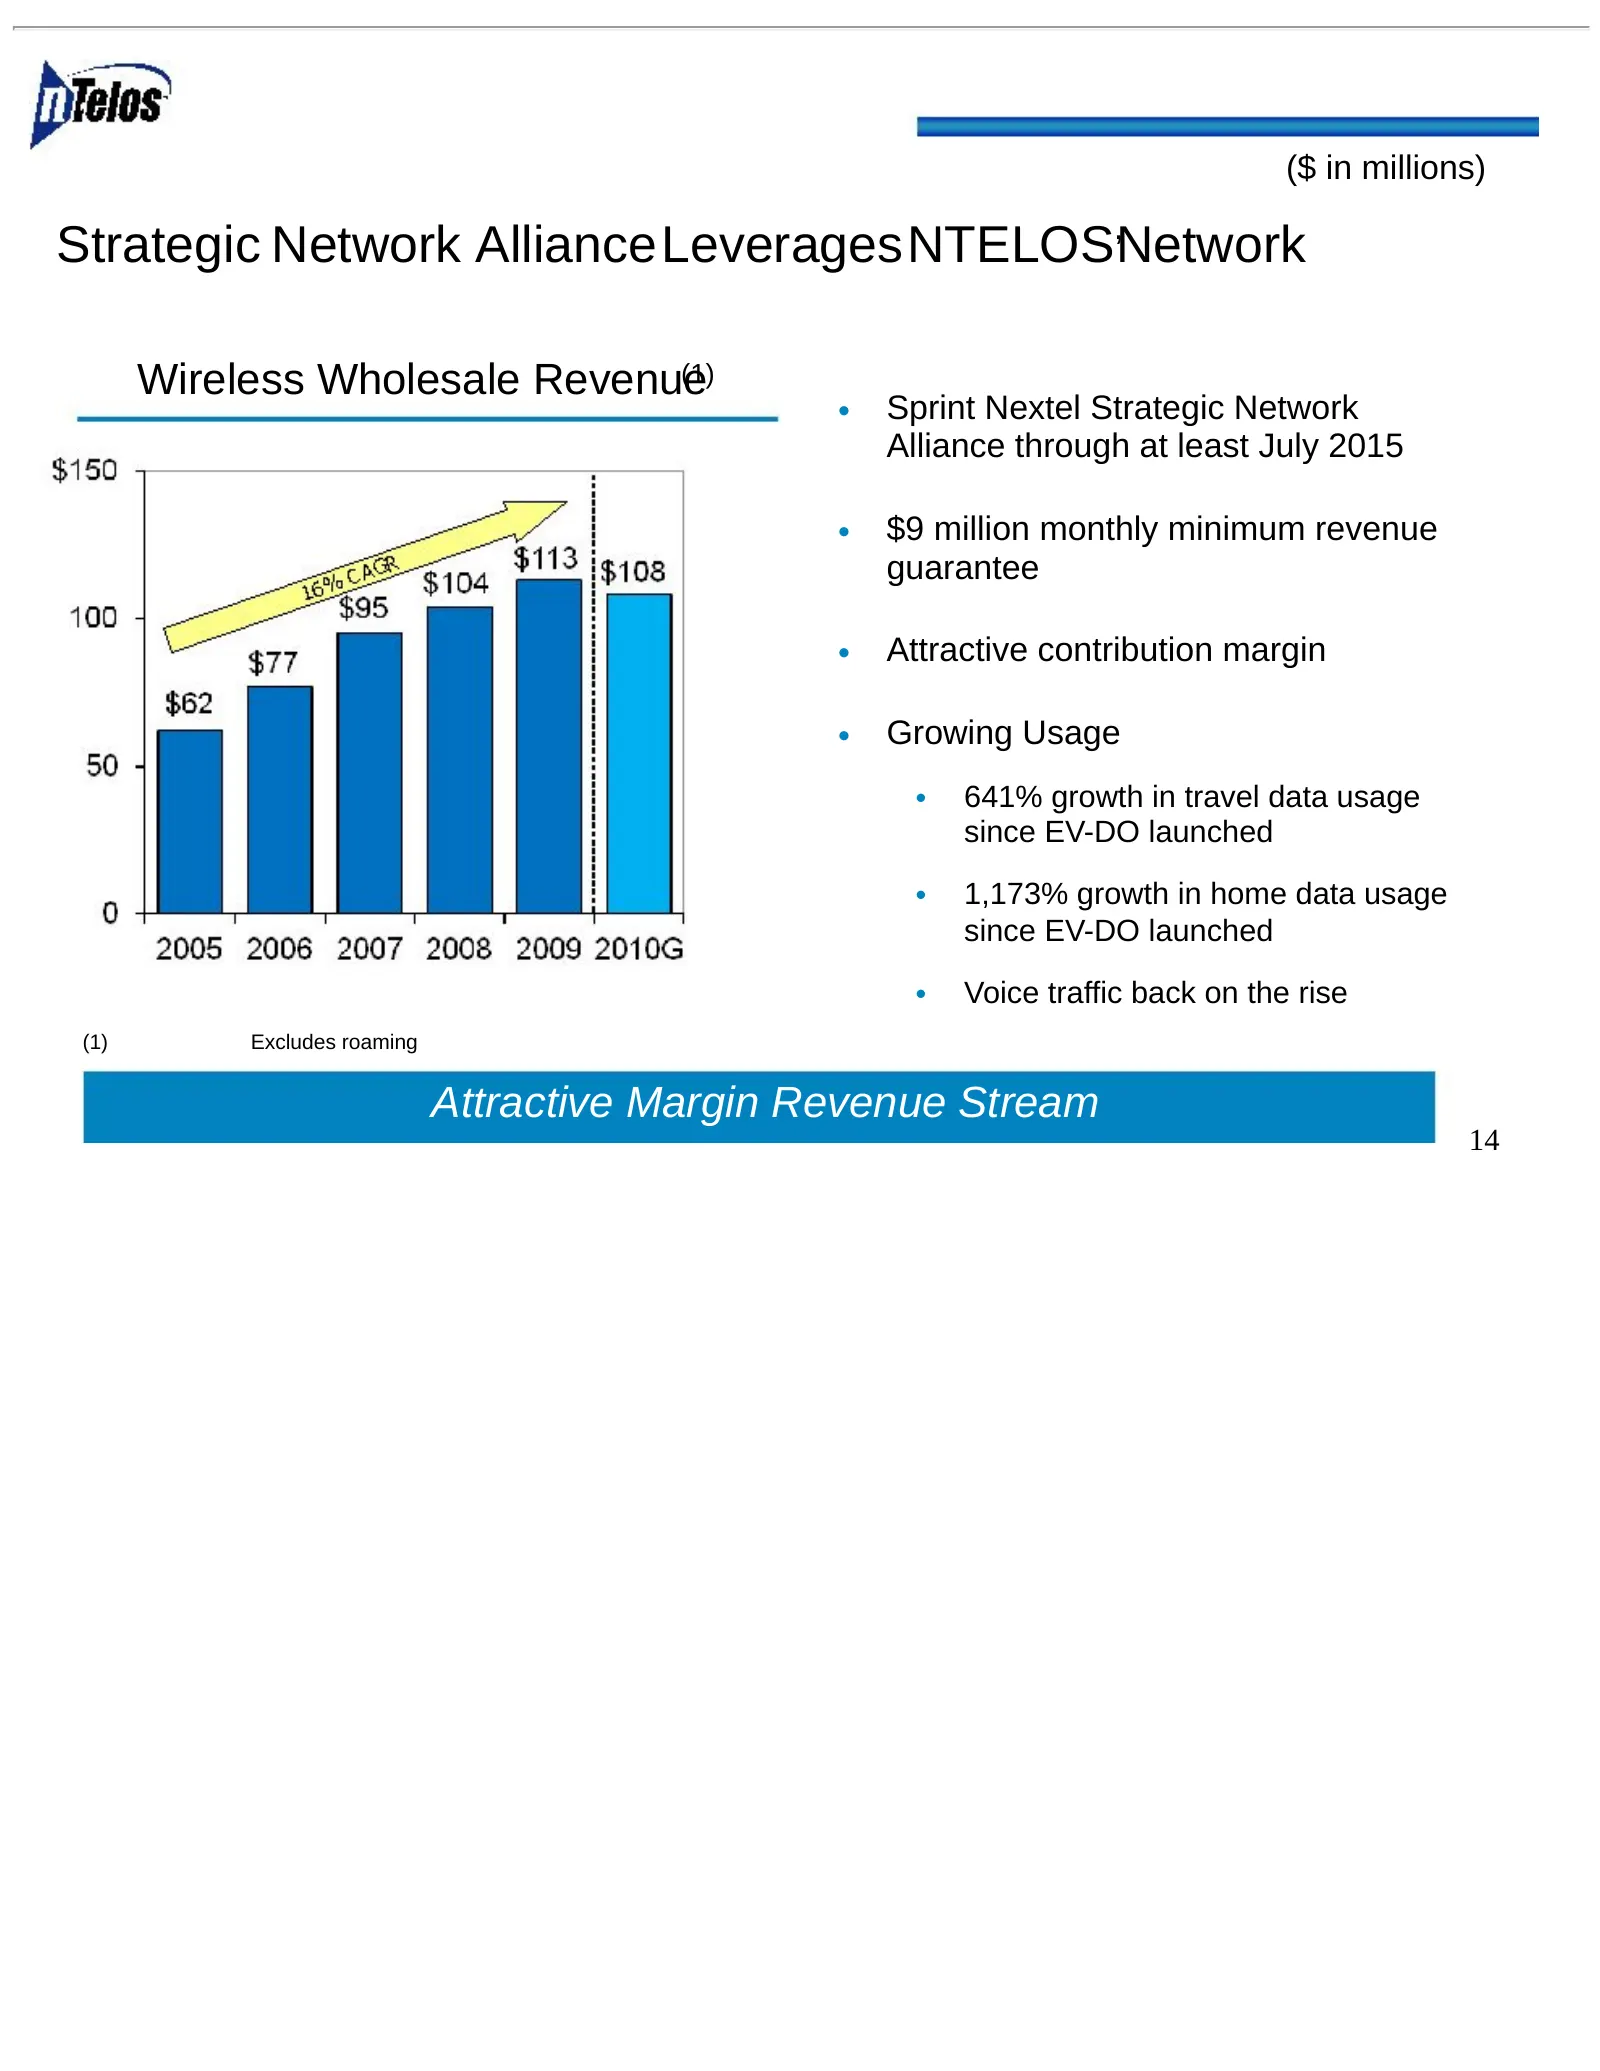
Slide 15: Strategic Network Alliance Leverages NTELOS' Network
($ in millions) Strategic Network AllianceLeveragesNTELOS’Network Wireless Wholesale Revenue (1) • Sprint Nextel Strategic Network Alliance through at least July 2015 • $9 million monthly minimum revenue guarantee • Attractive contribution margin • Growing Usage • 641% growth in travel data usage si
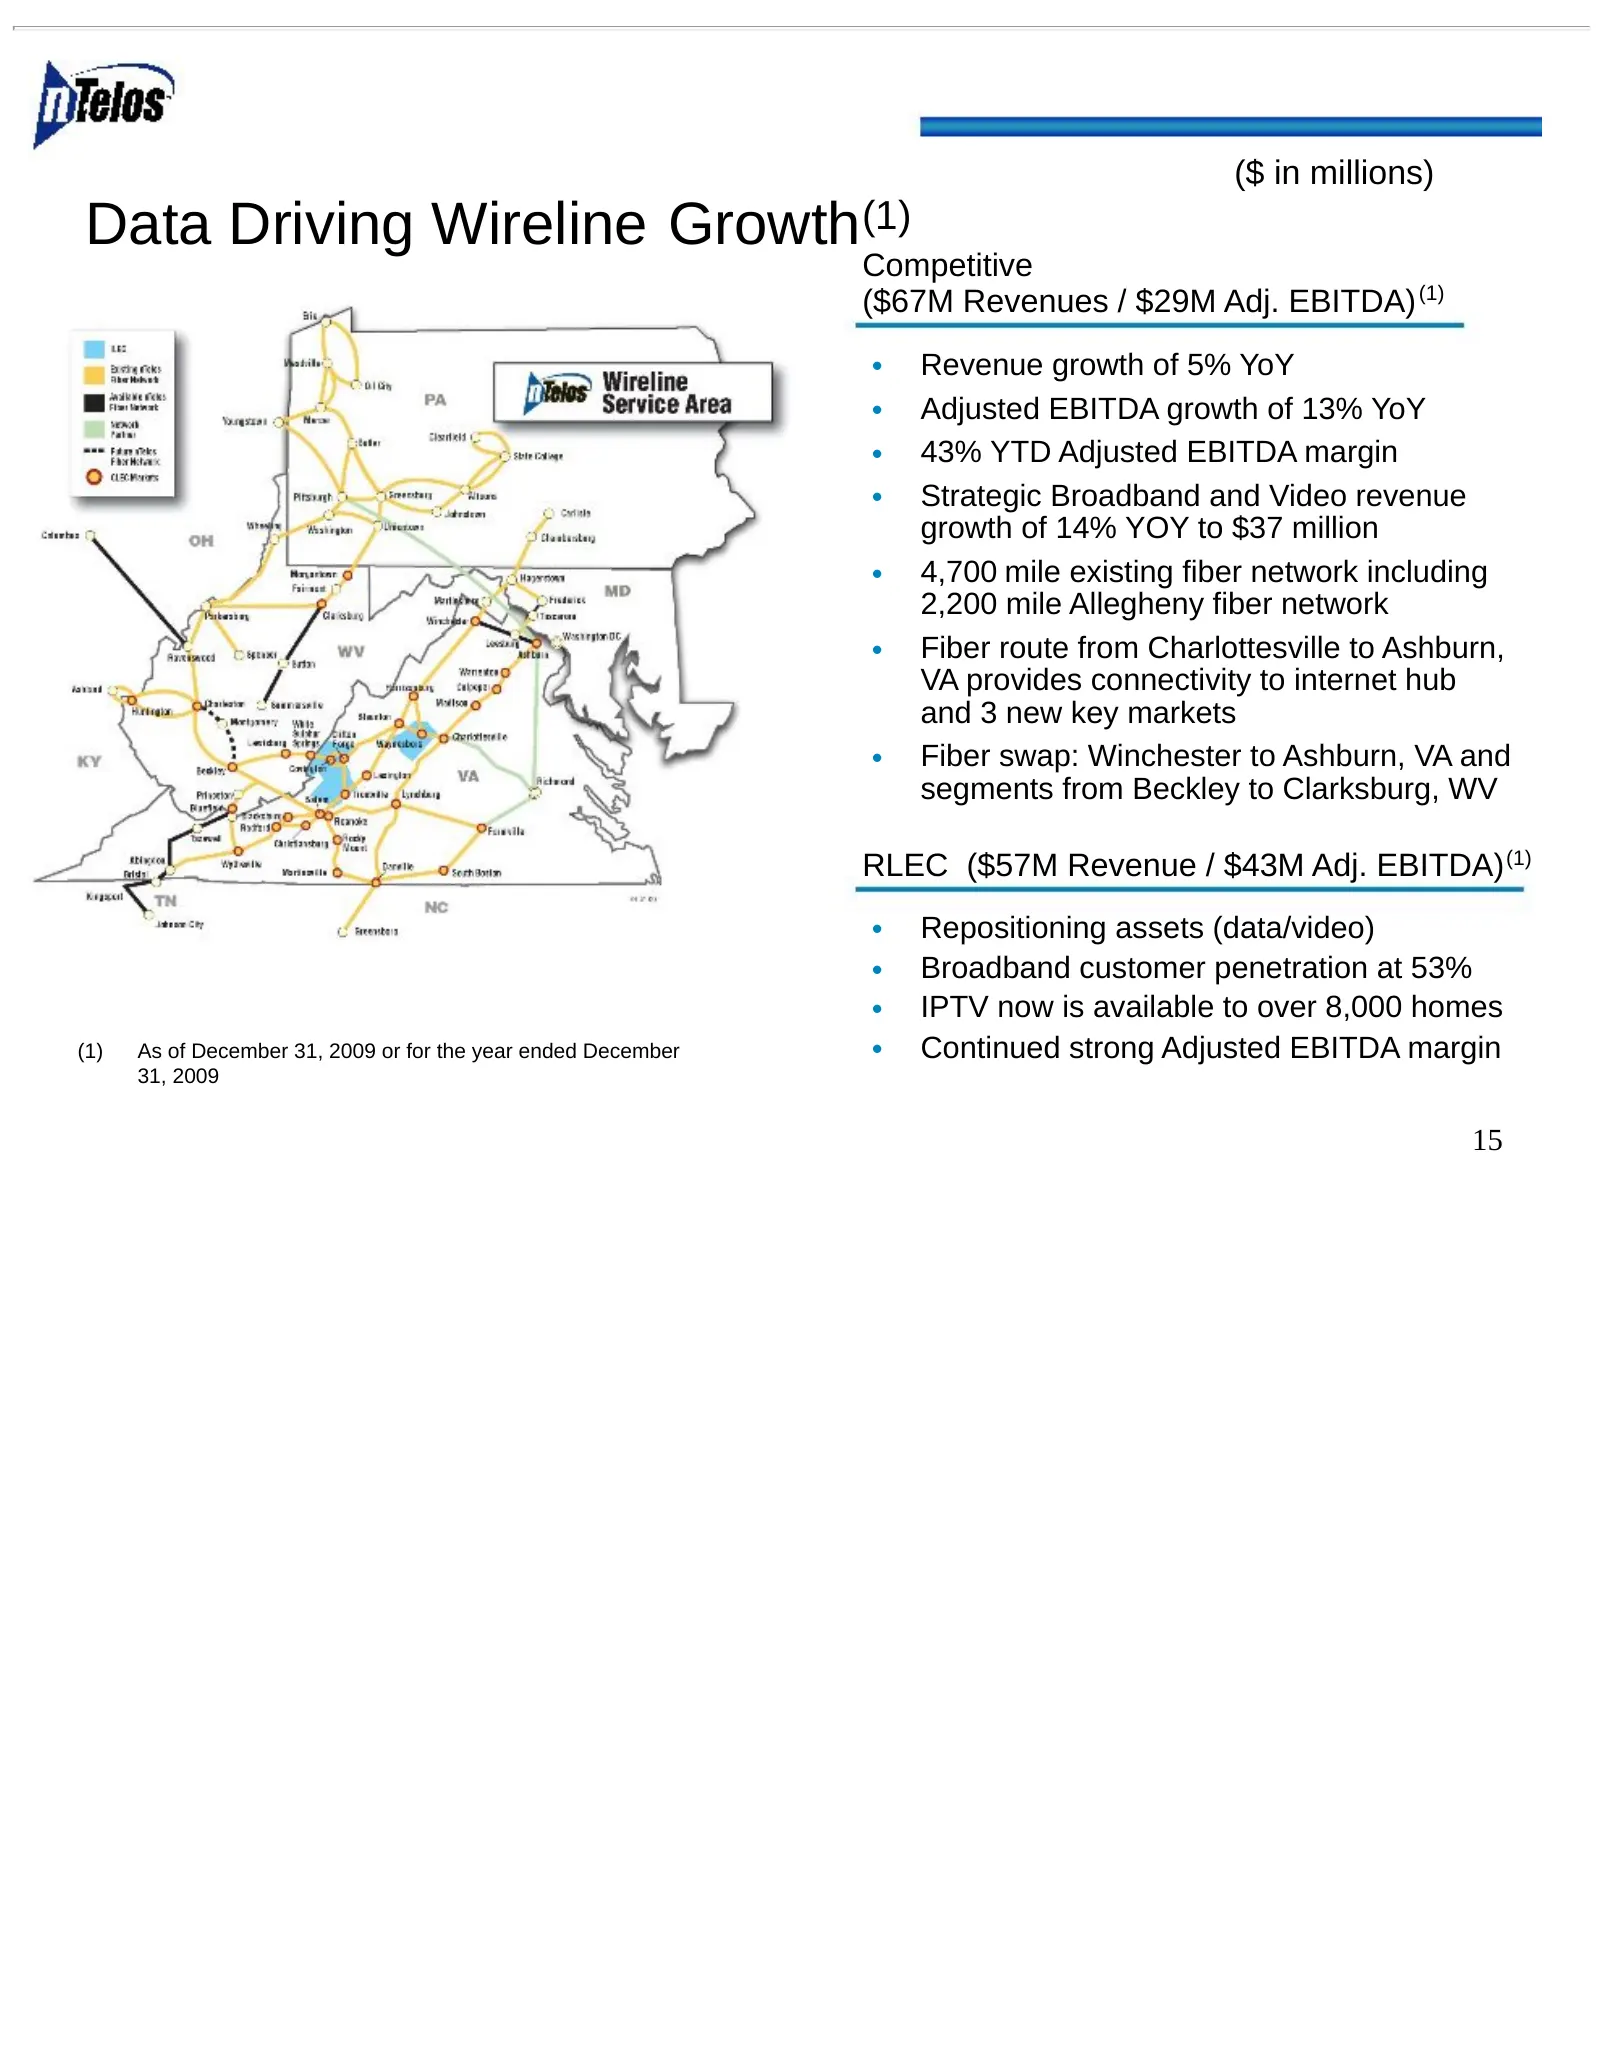
Slide 16: Data Driving Wireline Growth
($ in millions) Data Driving Wireline Growth(1) Competitive ($67M Revenues / $29M Adj. EBITDA) (1) • Revenue growth of 5% YoY • Adjusted EBITDA growth of 13% YoY • 43% YTD Adjusted EBITDA margin • Strategic Broadband and Video revenue growth of 14% YOY to $37 million • 4,700 mile existing fiber netw
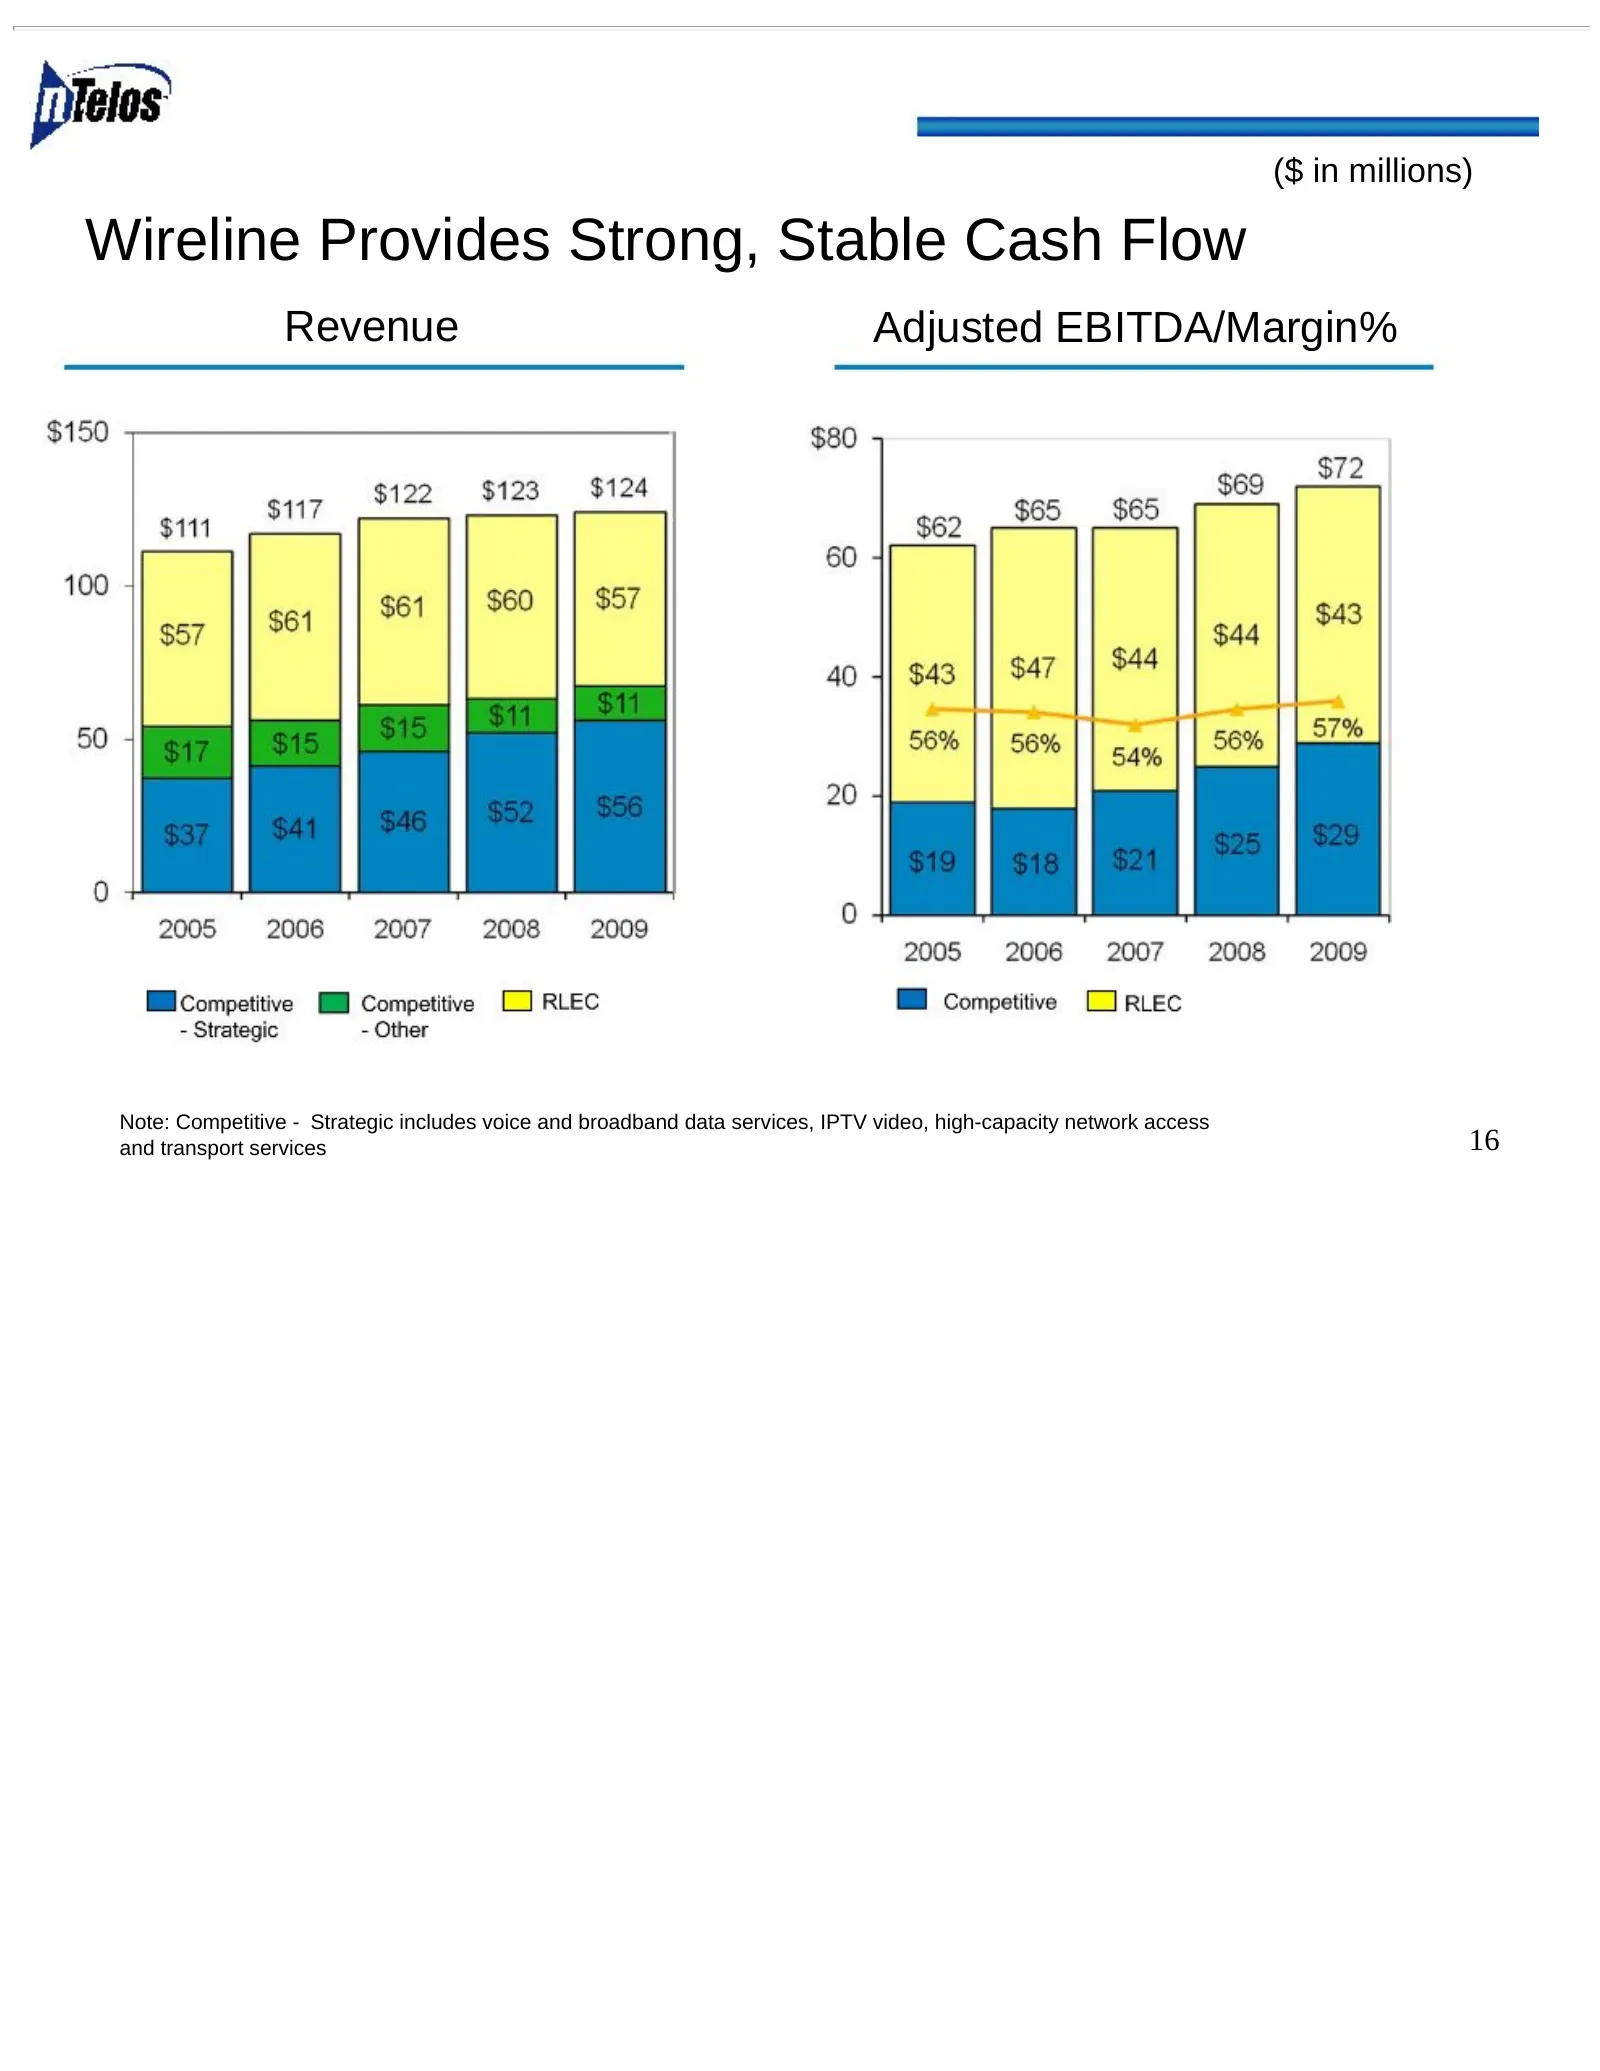
Slide 17: Wireline Provides Strong, Stable Cash Flow
($ in millions) Wireline Provides Strong, Stable Cash Flow Revenue Adjusted EBITDA/Margin% Note: Competitive - Strategic includes voice and broadband data services, IPTV video, high-capacity network access and transport services 16
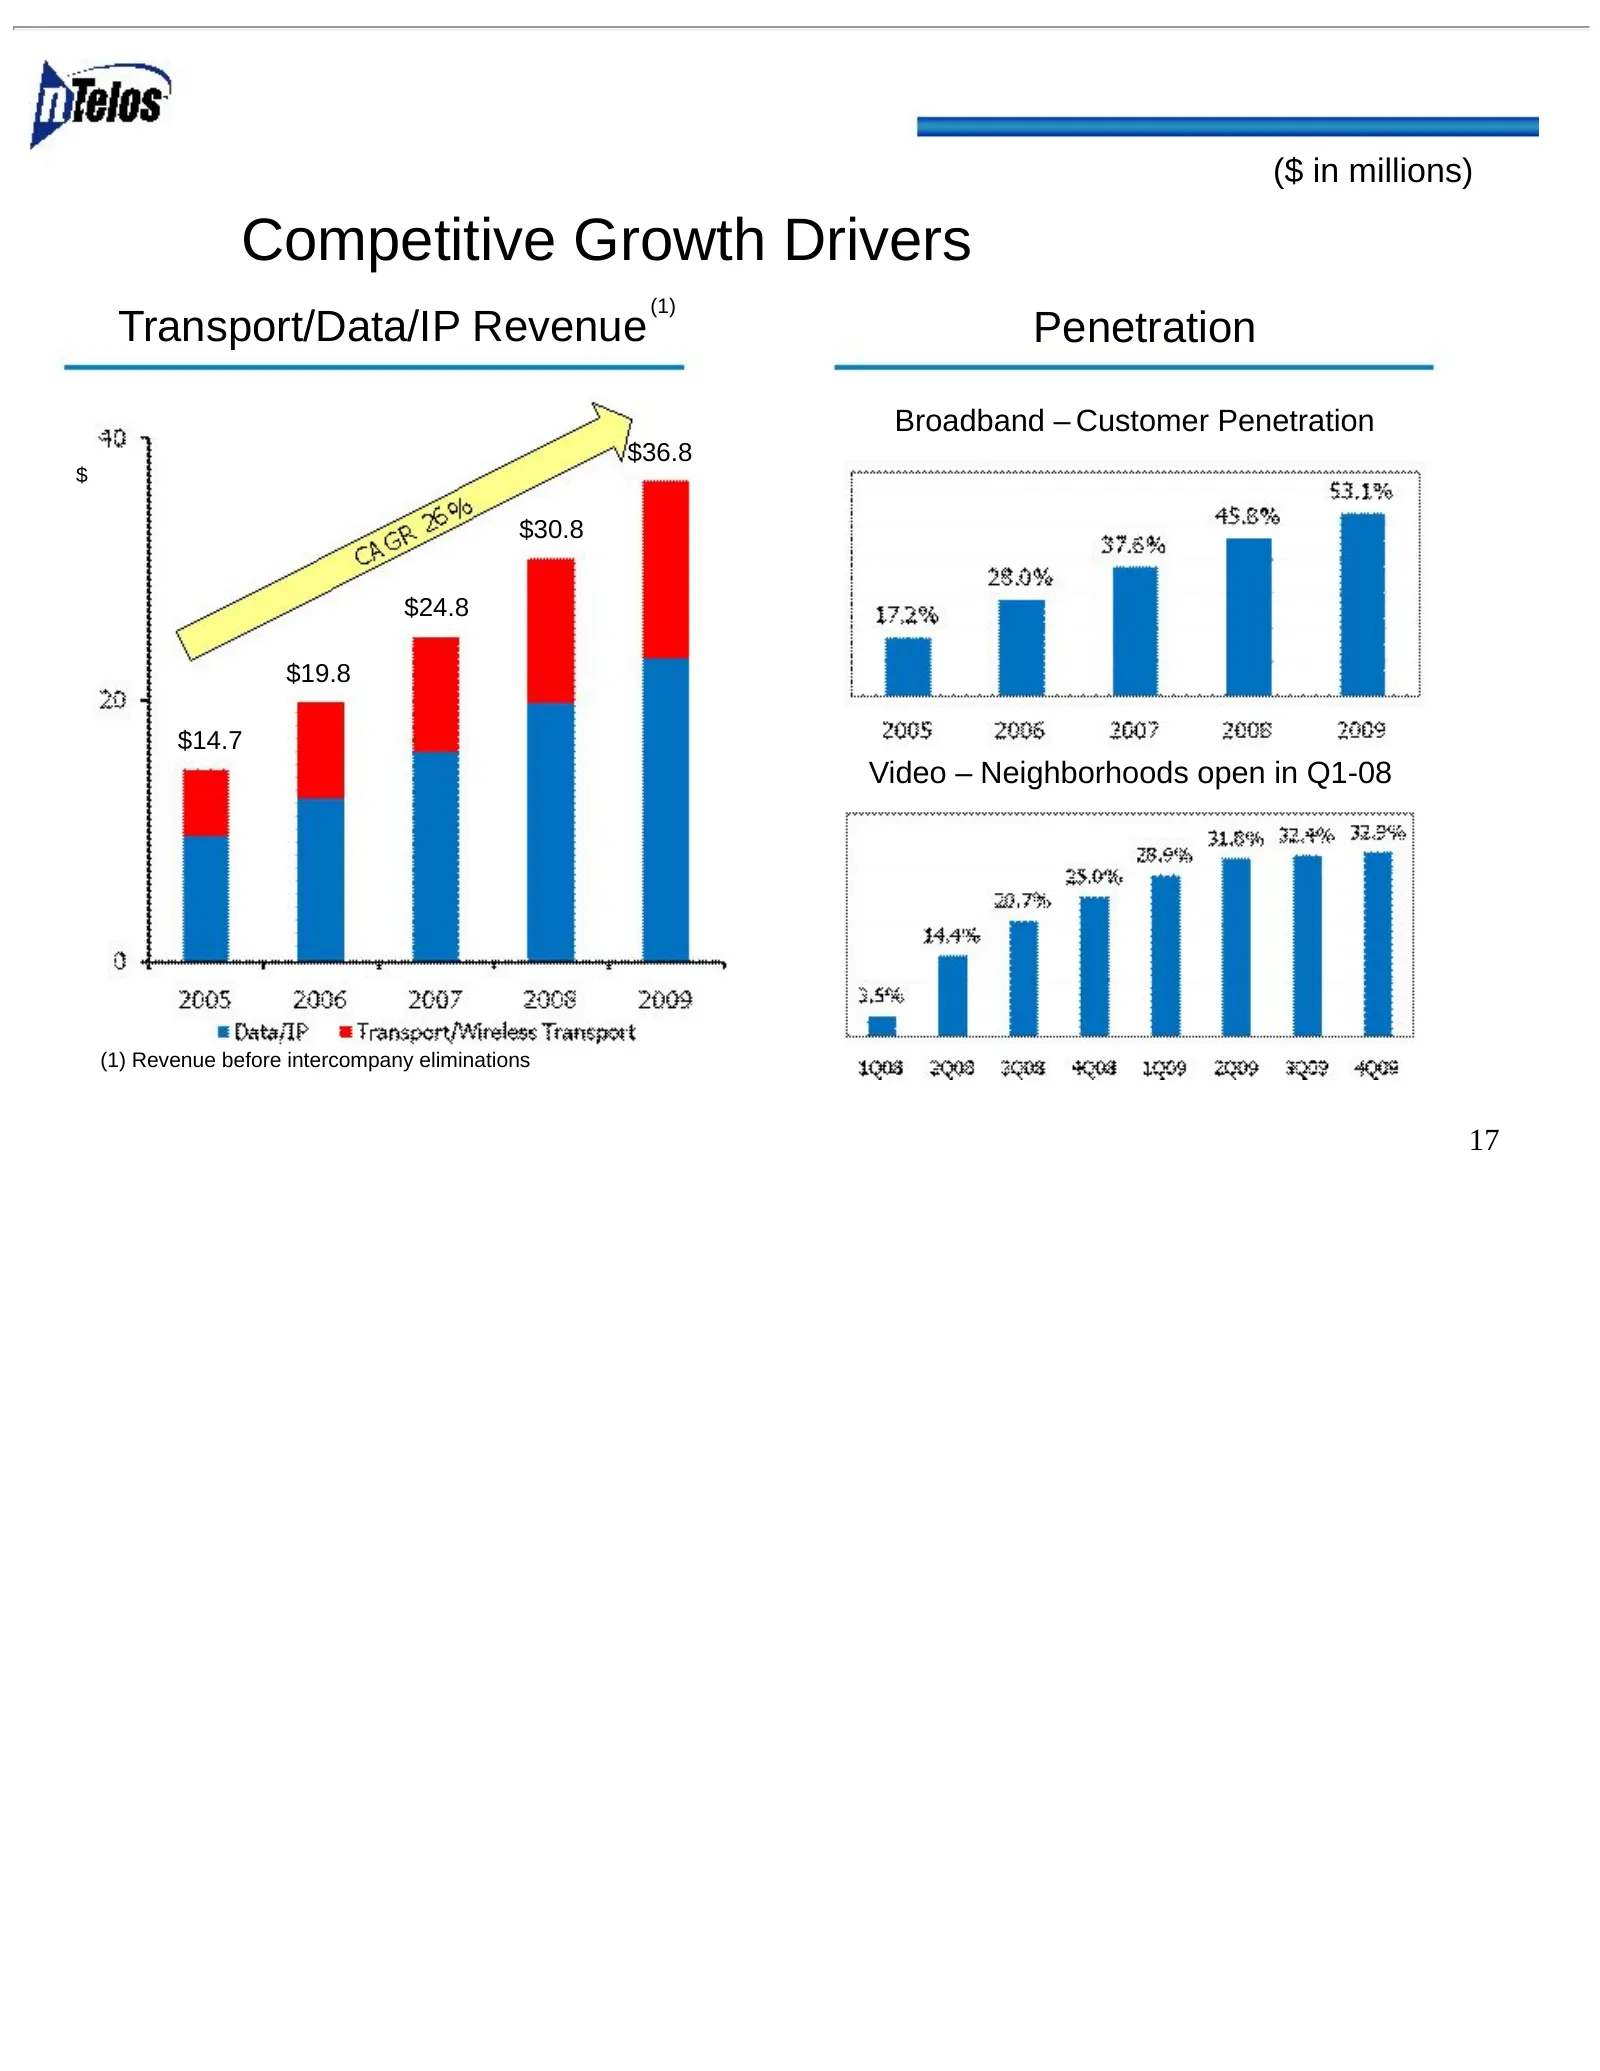
Slide 18: Competitive Growth Drivers
($ in millions) Competitive Growth Drivers (1) Transport/Data/IP Revenue Penetration Broadband – Customer Penetration $36.8 $ $30.8 $24.8 $19.8 $14.7 Video – Neighborhoods open in Q1-08 (1) Revenue before intercompany eliminations 17

Slide 19: Financial Overview
*** *** *** *** *** *** ********* ********* Financial Overview
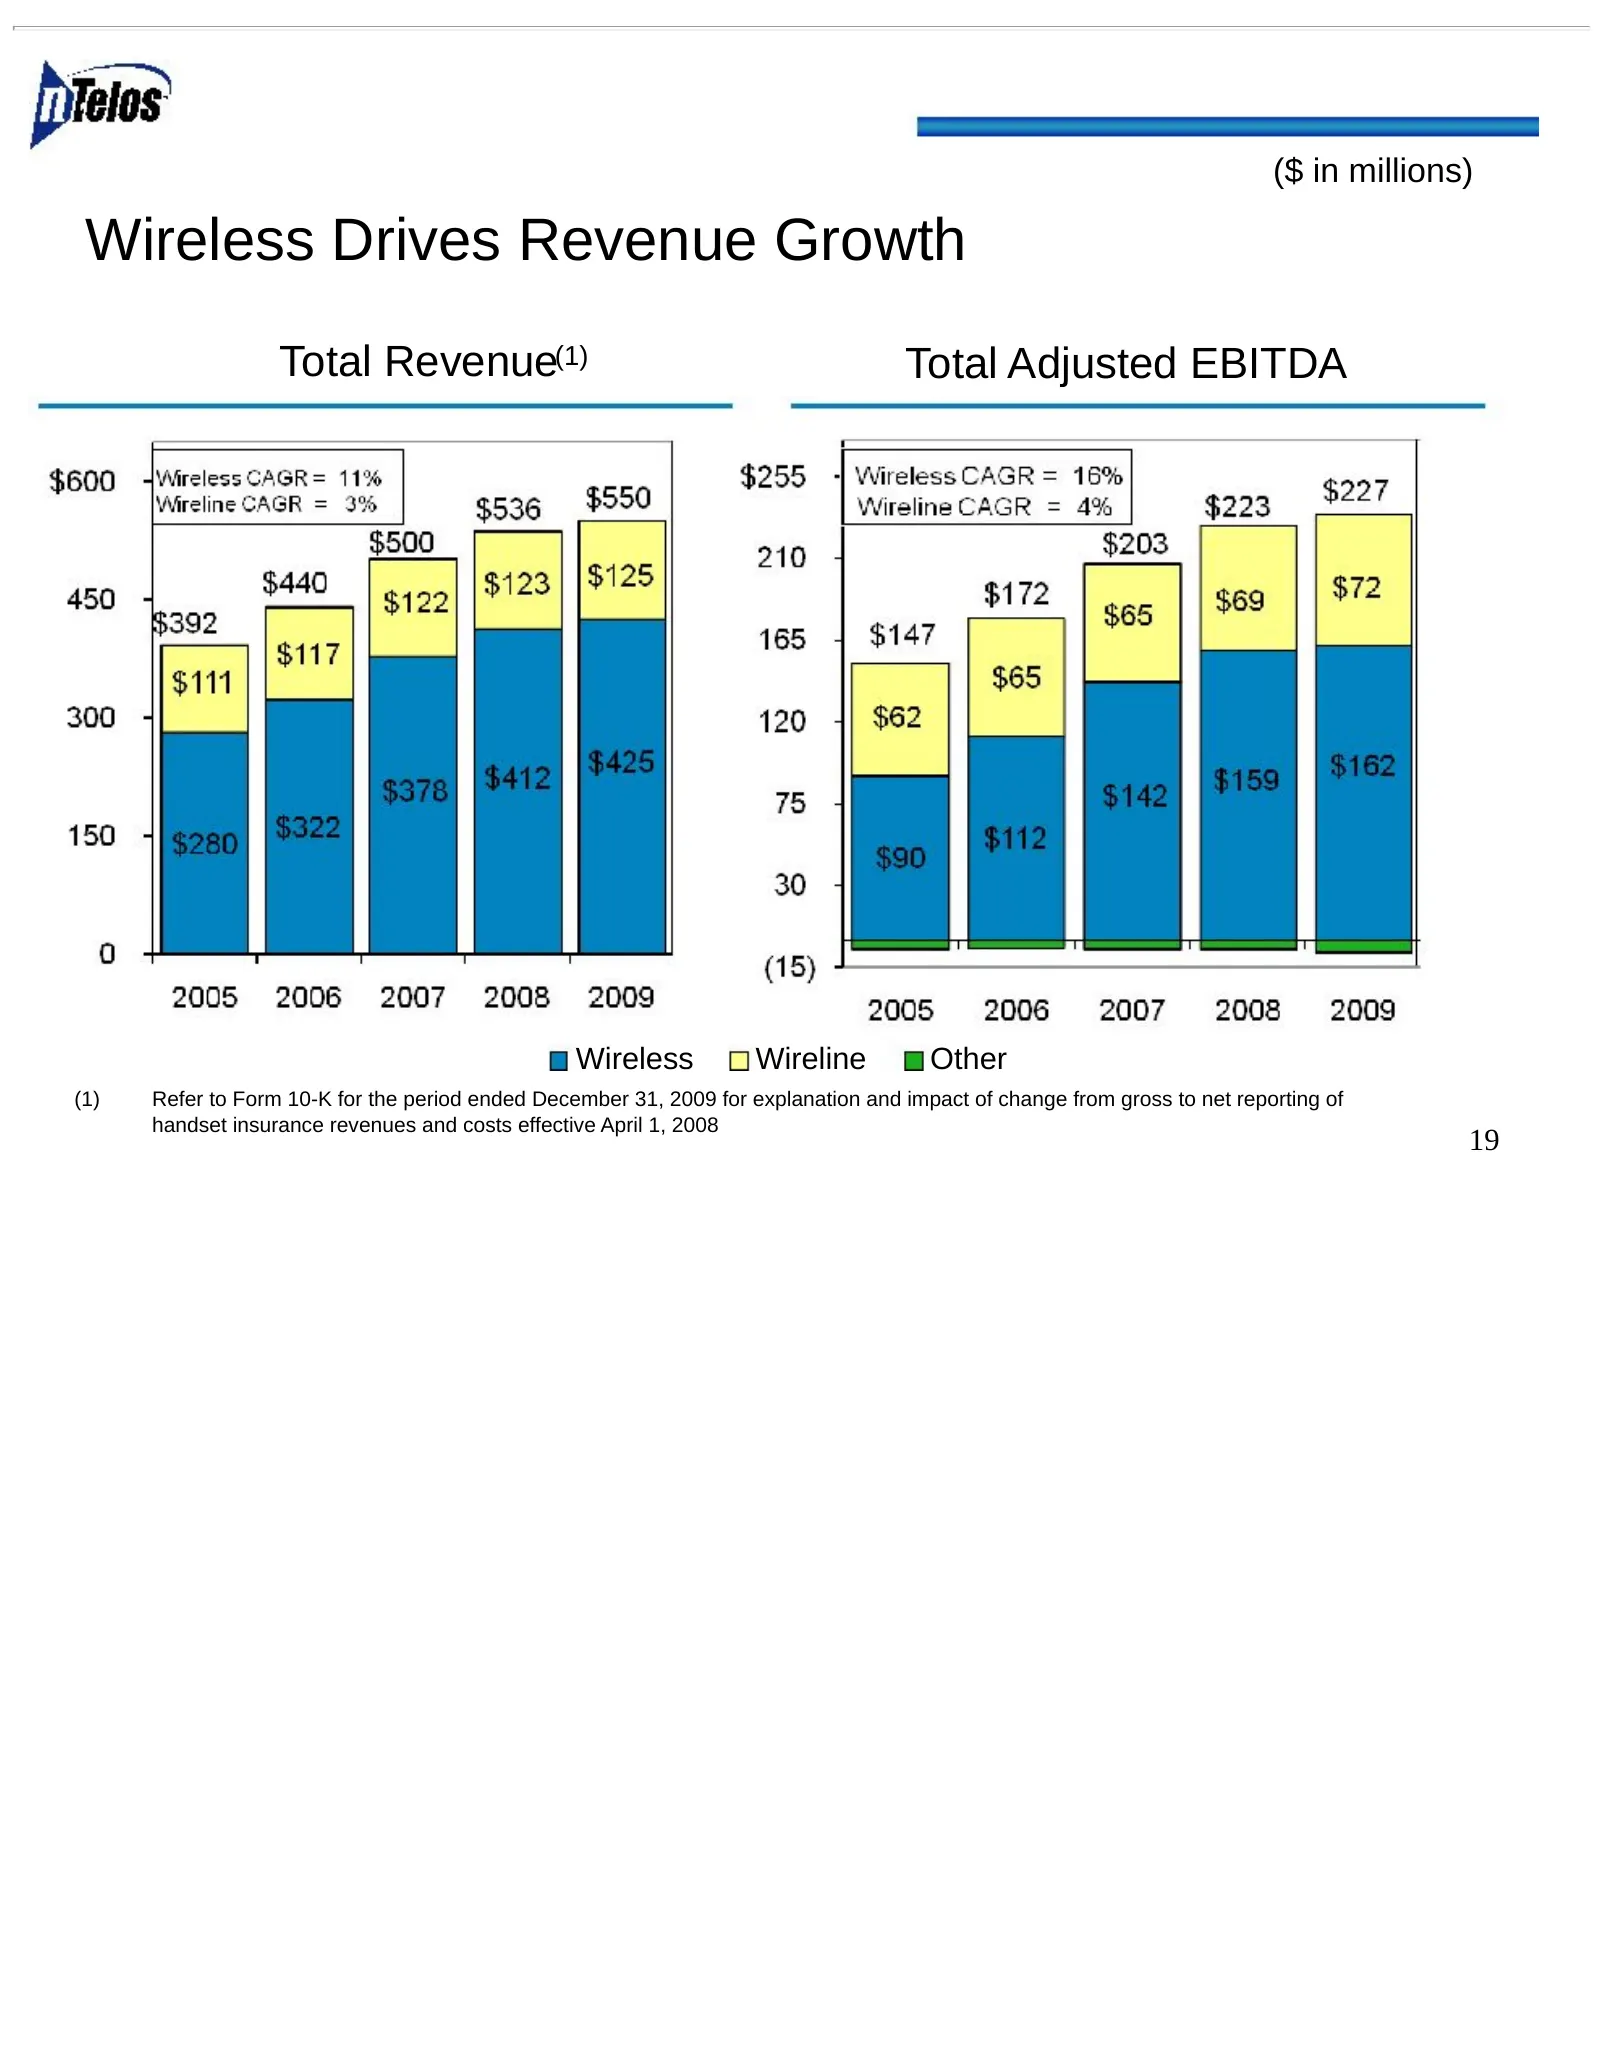
Slide 20: Wireless Drives Revenue Growth
($ in millions) Wireless Drives Revenue Growth Total Revenue(1) Total Adjusted EBITDA Wireless Wireline Other (1) Refer to Form 10-K for the period ended December 31, 2009 for explanation and impact of change from gross to net reporting of handset insurance revenues and costs effective April 1, 2008
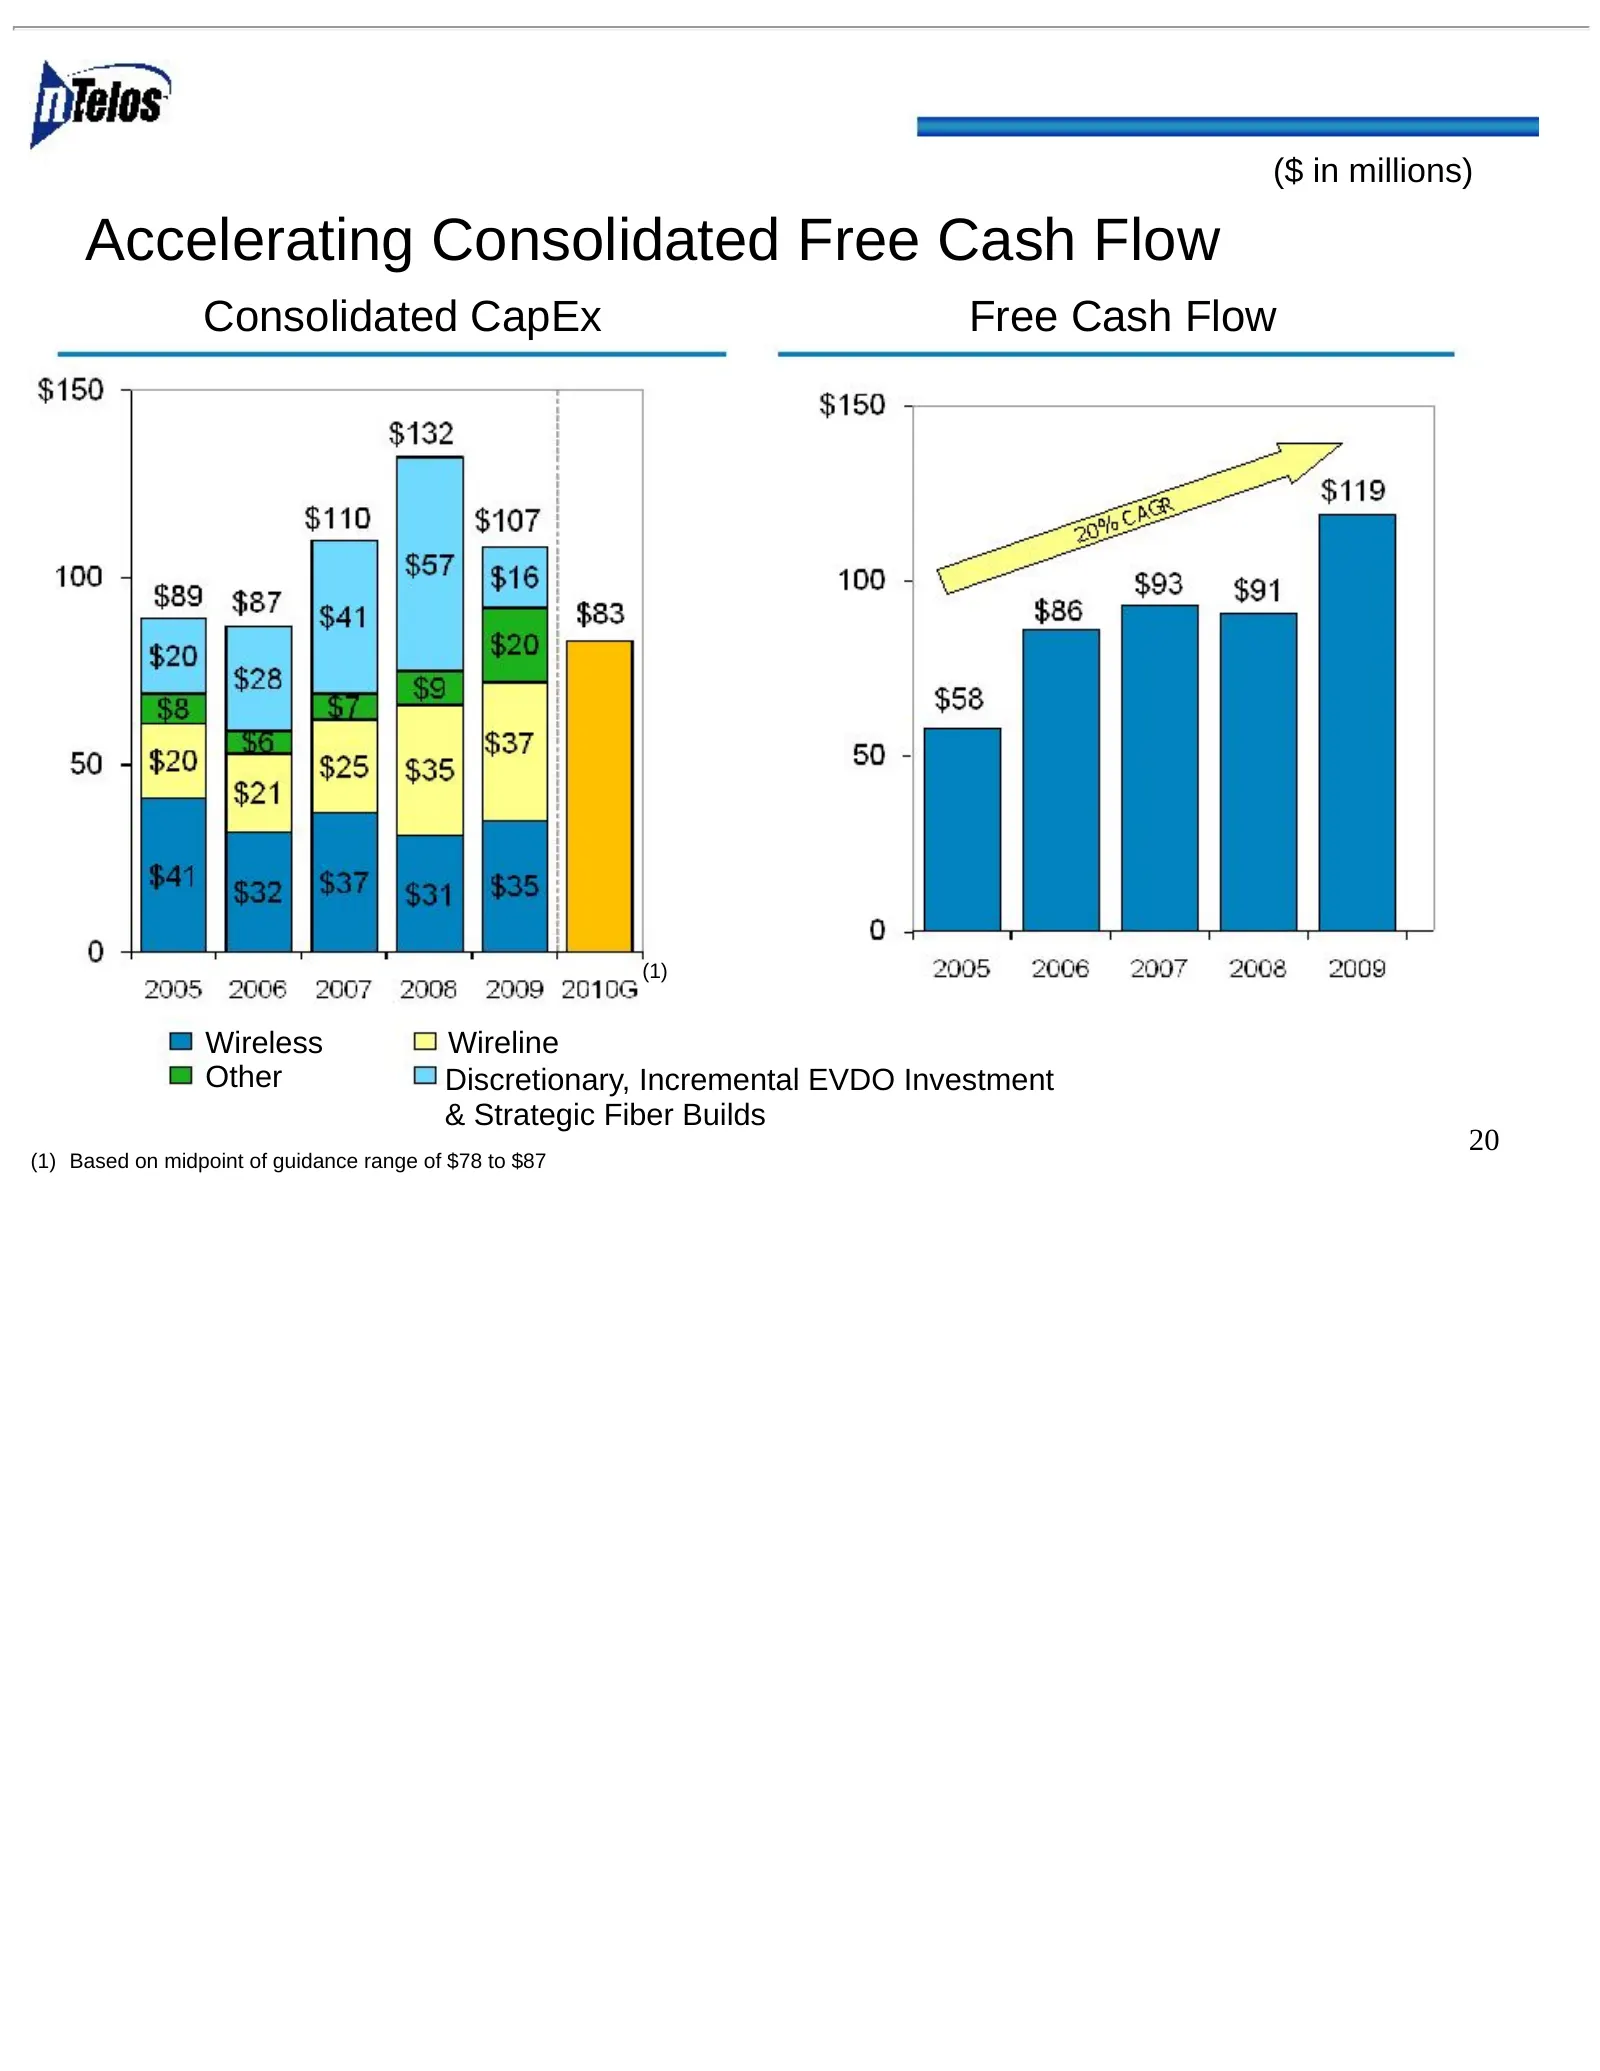
Slide 21: Accelerating Consolidated Free Cash Flow
($ in millions) Accelerating Consolidated Free Cash Flow Consolidated CapEx Free Cash Flow (1) Wireless Wireline Other Discretionary, Incremental EVDO Investment & Strategic Fiber Builds 20 (1) Based on midpoint of guidance range of $78 to $87
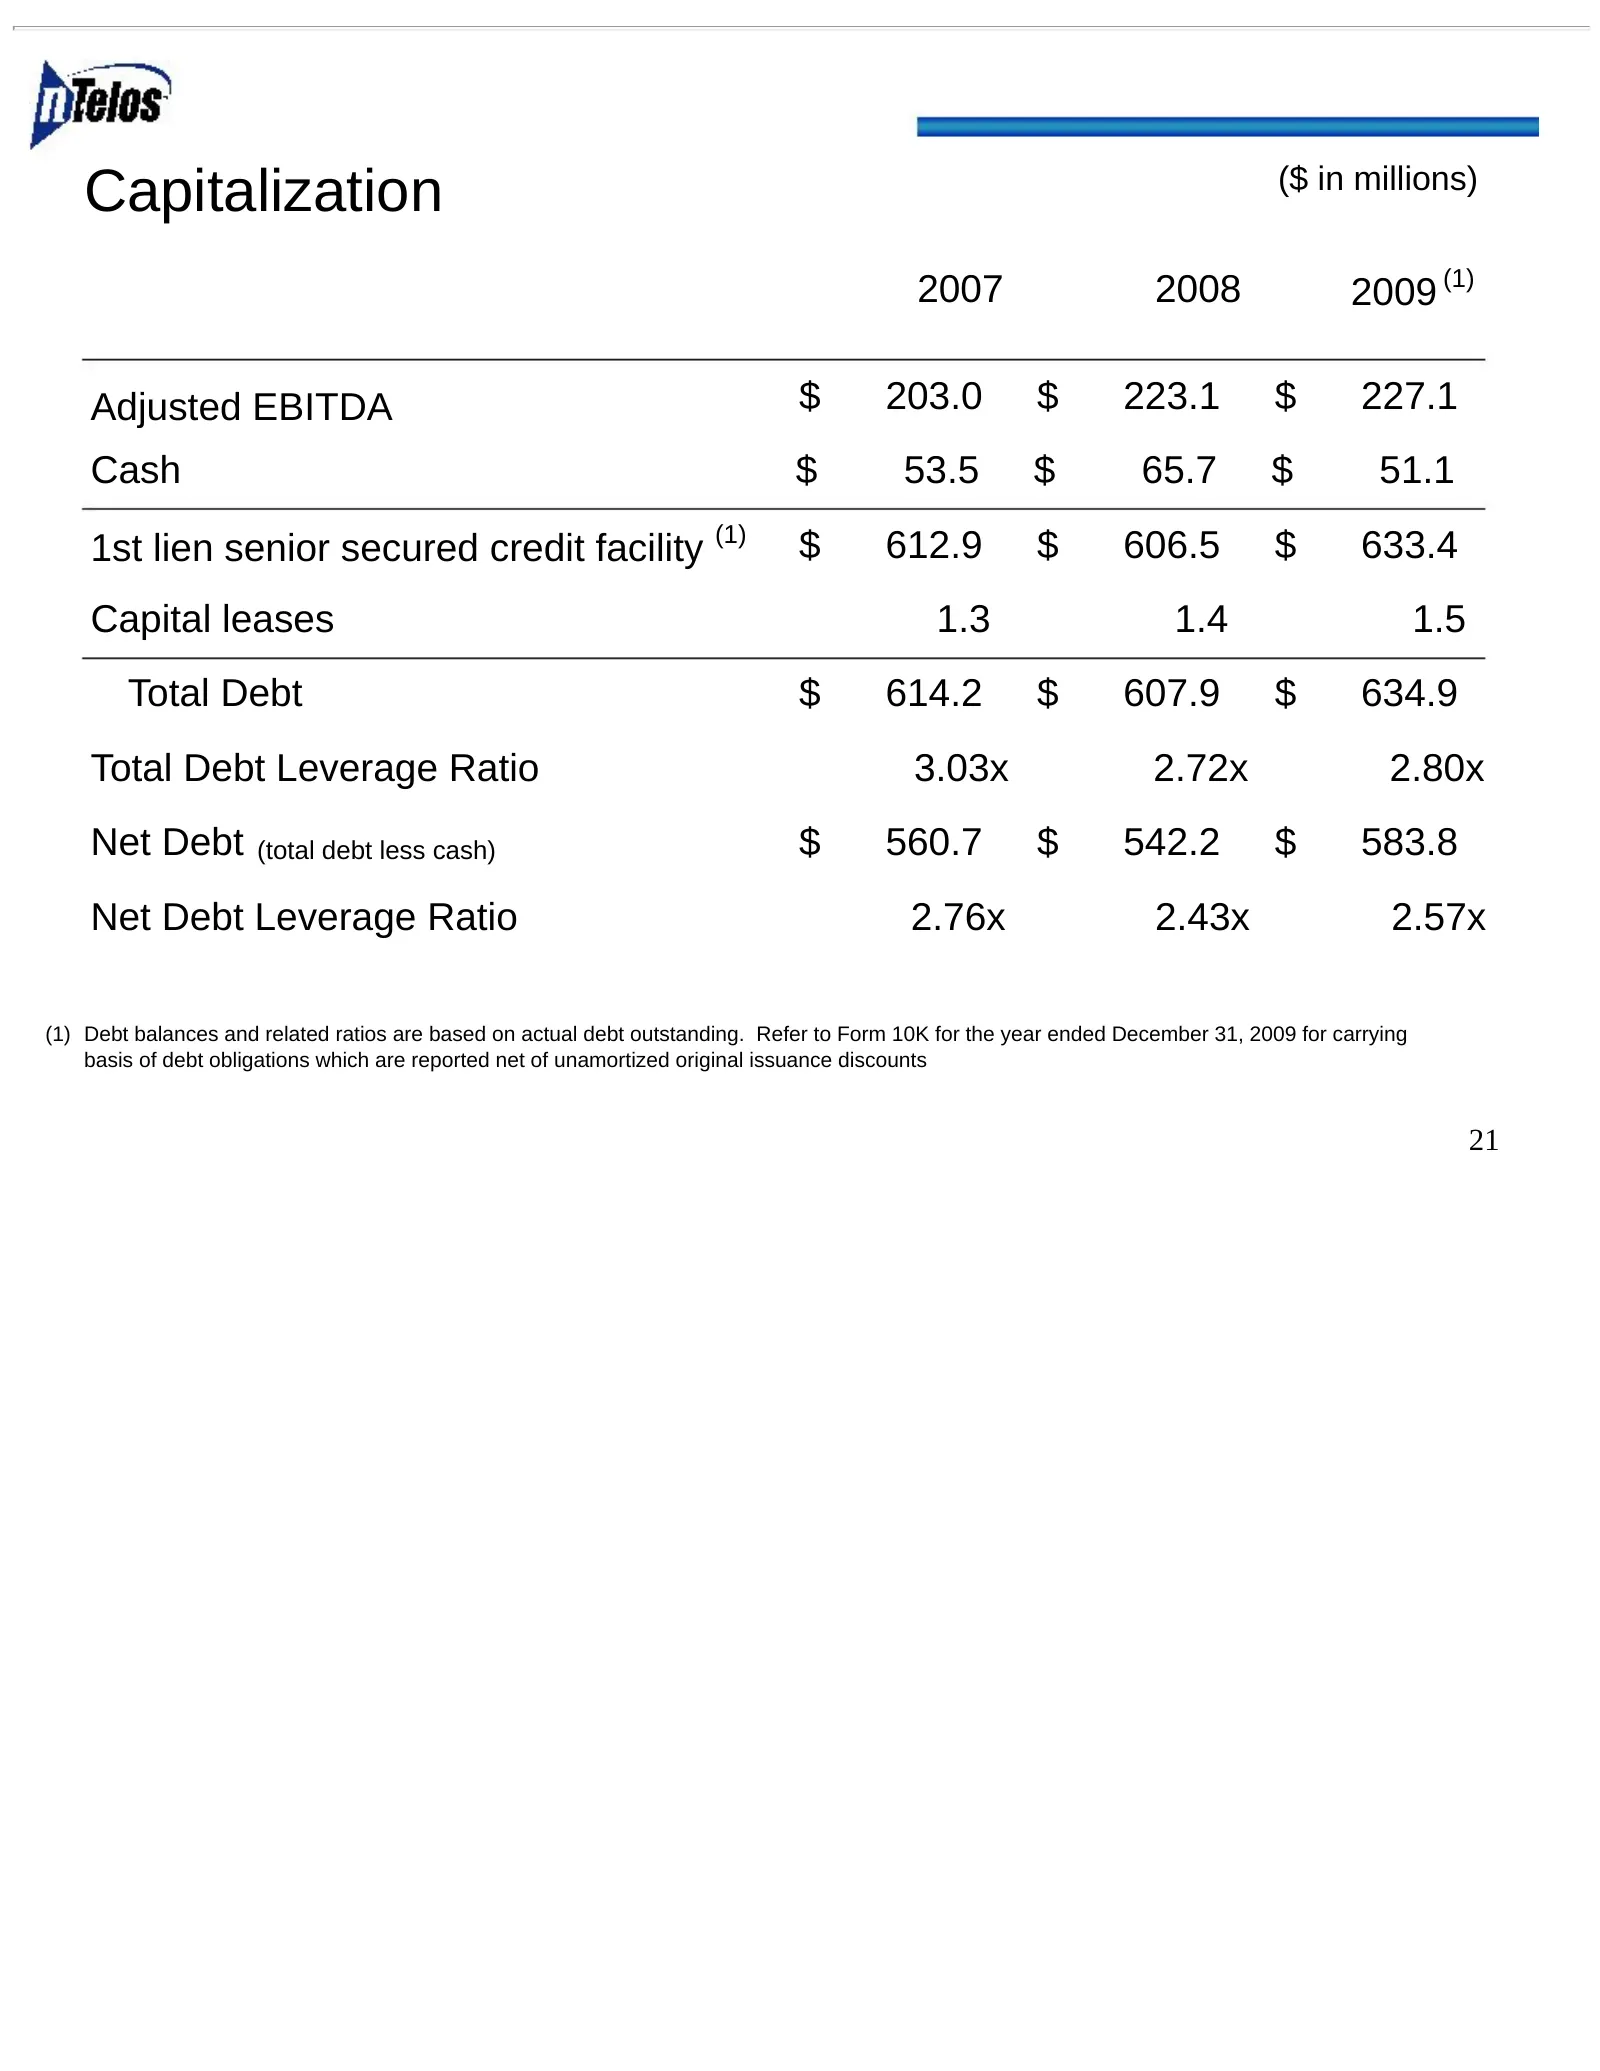
Slide 22: Capitalization
Capitalization ($ in millions) 2007 2008 2009 (1) Adjusted EBITDA $ 203.0 $ 223.1 $ 227.1 Cash $ 53.5 $ 65.7 $ 51.1 1st lien senior secured credit facility (1) $ 612.9 $ 606.5 $ 633.4 Capital leases 1.3 1.4 1.5 Total Debt $ 614.2 $ 607.9 $ 634.9 Total Debt Leverage Ratio 3.03x 2.72x 2.80x Net Debt (
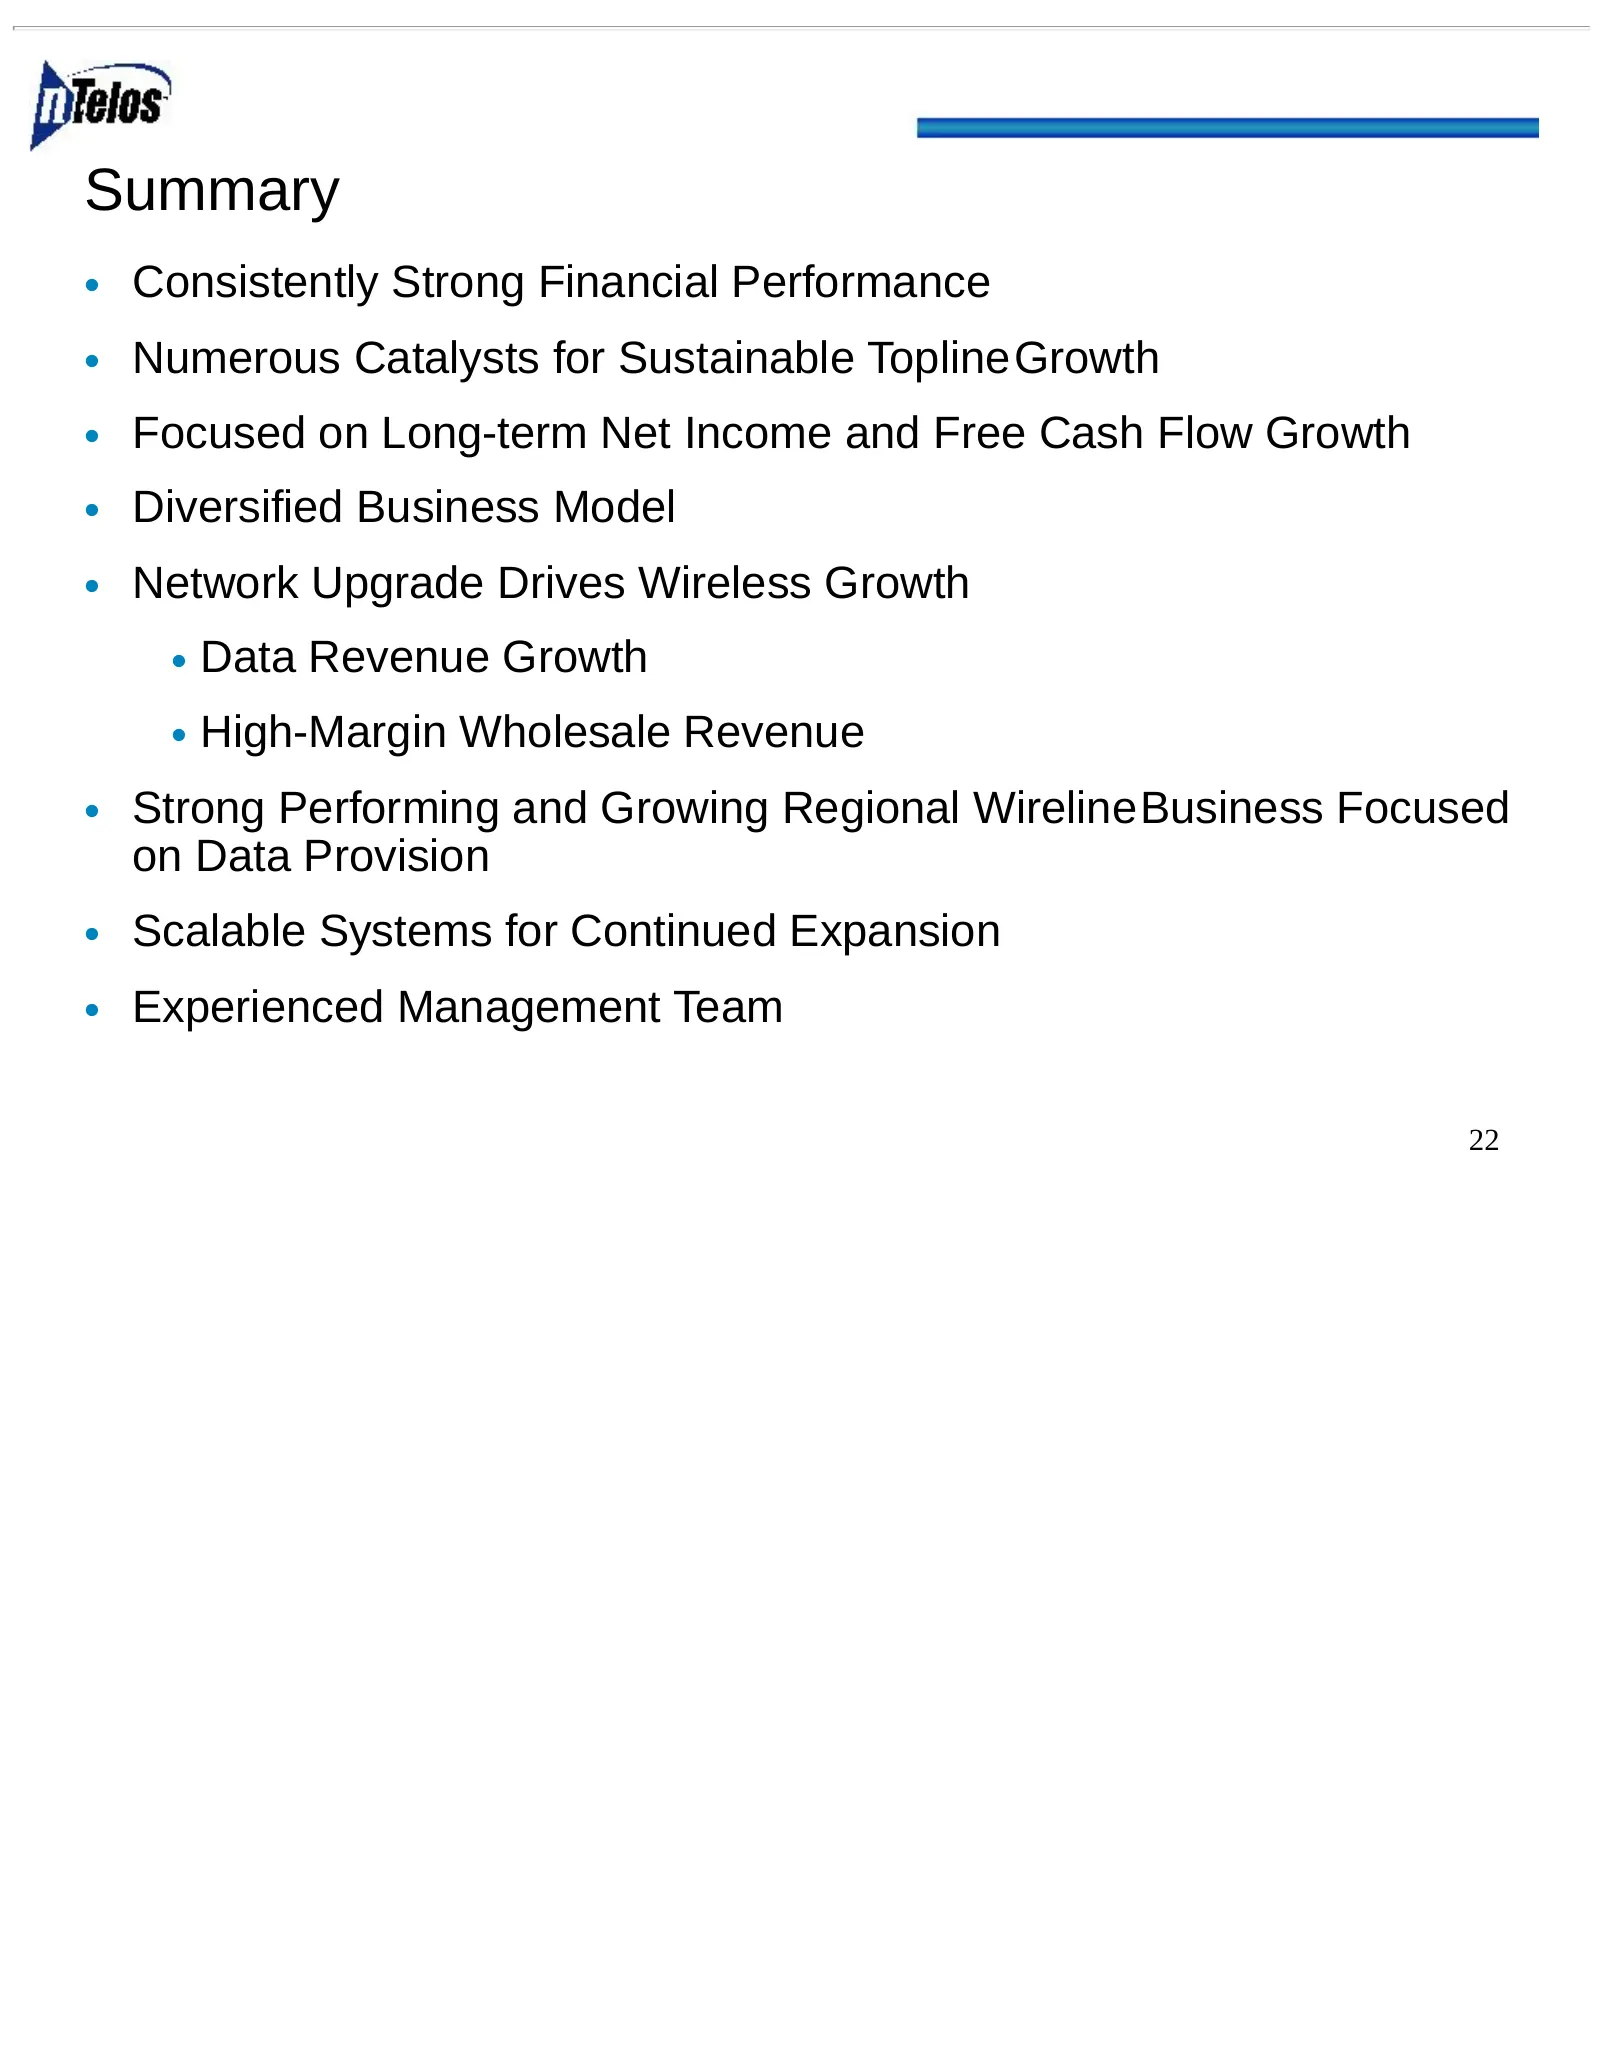
Slide 23: Summary
Summary • Consistently Strong Financial Performance • Numerous Catalysts for Sustainable ToplineGrowth • Focused on Long-term Net Income and Free Cash Flow Growth • Diversified Business Model • Network Upgrade Drives Wireless Growth • Data Revenue Growth • High-Margin Wholesale Revenue • Strong Perf

Slide 24: Appendix
********* ********* ********* ********* ********* ********* ********* ********* * *************** ************** Appendix
Slide 25: Adjusted EBITDA Reconciliation
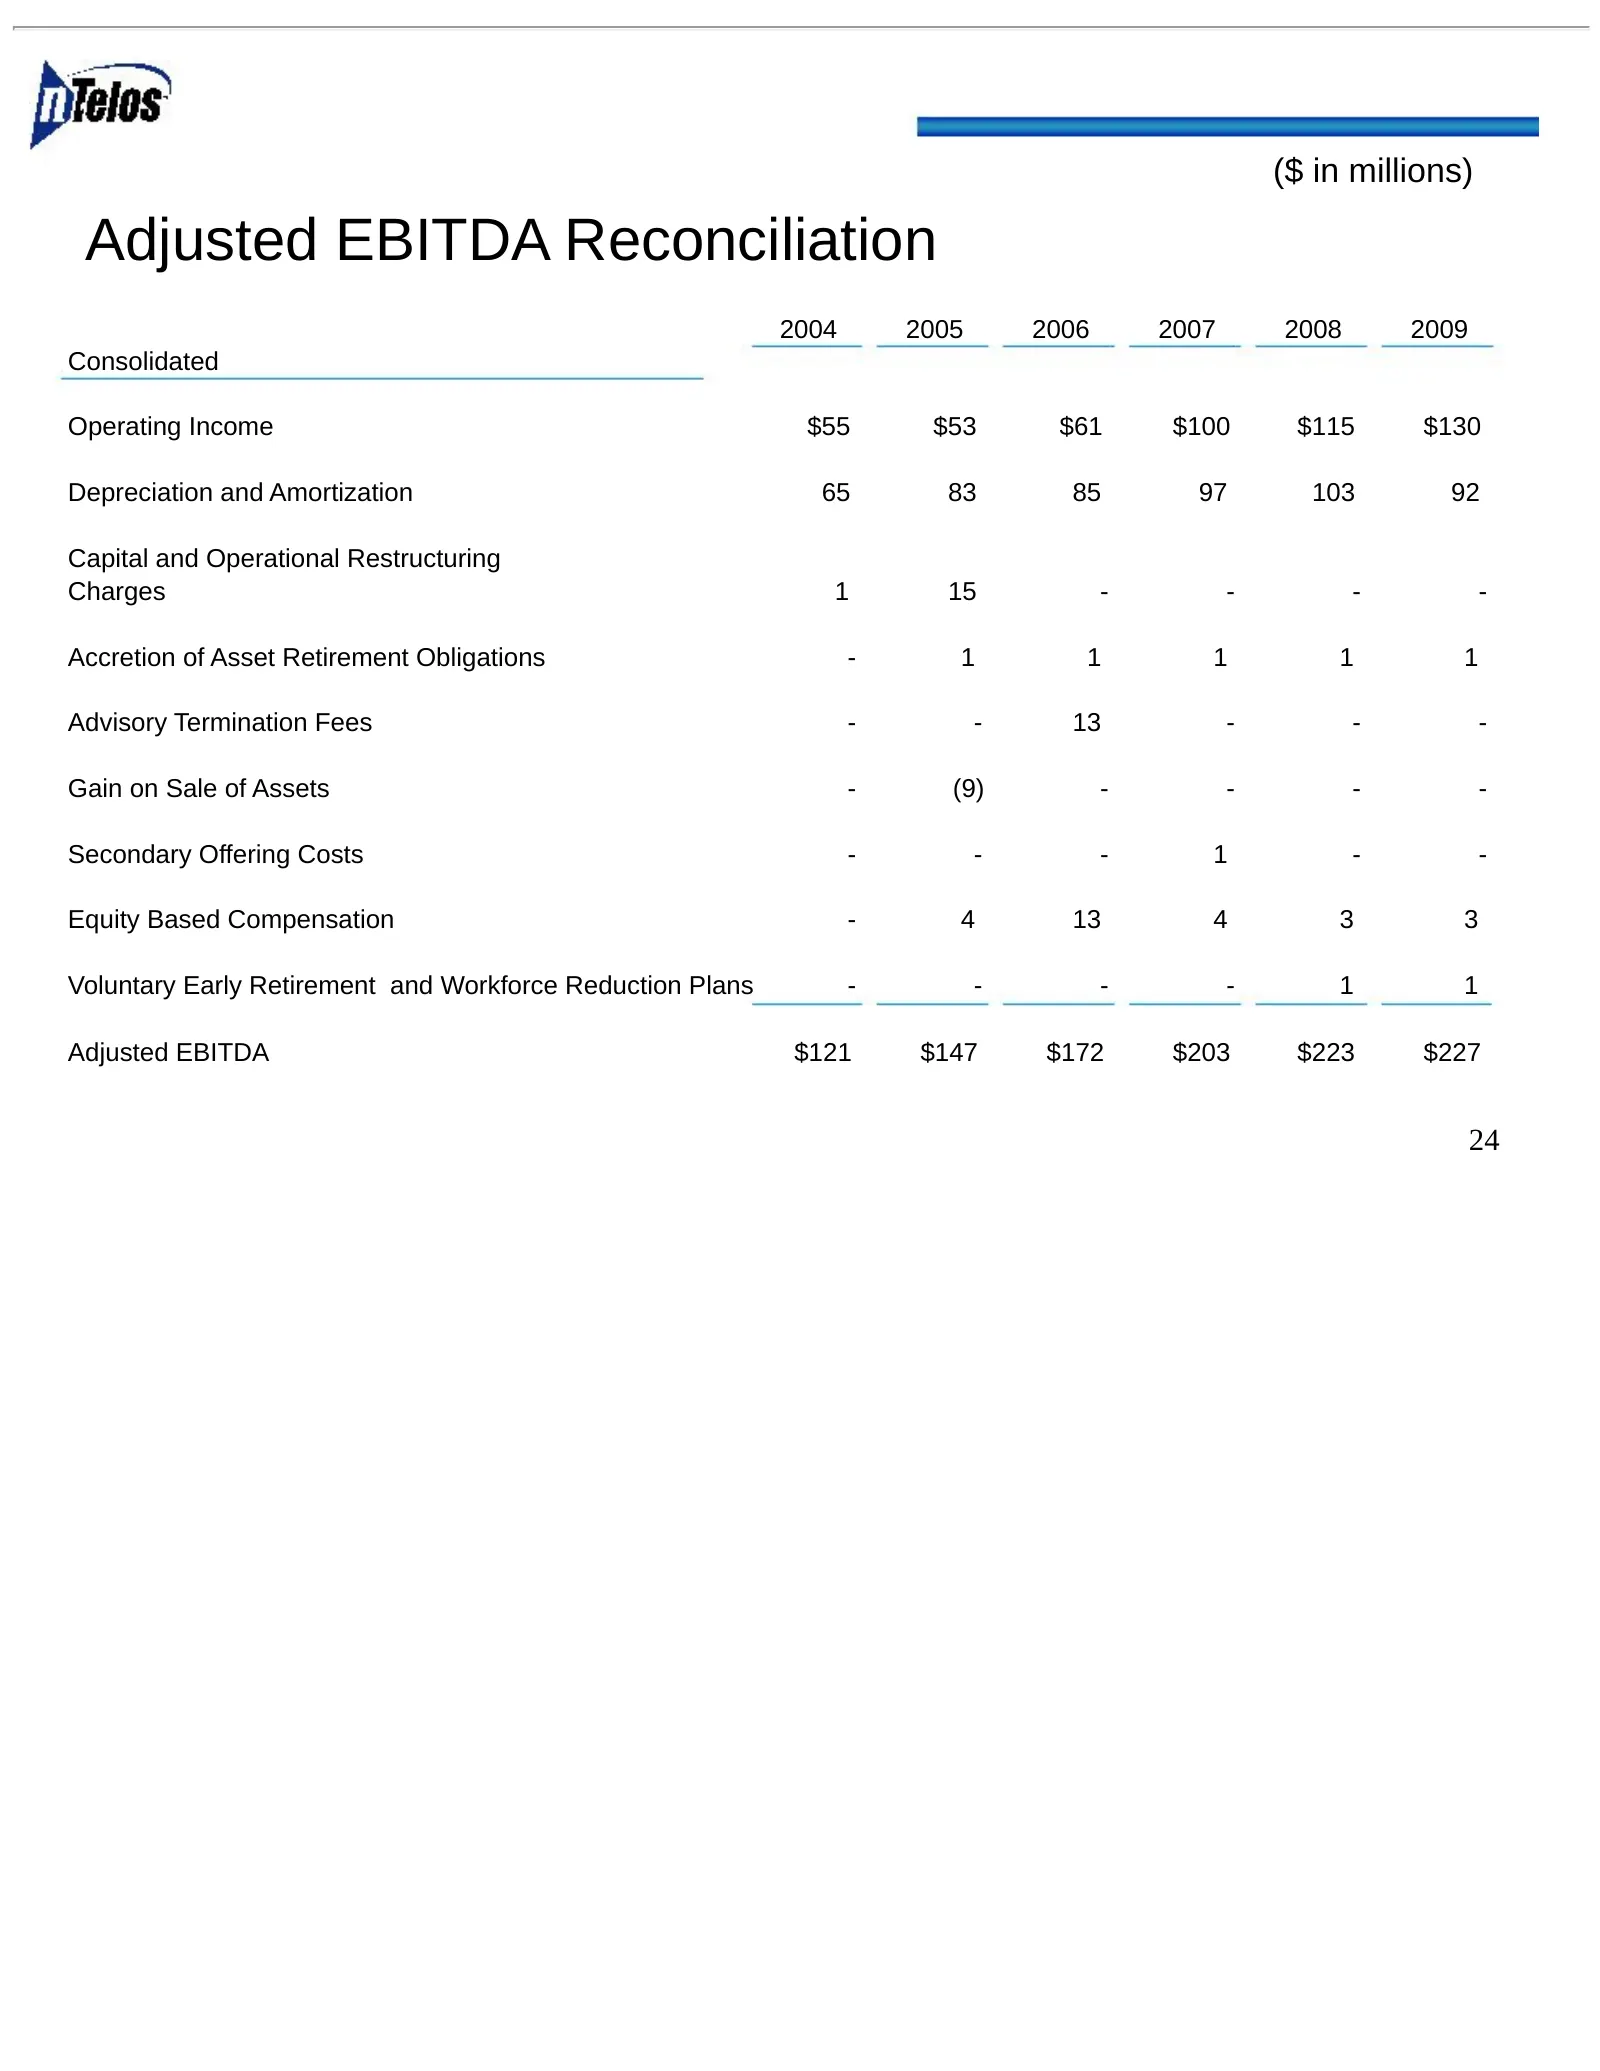
($ in millions) Adjusted EBITDA Reconciliation 2004 2005 2006 2007 2008 2009 Consolidated Operating Income $55 $53 $61 $100 $115 $130 Depreciation and Amortization 65 83 85 97 103 92 Capital and Operational Restructuring Charges 1 15 - - - - Accretion of Asset Retirement Obligations - 1 1 1 1 1 Advi
Slide 26: Adjusted EBITDA Reconciliation
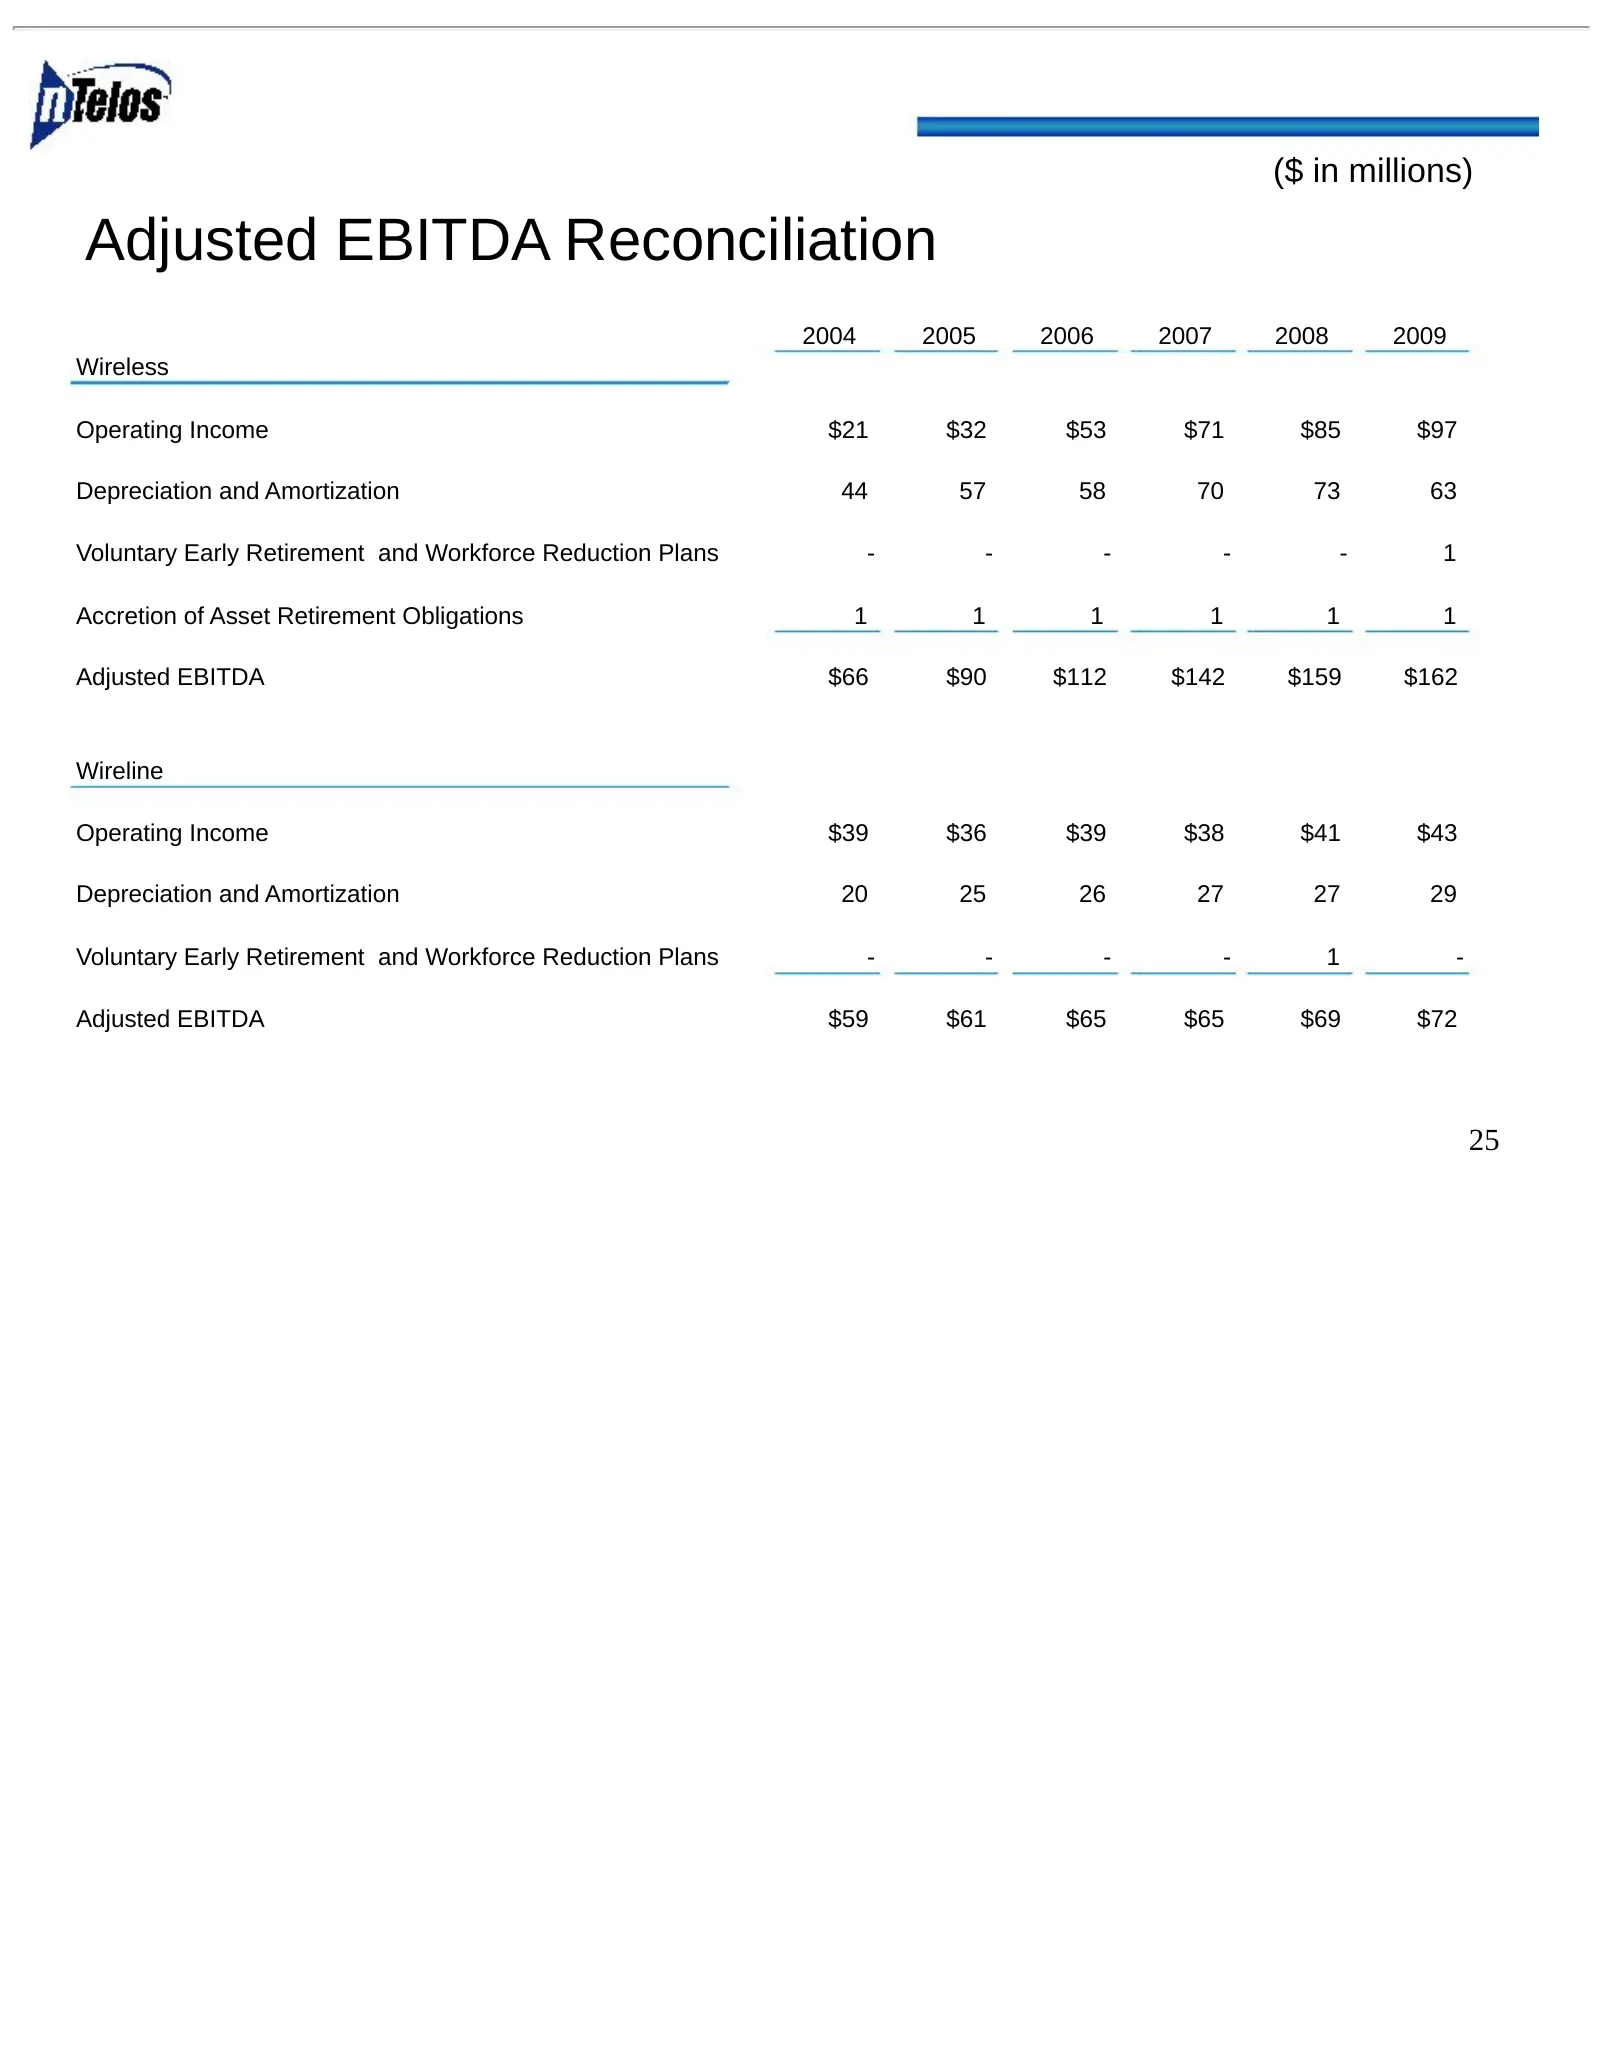
($ in millions) Adjusted EBITDA Reconciliation 2004 2005 2006 2007 2008 2009 Wireless Operating Income $21 $32 $53 $71 $85 $97 Depreciation and Amortization 44 57 58 70 73 63 Voluntary Early Retirement and Workforce Reduction Plans - - - - - 1 Accretion of Asset Retirement Obligations 1 1 1 1 1 1 Ad
Slide 27: ARPU Reconciliation
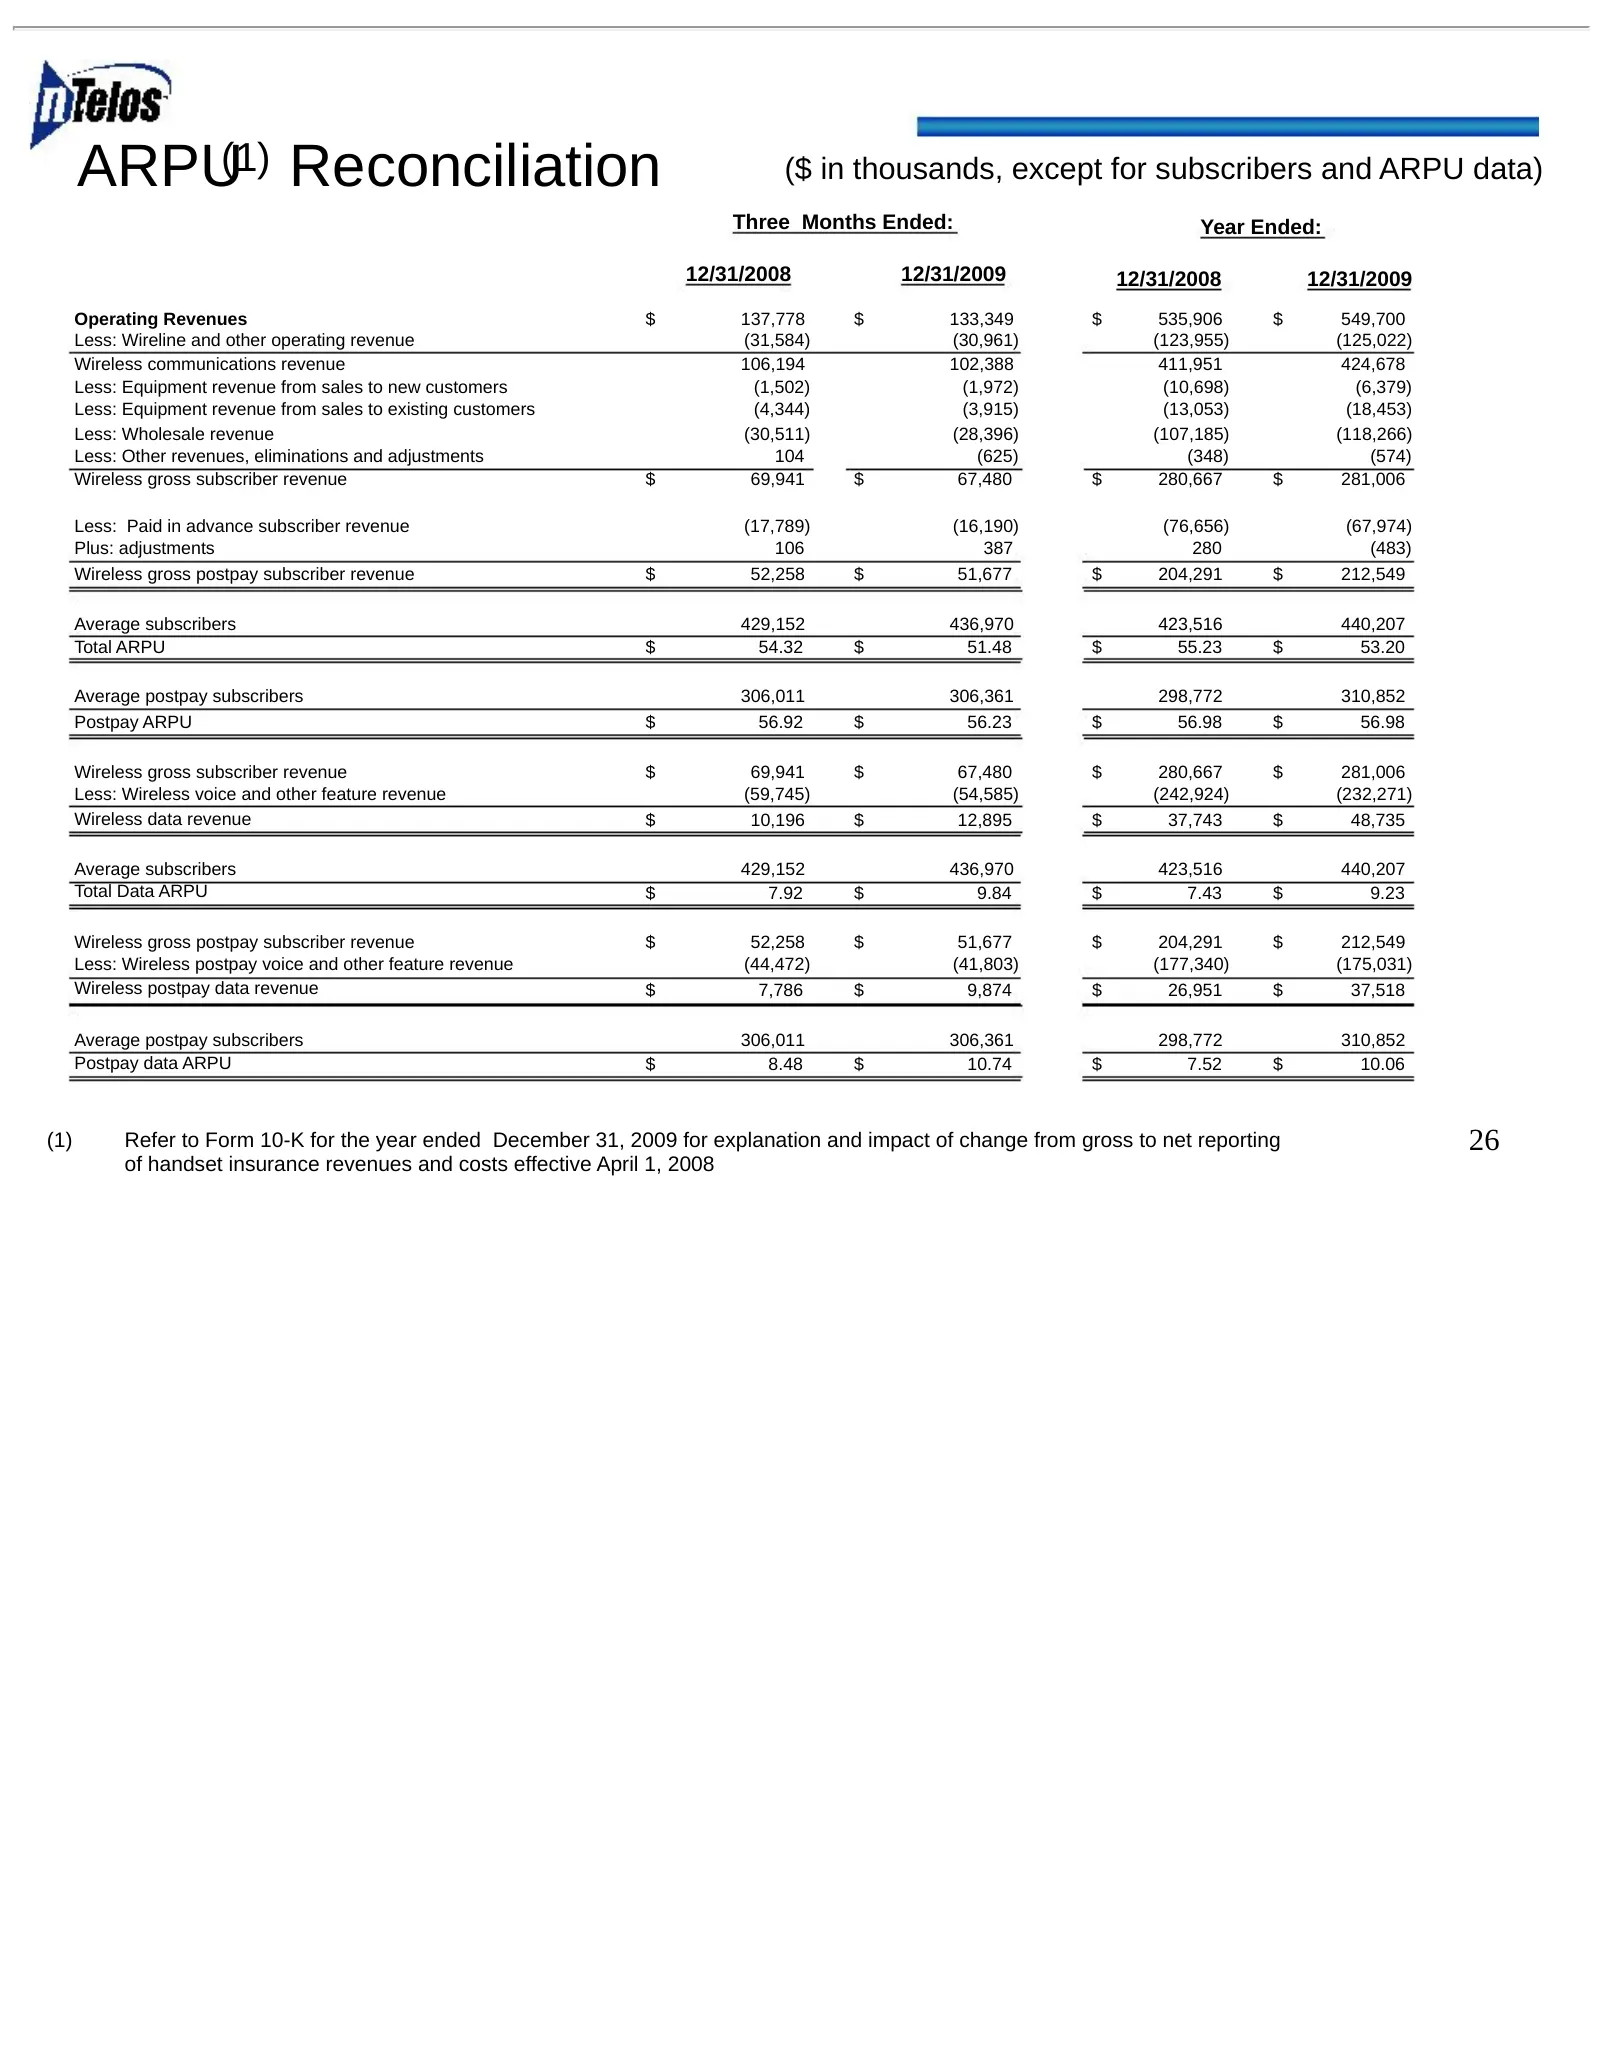
ARPU(1) Reconciliation ($ in thousands, except for subscribers and ARPU data) Three Months Ended: Year Ended: 12/31/2008 12/31/2009 12/31/2008 12/31/2009 Operating Revenues $ 137,778 $ 133,349 $ 535,906 $ 549,700 Less: Wireline and other operating revenue (31,584) (30,961) (123,955) (125,022) Wirele
Slide 28: Summary of Operating Results
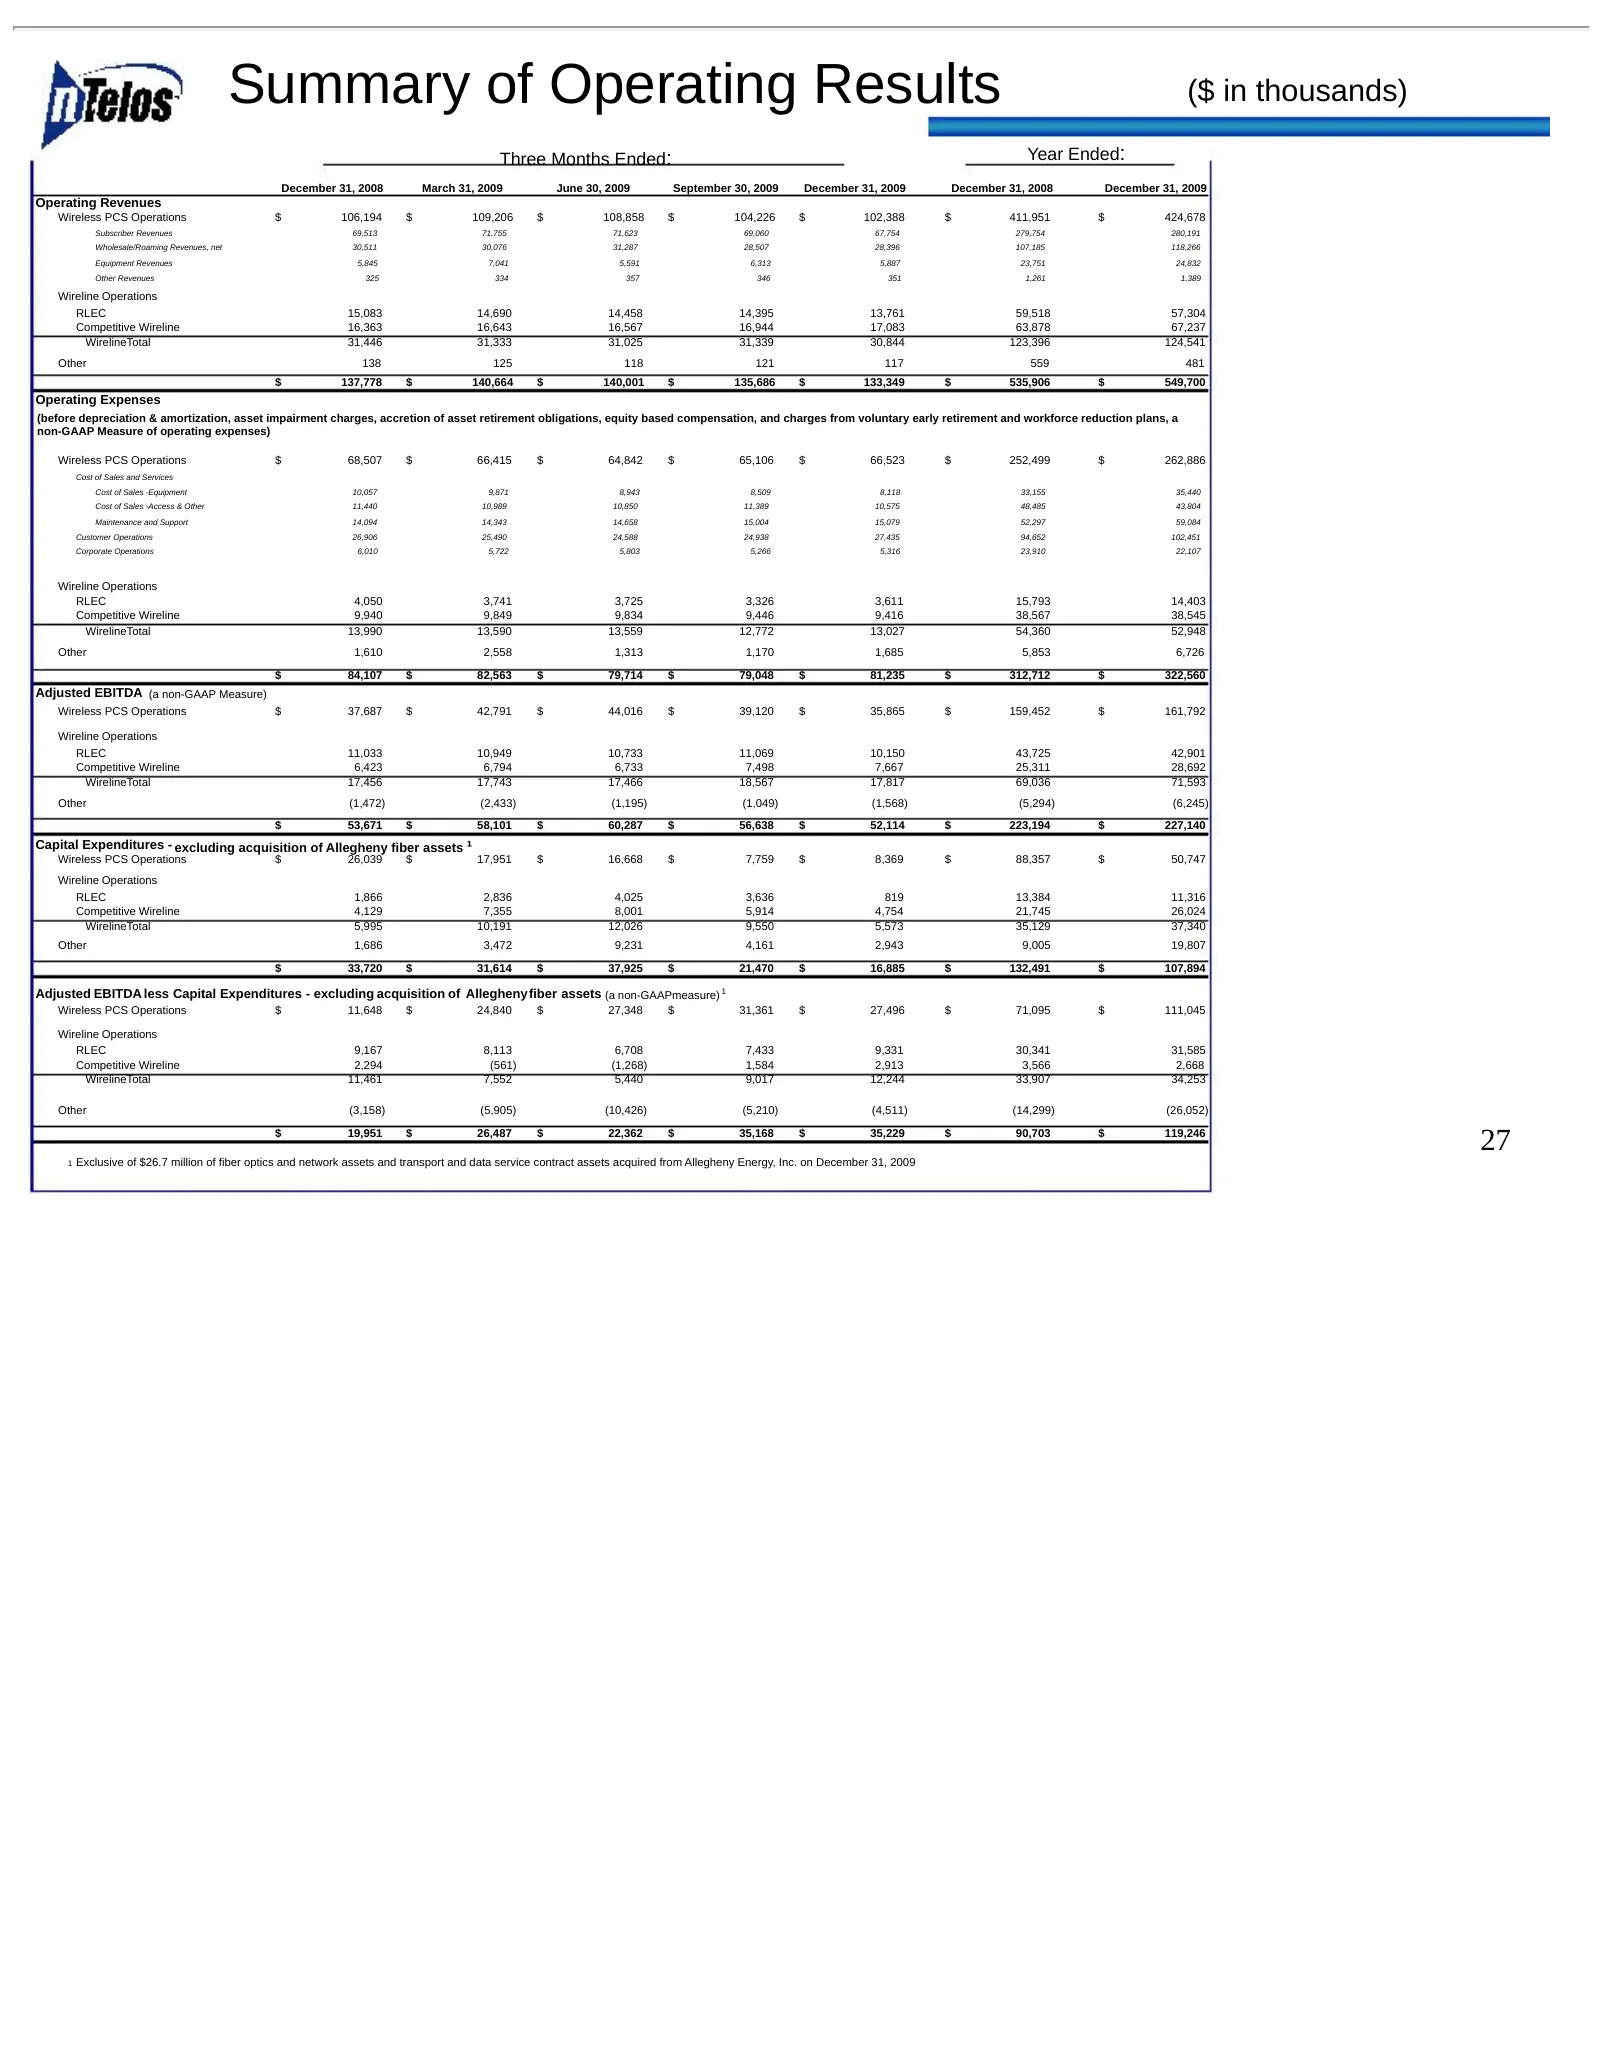
Summary of Operating Results ($ in thousands) Three Months Ended: Year Ended: December 31, 2008 March 31, 2009 June 30, 2009 September 30, 2009 December 31, 2009 December 31, 2008 December 31, 2009 Operating Revenues Wireless PCS Operations $ 106,194 $ 109,206 $ 108,858 $ 104,226 $ 102,388 $ 411,951
Source: SEC EDGAR · 8-K filed Mar 4, 2010
More decks from Ntelos Inc
 Q2 2015 Earnings Presentation21 slides · Jul 28, 2015
 Q1 2015 Earnings Presentation25 slides · May 1, 2015
 Q4 2014 Earnings Presentation26 slides · Feb 26, 2015
 Investor Presentation (December 2014)24 slides · Dec 10, 2014
 Corporate Update (December 2014)27 slides · Dec 2, 2014
 Q3 2014 Earnings Presentation24 slides · Oct 31, 2014