STORE Capital — Investor Presentation (January 2016)
13 slides from STORE Capital's investor presentation, Jan 14, 2016
Slide 1: Disclaimer
Disclaimer This presentation includes forward-looking statements within the meaning of Section 27A of the Securities Act of 1933, as amended, and section 21E of the securities exchange act of 1934, as amended, that are subject to the “safe harbor” created by those sections. These forward-looking sta
Slide 2: STORE shareholder perspective
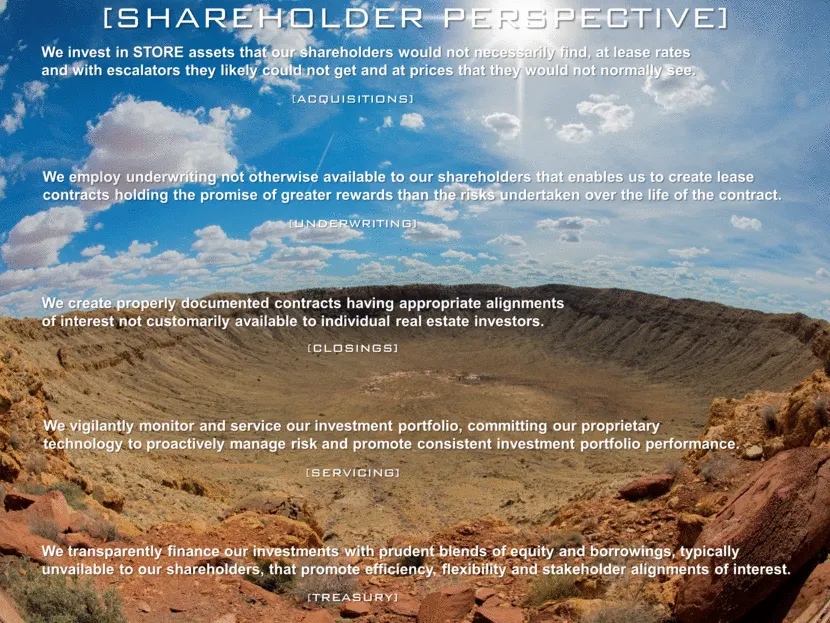
We invest in STORE assets that our shareholders would not necessarily find, at lease rates and with escalators they likely could not get and at prices that they would not normally see. We employ underwriting not otherwise available to our shareholders that enables us to create lease contracts holdin
Slide 3: STORE customer perspective
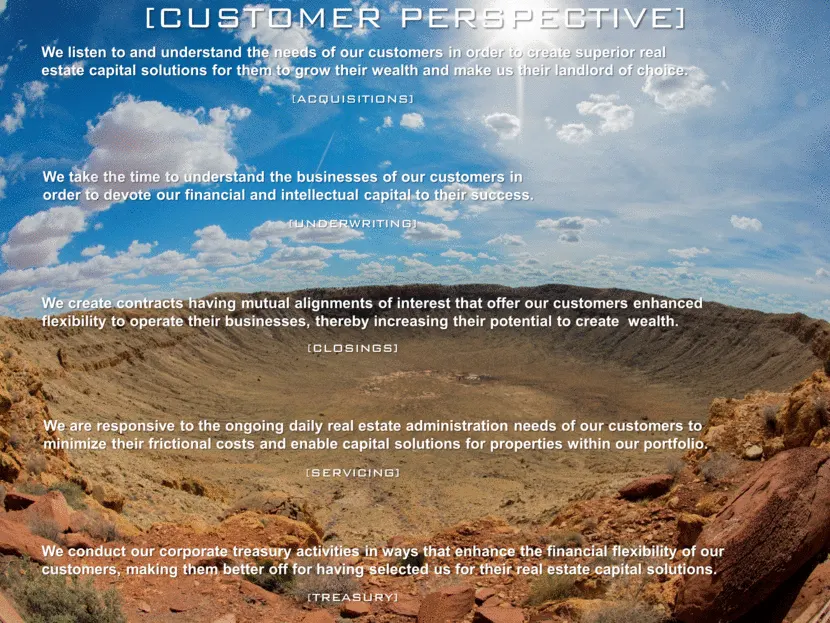
We listen to and understand the needs of our customers in order to create superior real estate capital solutions for them to grow their wealth and make us their landlord of choice. We take the time to understand the businesses of our customers in order to devote our financial and intellectual capita
Slide 4: Making an Impact
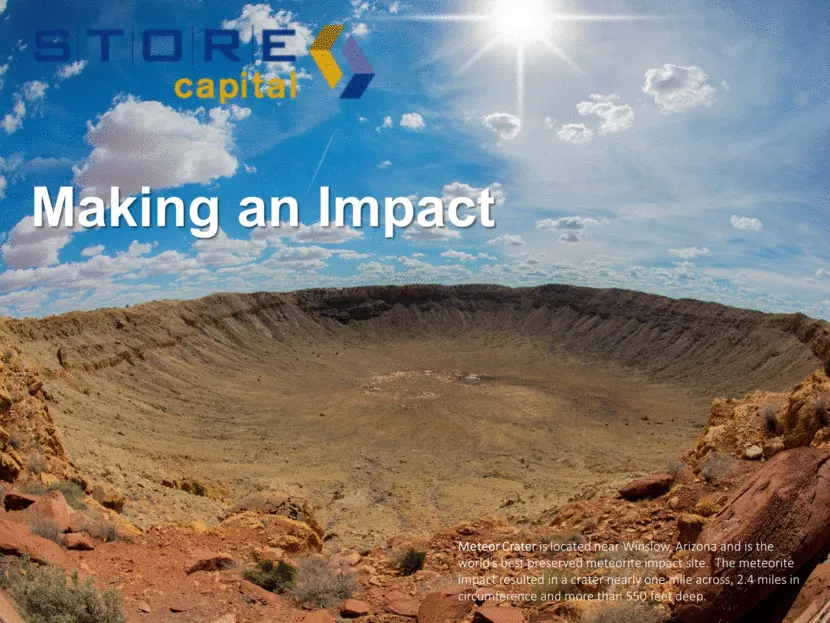
Making an Impact Meteor Crater is located near Winslow, Arizona and is the world’s best preserved meteorite impact site. The meteorite impact resulted in a crater nearly one mile across, 2.4 miles in circumference and more than 550 feet deep.
Slide 5: There Are Just Four Universal Internal Growth Factors
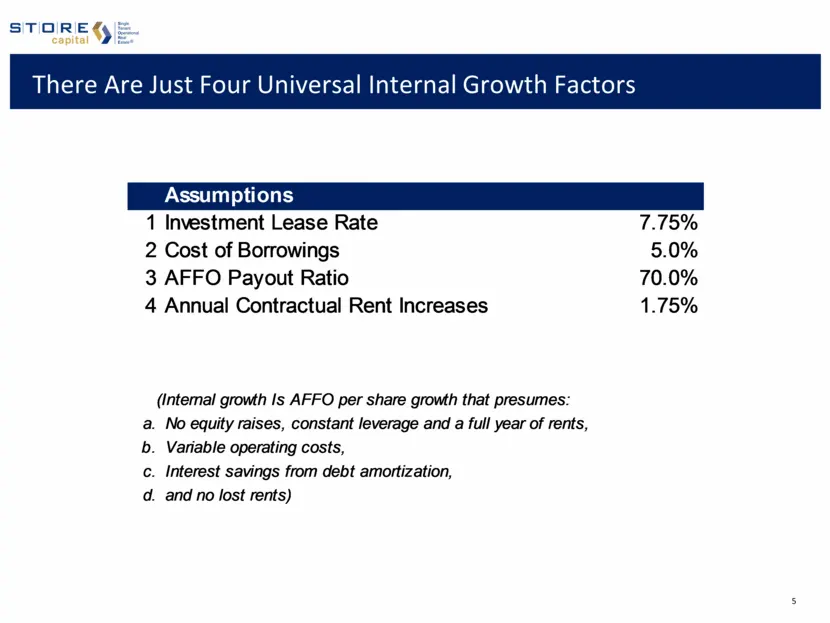
There Are Just Four Universal Internal Growth Factors (Internal growth Is AFFO per share growth that presumes: a. No equity raises, constant leverage and a full year of rents, b. Variable operating costs, c. Interest savings from debt amortization, d. and no lost rents) Assumptions 1 Investment Leas
Slide 6: Internal AFFO Per Share Growth Sensitivity (Two Variables)
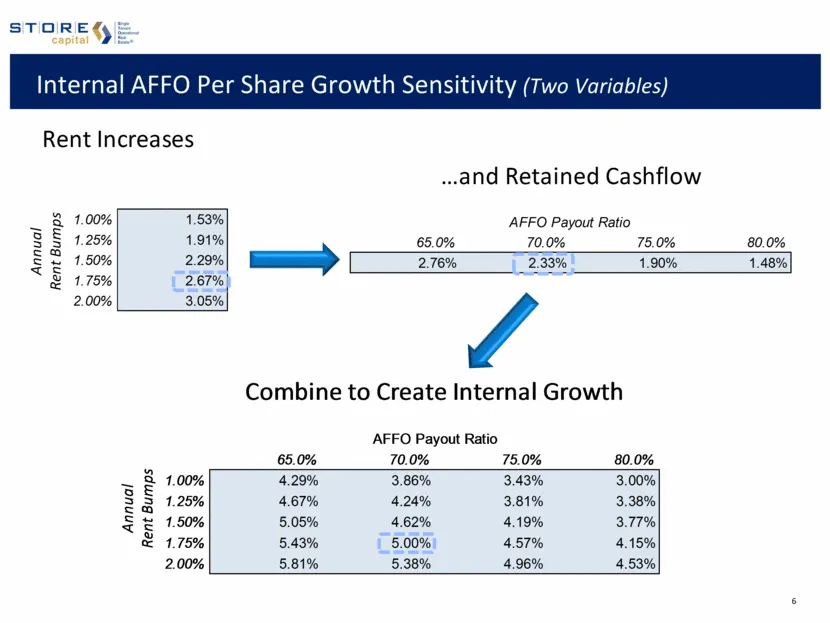
Internal AFFO Per Share Growth Sensitivity (Two Variables) 65.0% 70.0% 75.0% 80.0% 1.00% 4.29% 3.86% 3.43% 3.00% 1.25% 4.67% 4.24% 3.81% 3.38% 1.50% 5.05% 4.62% 4.19% 3.77% 1.75% 5.43% 5.00% 4.57% 4.15% 2.00% 5.81% 5.38% 4.96% 4.53% Combine to Create Internal Growth AFFO Payout Ratio Annual Rent Bum
Slide 7: Cash Retention Impact (Another Two Variables)
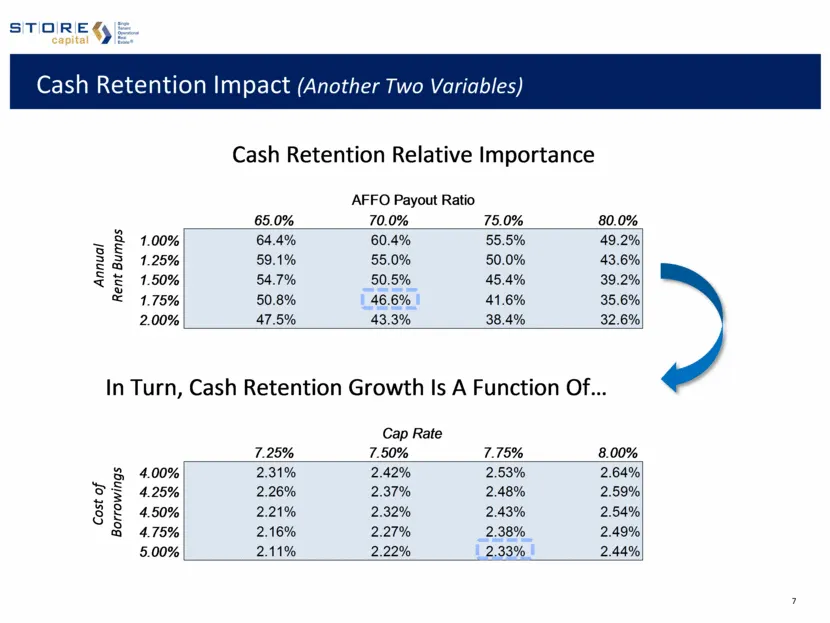
Cash Retention Impact (Another Two Variables) 65.0% 70.0% 75.0% 80.0% 1.00% 64.4% 60.4% 55.5% 49.2% 1.25% 59.1% 55.0% 50.0% 43.6% 1.50% 54.7% 50.5% 45.4% 39.2% 1.75% 50.8% 46.6% 41.6% 35.6% 2.00% 47.5% 43.3% 38.4% 32.6% AFFO Payout Ratio Cash Retention Relative Importance Annual Rent Bumps 7.25% 7.5
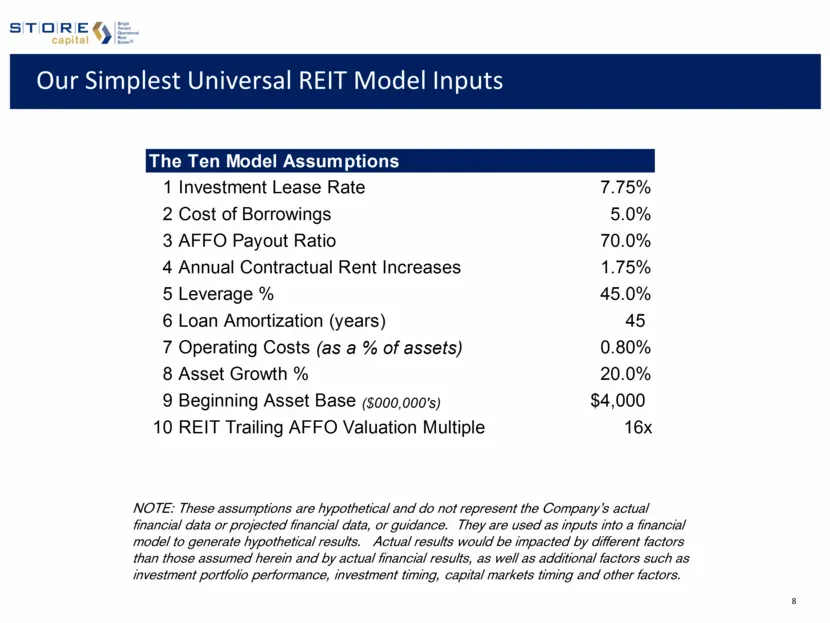
Slide 8: Our Simplest Universal REIT Model Inputs
Our Simplest Universal REIT Model Inputs NOTE: These assumptions are hypothetical and do not represent the Company’s actual financial data or projected financial data, or guidance. They are used as inputs into a financial model to generate hypothetical results. Actual results would be impacted by di
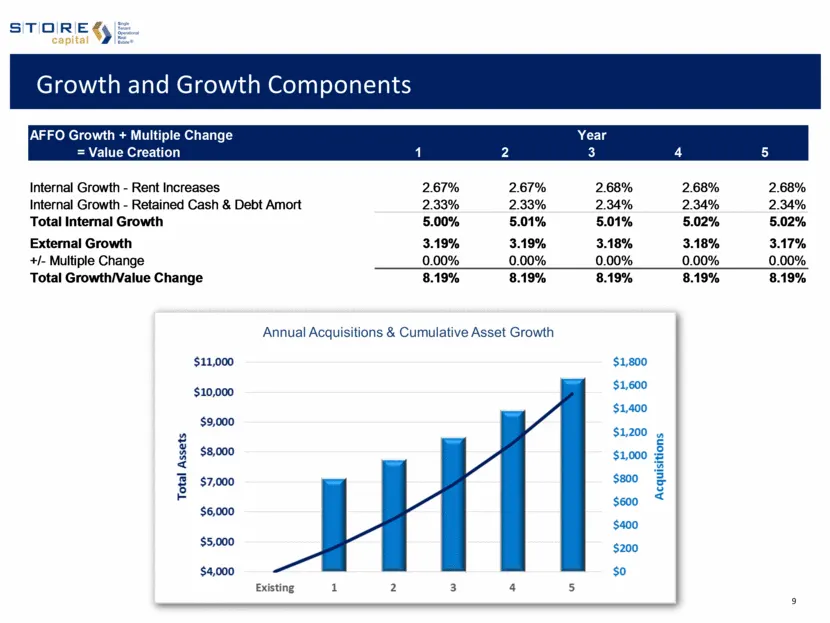
Slide 9: Growth and Growth Components
Growth and Growth Components Annual Acquisitions & Cumulative Asset Growth AFFO Growth + Multiple Change Year = Value Creation 1 2 3 4 5 Internal Growth - Rent Increases 2.67% 2.67% 2.68% 2.68% 2.68% Internal Growth - Retained Cash & Debt Amort 2.33% 2.33% 2.34% 2.34% 2.34% Total Internal Growth 5.0
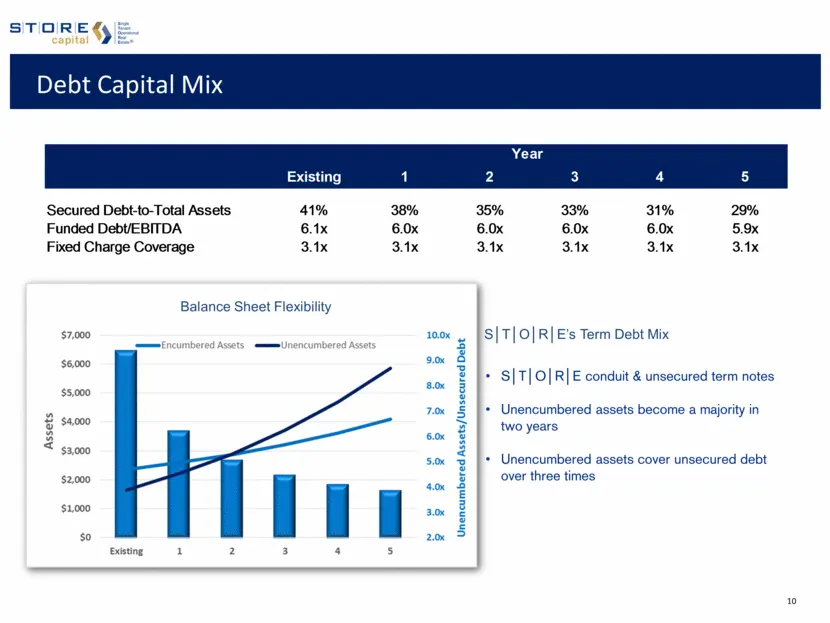
Slide 10: Balance Sheet Flexibility
Debt Capital Mix S T O R E conduit & unsecured term notes Unencumbered assets become a majority in two years Unencumbered assets cover unsecured debt over three times Balance Sheet Flexibility S T O R E’s Term Debt Mix Year Existing 1 2 3 4 5 Secured Debt-to-Total Assets 41% 38% 35% 33% 31% 29% Fund
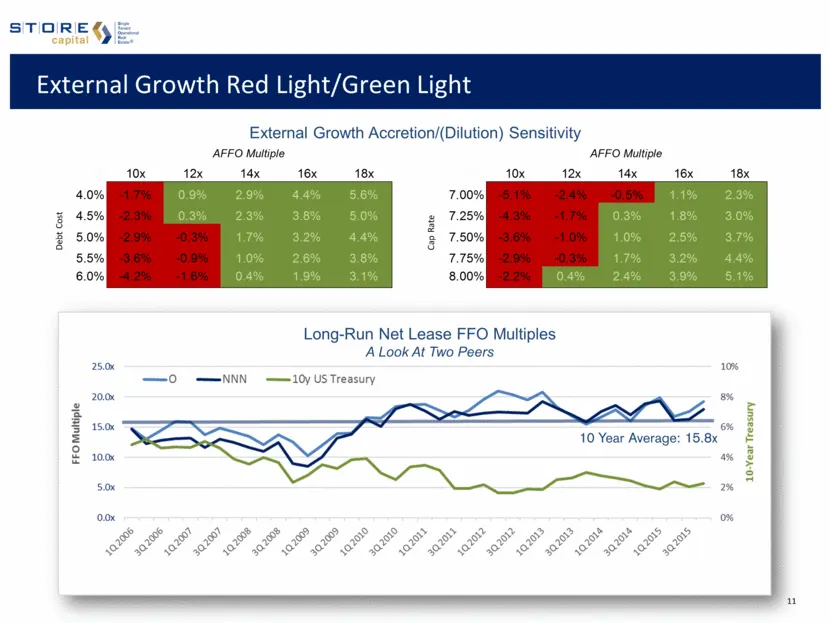
Slide 11: External Growth Red Light/Green Light
External Growth Red Light/Green Light Long-Run Net Lease FFO Multiples A Look At Two Peers 10 Year Average: 15.8x External Growth Accretion/(Dilution) Sensitivity AFFO Multiple AFFO Multiple 3.2% 10x 12x 14x 16x 18x 4.0% -1.7% 0.9% 2.9% 4.4% 5.6% 4.5% -2.3% 0.3% 2.3% 3.8% 5.0% 5.0% -2.9% -0.3% 1.7%
Slide 12: Model Shareholder Performance
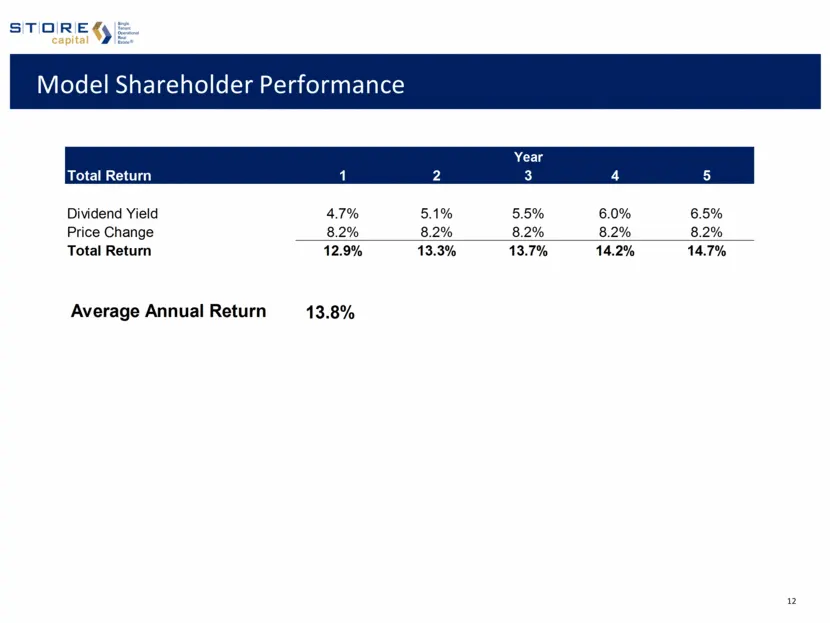
Model Shareholder Performance 2 5.1% 8.2% 13.3% 3 5.5% 8.2% 13.7% 4 6.0% 8.2% 14.2% 5 6.5% 8.2% 14.7% Year Total Return Dividend Yield Price Change Total Return 1 4.7% 8.2% 12.9% Average Annual Return 13.8%
Slide 13: STORE Capital Model Shareholder Performance
STORE: capital Model Shareholder Performance Year Total Return a 2 3 4 5 Dividend Yield 47% 5.1% 5.5% 6.0% 6.5% Price Change 8.2% 8.2% 8.2% 8.2% 8.2% Total Return 12.9% 13.3% 13.7% 14.2% 14.7% Average Annual Return 13.8%
Source: SEC EDGAR · 8-K filed Jan 14, 2016
More decks from STORE Capital Corp
 Q2 2023 Earnings Presentation10 slides · Aug 4, 2023
 Q2 2022 Earnings Presentation26 slides · Aug 3, 2022
 Q2 2022 Earnings Presentation22 slides · Aug 3, 2022
 Q1 2022 Earnings Presentation26 slides · May 4, 2022
 Q1 2022 Earnings Presentation22 slides · May 4, 2022
 Q4 2021 Earnings Presentation33 slides · Feb 23, 2022