Vertex Energy — Q2 2020 Earnings Presentation
19 slides from Vertex Energy's earnings presentation, Aug 11, 2020

Slide 1: 2Q20 Conference Call
August 11, 2020 2Q20 Conference Call
Slide 2: Disclaimer
Disclaimer This document may contain forward - looking statements including words such as “may,” “can,” “could,” “should,” “predict,” “aim,” “potential,” “continue,” “opportunity,” “intend,” “goal,” “estimate,” “expect,” “expectations,” “project,” “projections,” “plans,” “anticipates,” “believe,” “t
Slide 3: 2Q20 Business Update
Werrex 2Q20 Business Update
Slide 4: Post COVID-19: Charting a Path Toward Recovery
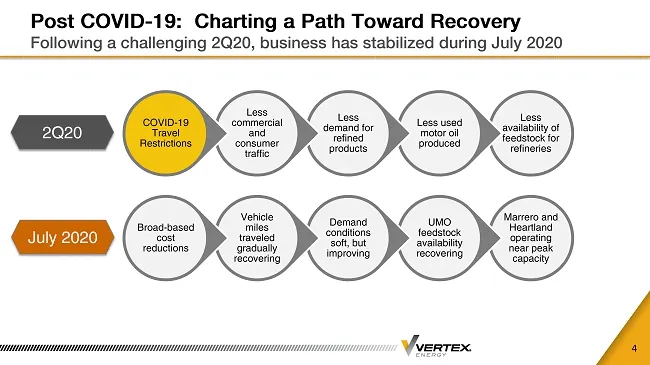
Post COVID - 19: Charting a Path Toward Recovery Following a challenging 2Q20, business has stabilized during July 2020 4 Less availability of feedstock for refineries Less used motor oil produced Less demand for refined products Less commercial and consumer traffic COVID - 19 Travel Restrictions 2Q
Slide 5: Key Financial Metrics Second Quarter 2020
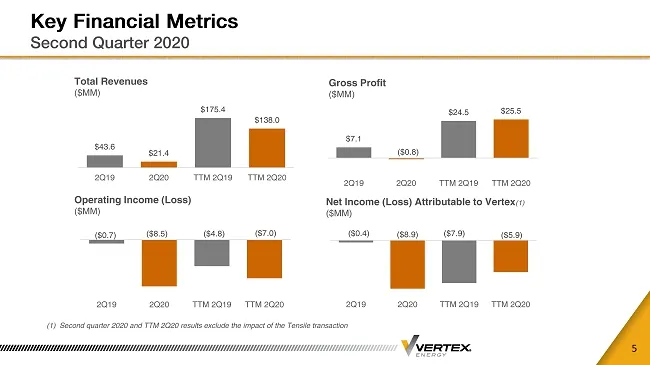
Key Financial Metrics Second Quarter 2020 5 Total Revenues ($MM) Gross Profit ($MM) Operating Income (Loss) ($MM) Net Income (Loss) Attributable to Vertex (1) ($MM) (1) Second quarter 2020 and TTM 2Q20 results exclude the impact of the Tensile transaction $43.6 $21.4 $175.4 $138.0 2Q19 2Q20 TTM 2Q19
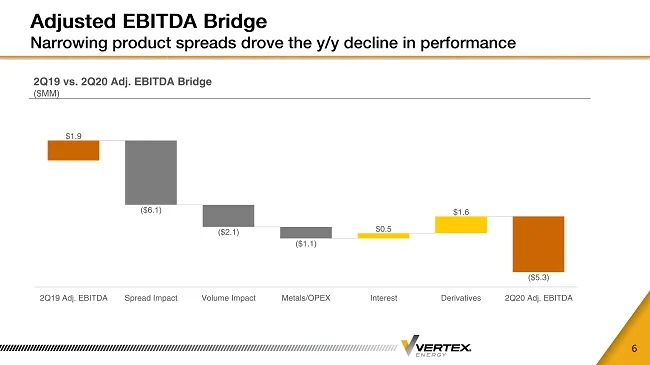
Slide 6: Adjusted EBITDA Bridge
Adjusted EBITDA Bridge Narrowing product spreads drove the y/y decline in performance 6 2Q19 vs. 2Q20 Adj. EBITDA Bridge ($MM)
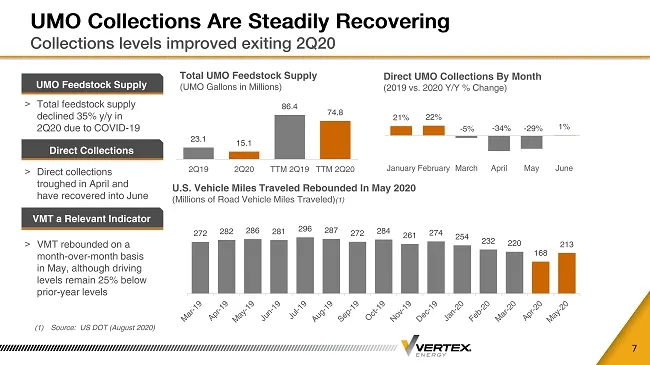
Slide 7: UMO Collections Are Steadily Recovering
UMO Collections Are Steadily Recovering Collections levels improved exiting 2Q20 7 Total UMO Feedstock Supply (UMO Gallons in Millions) > Total feedstock supply declined 35% y/y in 2Q20 due to COVID - 19 UMO Feedstock Supply > VMT rebounded on a month - over - month basis in May, although driving le
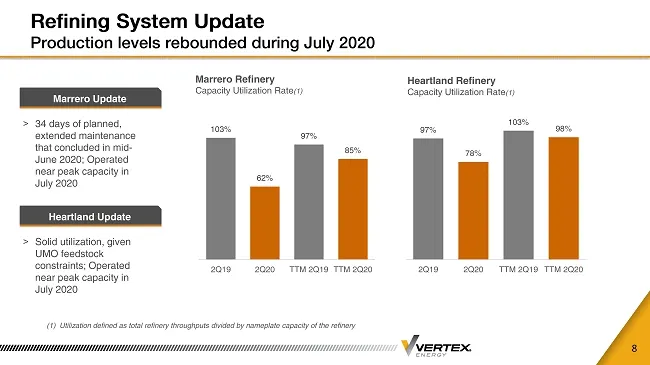
Slide 8: Refining System Update
Refining System Update Production levels rebounded during July 2020 8 (1) Utilization defined as total refinery throughputs divided by nameplate capacity of the refinery Marrero Refinery Capacity Utilization Rate (1) Heartland Refinery Capacity Utilization Rate (1) > 34 days of planned, extended mai
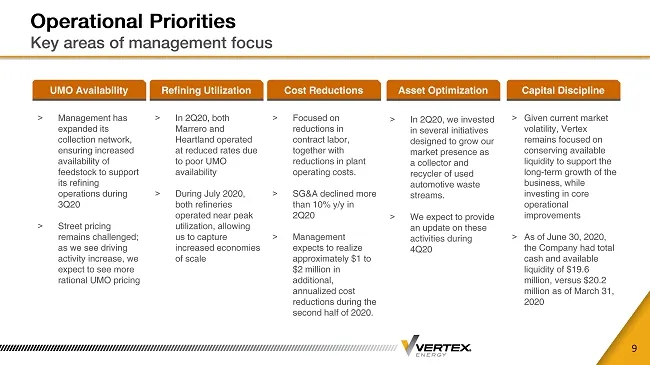
Slide 9: Operational Priorities
Operational Priorities Key areas of management focus 9 UMO Availability > Management has expanded its collection network, ensuring increased availability of feedstock to support its refining operations during 3Q20 > Street pricing remains challenged; as we see driving activity increase, we expect to
Slide 10: COVID-Related Demand Softness Impacted Margin Capture
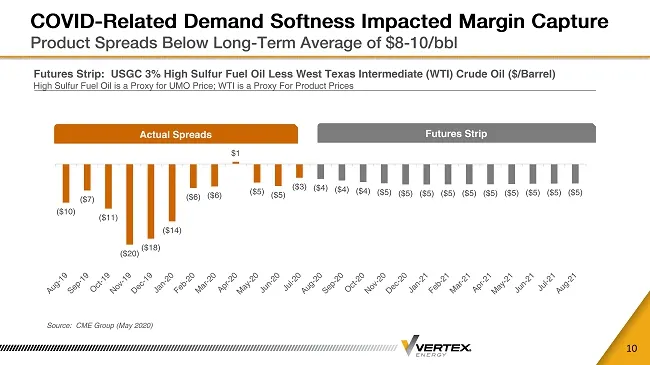
COVID - Related Demand Softness Impacted Margin Capture Product Spreads Below Long - Term Average of $8 - 10/ bbl 10 Futures Strip: USGC 3% High Sulfur Fuel Oil Less West Texas Intermediate (WTI) Crude Oil ($/Barrel) High Sulfur Fuel Oil is a Proxy for UMO Price; WTI is a Proxy For Product Prices So
Slide 11: Balance Sheet Update
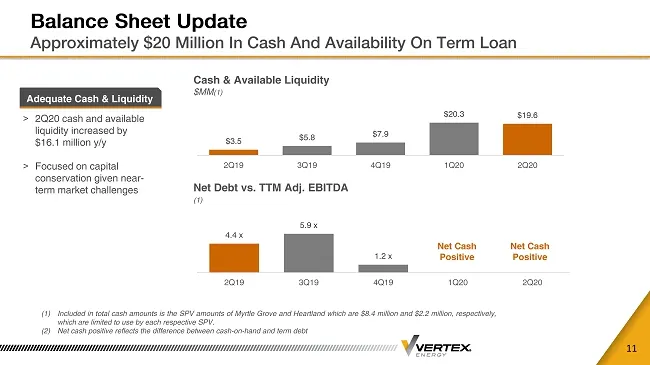
Balance Sheet Update Approximately $20 Million In Cash And Availability On Term Loan 11 (1) Included in total cash amounts is the SPV amounts of Myrtle Grove and Heartland which are $ 8 . 4 million and $ 2 . 2 million, respectively, which are limited to use by each respective SPV . (2) Net cash posi
Slide 12: Appendix
Werrex APPENDIX
Slide 13: Corporate Overview
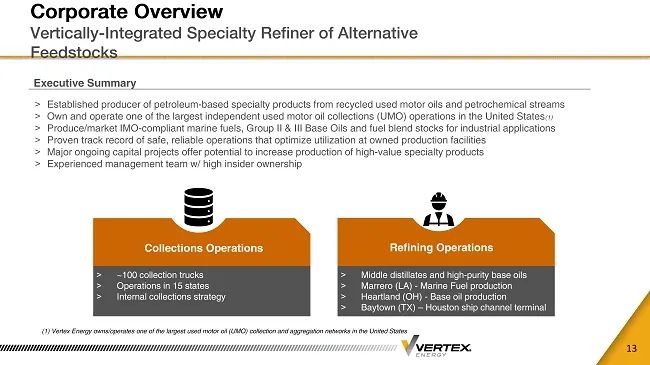
Corporate Overview Vertically - Integrated Specialty Refiner of Alternative Feedstocks 13 > ~100 collection trucks > Operations in 15 states > Internal collections strategy Collections Operations > Middle distillates and high - purity base oils > Marrero (LA) - Marine Fuel production > Heartland (OH
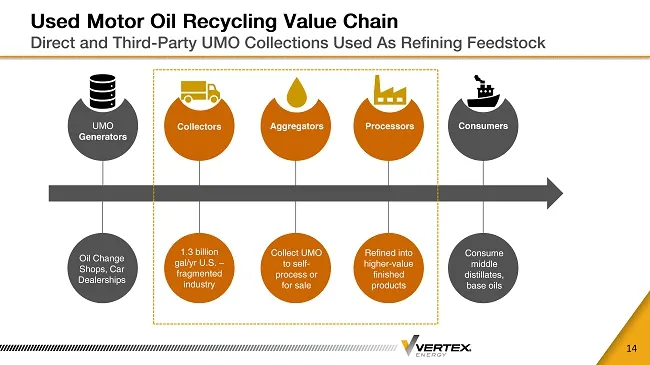
Slide 14: Used Motor Oil Recycling Value Chain
Used Motor Oil Recycling Value Chain Direct and Third - Party UMO Collections Used As Refining Feedstock 14 UMO Generators Collectors Aggregators Processors Consumers Oil Change Shops, Car Dealerships 1.3 billion gal/ yr U.S. – fragmented industry Collect UMO to self - process or for sale Refined in
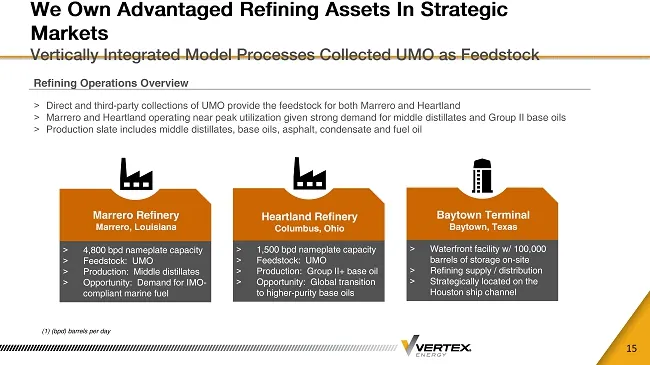
Slide 15: We Own Advantaged Refining Assets In Strategic Markets
We Own Advantaged Refining Assets In Strategic Markets Vertically Integrated Model Processes Collected UMO as Feedstock 15 > 4,800 bpd nameplate capacity > Feedstock: UMO > Production: Middle distillates > Opportunity: Demand for IMO - compliant marine fuel Marrero Refinery Marrero, Louisiana > 1,50
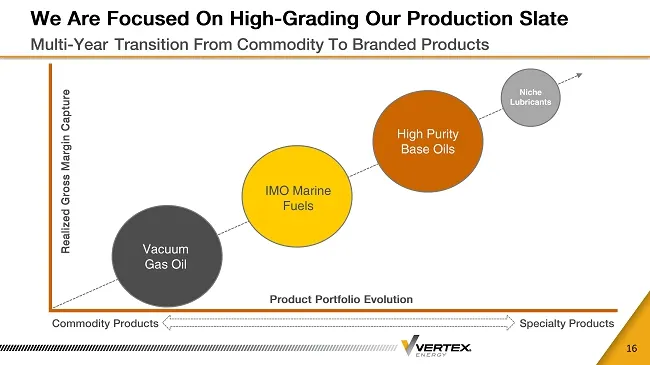
Slide 16: We Are Focused On High-Grading Our Production Slate
We Are Focused On High - Grading Our Production Slate Multi - Year Transition From Commodity To Branded Products 16 Realized Gross Margin Capture Product Portfolio Evolution Commodity Products Specialty Products Vacuum Gas Oil IMO Marine Fuels High Purity Base Oils Niche Lubricants
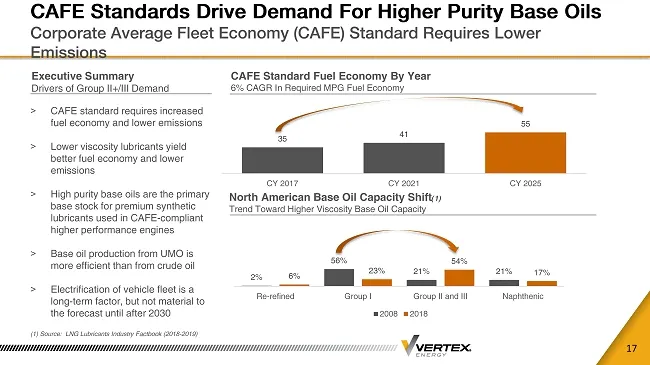
Slide 17: CAFE Standards Drive Demand For Higher Purity Base Oils
CAFE Standards Drive Demand For Higher Purity Base Oils Corporate Average Fleet Economy (CAFE) Standard Requires Lower Emissions 17 Executive Summary Drivers of Group II+/III Demand CAFE Standard Fuel Economy By Year 6% CAGR In Required MPG Fuel Economy > CAFE standard requires increased fuel econom
Slide 18: Compelling Investment Thesis
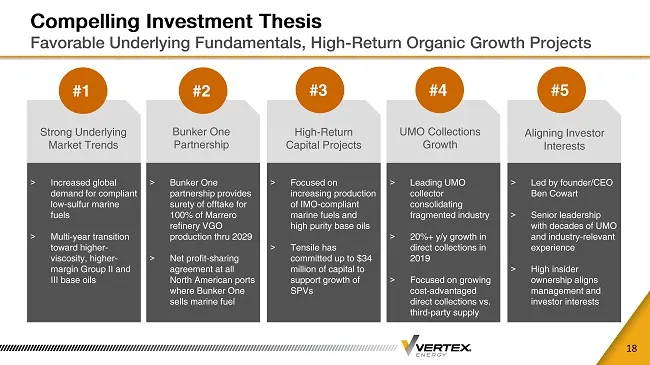
Compelling Investment Thesis Favorable Underlying Fundamentals, High - Return Organic Growth Projects 18 > Increased global demand for compliant low - sulfur marine fuels > Multi - year transition toward higher - viscosity, higher - margin Group II and III base oils Strong Underlying Market Trends >
Slide 19: Our Strategic Focus
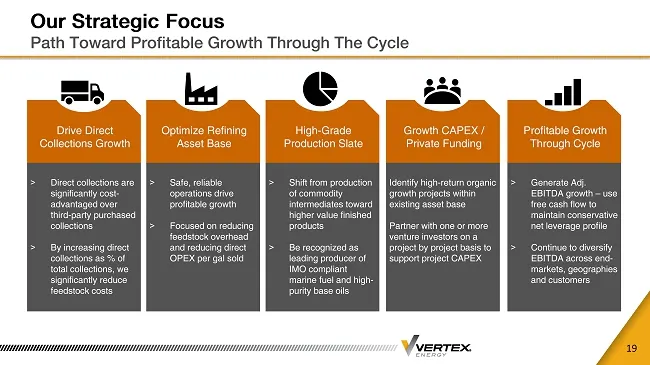
Our Strategic Focus Path Toward Profitable Growth Through The Cycle 19 > Direct collections are significantly cost - advantaged over third - party purchased collections > By increasing direct collections as % of total collections, we significantly reduce feedstock costs Drive Direct Collections Grow
Source: SEC EDGAR · 8-K filed Aug 11, 2020
More decks from Vertex Energy Inc
 Q2 2024 Earnings Presentation21 slides · Aug 8, 2024
 Q1 2024 Earnings Presentation20 slides · May 9, 2024
 Q4 2023 Earnings Presentation29 slides · Feb 28, 2024
 Q3 2023 Earnings Presentation27 slides · Nov 7, 2023
 Q2 2023 Earnings Presentation26 slides · Aug 9, 2023
 Q1 2023 Earnings Presentation26 slides · May 9, 2023