Atlantic Capital Bancshares Inc
Atlantic Capital Bancshares — Investor Presentation (November 2018)
26 slides from Atlantic Capital Bancshares's investor presentation, Nov 6, 2018
Slide 1: Investor Presentation Q3 2018
NASDAQ TICKER: ACBI INVESTOR PRESENTATION | Q3 2018
Slide 2: Forward-Looking Statements
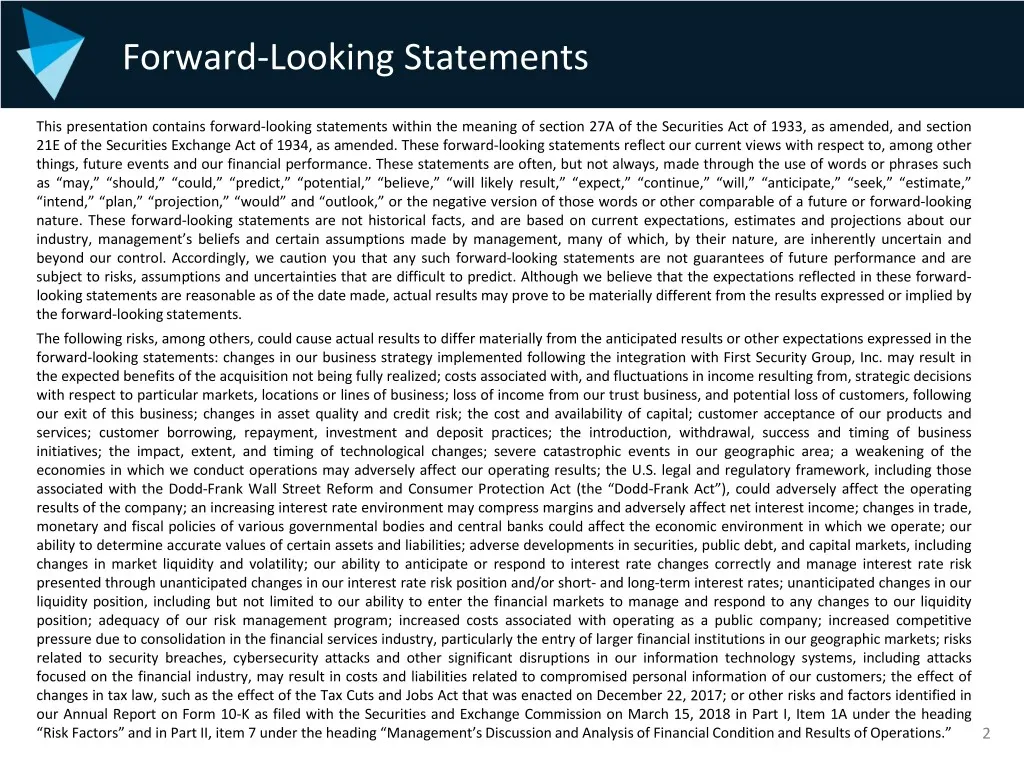
Forward-Looking Statements This presentation contains forward-looking statements within the meaning of section 27A of the Securities Act of 1933, as amended, and section 21E of the Securities Exchange Act of 1934, as amended. These forward-looking statements reflect our current views with respect to
Slide 3: Non-GAAP Financial Information
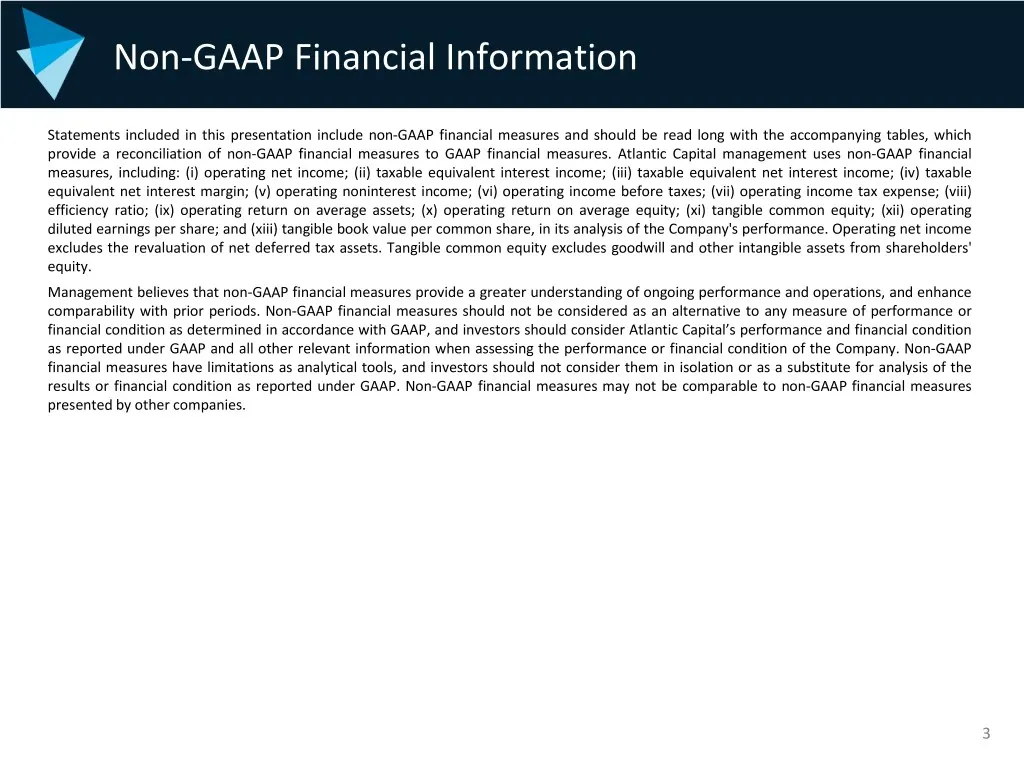
Non-GAAP Financial Information Statements included in this presentation include non-GAAP financial measures and should be read long with the accompanying tables, which provide a reconciliation of non-GAAP financial measures to GAAP financial measures. Atlantic Capital management uses non-GAAP financ
Slide 4: Our Company Highlights
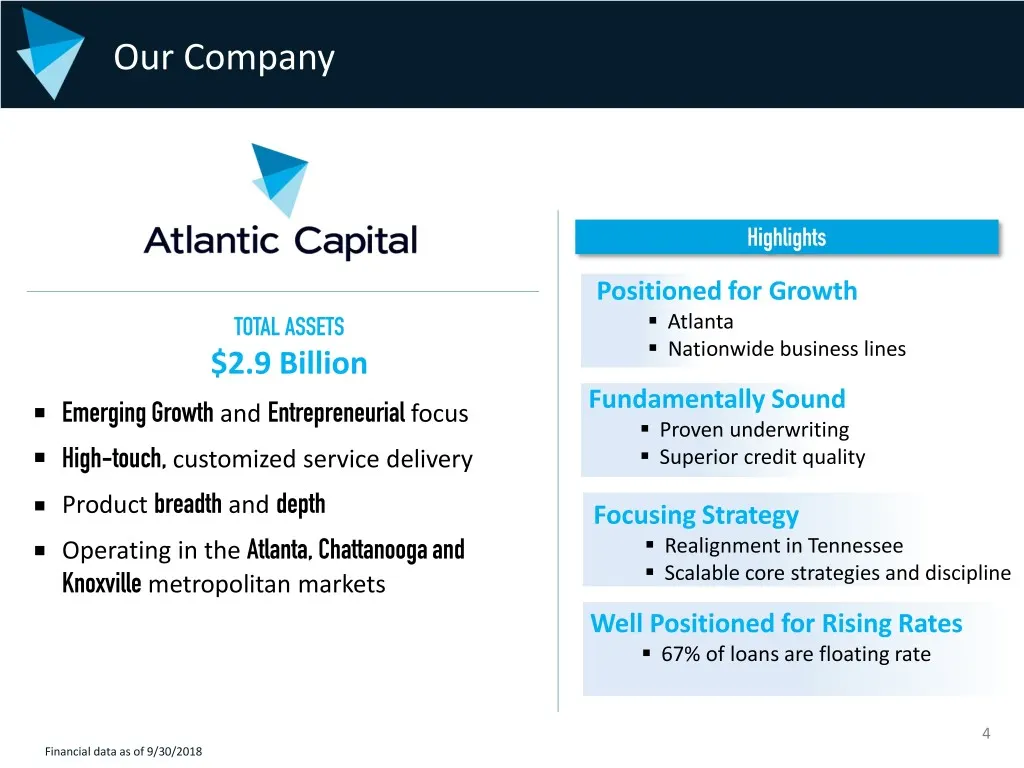
Our Company Highlights Positioned for Growth TOTAL ASSETS . Atlanta . $2.9 Billion Nationwide business lines Fundamentally Sound Emerging Growth and Entrepreneurial focus . Proven underwriting High-touch, customized service delivery . Superior credit quality Product breadth and depth Focusing Strate
Slide 5: Our Strategy
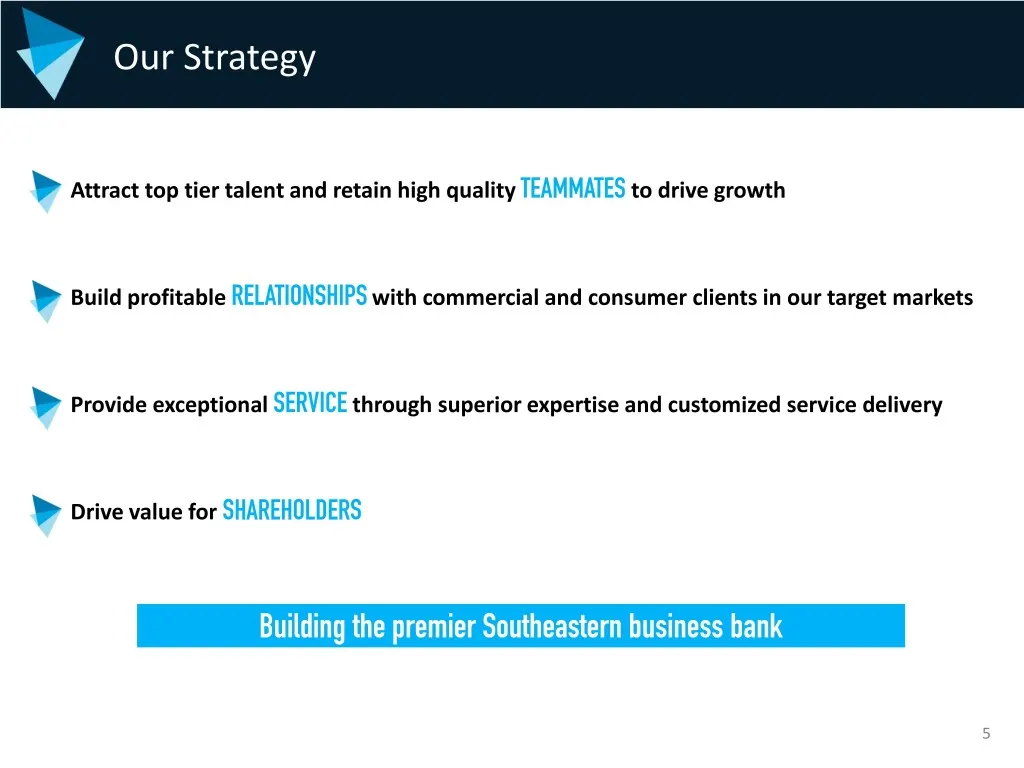
Our Strategy Attract top tier talent and retain high quality TEAMMATES to drive growth Build profitable RELATIONSHIPS with commercial and consumer clients in our target markets Provide exceptional SERVICE through superior expertise and customized service delivery Drive value for SHAREHOLDERS Buildin
Slide 6: We Serve Growth Markets
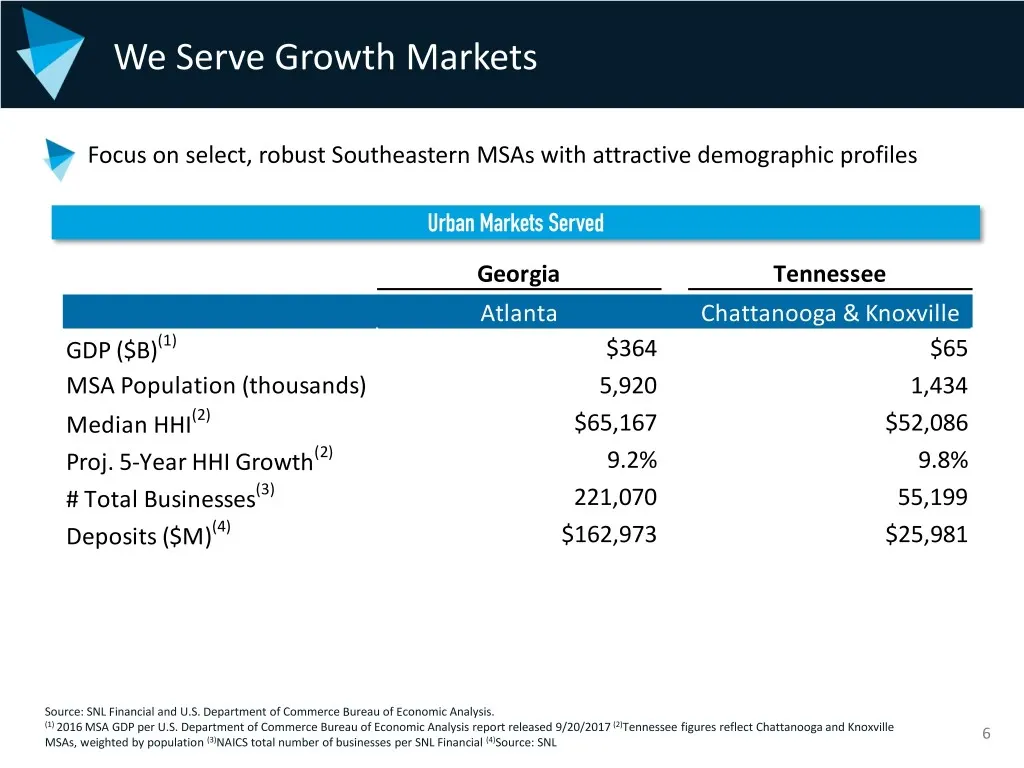
We Serve Growth Markets Focus on select, robust Southeastern MSAs with attractive demographic profiles Urban Markets Served Georgia Tennessee Atlanta Chattanooga & Knoxville GDP ($B)(1) $364 $65 MSA Population (thousands) 5,920 1,434 Median HHI(2) $65,167 $52,086 Proj. 5-Year HHI Growth(2) 9.2% 9.8%
Slide 7: Our History
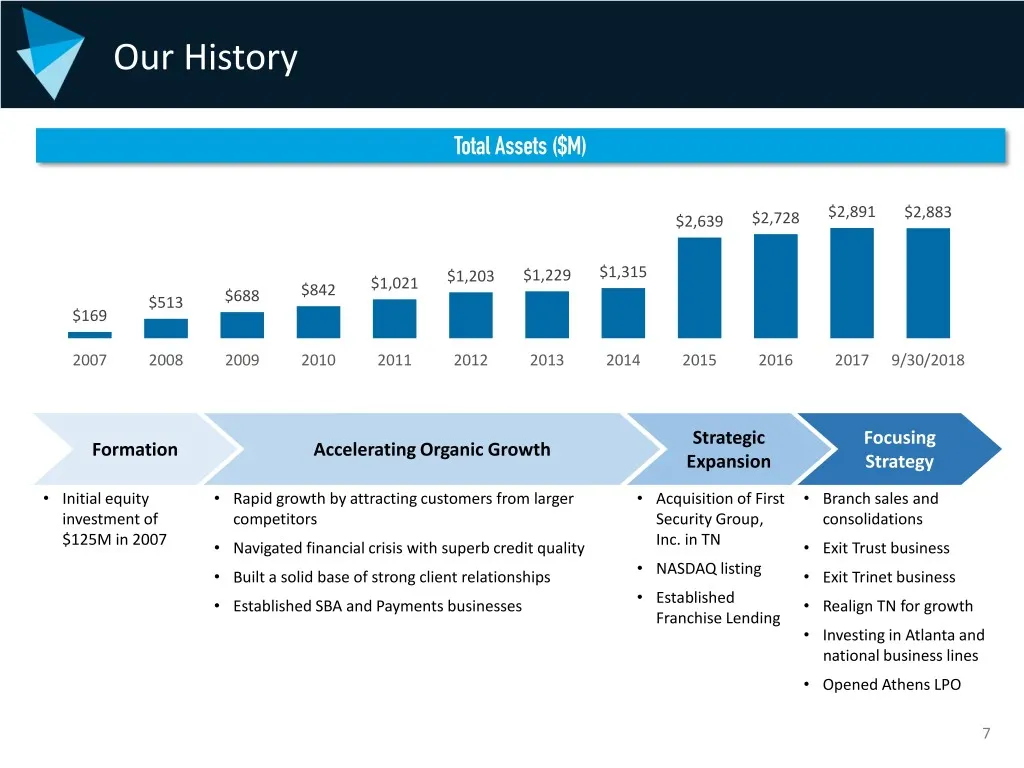
Our History Total Assets ($M) $2,891 $2,883 $2,639 $2,728 $1,203 $1,229 $1,315 $842 $1,021 $513 $688 $169 2007 2008 2009 2010 2011 2012 2013 2014 2015 2016 2017 9/30/2018 Strategic Focusing Formation Accelerating Organic Growth Expansion Strategy • Initial equity • Rapid growth by attracting custome
Slide 8: 2018 Priorities
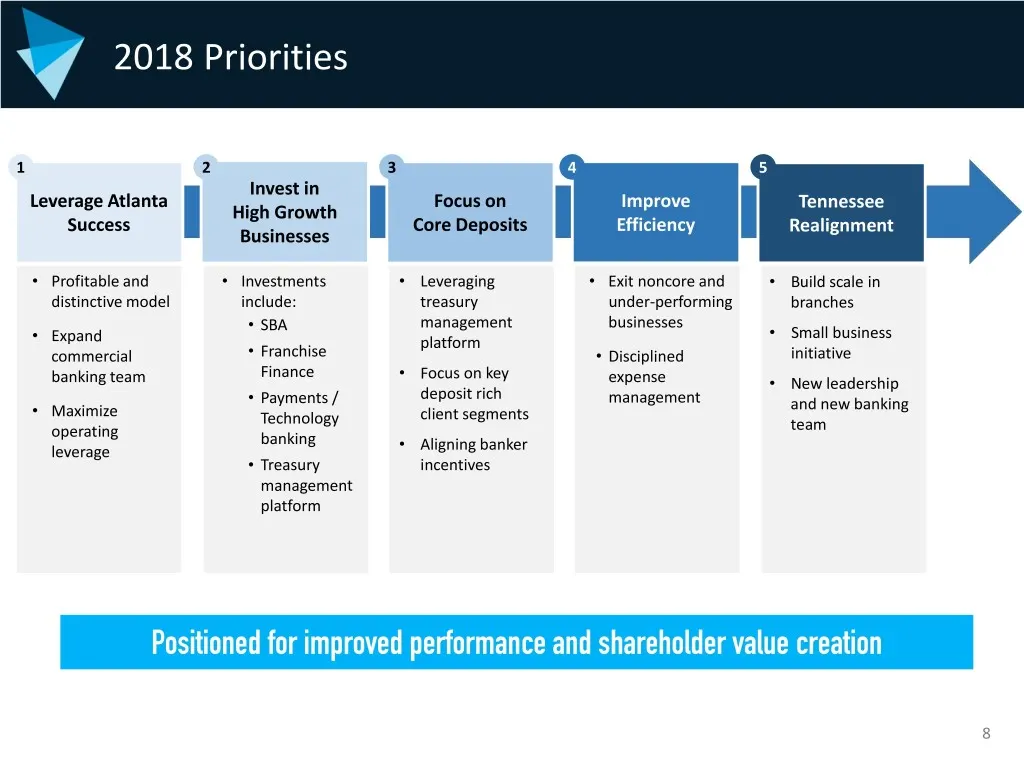
2018 Priorities 1 2 3 4 5 Invest in Leverage Atlanta Focus on Improve Tennessee High Growth Success Core Deposits Efficiency Realignment Businesses • Profitable and • Investments • Leveraging • Exit noncore and • Build scale in distinctive model include: treasury under-performing branches management
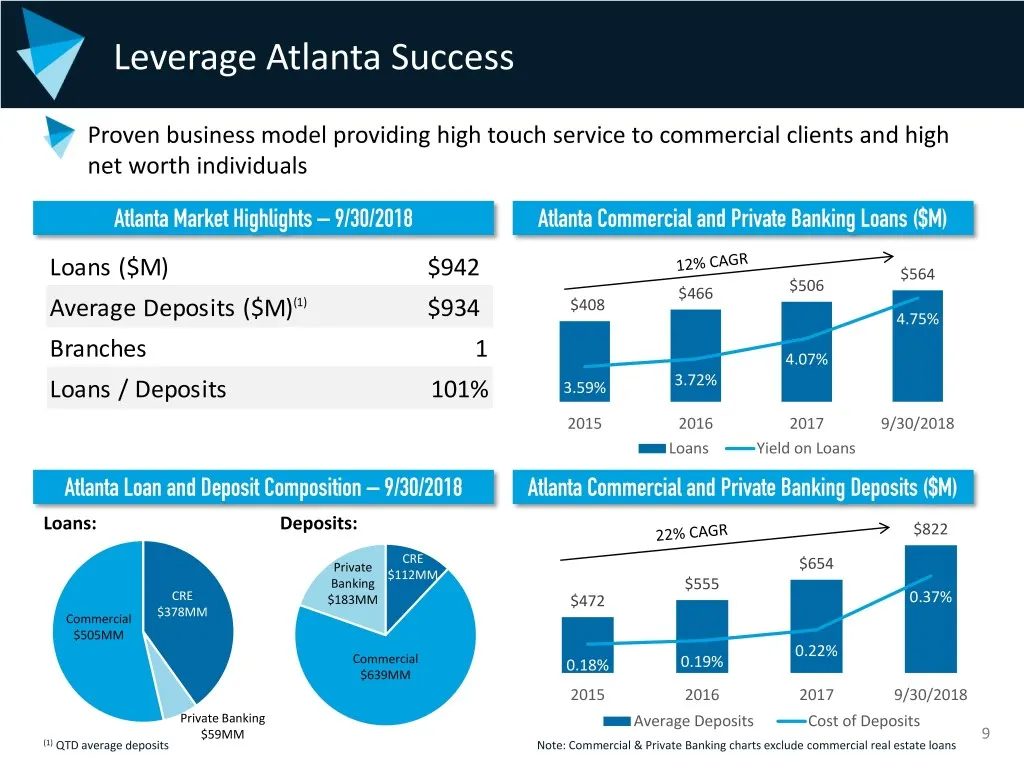
Slide 9: Leverage Atlanta Success
Leverage Atlanta Success Proven business model providing high touch service to commercial clients and high net worth individuals Atlanta Market Highlights – 9/30/2018 Atlanta Commercial and Private Banking Loans ($M) Loans ($M) $942 $564 $466 $506 (1) $408 Average Deposits ($M) $934 4.75% Branches 1
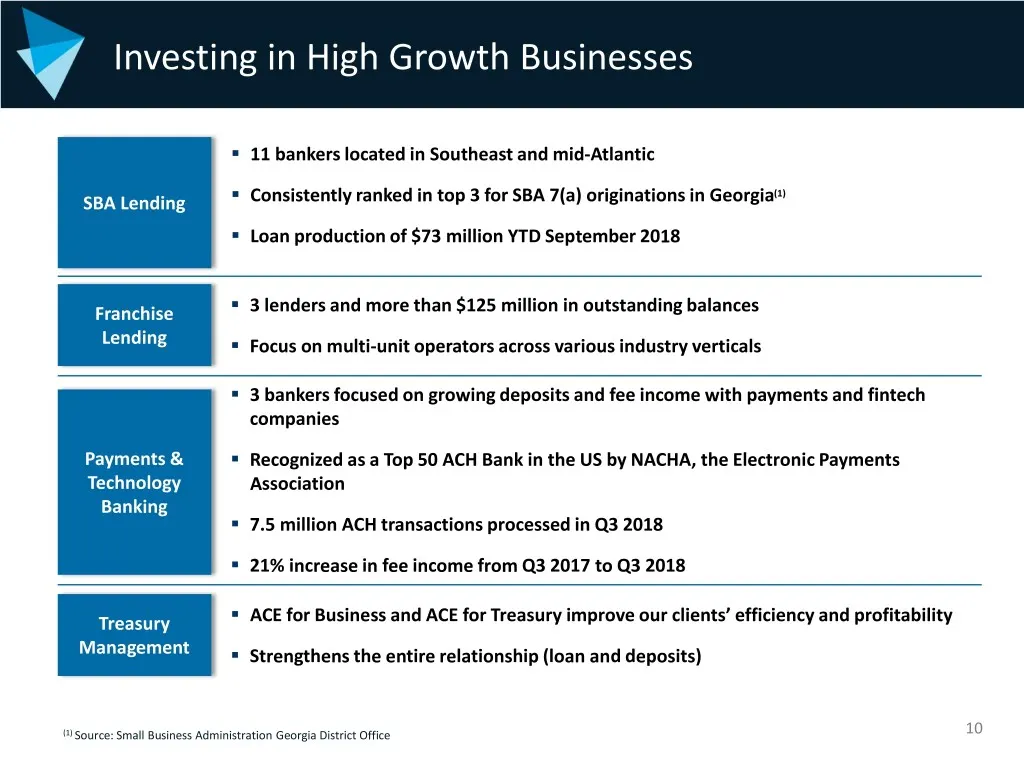
Slide 10: Investing in High Growth Businesses
Investing in High Growth Businesses . 11 bankers located in Southeast and mid-Atlantic (1) SBA Lending . Consistently ranked in top 3 for SBA 7(a) originations in Georgia . Loan production of $73 million YTD September 2018 . Franchise 3 lenders and more than $125 million in outstanding balances Lend
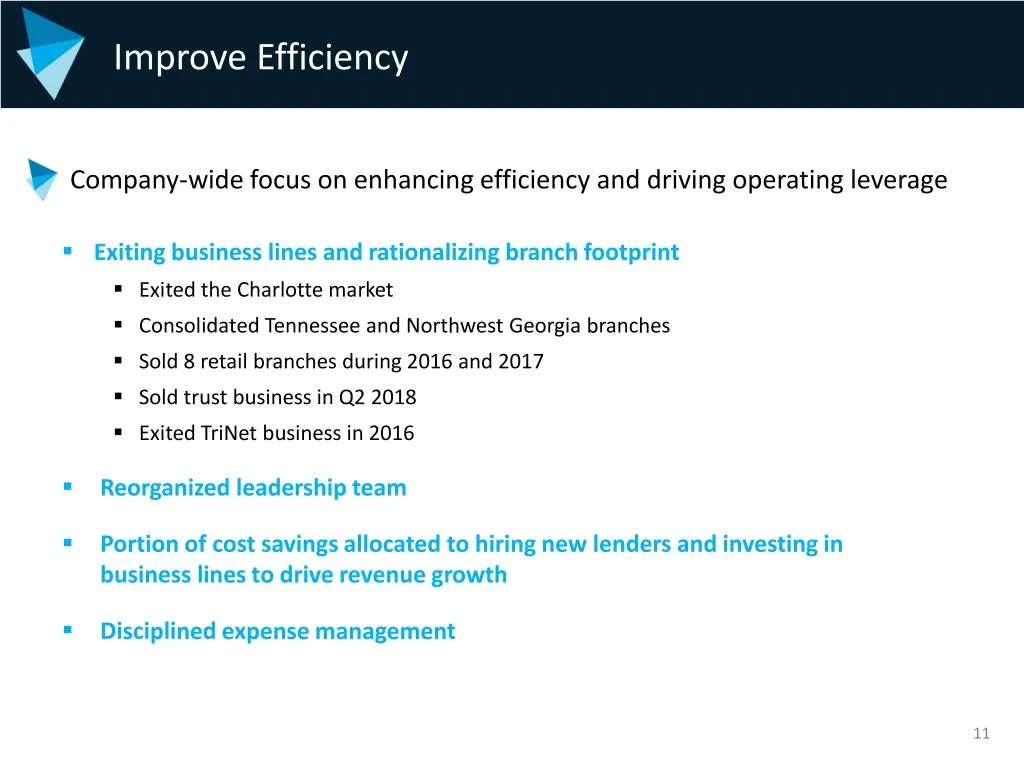
Slide 11: Improve Efficiency
Improve Efficiency Company-wide focus on enhancing efficiency and driving operating leverage . Exiting business lines and rationalizing branch footprint . Exited the Charlotte market . Consolidated Tennessee and Northwest Georgia branches . Sold 8 retail branches during 2016 and 2017 . Sold trust bu
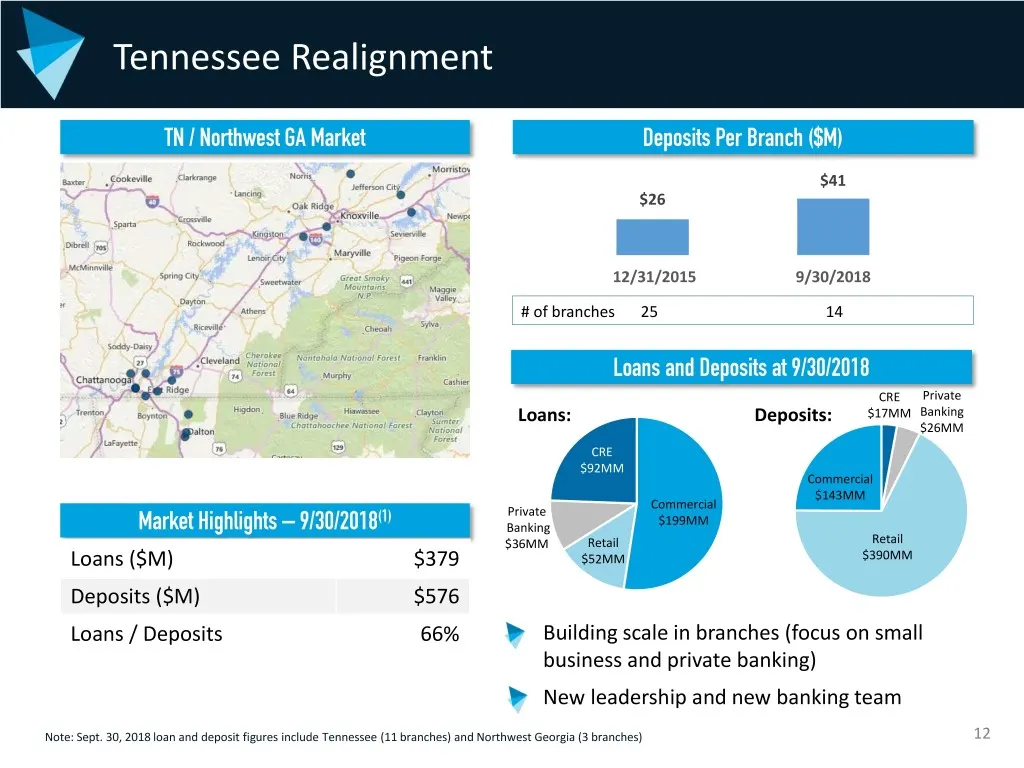
Slide 12: Tennessee Realignment
Tennessee Realignment TN / Northwest GA Market Deposits Per Branch ($M) $41 $26 12/31/2015 9/30/2018 # of branches 25 14 Loans and Deposits at 9/30/2018 CRE Private Loans: Deposits: $17MM Banking $26MM CRE $92MM Commercial $143MM Commercial Private (1) $199MM Market Highlights – 9/30/2018 Banking $3
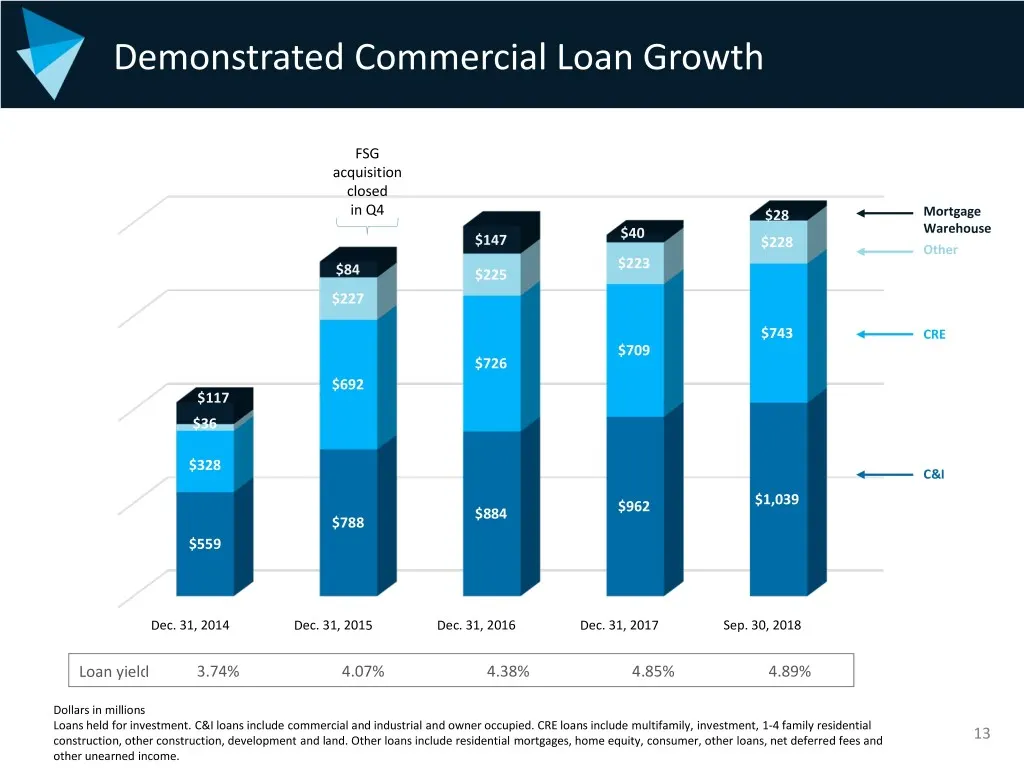
Slide 13: Demonstrated Commercial Loan Growth
Demonstrated Commercial Loan Growth FSG acquisition closed in Q4 $28 Mortgage Warehouse $147 $40 $228 Other $223 $84 $225 $227 $743 CRE $709 $726 $692 $117 $36 $328 C&I $1,039 $884 $962 $788 $559 Dec. 31, 2014 Dec. 31, 2015 Dec. 31, 2016 Dec. 31, 2017 Sep. 30, 2018 Loan yield 3.74% 4.07% 4.38% 4.85%
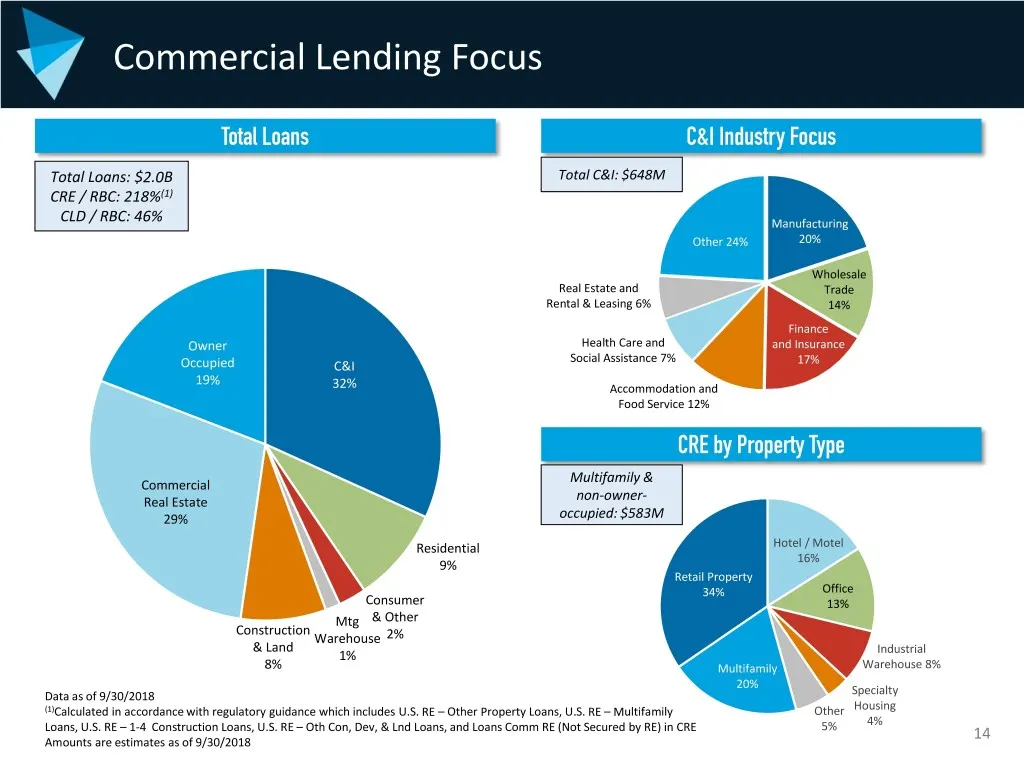
Slide 14: Commercial Lending Focus
Commercial Lending Focus Total Loans C&I Industry Focus Total Loans: $2.0B Total C&I: $648M CRE / RBC: 218%(1) CLD / RBC: 46% Manufacturing Other 24% 20% Wholesale Real Estate and Trade Rental & Leasing 6% 14% Finance Owner Health Care and and Insurance Social Assistance 7% Occupied C&I 17% 19% 32%
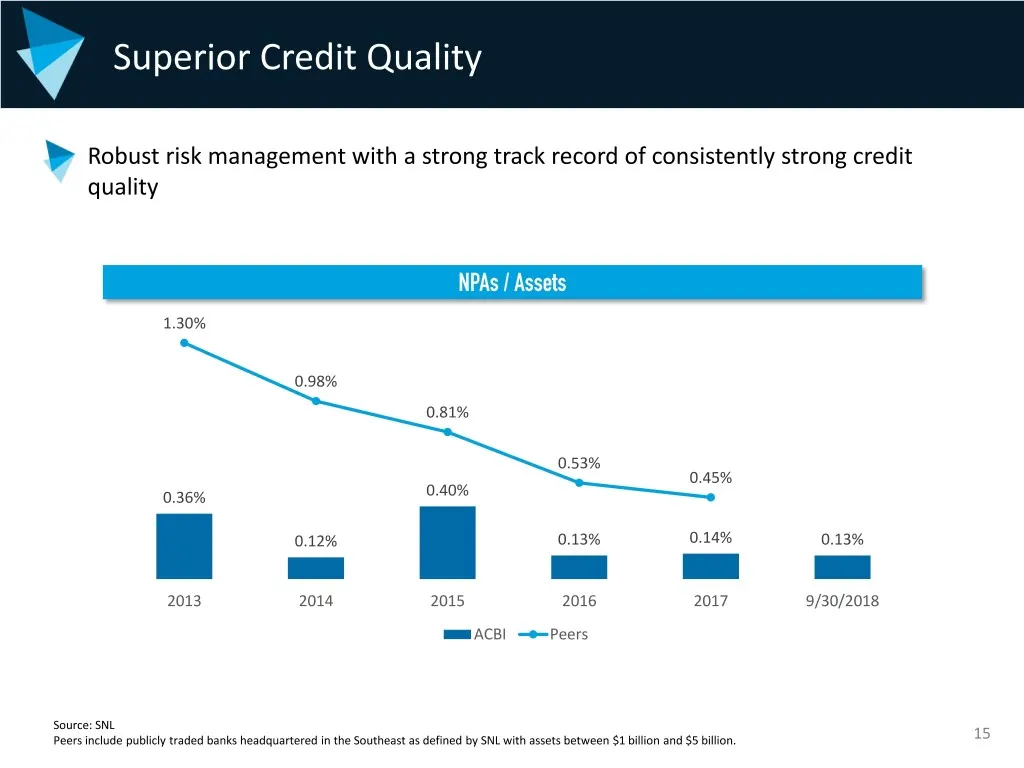
Slide 15: Superior Credit Quality
Superior Credit Quality Robust risk management with a strong track record of consistently strong credit quality NPAs / Assets 1.30% 0.98% 0.81% 0.53% 0.45% 0.36% 0.40% 0.12% 0.13% 0.14% 0.13% 2013 2014 2015 2016 2017 9/30/2018 ACBI Peers Source: SNL Peers include publicly traded banks headquartered
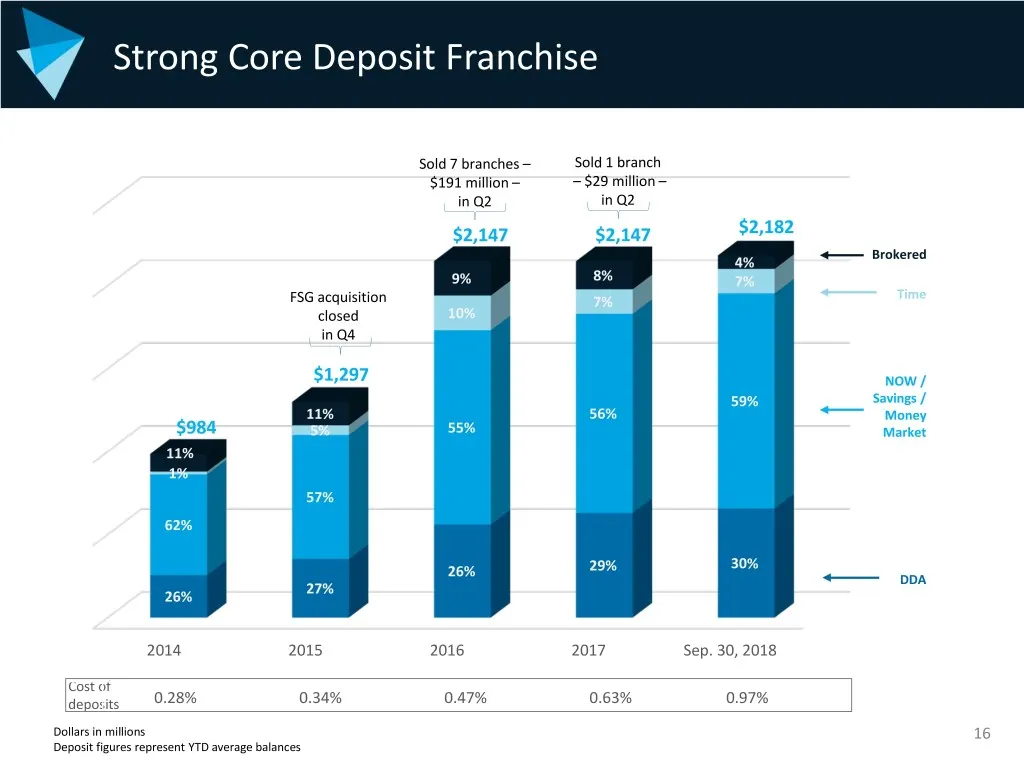
Slide 16: Strong Core Deposit Franchise
Strong Core Deposit Franchise Sold 7 branches – Sold 1 branch $191 million – – $29 million – in Q2 in Q2 $2,147 $2,147 $2,182 Brokered 4% 9% 8% 7% Time FSG acquisition 7% closed 10% in Q4 $1,297 NOW / 59% Savings / 11% 56% Money $984 5% 55% Market 11% 1% 57% 62% 30% 26% 29% DDA 27% 26% 2014 2015 201
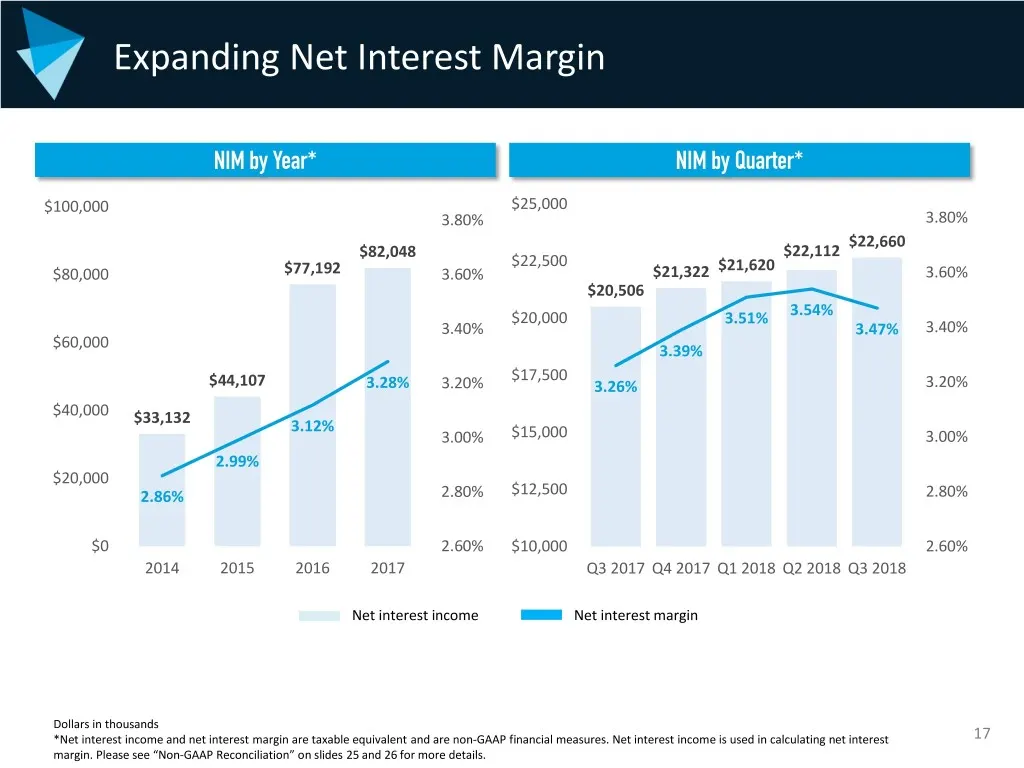
Slide 17: Expanding Net Interest Margin
Expanding Net Interest Margin NIM by Year* NIM by Quarter* $100,000 $25,000 3.80% 3.80% $22,660 $82,048 $22,112 $22,500 $21,620 $80,000 $77,192 3.60% $21,322 3.60% $20,506 $20,000 3.51% 3.54% 3.40% 3.47% 3.40% $60,000 3.39% $17,500 $44,107 3.28% 3.20% 3.26% 3.20% $40,000 $33,132 3.12% 3.00% $15,000
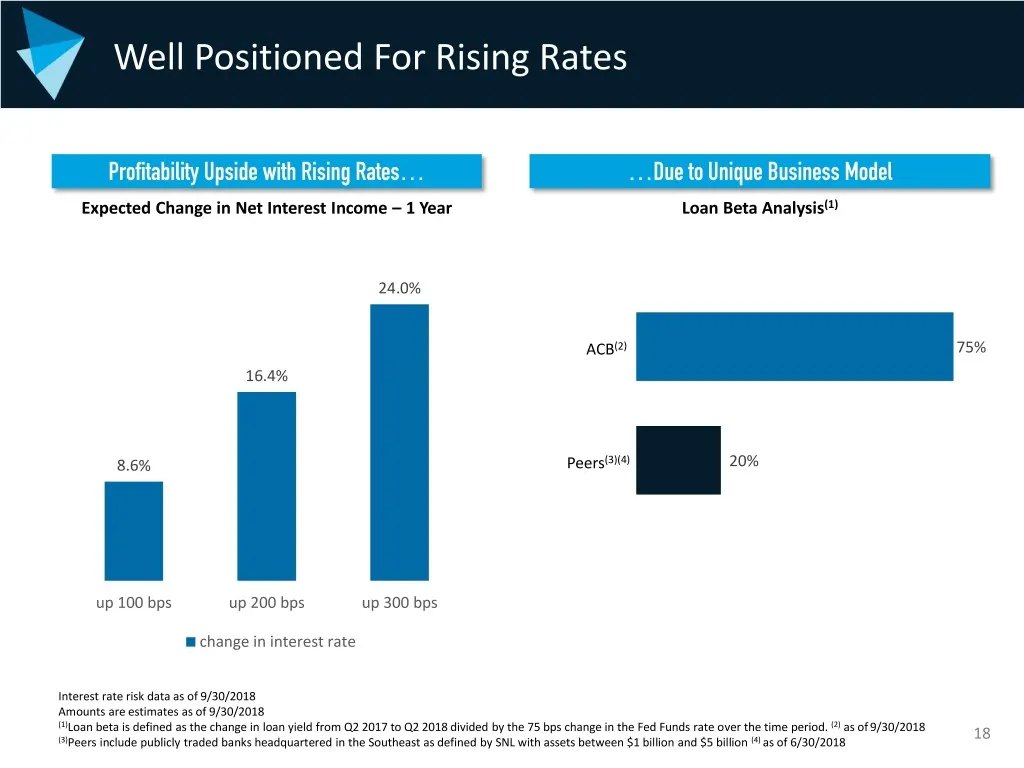
Slide 18: Well Positioned For Rising Rates
Well Positioned For Rising Rates Profitability Upside with Rising Rates… …Due to Unique Business Model Expected Change in Net Interest Income – 1 Year Loan Beta Analysis(1) 24.0% ACB(2) 75% 16.4% 8.6% Peers(3)(4) 20% up 100 bps up 200 bps up 300 bps change in interest rate Interest rate risk data as
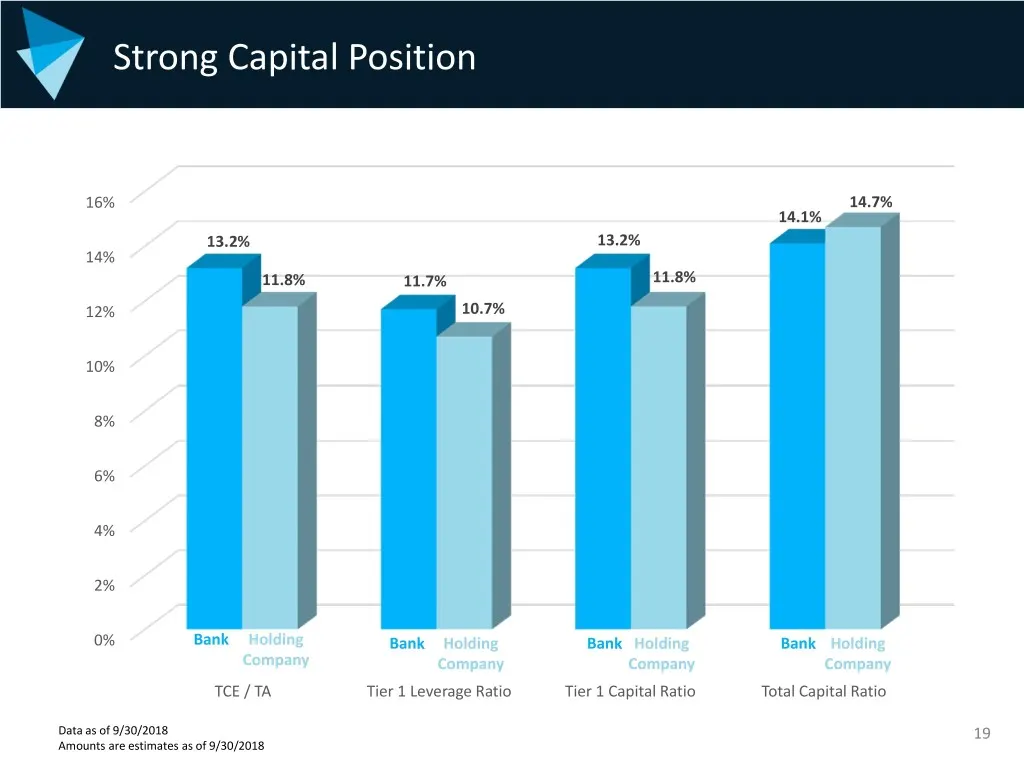
Slide 19: Strong Capital Position
Strong Capital Position 16% 14.7% 14.1% 13.2% 13.2% 14% 11.8% 11.7% 11.8% 12% 10.7% 10% 8% 6% 4% 2% 0% Bank Holding Bank Holding Bank Holding Bank Holding Company Company Company Company TCE / TA Tier 1 Leverage Ratio Tier 1 Capital Ratio Total Capital Ratio Data as of 9/30/2018 19 Amounts are estim
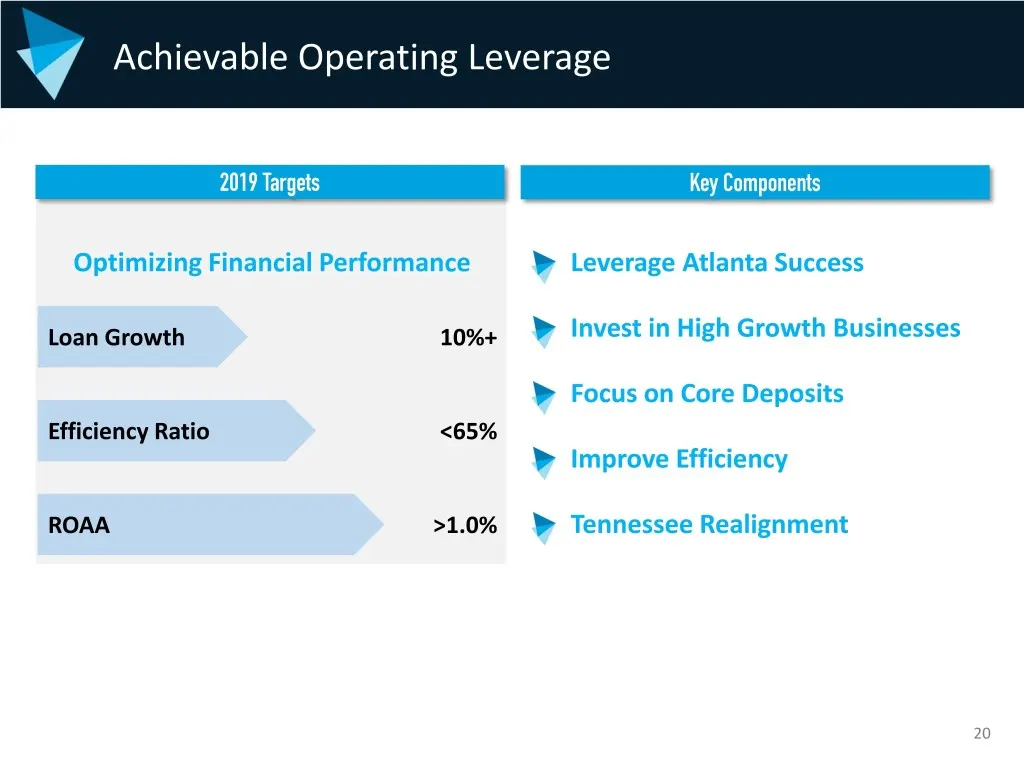
Slide 20: Achievable Operating Leverage
Achievable Operating Leverage 2019 Targets Key Components Optimizing Financial Performance Leverage Atlanta Success Loan Growth 10%+ Invest in High Growth Businesses Focus on Core Deposits Efficiency Ratio <65% Improve Efficiency ROAA >1.0% Tennessee Realignment 20
Slide 21: Key Investment Considerations
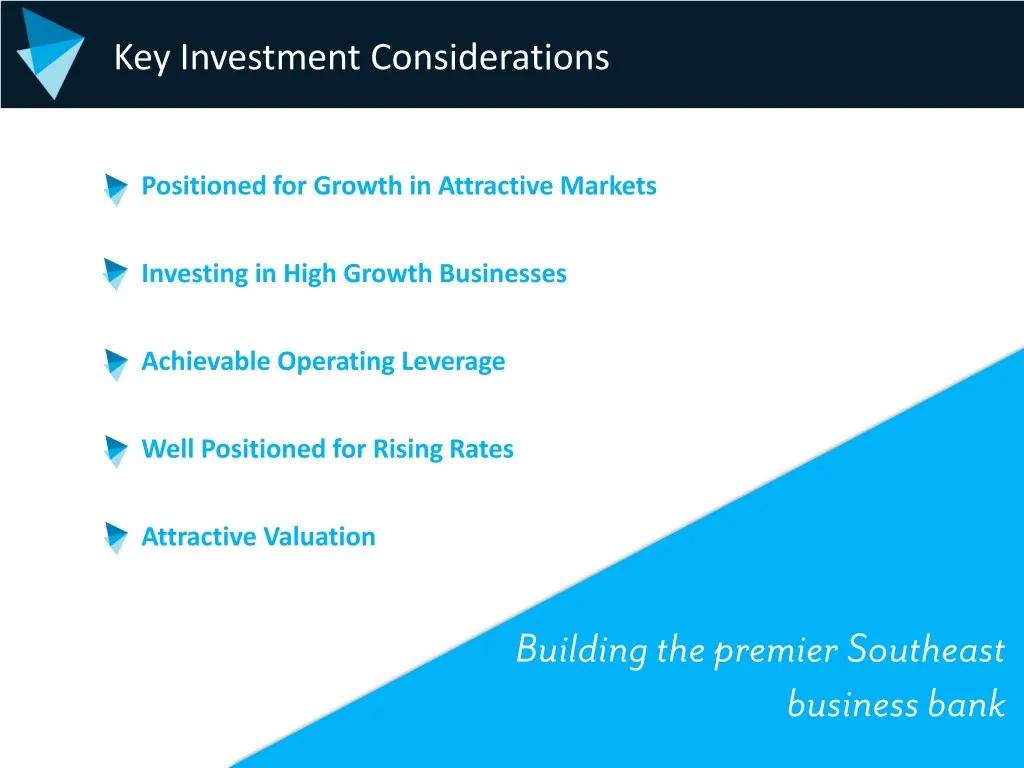
Key Investment Considerations Positioned for Growth in Attractive Markets Investing in High Growth Businesses Achievable Operating Leverage Well Positioned for Rising Rates Attractive Valuation Building the premier Southeast business bank 21
Slide 22: Appendix
APPENDIX INVESTOR APPENDIX PRESENTATION MARCH 2018 THE SOUTHEAST’S BUSINESS BANK
Slide 23: Management Biographies
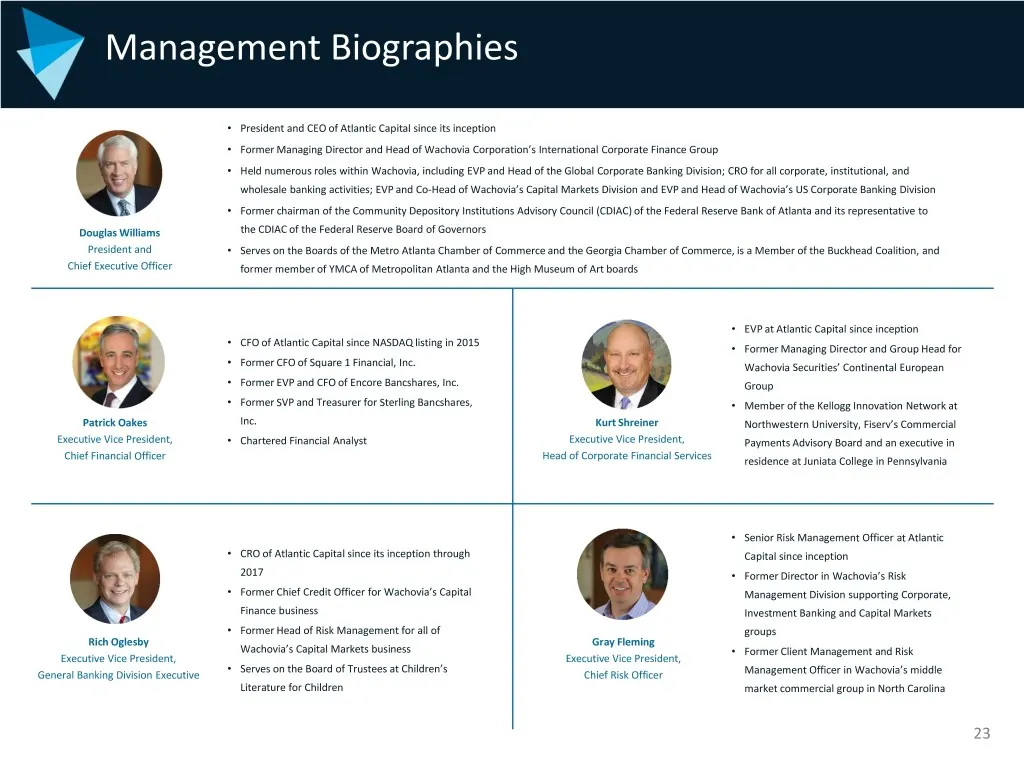
Management Biographies • President and CEO of Atlantic Capital since its inception • Former Managing Director and Head of Wachovia Corporation’s International Corporate Finance Group • Held numerous roles within Wachovia, including EVP and Head of the Global Corporate Banking Division; CRO for all c
Slide 24: Financial Highlights
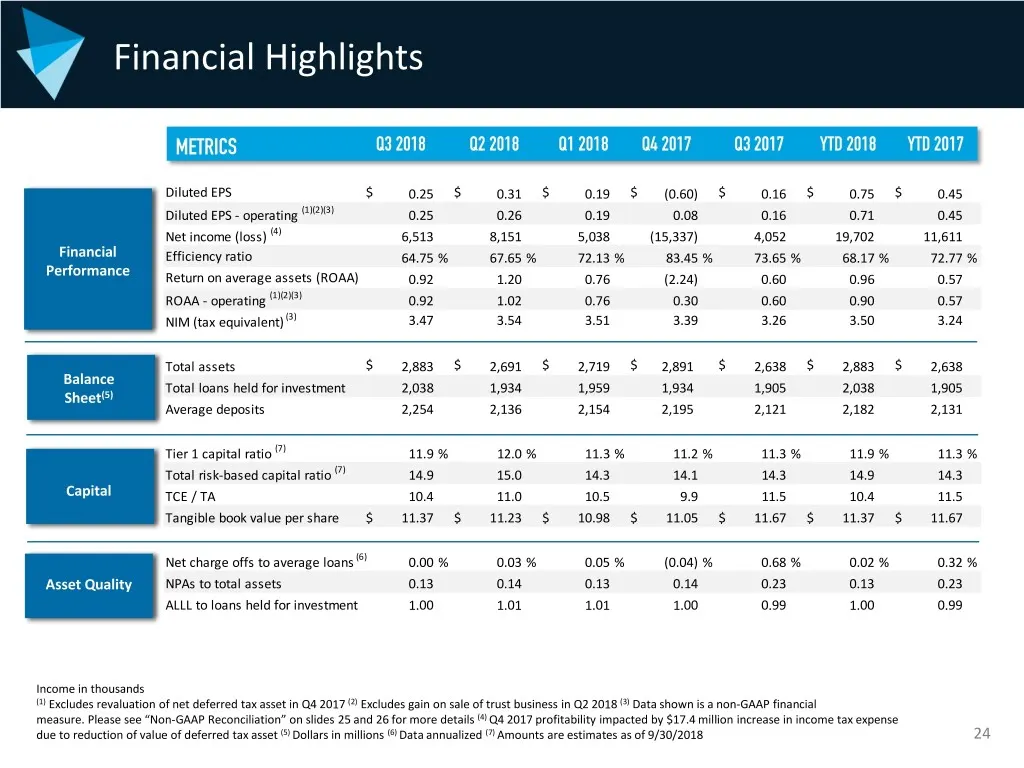
Financial Highlights METRICS Q3 2018 Q2 2018 Q1 2018 Q4 2017 Q3 2017 YTD 2018 YTD 2017 Diluted EPS $ 0.25 $ 0.31 $ 0.19 $ (0.60) $ 0.16 $ 0.75 $ 0.45 Diluted EPS - operating (1)(2)(3) 0.25 0.26 0.19 0.08 0.16 0.71 0.45 Net income (loss) (4) 6,513 8,151 5,038 (15,337) 4,052 19,702 11,611 Financial Ef
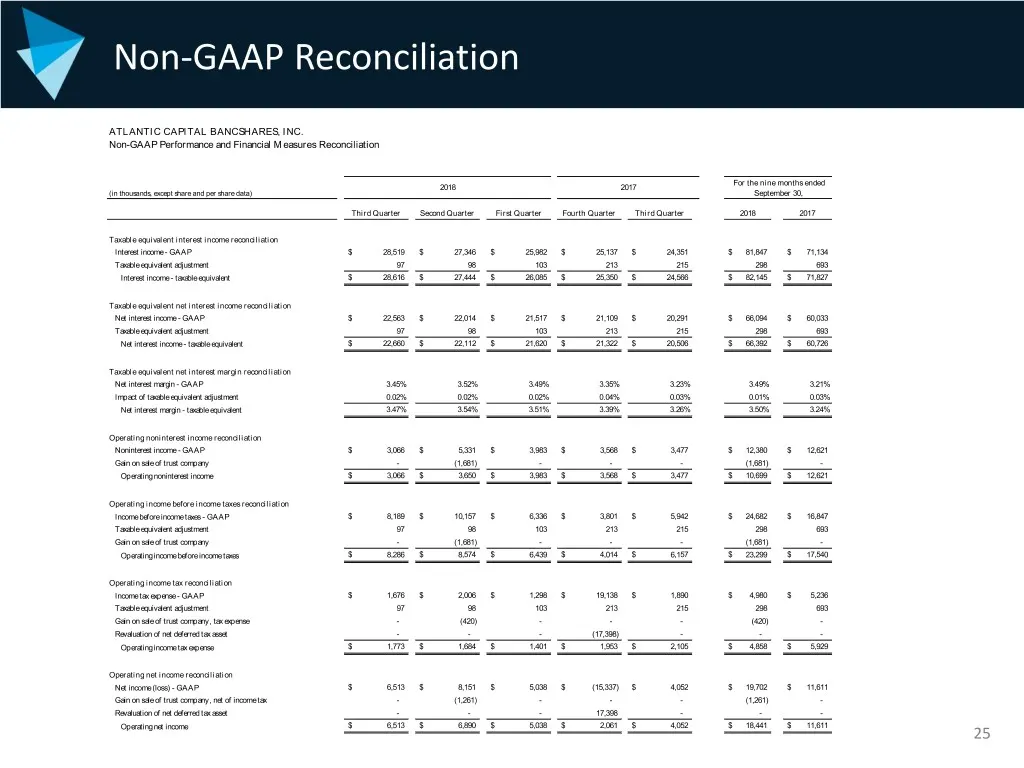
Slide 25: Non-GAAP Reconciliation
Non-GAAP Reconciliation ATLANTIC CAPITAL BANCSHARES, INC. Non-GAAP Performance and Financial Measures Reconciliation For the nine months ended 2018 2017 (in thousands, except share and per share data) September 30, Third Quarter Second Quarter First Quarter Fourth Quarter Third Quarter 2018 2017 Tax
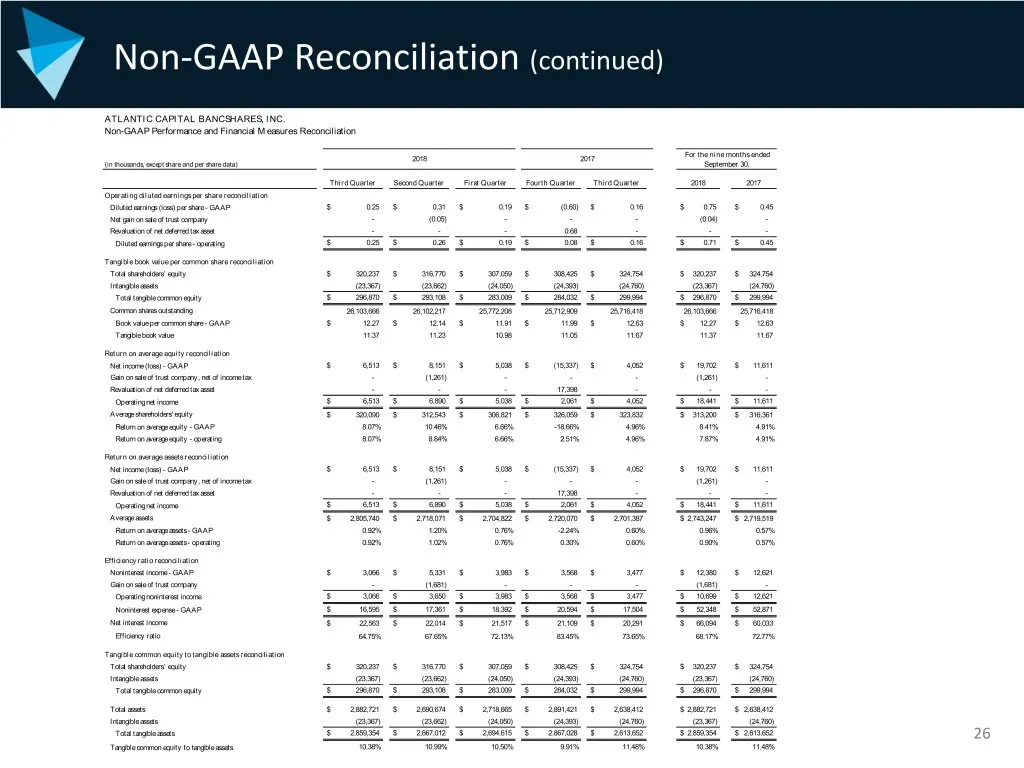
Slide 26: Non-GAAP Reconciliation (continued)
Non-GAAP Reconciliation (continued) ATLANTIC CAPITAL BANCSHARES, INC. Non-GAAP Performance and Financial Measures Reconciliation For the nine months ended 2018 2017 (in thousands, except share and per share data) September 30, Third Quarter Second Quarter First Quarter Fourth Quarter Third Quarter 2
Source: SEC EDGAR · 8-K filed Nov 6, 2018
More decks from Atlantic Capital Bancshares Inc
 Q4 2021 Earnings Presentation27 slides · Jan 24, 2022
 Q3 2021 Earnings Presentation30 slides · Oct 27, 2021
 Q3 2021 Earnings Presentation40 slides · Oct 27, 2021
 Q2 2021 Earnings Presentation33 slides · Jul 23, 2021
 Merger or Acquisition (July 2021)16 slides · Jul 23, 2021
 Q2 2021 Earnings Presentation39 slides · Jul 23, 2021