Focus Financial Partners — Investor Day (December 2021)
97 slides from Focus Financial Partners's investor day presentation, Dec 9, 2021
Slide 1: Investor Day 2021
INVESTOR DAY 2021 December 9, 2021

Slide 2: Special Note Regarding Forward-Looking Statements
Special Note Regarding Forward - Looking Statements Some of the information in this presentation may contain forward - looking statements . Forward - looking statements give our current expectations, contain projections of results of operations or of financial condition, or forecasts of future event
Slide 3: Overview & 2025 Strategy Update
Overview & 2025 Strategy Update Rudy Adolf | Founder, Chief Executive Officer & Chairman

Slide 4: Our founding principle
Our founding principle 4 “ Never turn a successful entrepreneur into an employee. ”
Slide 5: Original vision and targets
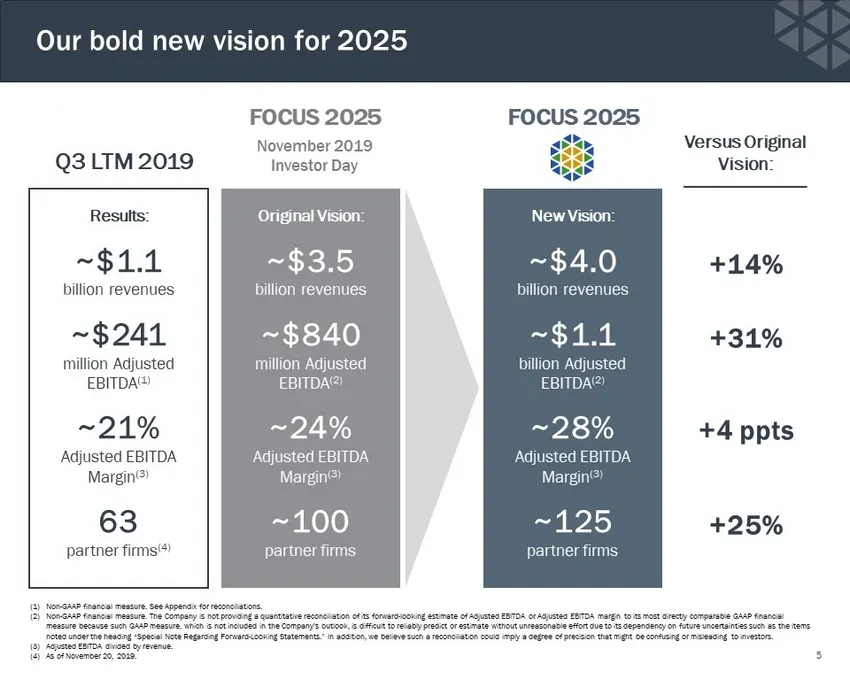
(1) Non - GAAP financial measure. See Appendix for reconciliations. (2) Non - GAAP financial measure. The Company is not providing a quantitative reconciliation of its forward - looking estimate of Adjust ed EBITDA or Adjusted EBITDA margin to its most directly comparable GAAP financial measure beca
Slide 6: Recent accomplishments
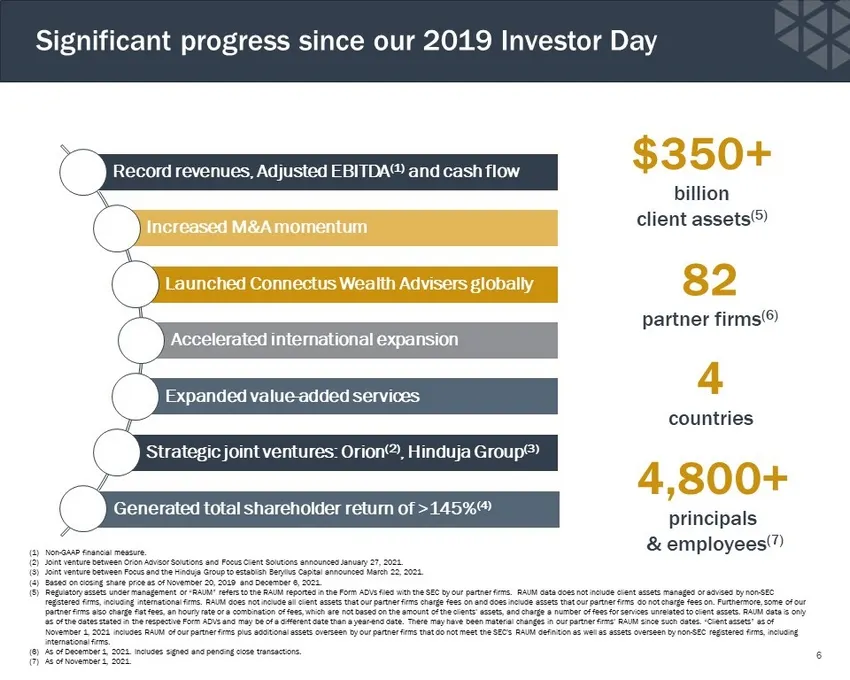
Record revenues, Adjusted EBITDA (1) and cash flow Increased M&A momentum Launched Connectus Wealth Advisers globally Accelerated international expansion Expanded value - added services Strategic joint ventures: Orion (2) , Hinduja Group (3) Generated total shareholder return of >145% (4) (1) Non -
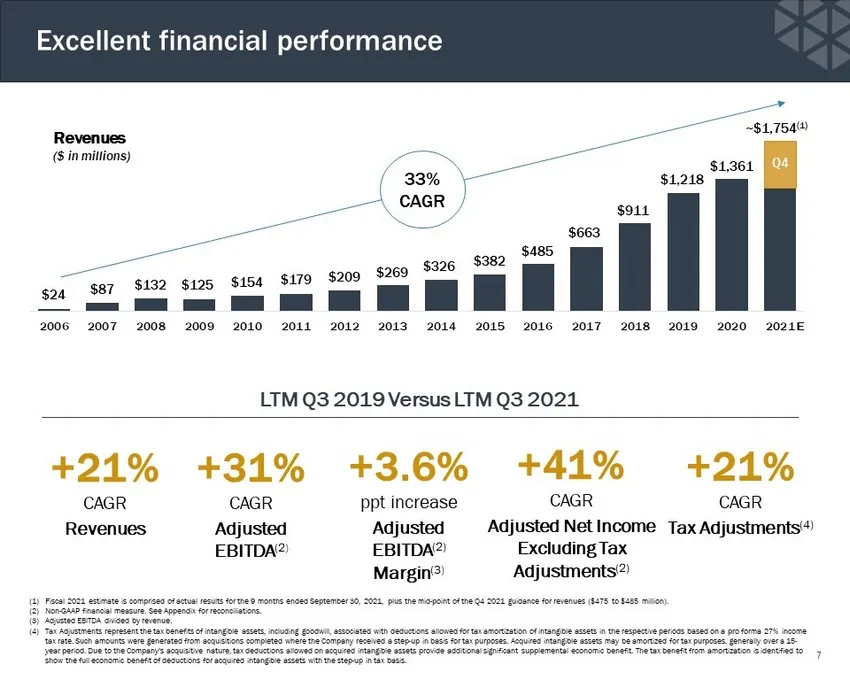
Slide 7: Revenue, Adjusted EBITDA and net income CAGR
+21% CAGR Revenues +31% CAGR Adjusted EBITDA (2 ) +41% CAGR Adjusted Net Income Excluding Tax Adjustments (2) (1) Fiscal 2021 estimate is comprised of actual results for the 9 months ended September 30, 2021, plus the mid - point of the Q4 2021 guidance for revenues ($475 to $485 million). (2) Non -
Slide 8: You've asked us some key questions
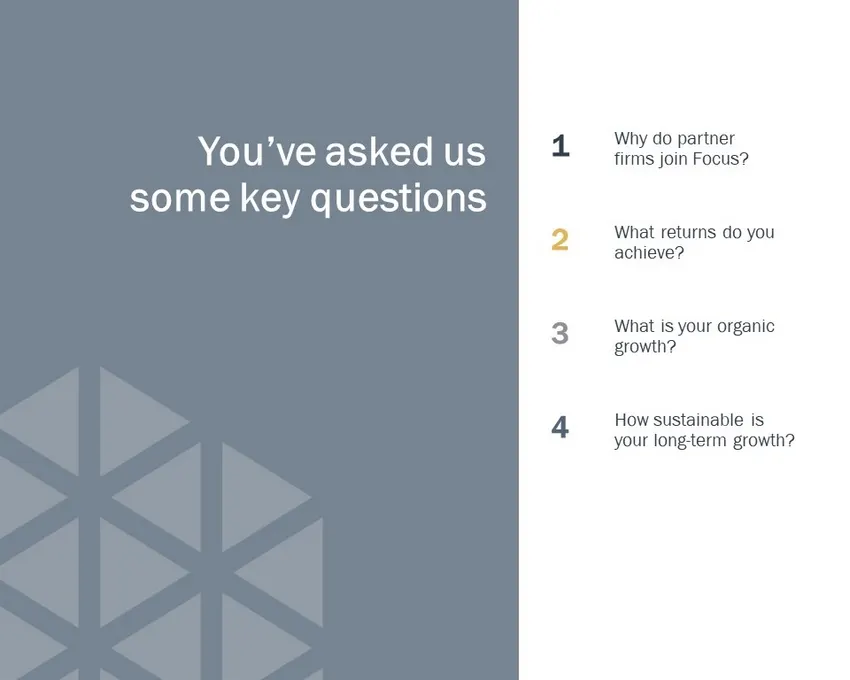
1 2 3 4 You’ve asked us some key questions Why do partner firms join Focus? What returns do you achieve? What is your organic growth? How sustainable is your long - term growth?
Slide 9: Our mission and unique value proposition
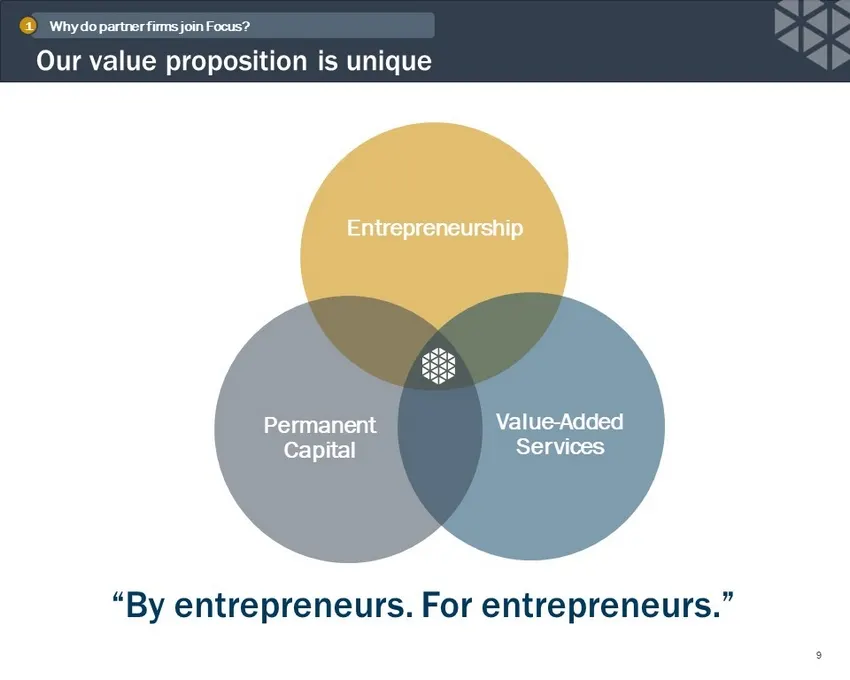
Our Mission Our value proposition is unique 9 Entrepreneurship Value - Added Services Permanent Capital “By entrepreneurs. For entrepreneurs.” Why do partner firms join Focus? 1
Slide 10: We empower successful entrepreneurs
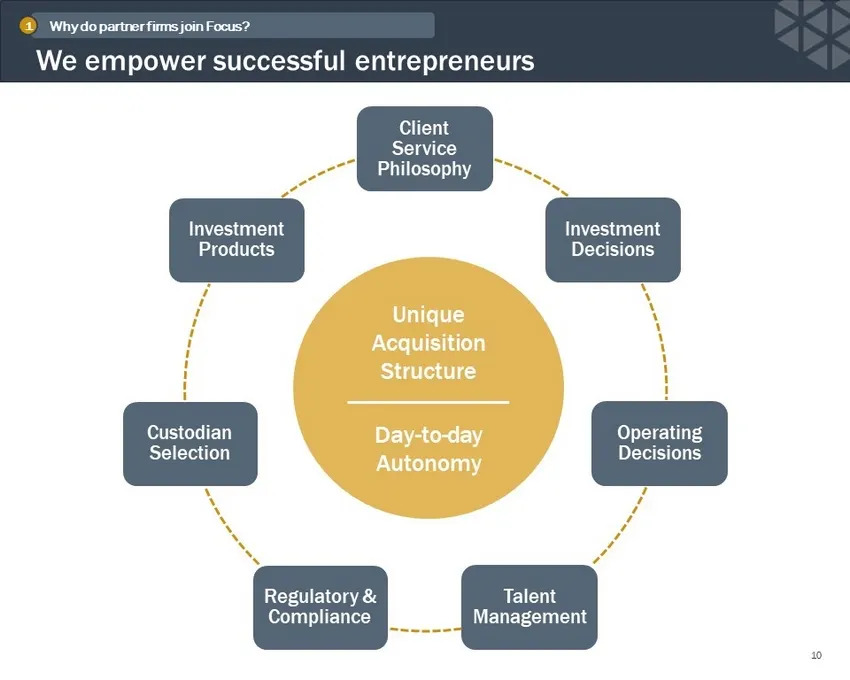
We empower successful entrepreneurs 10 Client Service Philosophy Investment Decisions Operating Decisions Talent Management Regulatory & Compliance Custodian Selection Investment Products Why do partner firms join Focus? 1 Unique Acquisition Structure Day - to - day Autonomy
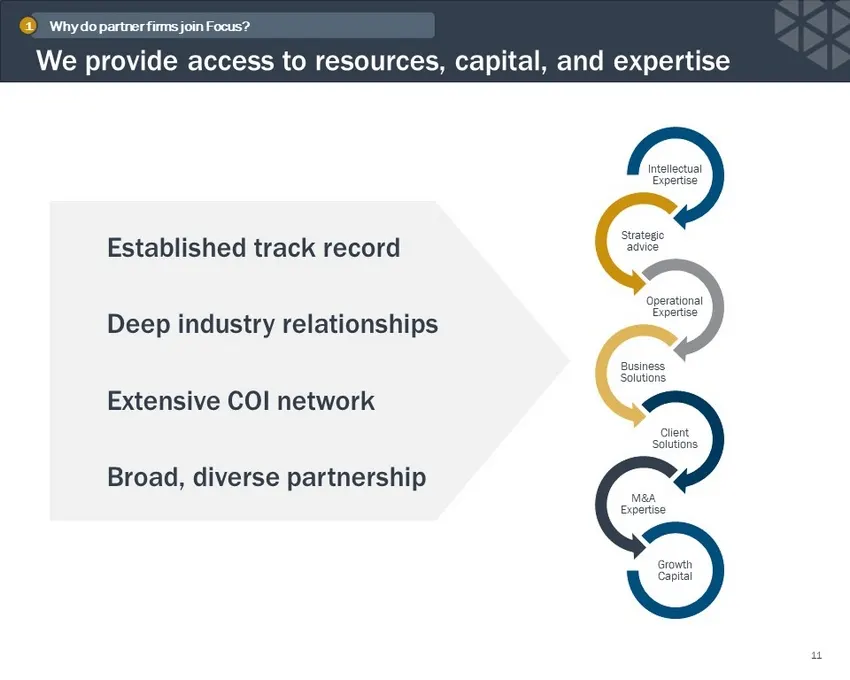
Slide 11: We provide access to resources, capital, and expertise
We provide access to resources, capital, and expertise 11 Intellectual Expertise Strategic advice Operational Expertise Business Solutions Client Solutions M&A Expertise Growth Capital Why do partner firms join Focus? 1 Established track record Deep industry relationships Extensive COI network Broad
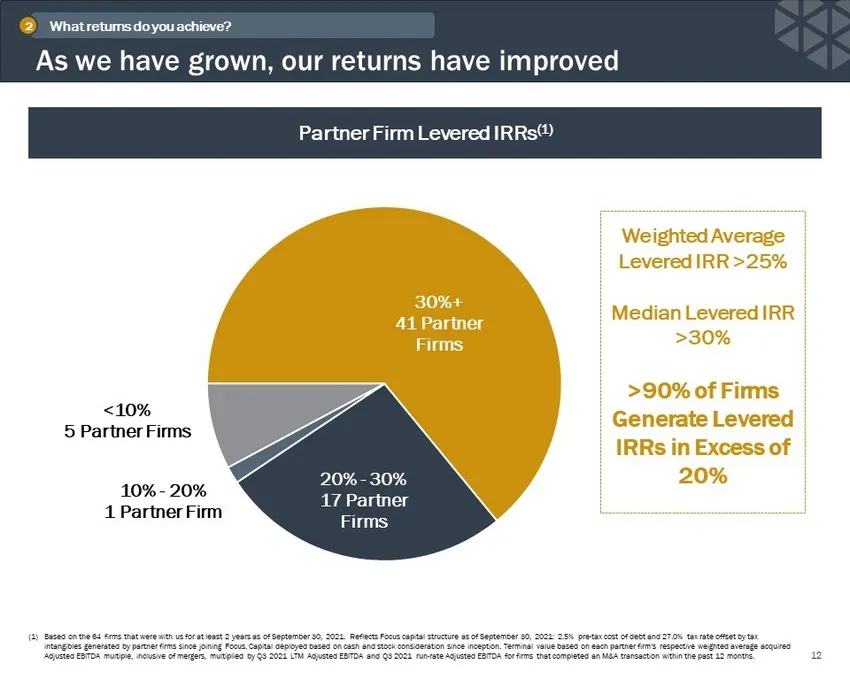
Slide 12: As we have grown, our returns have improved
As we have grown, our returns have improved 12 (1) Based on the 64 firms that were with us for at least 2 years as of September 30, 2021. Reflects Focus capital structure as o f September 30, 2021: 2.5% pre - tax cost of debt and 27.0% tax rate offset by tax intangibles generated by partner firms si
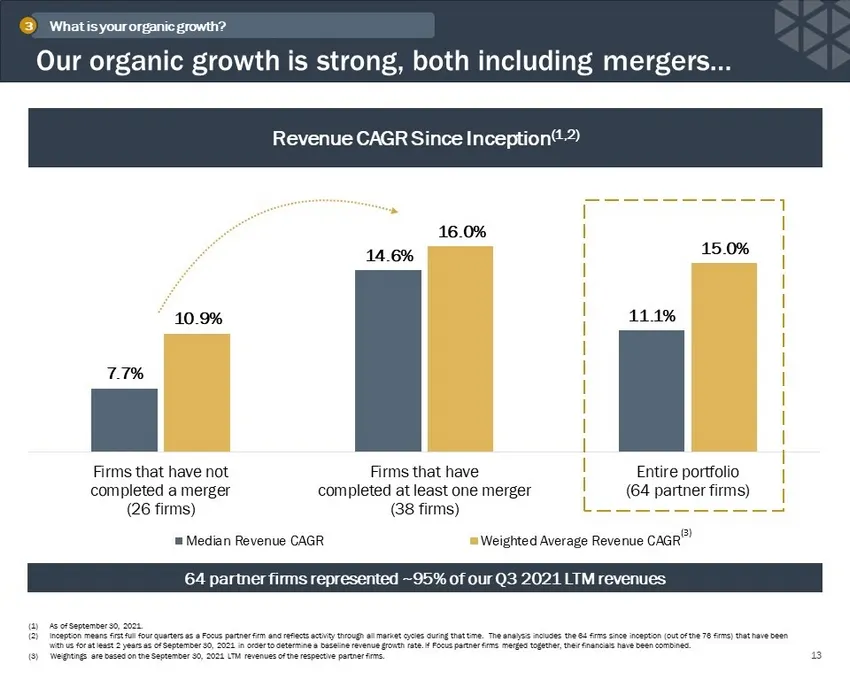
Slide 13: Revenue CAGR since inception
7.7% 14.6% 11.1% 10.9% 16.0% 15.0% Firms that have not completed a merger (26 firms) Firms that have completed at least one merger (38 firms) Entire portfolio (64 partner firms) Median Revenue CAGR Weighted Average Revenue CAGR Revenue CAGR Since Inception (1,2) 64 partner firms represented ~95% of
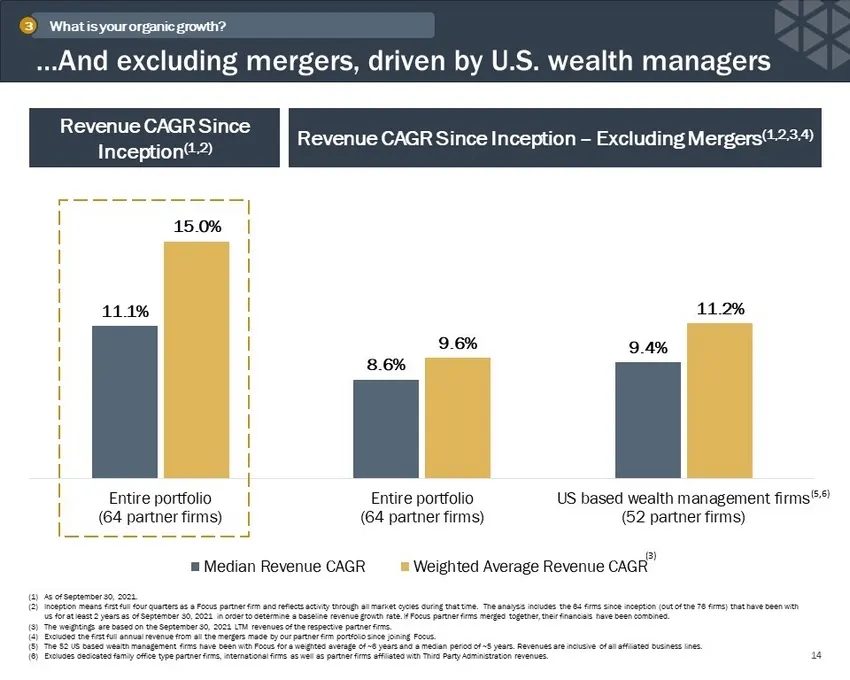
Slide 14: Revenue CAGR since inception excluding mergers
11.1% 8.6% 9.4% 15.0% 9.6% 11.2% Entire portfolio (64 partner firms) Entire portfolio (64 partner firms) US based wealth management firms (52 partner firms) Median Revenue CAGR Weighted Average Revenue CAGR Revenue CAGR Since Inception – Excluding Mergers (1,2,3,4) (1) As of September 30, 2021. (2)
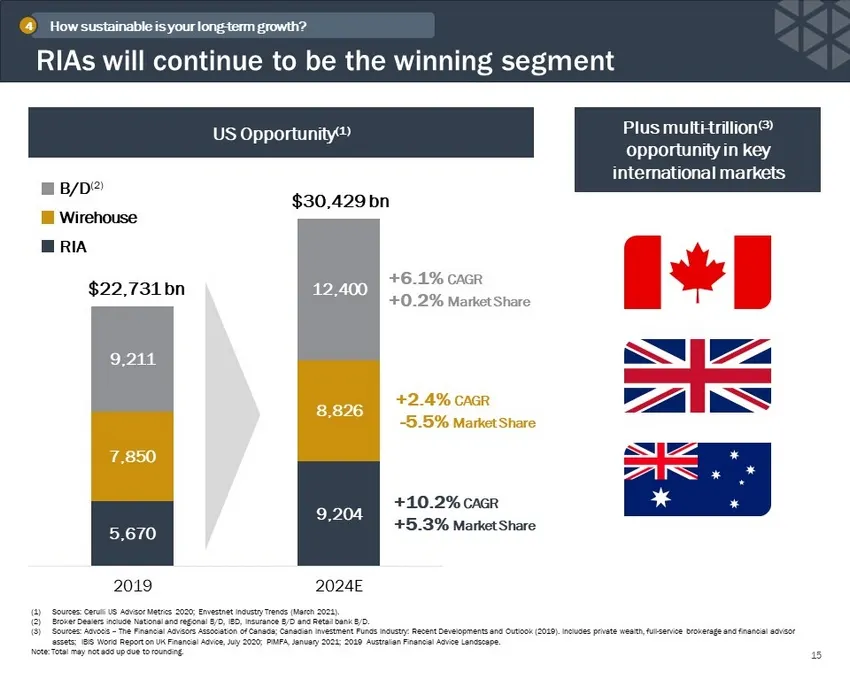
Slide 15: RIAs will continue to be the winning segment
RIAs will continue to be the winning segment 15 How sustainable is your long - term growth? 4 US Opportunity (1) Plus multi - trillion (3) opportunity in key international markets 5,670 9,204 7,850 8,826 9,211 12,400 2019 2024E $22,731 bn $30,429 bn Wirehouse RIA B/D (2) +6.1% CAGR +0.2% Market Shar
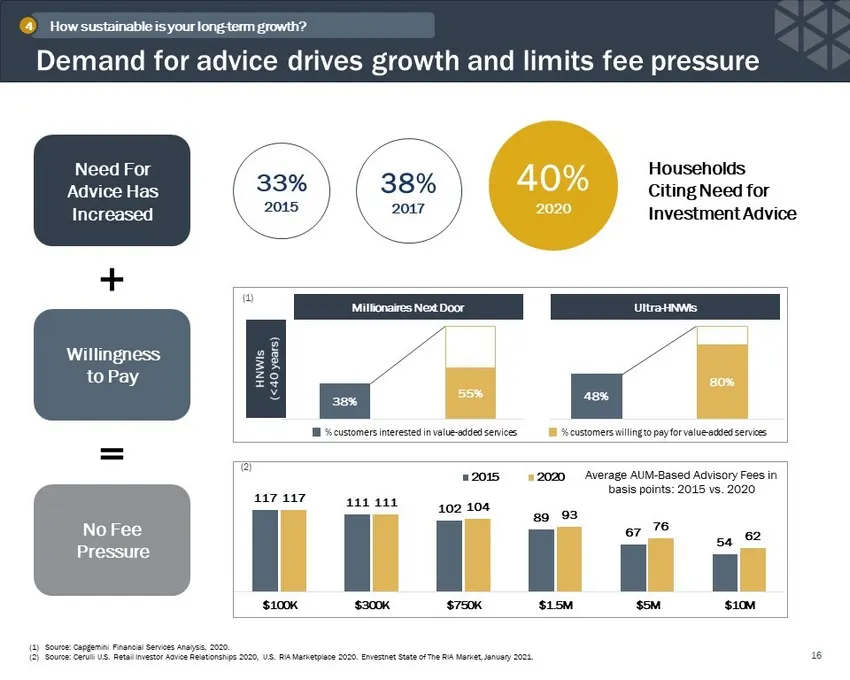
Slide 16: Demand for advice drives growth and limits fee pressure
Need For Advice Has Increased 33% 2015 40% 2020 38% 2017 Willingness to Pay No Fee Pressure + = (1) Source: Capgemini Financial Services Analysis, 2020. (2) Source: Cerulli U.S. Retail Investor Advice Relationships 2020, U.S. RIA Marketplace 2020. Envestnet State of The RIA Marke t, January 2021. De
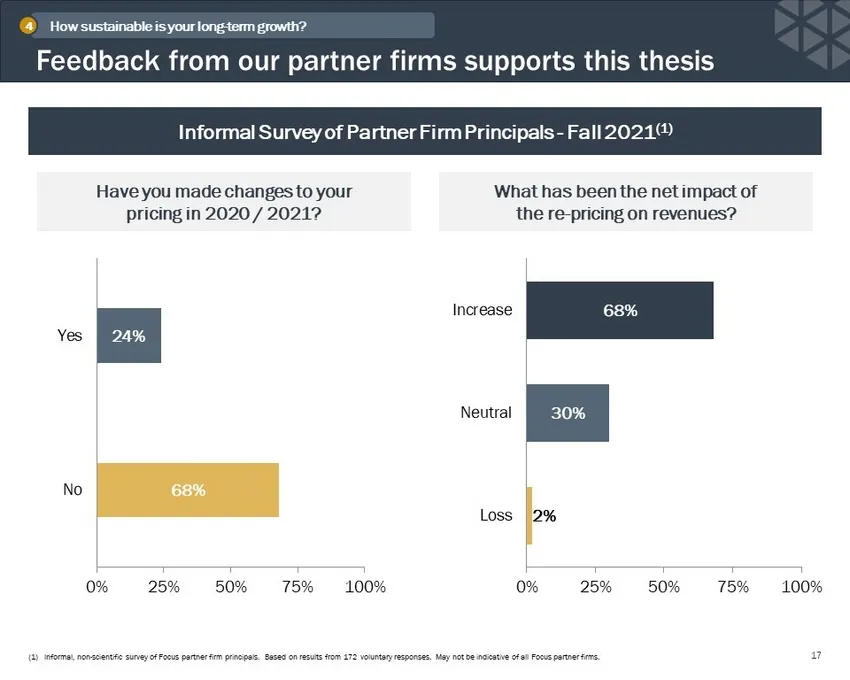
Slide 17: Feedback from our partner firms supports this thesis
Feedback from our partner firms supports this thesis 17 Informal Survey of Partner Firm Principals - Fall 2021 (1) Have you made changes to your pricing in 2020 / 2021? What has been the net impact of the re - pricing on revenues? (1) Informal, non - scientific survey of Focus partner firm principal
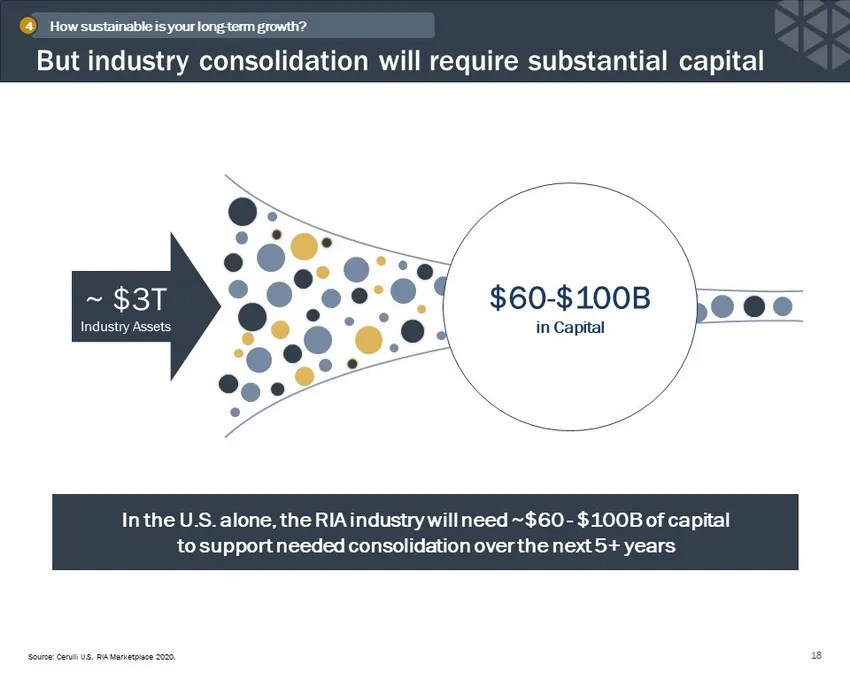
Slide 18: Industry consolidation will require substantial capital
In the U.S. alone, the RIA industry will need ~$60 - $100B of capital to support needed consolidation over the next 5+ years But industry consolidation will require substantial capital 18 How sustainable is your long - term growth? 4 Source: Cerulli U.S. RIA Marketplace 2020. ~ $3T Industry Assets $
Slide 19: Only a few winners will emerge
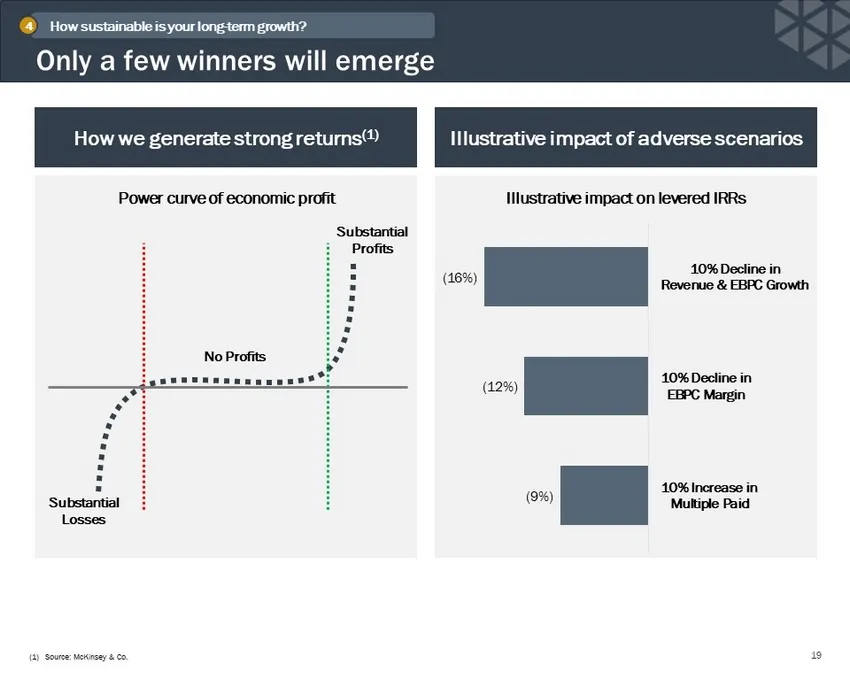
Only a few winners will emerge How we generate strong returns (1) Power curve of economic profit Substantial Losses Substantial Profits No Profits 19 (1) Source: McKinsey & Co. How sustainable is your long - term growth? 4 Illustrative impact of adverse scenarios (9%) (12%) (16%) 10% Increase in Mul
Slide 20: Our model positions us to win globally
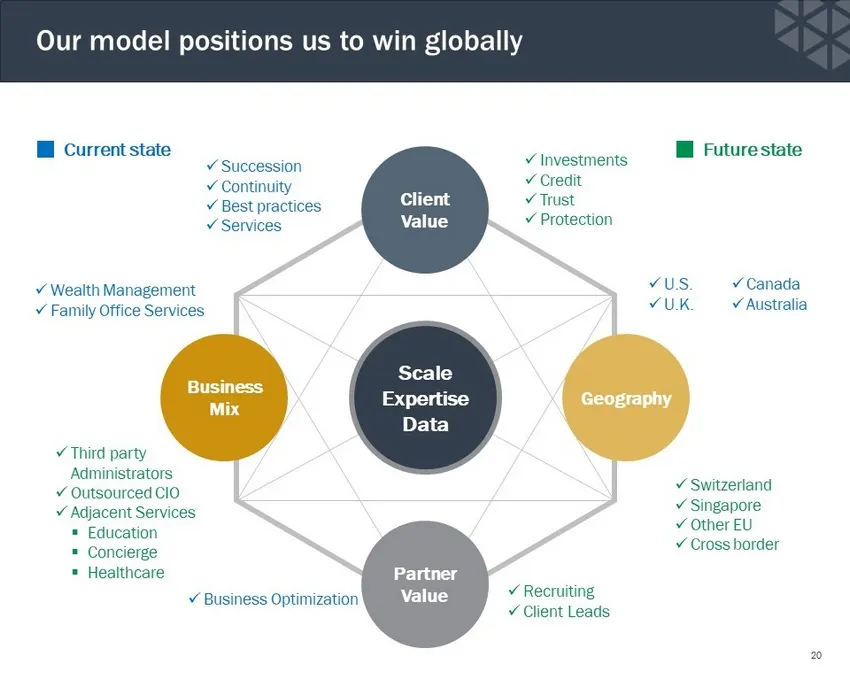
x Succession x Continuity x Best practices x Services x Third party Administrators x Outsourced CIO x Adjacent Services ▪ Education ▪ Concierge ▪ Healthcare x Wealth Management x Family Office Services x U.S. x U.K. x Canada x Australia x Switzerland x Singapore x Other EU x Cross border x Business
Slide 21: Vision for 2025
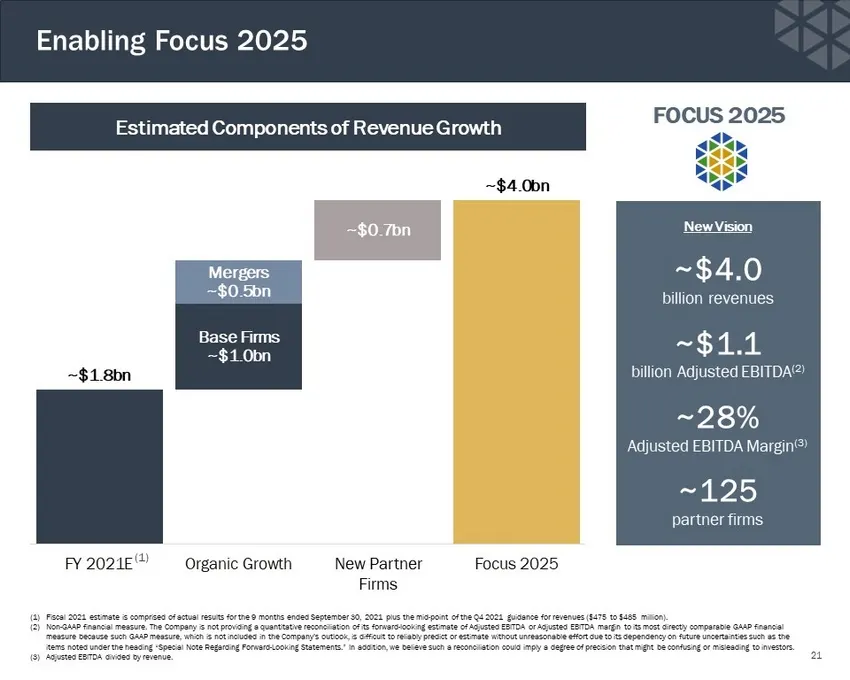
(1) Fiscal 2021 estimate is comprised of actual results for the 9 months ended September 30, 2021 plus the mid - point of the Q4 2021 guidance for revenues ($475 to $485 million). (2) Non - GAAP financial measure. The Company is not providing a quantitative reconciliation of its forward - looking es
Slide 22: Financial Review & Outlook
Financial Review & Outlook Jim Shanahan | Chief Financial Officer
Slide 23: Our bold new vision for 2025
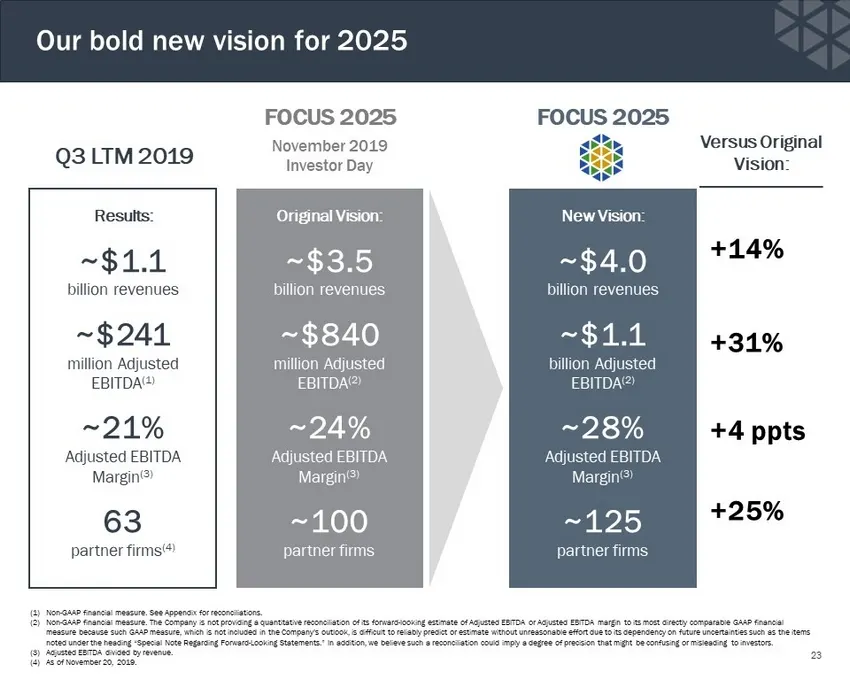
Our bold new vision for 2025 23 (1) Non - GAAP financial measure. See Appendix for reconciliations. (2) Non - GAAP financial measure. The Company is not providing a quantitative reconciliation of its forward - looking estimate of Adjust ed EBITDA or Adjusted EBITDA margin to its most directly compar
Slide 24: Four targets that create shareholder value
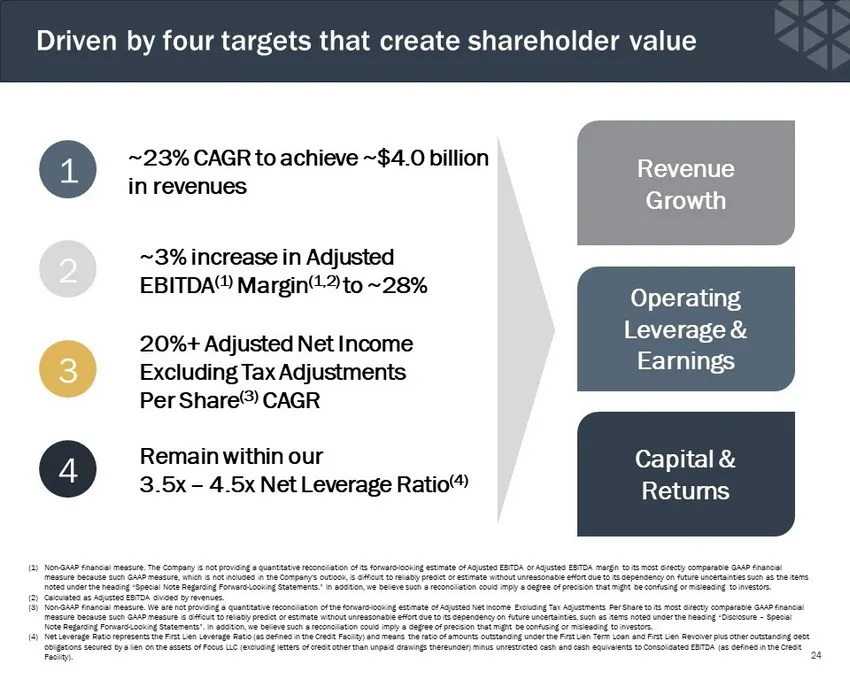
Driven by four targets that create shareholder value 24 (1) Non - GAAP financial measure. The Company is not providing a quantitative reconciliation of its forward - looking estimate of Ad justed EBITDA or Adjusted EBITDA margin to its most directly comparable GAAP financial measure because such GAA
Slide 25: The path to our bold new vision
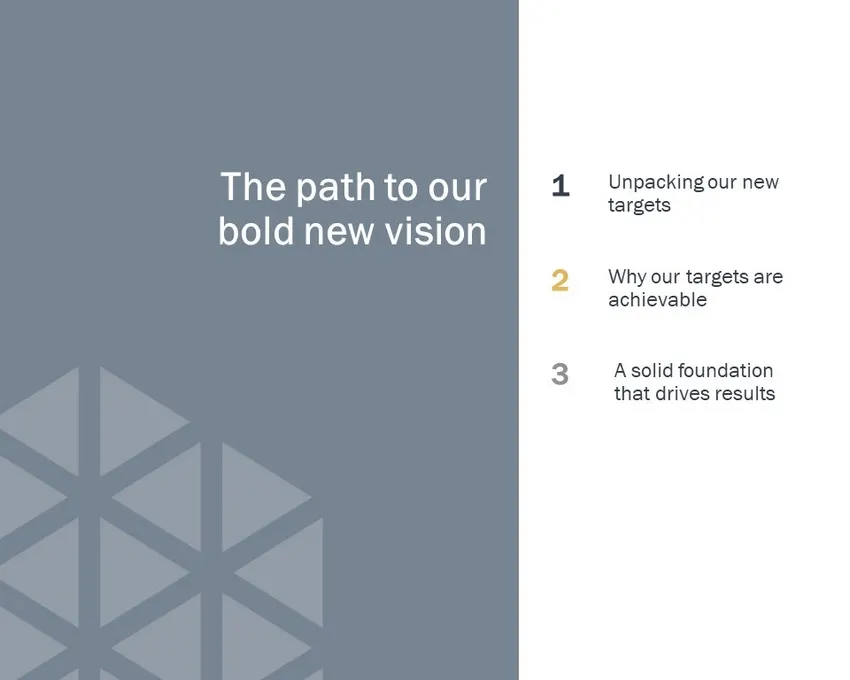
The path to our bold new vision 1 2 3 Unpacking our n ew targets Why our targets are achievable A solid foundation that drives results
Slide 26: Significant progress since our 2019 Investor Day
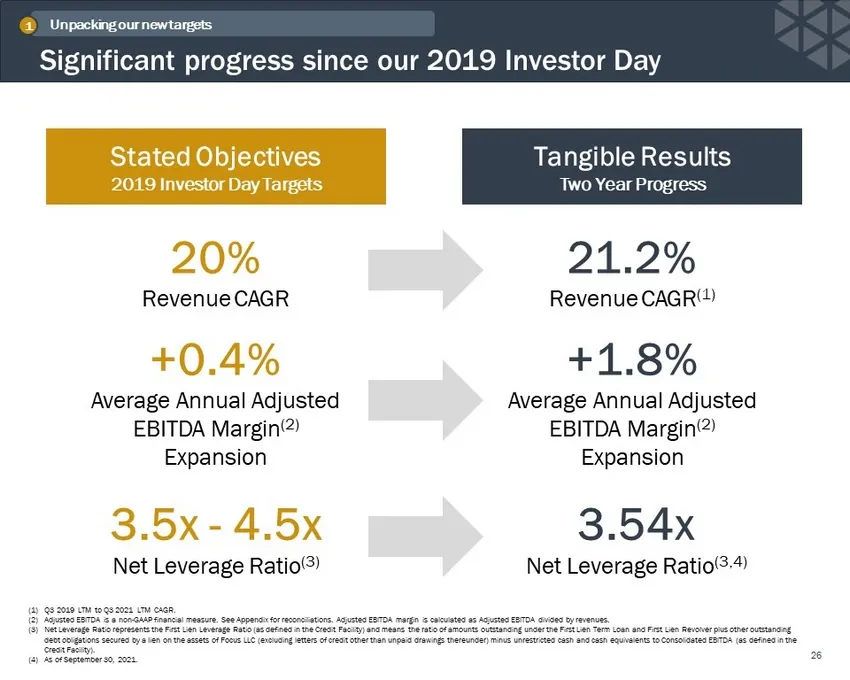
Significant progress since our 2019 Investor Day 26 Stated Objectives 2019 Investor Day Targets Tangible Results Two Year Progress 20% Revenue CAGR 21.2% Revenue CAGR (1) +0.4% Average Annual Adjusted EBITDA Margin (2) Expansion +1.8% Average Annual Adjusted EBITDA Margin (2) Expansion 3.5x - 4.5x N
Slide 27: Supporting the increase in our revenue target
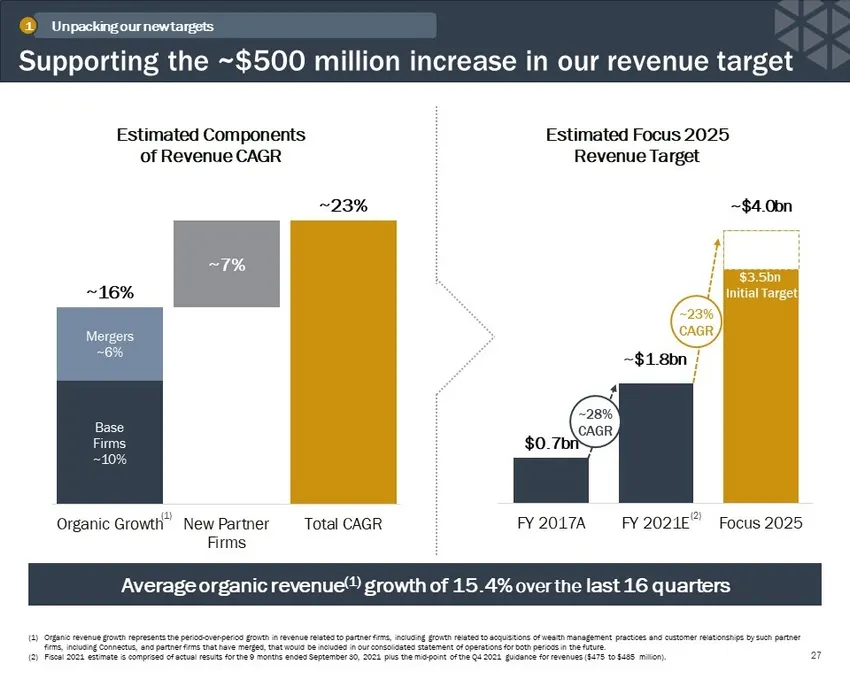
Base Firms ~10% Mergers ~6% ~7% ~16% ~23% Organic Growth New Partner Firms Total CAGR Estimated Components of Revenue CAGR $0.7bn ~ $1.8bn ~$4.0bn FY 2017A FY 2021E Focus 2025 Estimated Focus 2025 Revenue Target $3.5bn Initial Target ~23% CAGR ~28% CAGR Supporting the ~$500 million increase in our r
Slide 28: Increase in our Adjusted EBITDA target
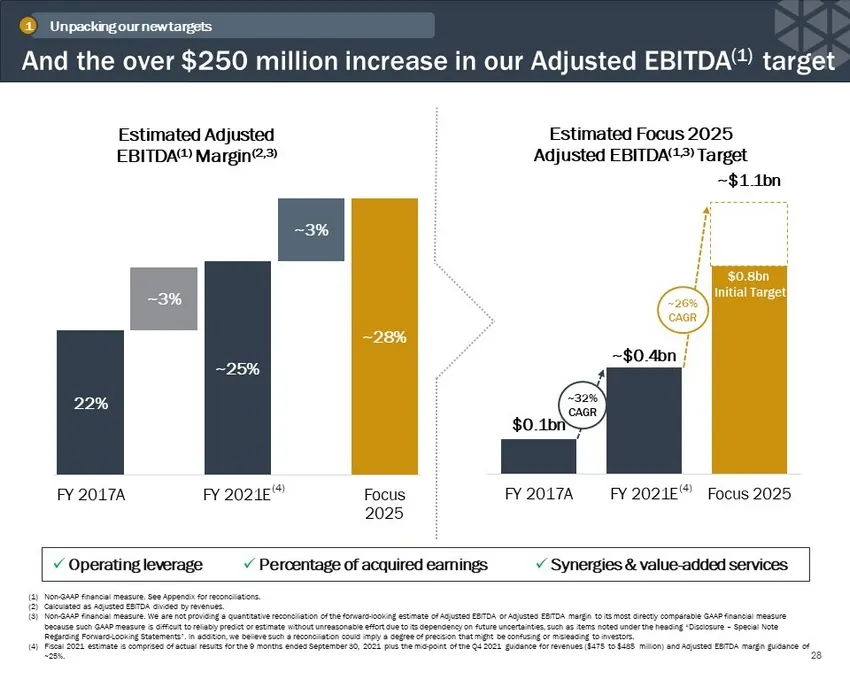
$0.1bn ~ $0.4bn ~$1.1bn FY 2017A FY 2021E Focus 2025 Estimated Focus 2025 Adjusted EBITDA (1,3) Target ~32% CAGR ~26% CAGR $ 0.8 bn Initial Target And the over $250 million increase in our Adjusted EBITDA (1) target 28 22% ~25% ~28% ~ 3% ~3% FY 2017A FY 2021E Focus 2025 Estimated Adjusted EBITDA (1)
Slide 29: Diverse partnership of leading firms with scale
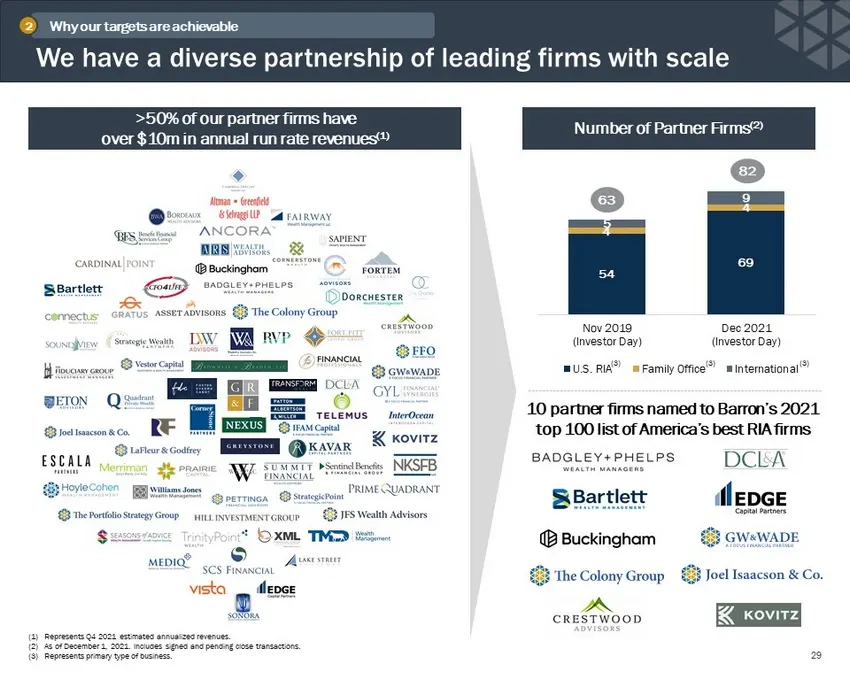
54 69 4 4 5 9 Nov 2019 (Investor Day) Dec 2021 (Investor Day) U.S. RIA Family Office International >50% of our partner firms have over $10m in annual run rate revenues (1) We have a diverse partnership of leading firms with scale (1) Represents Q4 2021 estimated annualized revenues. (2) As of Decemb
Slide 30: Large, high-growth and global industry
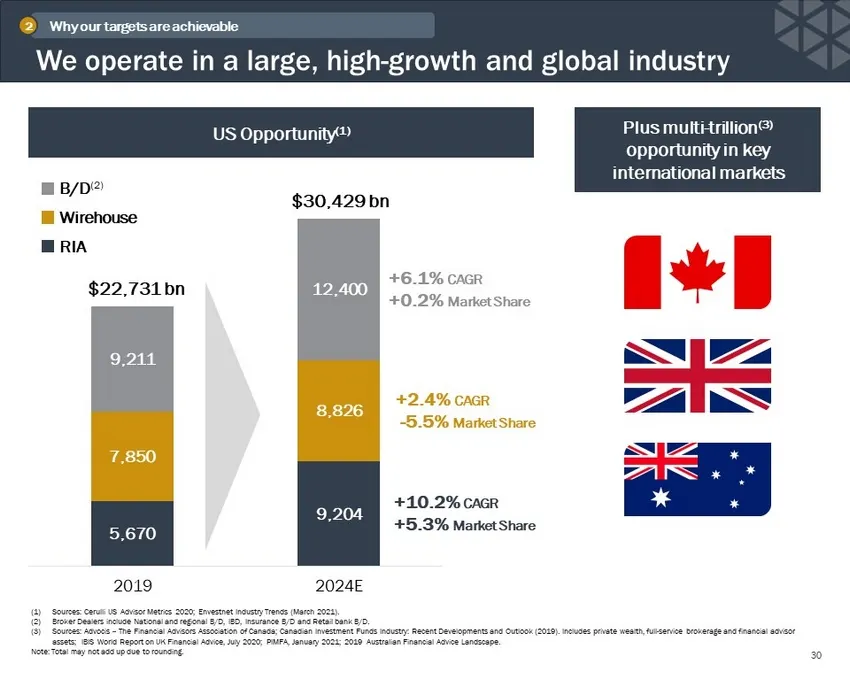
We operate in a large, high - growth and global industry 30 Why our targets are achievable 2 US Opportunity (1) Plus multi - trillion (3) opportunity in key international markets 5,670 9,204 7,850 8,826 9,211 12,400 2019 2024E $22,731 bn $30,429 bn Wirehouse RIA B/D (2) +6.1% CAGR +0.2% Market Share
Slide 31: Capital flexibility and strong credit profile
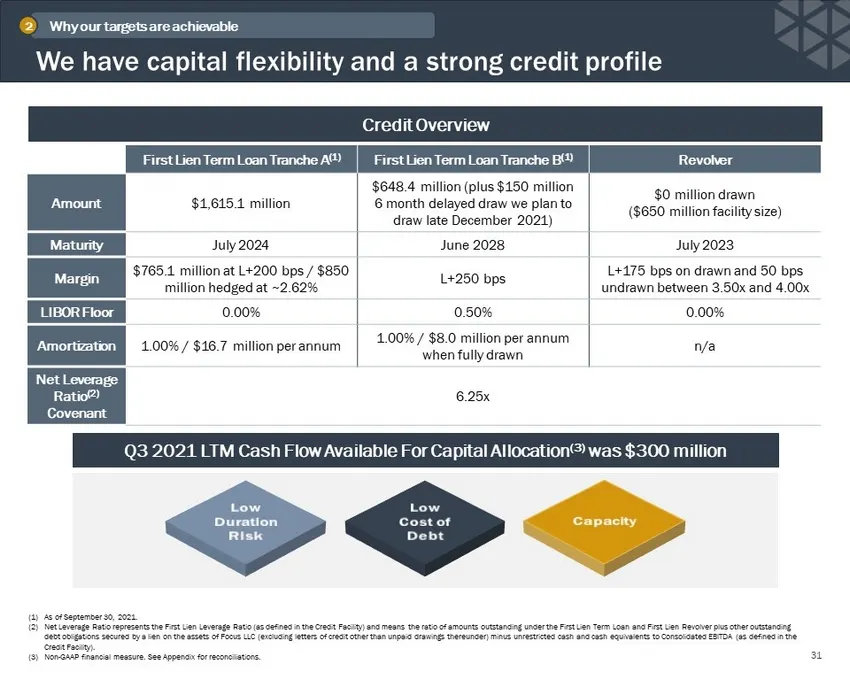
We have capital flexibility and a strong credit profile 31 First Lien Term Loan Tranche A (1) First Lien Term Loan Tranche B (1) Revolver Amount $1,615.1 million $648.4 million (plus $150 million 6 month delayed draw we plan to draw late December 2021) $0 million drawn ($650 million facility size) M
Slide 32: Our financial model is well designed
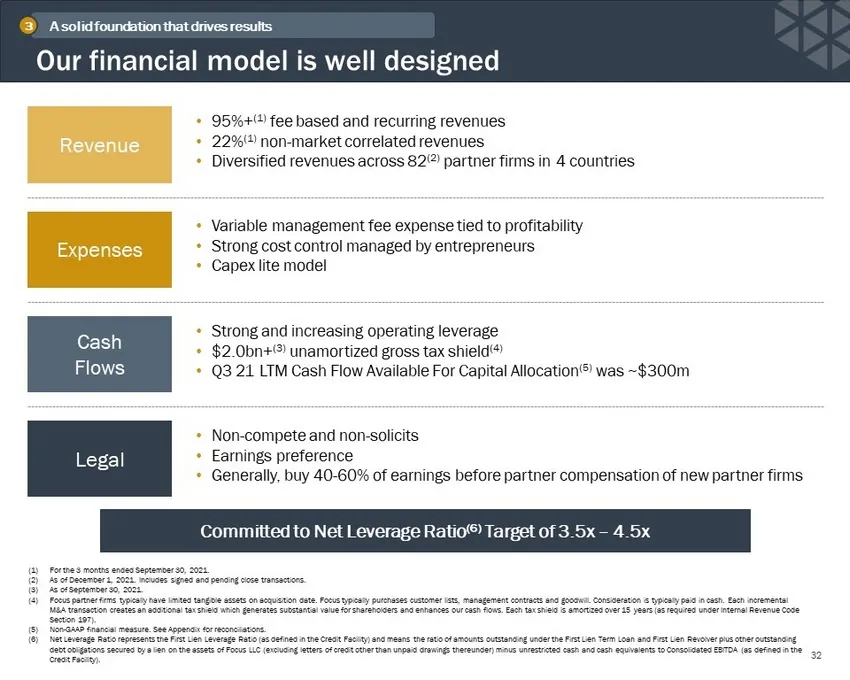
Our financial model is well designed 32 • 95%+ (1) fee based and recurring revenues • 22% (1) non - market correlated revenues • Diversified revenues across 82 (2) partner firms in 4 countries • Variable management fee expense tied to profitability • Strong cost control managed by entrepreneurs • Ca
Slide 33: Generating substantial Acquired Base Earnings
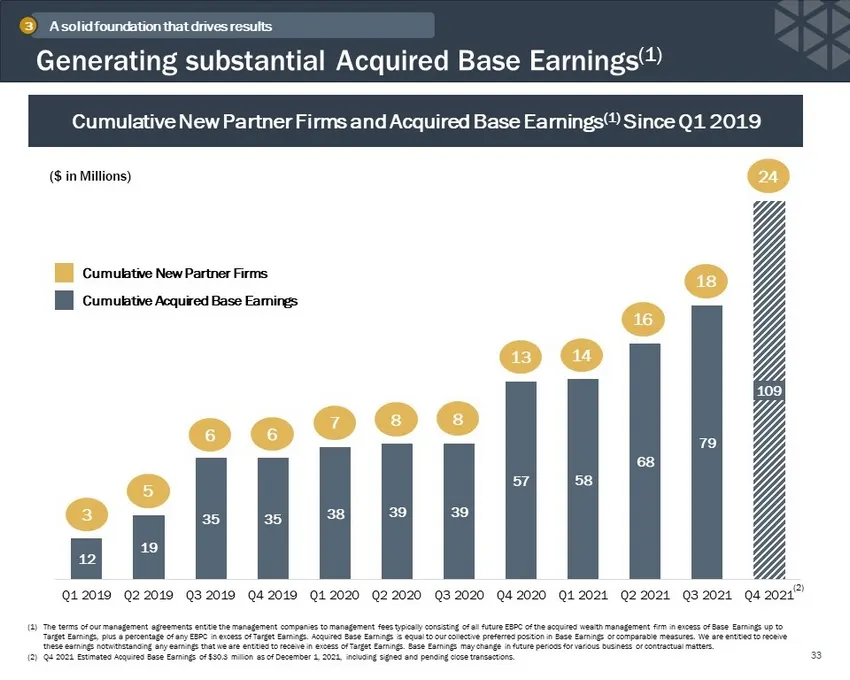
Generating substantial Acquired Base Earnings (1) 33 (1) The terms of our management agreements entitle the management companies to management fees typically consisting of all futur e EBPC of the acquired wealth management firm in excess of Base Earnings up to Target Earnings, plus a percentage of a
Slide 34: Strong and increasing cash flow generation
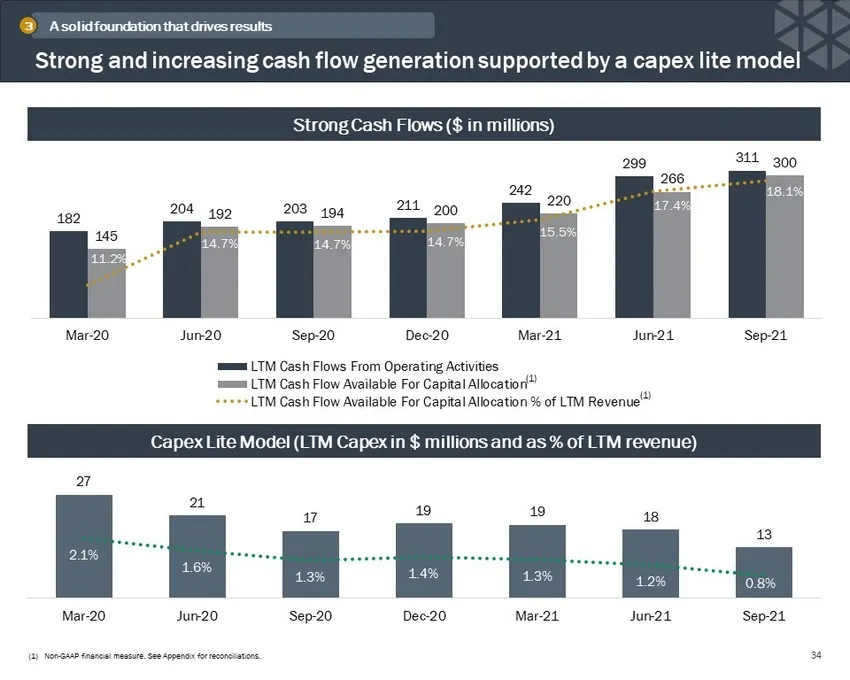
182 204 203 211 242 299 311 145 192 194 200 220 266 300 11.2% 14.7% 14.7% 14.7% 15.5% 17.4% 18.1% Mar-20 Jun-20 Sep-20 Dec-20 Mar-21 Jun-21 Sep-21 LTM Cash Flows From Operating Activities LTM Cash Flow Available For Capital Allocation LTM Cash Flow Available For Capital Allocation % of LTM Revenue S
Slide 35: Our tax-efficient structure enhances cash flow growth
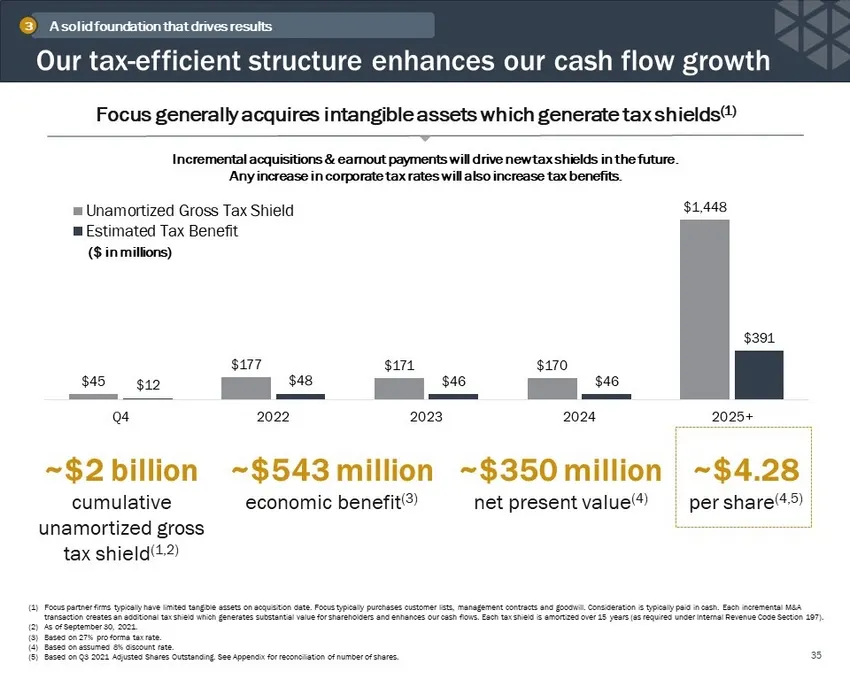
Our tax - efficient structure enhances our cash flow growth 35 (1) Focus partner firms typically have limited tangible assets on acquisition date. Focus typically purchases customer lists, ma nagement contracts and goodwill. Consideration is typically paid in cash. Each incremental M&A transaction c
Slide 36: Quarterly guidance implemented at Covid onset
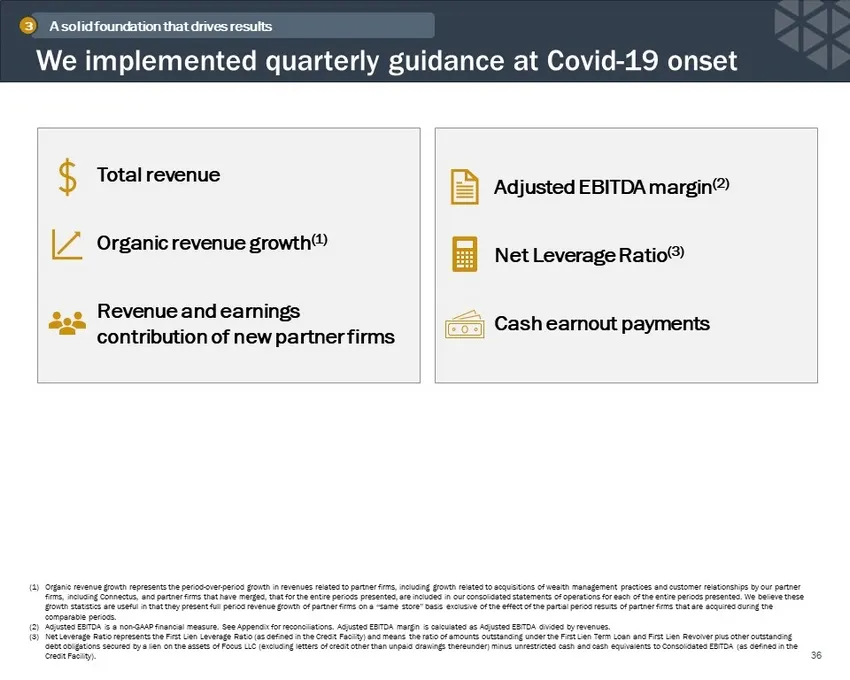
We implemented quarterly guidance at Covid - 19 onset 36 Total revenue Organic revenue growth (1) Revenue and earnings contribution of new partner firms Adjusted EBITDA margin (2) Net Leverage Ratio (3) Cash earnout payments (1) Organic revenue growth represents the period - over - period growth in
Slide 37: We consistently delivered despite market volatility
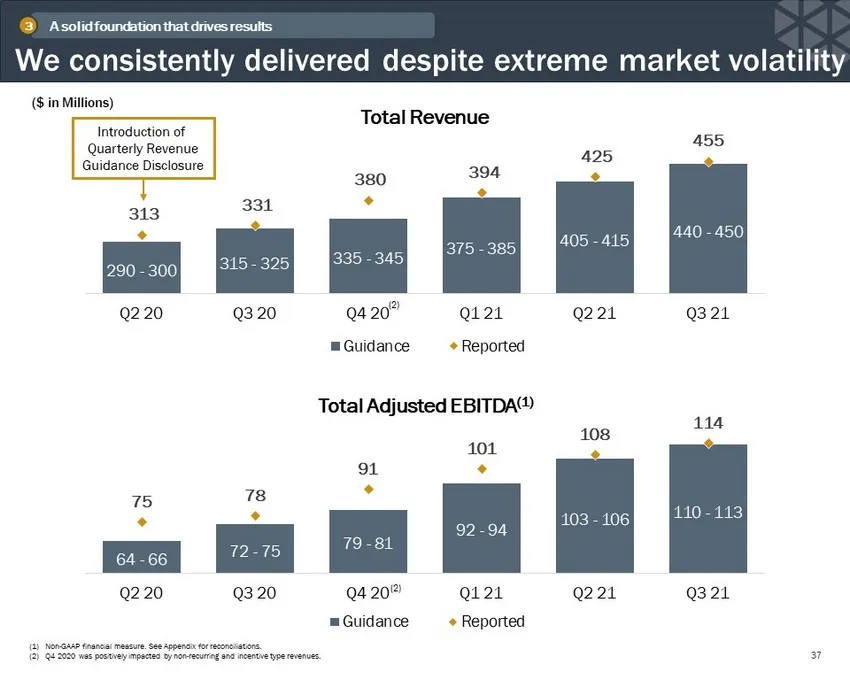
64 - 66 72 - 75 79 - 81 92 - 94 103 - 106 110 - 113 75 78 91 101 108 114 Q2 20 Q3 20 Q4 20 Q1 21 Q2 21 Q3 21 Total Adjusted EBITDA (1) Guidance Reported 290 - 300 315 - 325 335 - 345 375 - 385 405 - 415 440 - 450 313 331 380 394 425 455 Q2 20 Q3 20 Q4 20 Q1 21 Q2 21 Q3 21 Total Revenue Guidance Repo
Slide 38: Within or below our net leverage targets
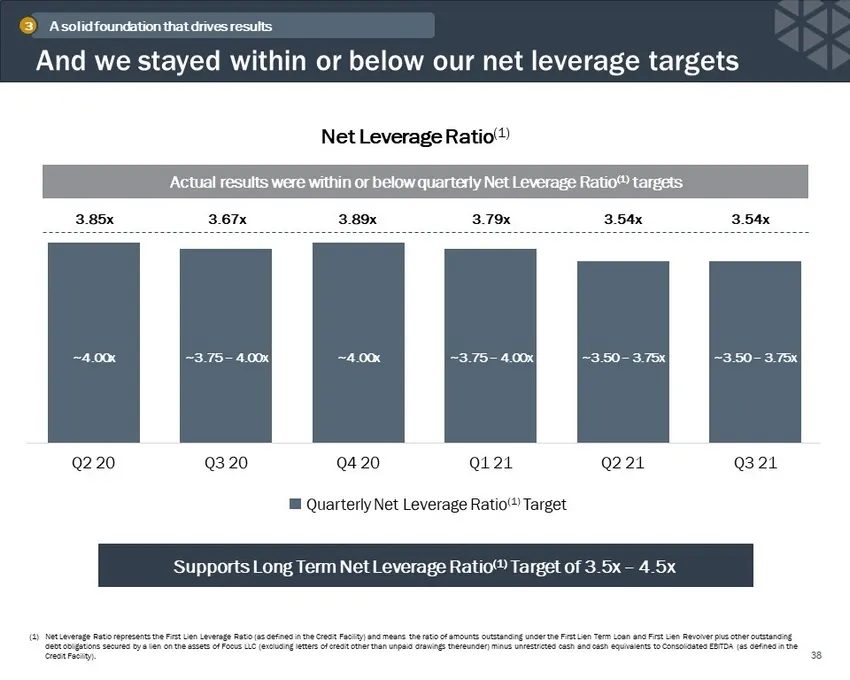
And we stayed within or below our net leverage targets 38 (1) Net Leverage Ratio represents the First Lien Leverage Ratio (as defined in the Credit Facility) and means the ratio of amoun ts outstanding under the First Lien Term Loan and First Lien Revolver plus other outstanding debt obligations sec
Slide 39: Our financial model demonstrated stability and resiliency
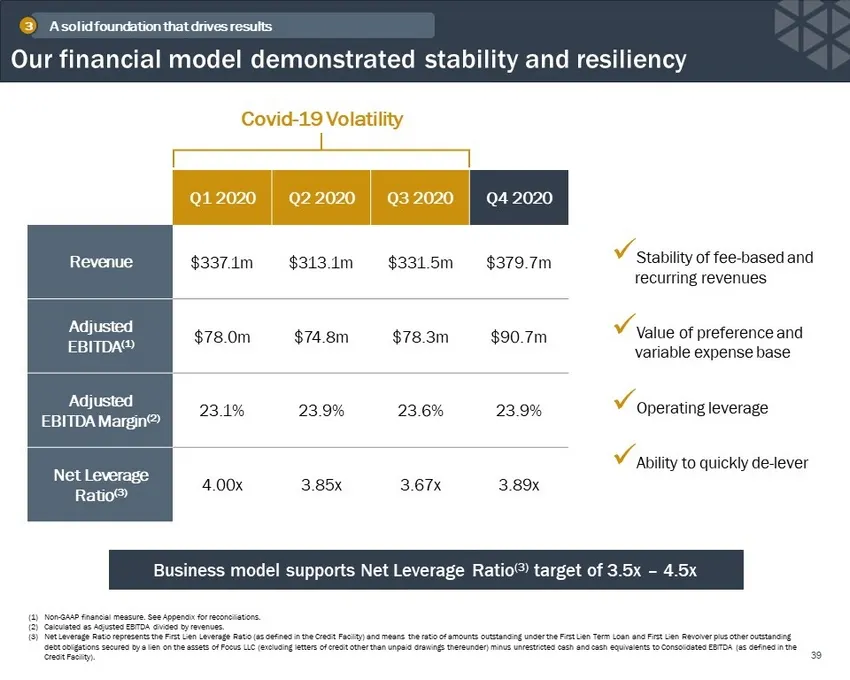
Our financial model demonstrated stability and resiliency 39 Q1 2020 Q2 2020 Q3 2020 Q4 2020 Revenue $337.1m $313.1m $331.5m $379.7m Adjusted EBITDA (1) $78.0m $74.8m $78.3m $90.7m Adjusted EBITDA Margin (2) 23.1% 23.9% 23.6% 23.9% Net Leverage Ratio (3) 4.00x 3.85x 3.67x 3.89x Business model suppor
Slide 40: Well positioned to deliver significant shareholder value
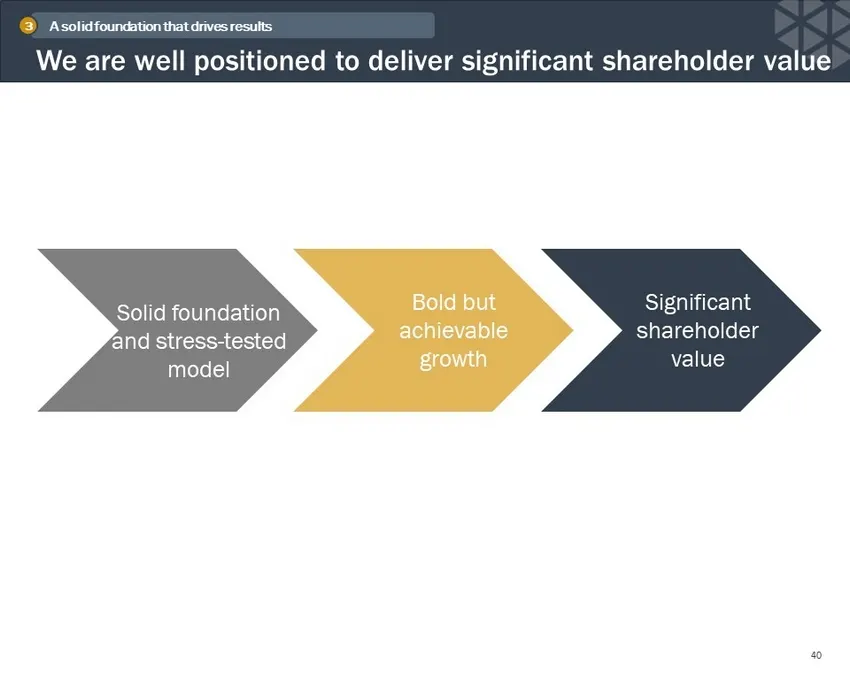
We are well positioned to deliver significant shareholder value 40 A solid foundation that drives results 3 Solid foundation and stress - tested model Bold but achievable growth Significant shareholder value

Slide 41: The Global M&A Opportunity
The Global M&A Opportunity Rajini Kodialam | Co - Founder & Chief Operating Officer
Slide 42: Our bold new vision for 2025
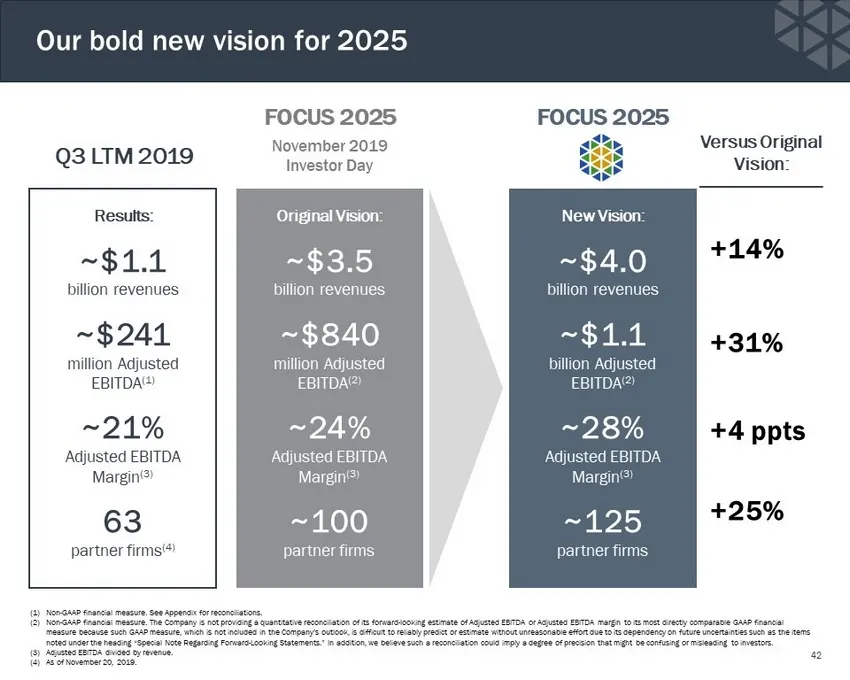
Our bold new vision for 2025 42 (1) Non - GAAP financial measure. See Appendix for reconciliations. (2) Non - GAAP financial measure. The Company is not providing a quantitative reconciliation of its forward - looking estimate of Adjust ed EBITDA or Adjusted EBITDA margin to its most directly compar
Slide 43: The staying power of programmatic M&A
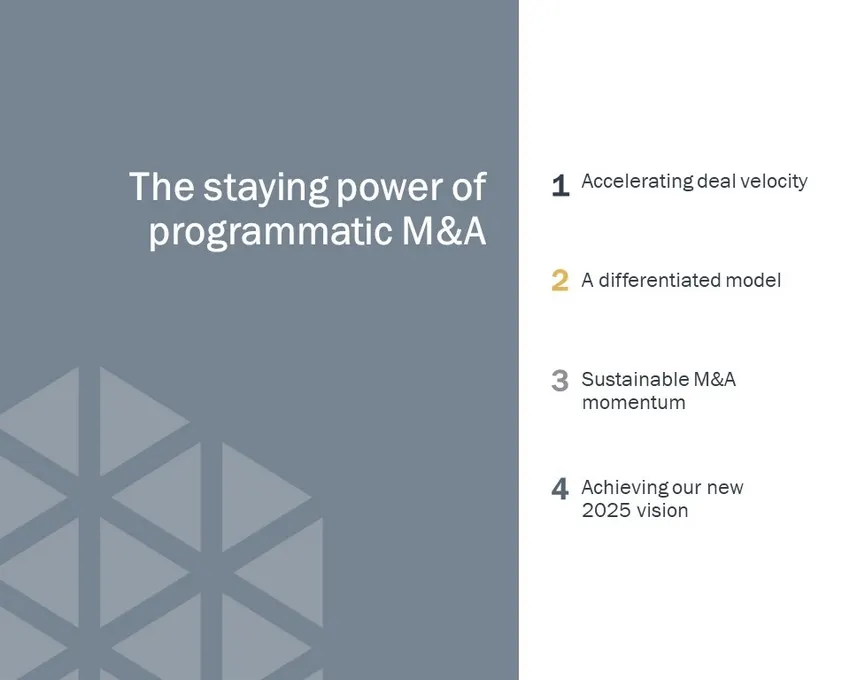
The staying power of programmatic M&A 1 2 3 Accelerating deal velocity A differentiated model Sustainable M&A momentum 4 Achieving our new 2025 vision
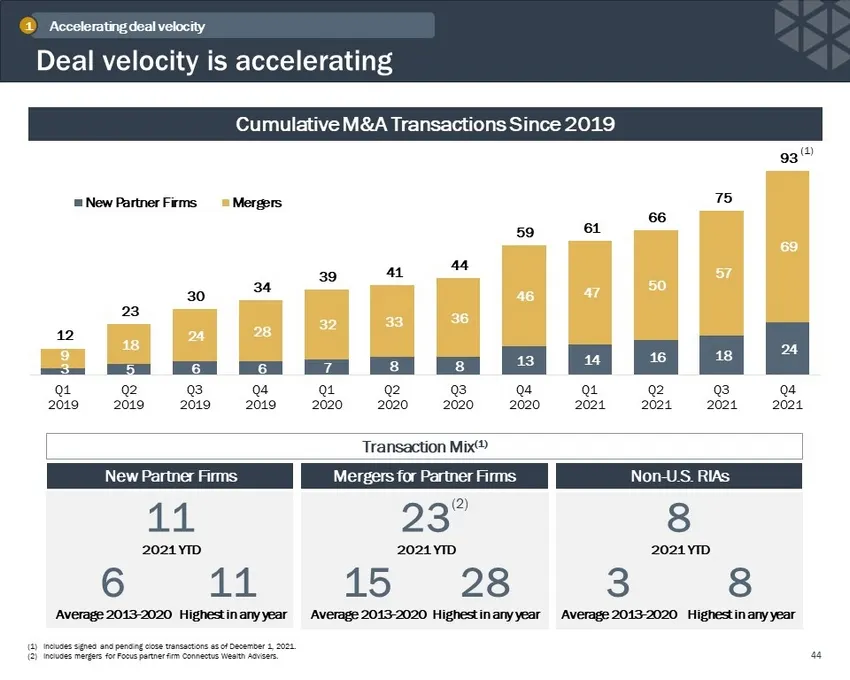
Slide 44: Deal velocity is accelerating
11 2021 YTD 6 Average 2013 - 2020 11 Highest in any year 8 2021 YTD 3 Average 2013 - 2020 8 Highest in any year 23 2021 YTD 15 Average 2013 - 2020 28 Highest in any year Deal velocity is accelerating 44 (1) Includes signed and pending close transactions as of December 1, 2021. (2) Includes mergers f
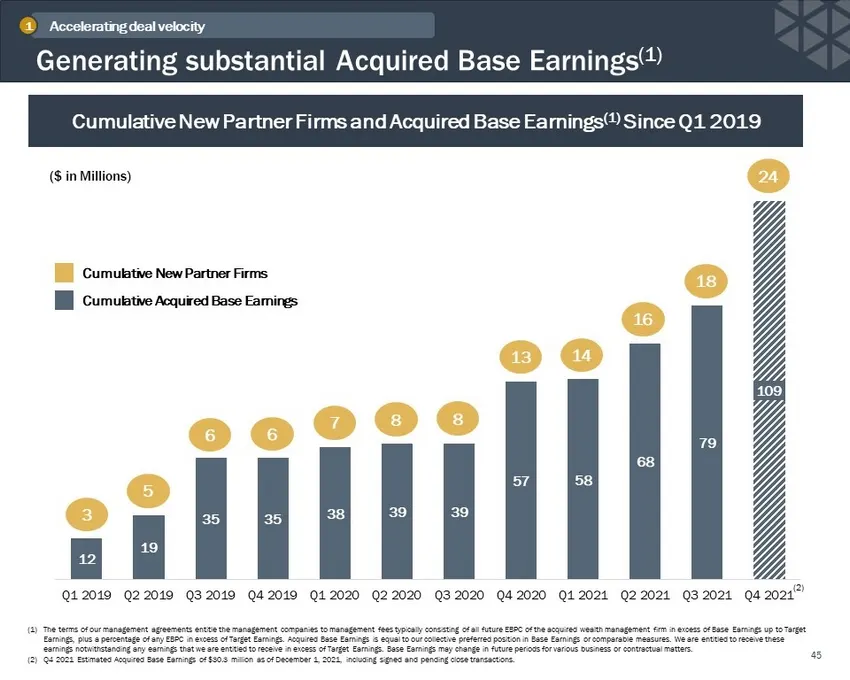
Slide 45: Generating substantial Acquired Base Earnings
Generating substantial Acquired Base Earnings (1) 45 (1) The terms of our management agreements entitle the management companies to management fees typically consisting of all futur e EBPC of the acquired wealth management firm in excess of Base Earnings up to Target Earnings, plus a percentage of a
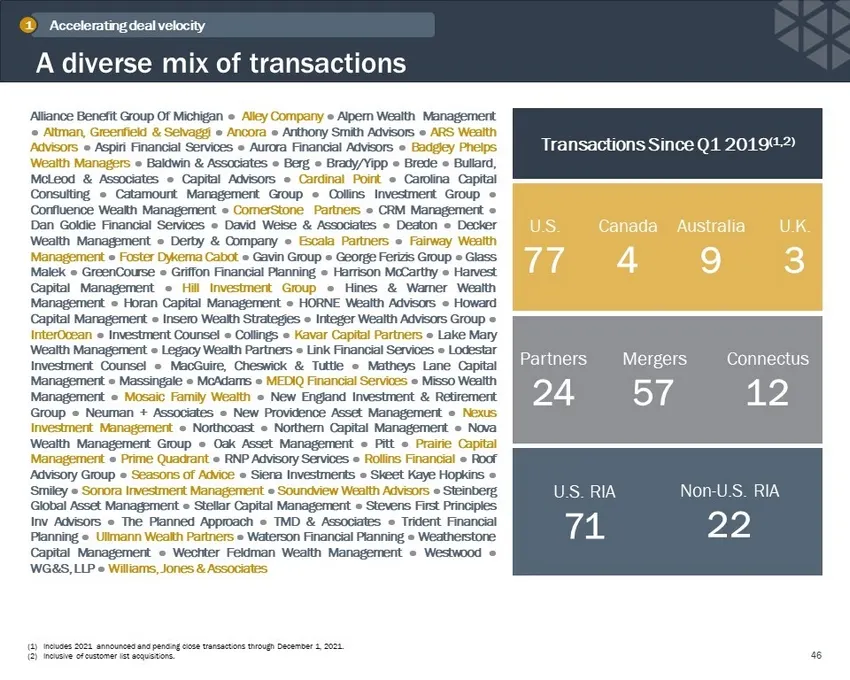
Slide 46: A diverse mix of transactions
A diverse mix of transactions Accelerating deal velocity 1 U.S. 77 Australia 9 Transactions Since Q1 2019 (1,2) Canada 4 U.K. 3 Partners 24 Connectus 12 Mergers 57 U.S. RIA 71 Non - U.S. RIA 22 46 (1) Includes 2021 announced and pending close transactions through December 1, 2021. (2) Inclusive of c
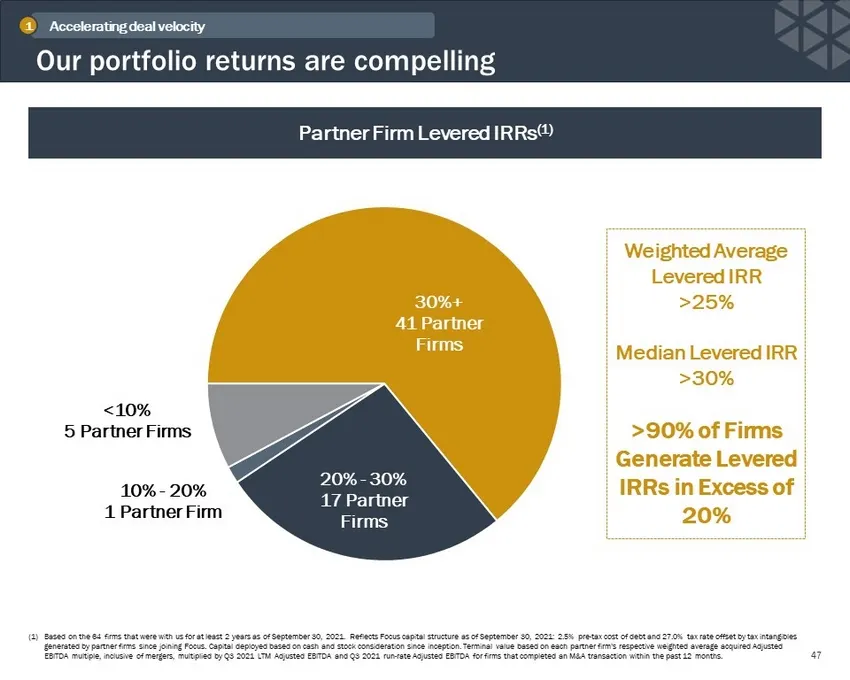
Slide 47: Our portfolio returns are compelling
Our portfolio returns are compelling 47 (1) Based on the 64 firms that were with us for at least 2 years as of September 30, 2021. Reflects Focus capital structure as o f September 30, 2021: 2.5% pre - tax cost of debt and 27.0% tax rate offset by tax intangibles generated by partner firms since joi
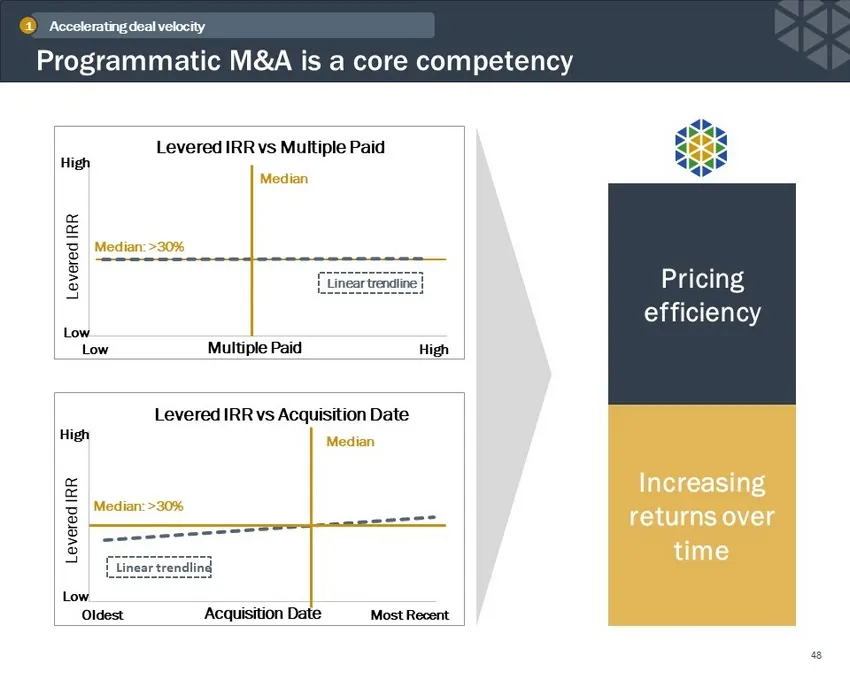
Slide 48: Programmatic M&A is a core competency
Programmatic M&A is a core competency Accelerating deal velocity 1 Levered IRR Acquisition Date Levered IRR vs Acquisition Date Oldest Most Recent High Low Linear trendline Median: >30% Median Levered IRR Multiple Paid Levered IRR vs Multiple Paid Low High High Low Linear trendline Median: >30% Medi
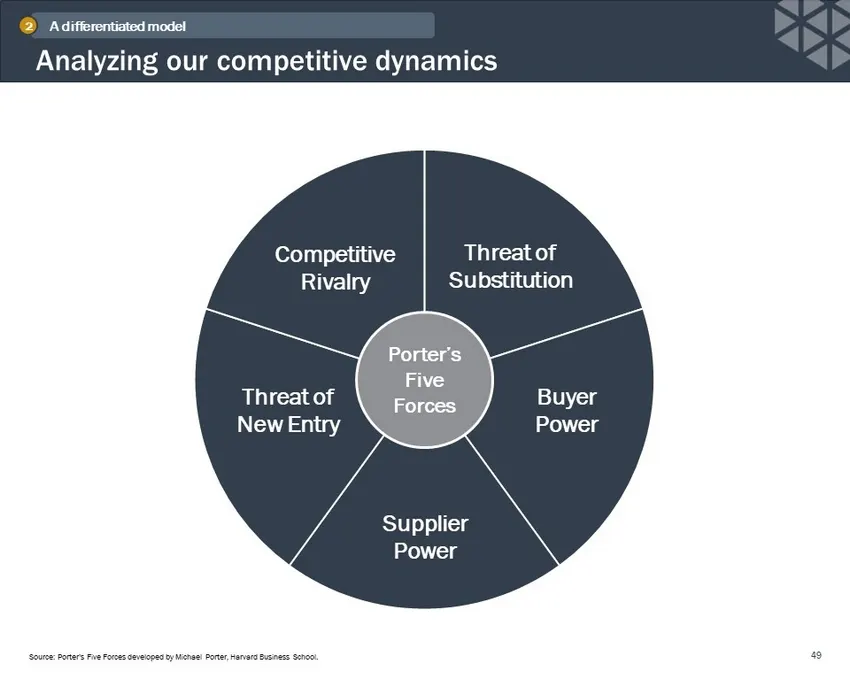
Slide 49: Analyzing our competitive dynamics
Analyzing our competitive dynamics Threat of Substitution Buyer Power Supplier Power Threat of New Entry Competitive Rivalry Porter’s Five Forces Threat of Substitution Buyer Power Supplier Power Threat of New Entry Competitive Rivalry Porter’s Five Forces Source: Porter’s Five Forces developed by M
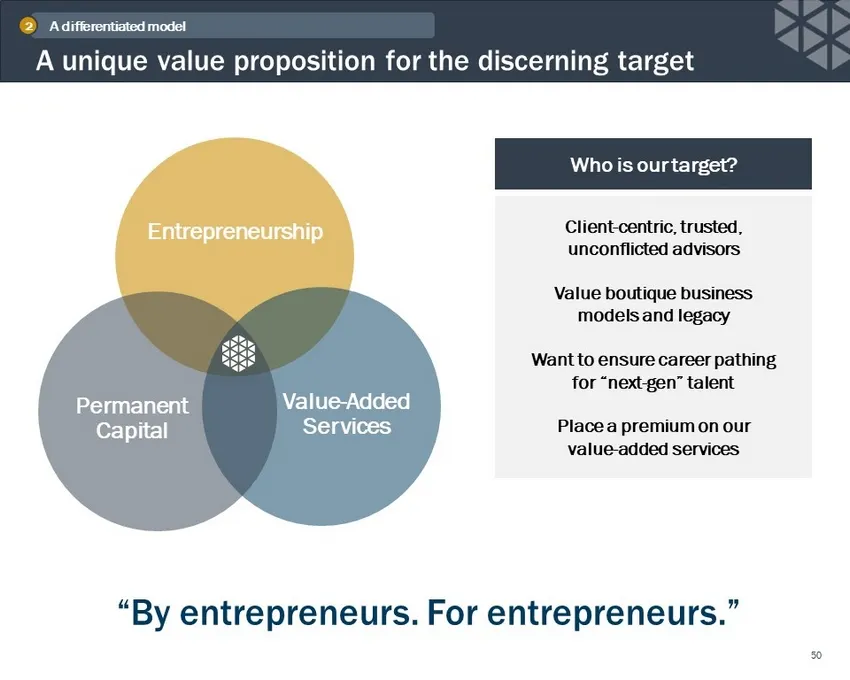
Slide 50: A unique value proposition for the discerning target
Our Mission A unique value proposition for the discerning target 50 A differentiated model 2 Entrepreneurship Value - Added Services Permanent Capital “By entrepreneurs. For entrepreneurs.” Who is our target? Client - centric, trusted, unconflicted advisors Value boutique business models and legacy
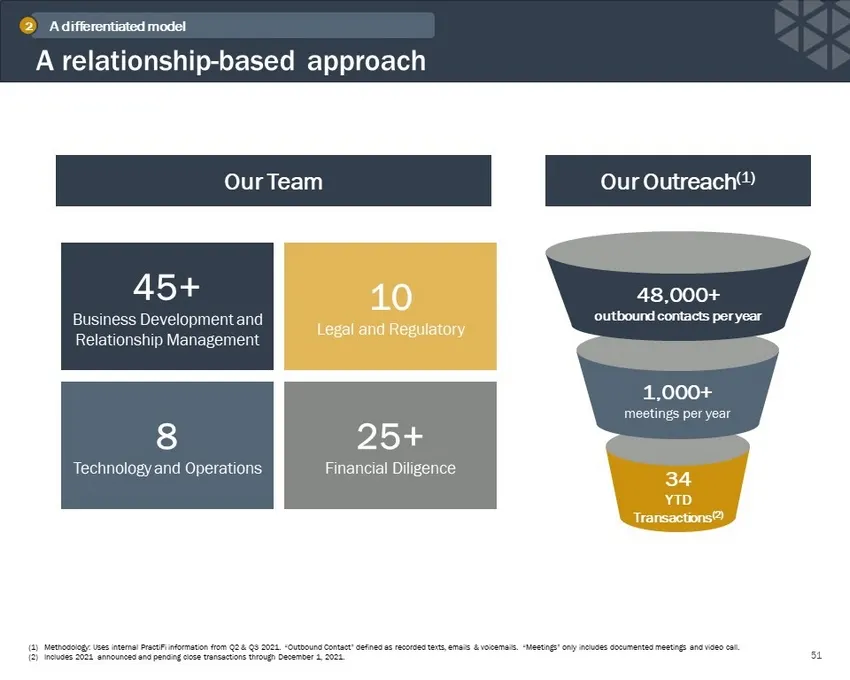
Slide 51: A relationship-based approach
A relationship - based approach (1) Methodology: Uses internal PractiFi information from Q2 & Q3 2021. “Outbound Contact” defined as recorded texts, emails & voicemails. “Meetings” only includes do cu mented meetings and video call. (2) Includes 2021 announced and pending close transactions through
Slide 52: Multiple models to address founders & next gen
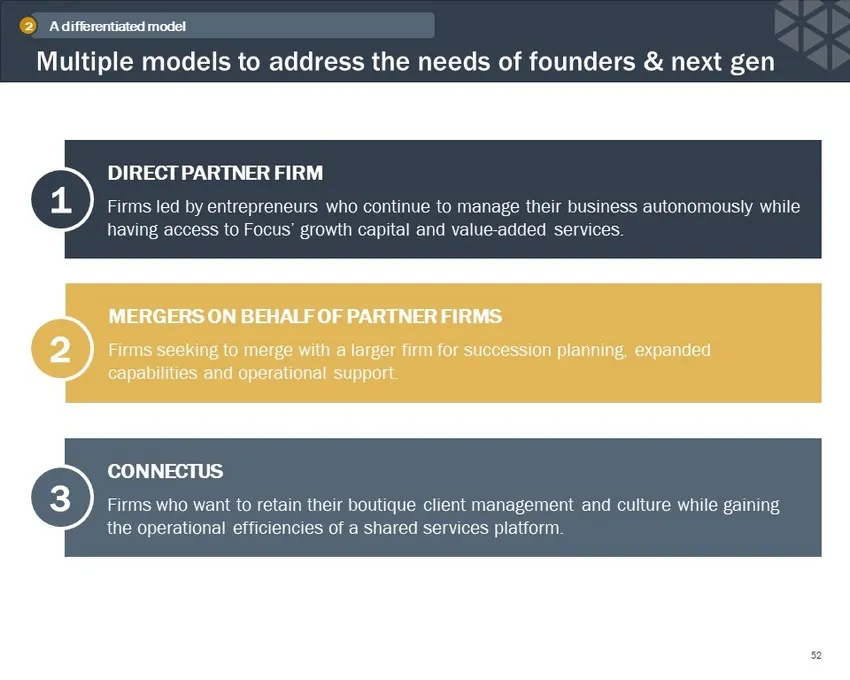
Multiple models to address the needs of founders & next gen 52 Better Client Experience & Outcomes Staff Development & Opportunities DIRECT PARTNER FIRM Firms led by entrepreneurs who continue to manage their business autonomously while having access to Focus’ growth capital and value - added servic
Slide 53: A consistent and rigorous due diligence process
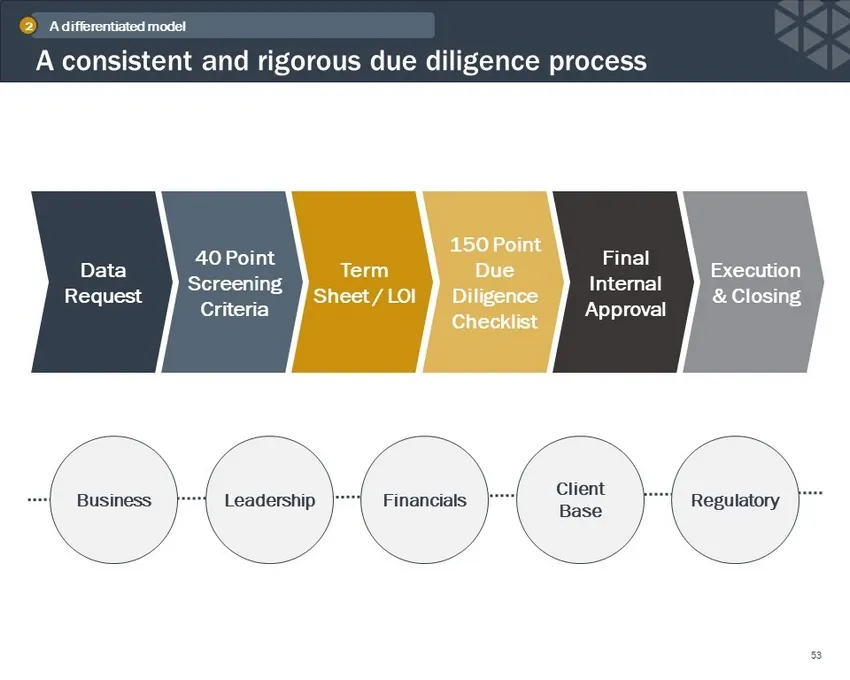
A consistent and rigorous due diligence process 53 Data Request Term Sheet / LOI 150 Point Due Diligence Checklist Final Internal Approval Execution & Closing 40 Point Screening Criteria Business Leadership Financials Client Base Regulatory A differentiated model 2
Slide 54: A broad array of resources and expertise
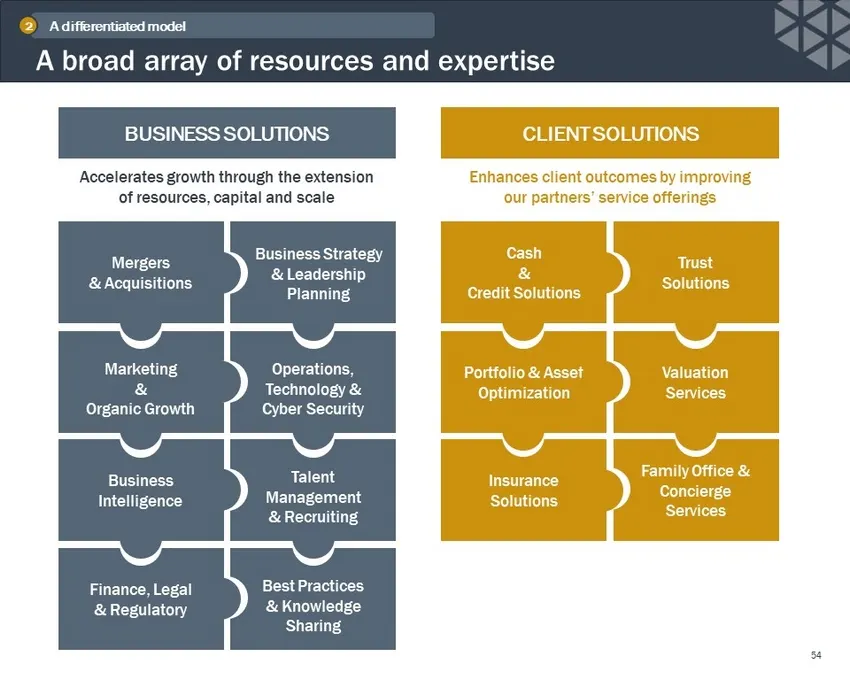
A broad array of resources and expertise Accelerates growth through the extension of resources, capital and scale Enhances client outcomes by improving our partners’ service offerings BUSINESS SOLUTIONS CLIENT SOLUTIONS Valuation Services Trust Solutions Family Office & Concierge Services Insurance
Slide 55: A long track record of success
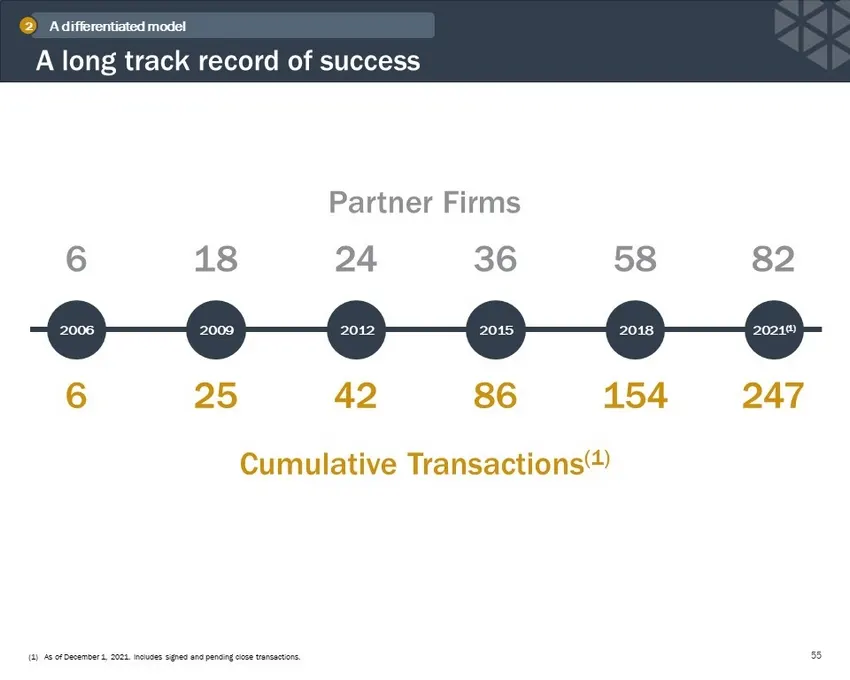
A long track record of success 55 2006 2009 2012 2018 2015 58 36 24 18 6 6 25 42 86 154 2021 (1) 82 247 (1) As of December 1, 2021. Includes signed and pending close transactions. Partner Firms Cumulative Transactions (1) A differentiated model 2
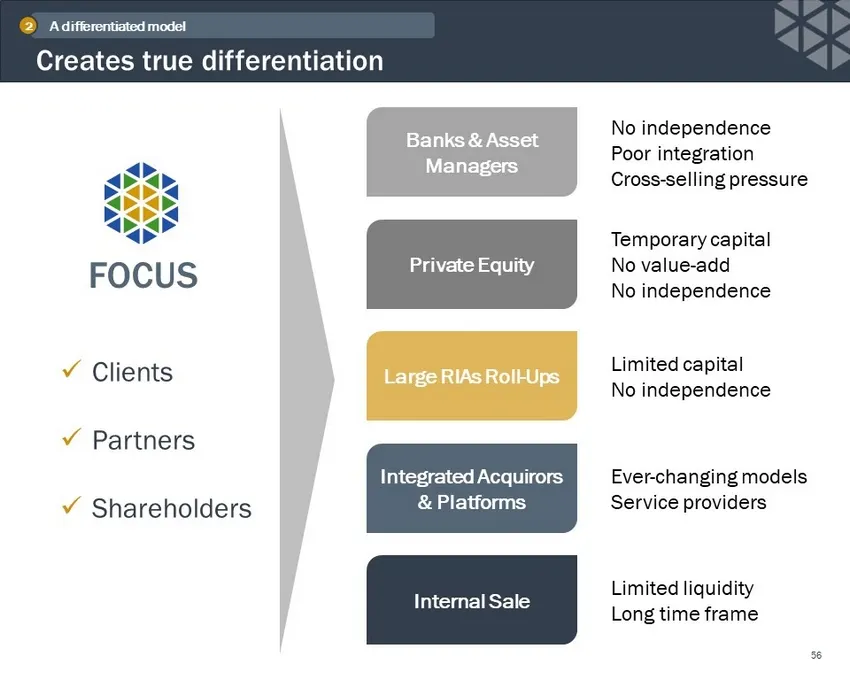
Slide 56: Creates true differentiation
No independence Poor integration Cross - selling pressure Temporary capital No value - add No independence Limited capital No independence Limited liquidity Long time frame Ever - changing models Service providers Creates true differentiation 56 Banks & Asset Managers Private Equity Large RIAs Roll
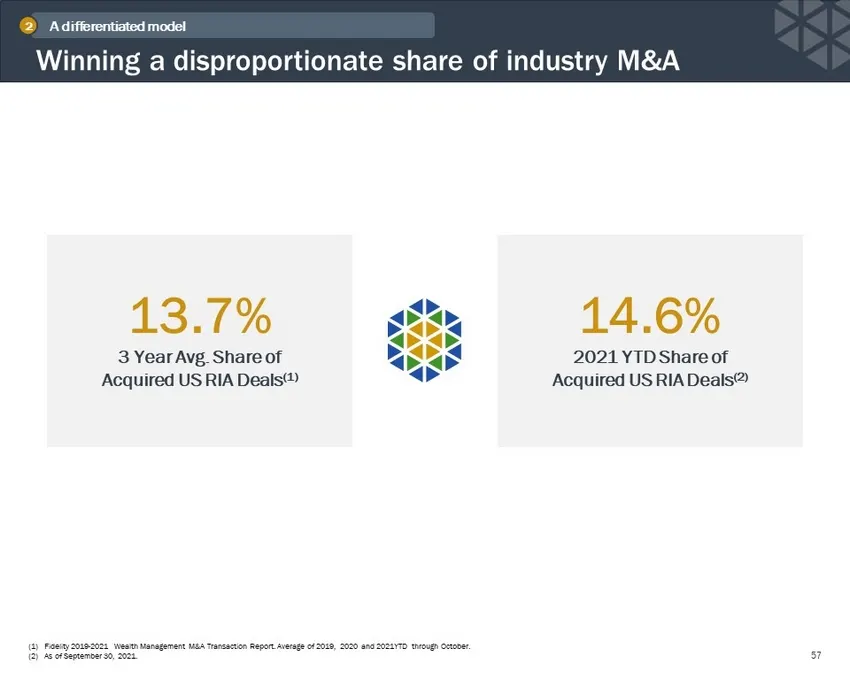
Slide 57: Winning a disproportionate share of industry M&A
Winning a disproportionate share of industry M&A 57 (1) Fidelity 2019 - 2021 Wealth Management M&A Transaction Report. Average of 2019, 2020 and 2021YTD through October. (2) As of September 30, 2021. A differentiated model 2 13.7% 3 Year Avg. Share of Acquired US RIA Deals (1) 14.6% 2021 YTD Share o
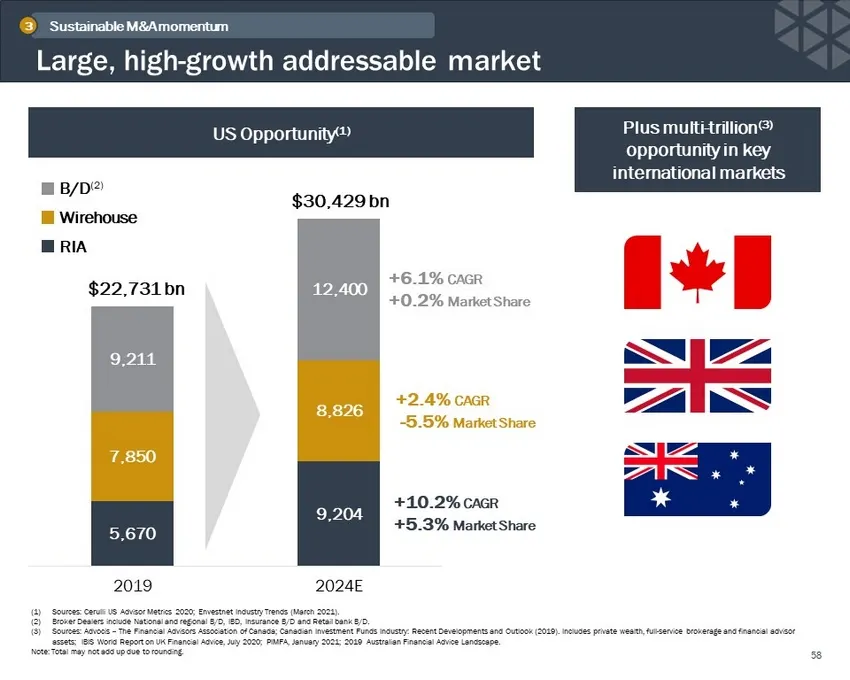
Slide 58: Large, high-growth addressable market
Large, high - growth addressable market 58 Sustainable M&A momentum 3 (1) Sources: Cerulli US Advisor Metrics 2020; Envestnet Industry Trends (March 2021). (2) Broker Dealers include National and regional B/D, IBD, Insurance B/D and Retail bank B/D. (3) Sources: Advocis -- The Financial Advisors Ass
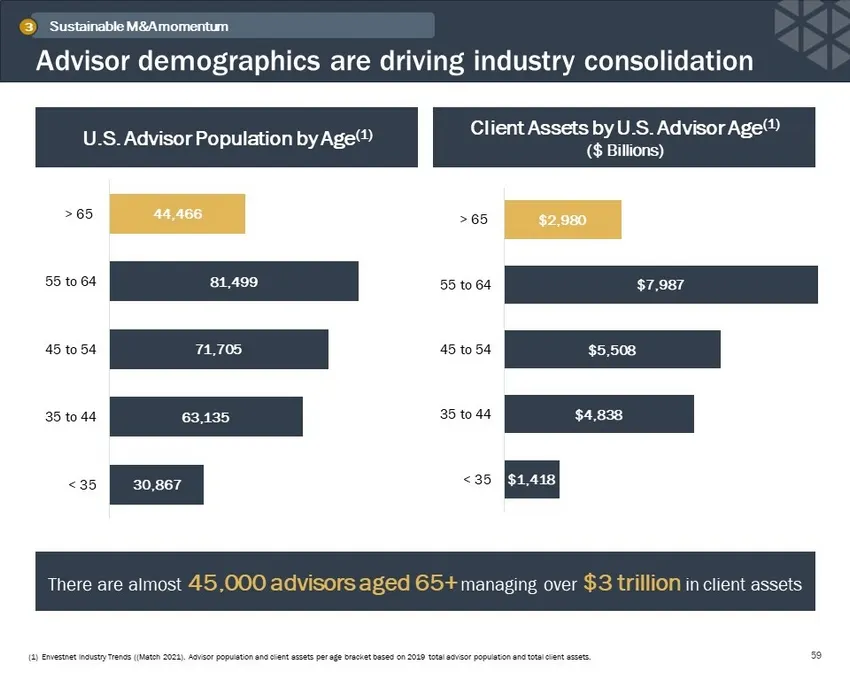
Slide 59: Advisor demographics are driving industry consolidation
(1) Envestnet Industry Trends ((Match 2021). Advisor population and client assets per age bracket based on 2019 total adviso r p opulation and total client assets. Sustainable M&A momentum 3 Advisor demographics are driving industry consolidation 59 There are almost 45,000 advisors aged 65+ managing
Slide 60: A competitive moat in a high-growth industry
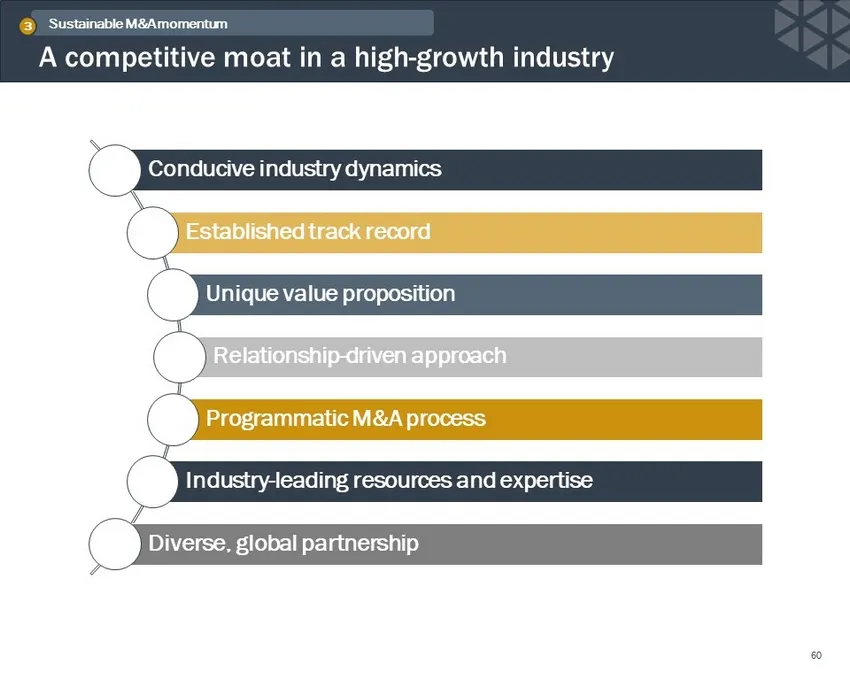
A competitive moat in a high - growth industry 60 Conducive industry dynamics Established track record Unique value proposition Relationship - driven approach Programmatic M&A process Industry - leading resources and expertise Diverse, global partnership Sustainable M&A momentum 3
Slide 61: Revenue bridge to Focus 2025
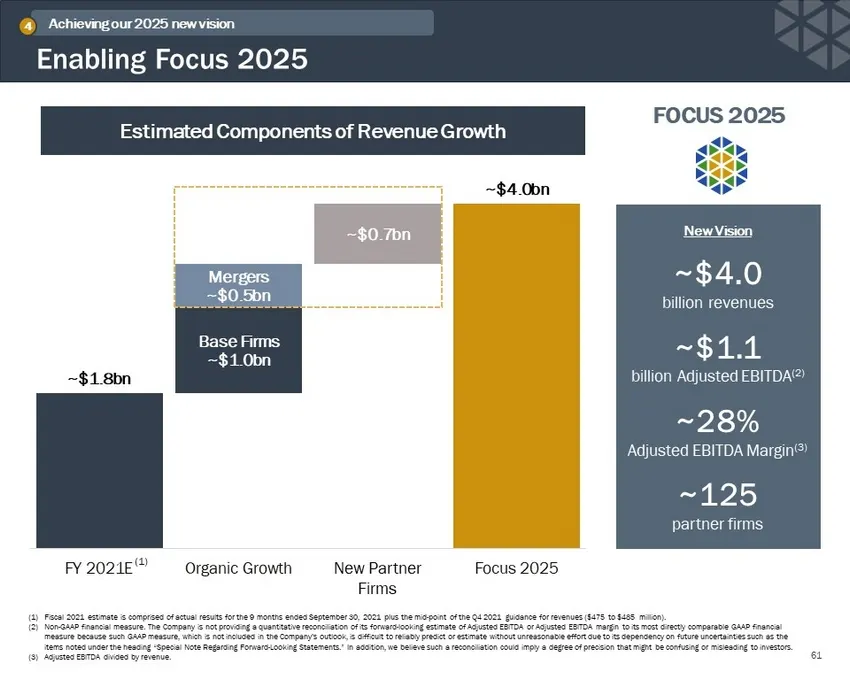
Base Firms ~ $1.0bn ~ $0.7bn Mergers ~ $0.5bn ~ $1.8bn ~ $4.0bn FY 2021E Organic Growth Acquisitions Focus 2025 (1) Fiscal 2021 estimate is comprised of actual results for the 9 months ended September 30, 2021 plus the mid - point of the Q4 2 021 guidance for revenues ($475 to $485 million). (2) Non
Slide 62: How do we get there?
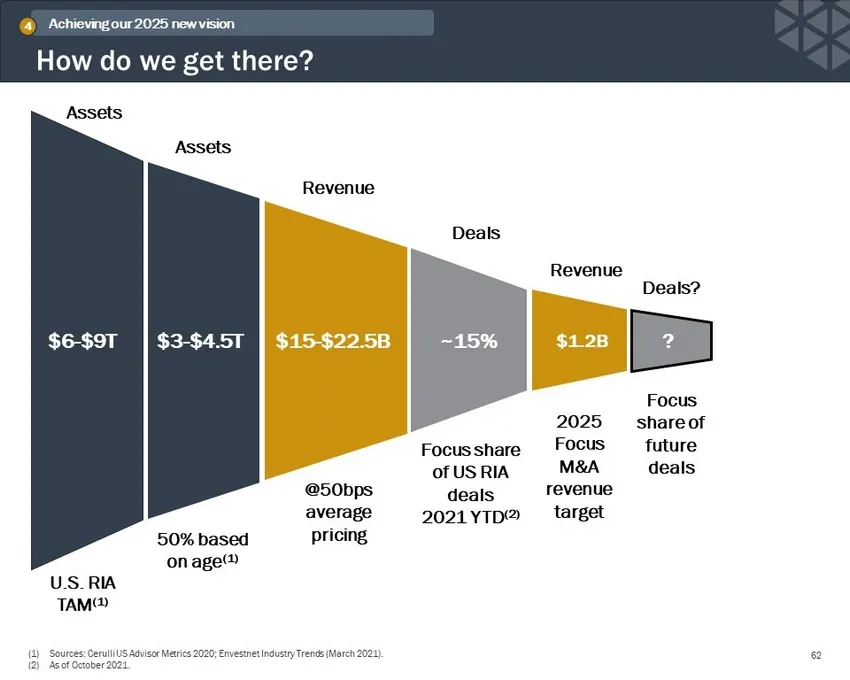
How do we get there? 62 Achieving our 2025 new vision 4 $3 - $4.5T $6 - $9T U.S. RIA TAM (1) 50% based on age (1) @50bps average pricing Focus share of US RIA deals 2021 YTD (2) Focus share of future deals 2025 Focus M&A revenue target $15 - $22.5B ~15% $1.2B ? Assets Assets Revenue Deals Deals? Rev
Slide 63: How do we get there?
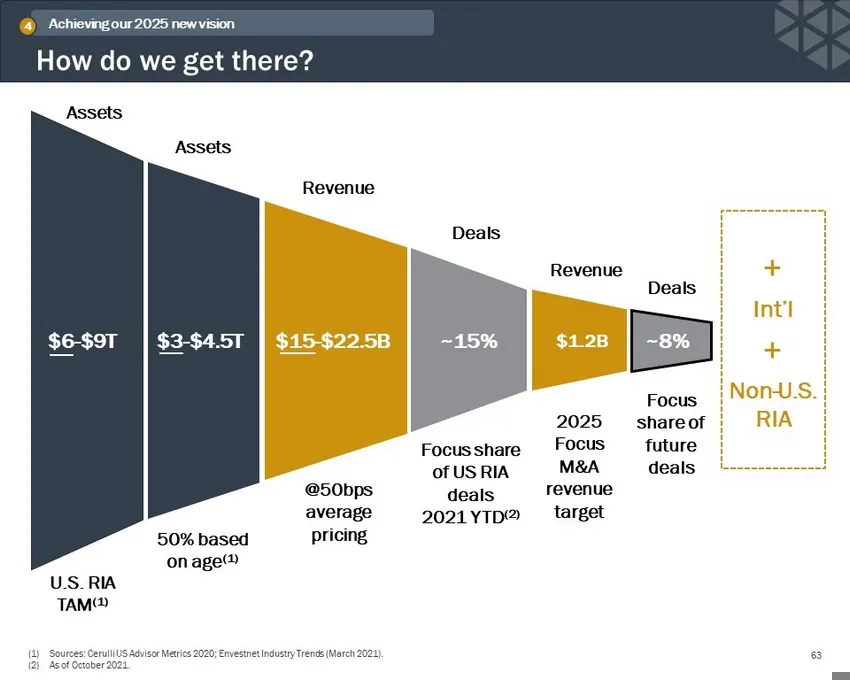
How do we get there? 63 $3 - $4.5T $6 - $9T + Int’l + Non - U.S. RIA Achieving our 2025 new vision 4 U.S. RIA TAM (1) 50% based on age (1) @50bps average pricing Focus share of US RIA deals 2021 YTD (2) Focus share of future deals 2025 Focus M&A revenue target $15 - $22.5B ~15% $1.2B ~8% Assets Asse

Slide 64: Value-added Services: A Growth Accelerator
Value - added Services: A Growth Accelerator Lenny Chang | Co - Founder, Senior Managing Director & Head of M&A
Slide 65: Our bold new vision for 2025
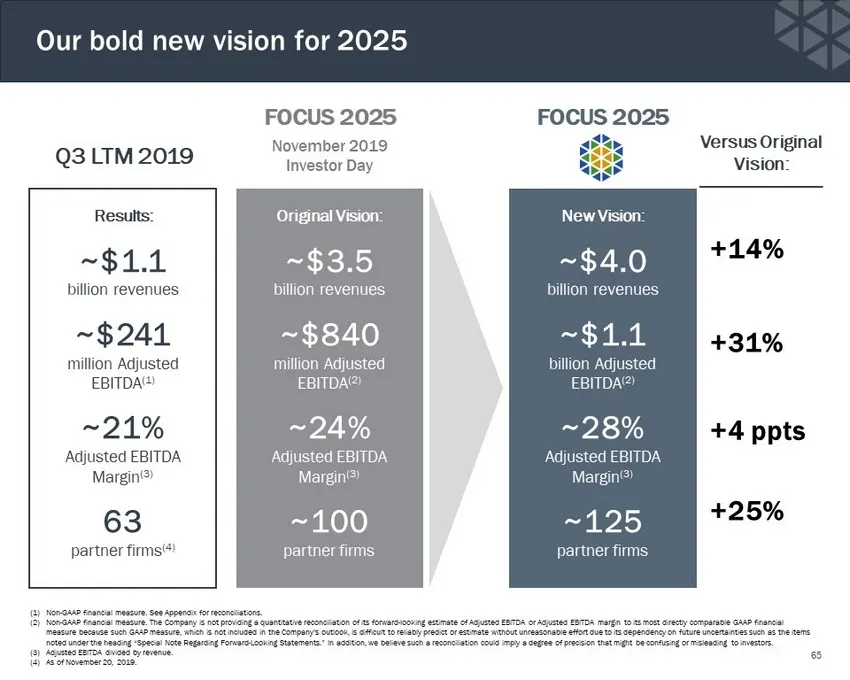
Our bold new vision for 2025 65 (1) Non - GAAP financial measure. See Appendix for reconciliations. (2) Non - GAAP financial measure. The Company is not providing a quantitative reconciliation of its forward - looking estimate of Adjust ed EBITDA or Adjusted EBITDA margin to its most directly compar
Slide 66: Driving growth through differentiated value-added services
1 2 3 Why our value - added services matter What we offer How we execute 4 Looking ahead Driving growth through differentiated value - added services
Slide 67: We have a partnership at scale
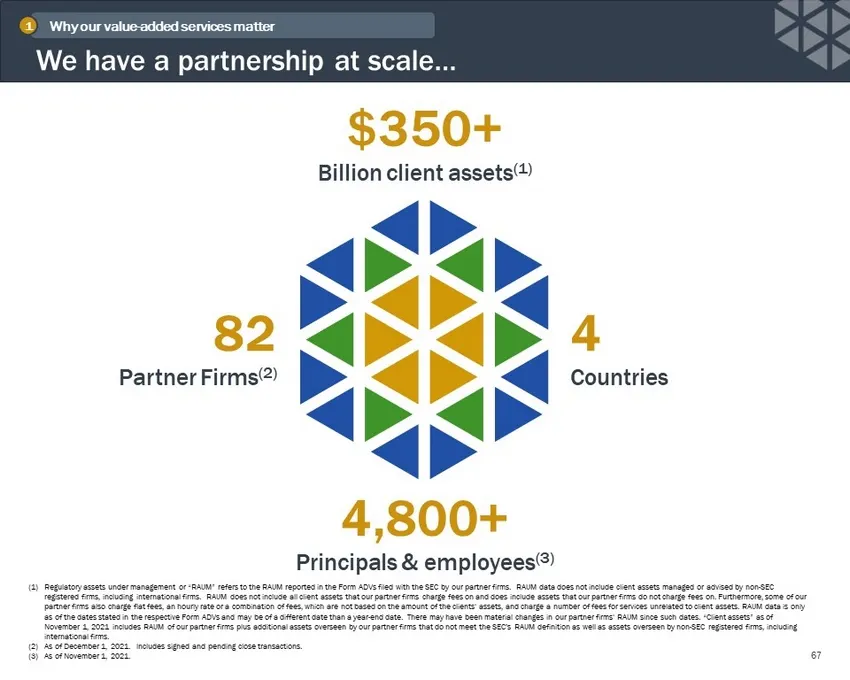
We have a partnership at scale… 67 $ 350+ Billion client assets (1) 82 Partner Firms (2) 4,800+ Principals & employees (3) 4 Countries (1) Regulatory assets under management or “RAUM” refers to the RAUM reported in the Form ADVs filed with the SEC by our partner firms. RAUM data does not include cli
Slide 68: Highly diversified, creating unique advantages
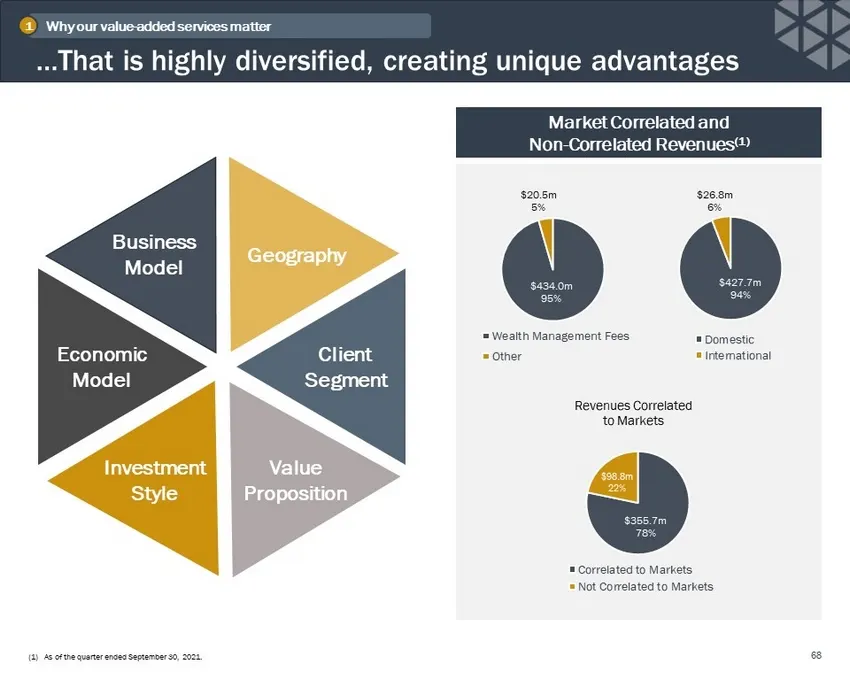
…That is highly diversified, creating unique advantages 68 $434.0m 95% $20.5m 5% Wealth Management Fees Other $355.7m 78% $98.8m 22% Revenues Correlated to Markets Correlated to Markets Not Correlated to Markets (1) As of the quarter ended September 30, 2021. Why our value - added services matter 1
Slide 69: Trust is a major factor in working with an advisor
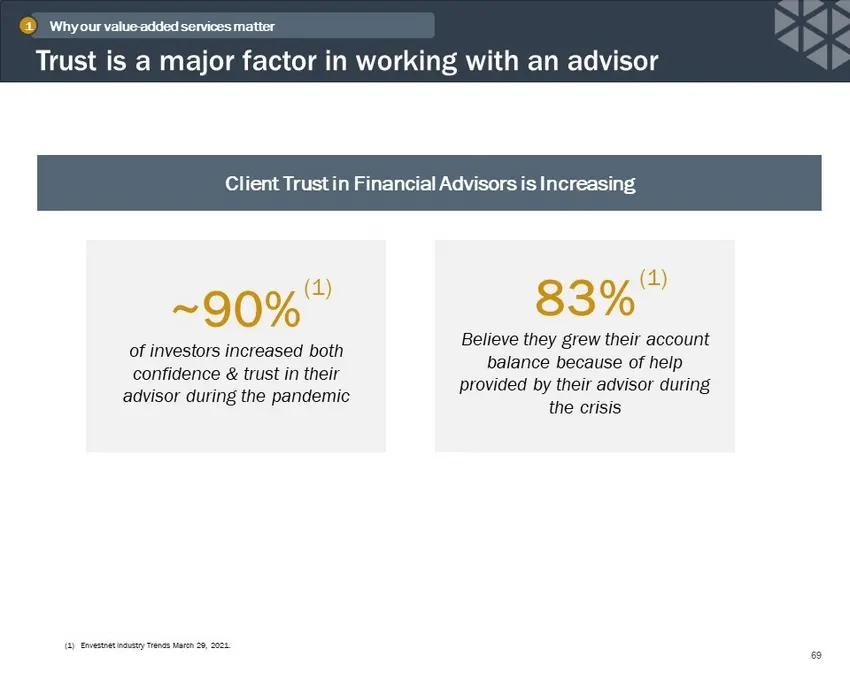
Trust is a major factor in working with an advisor 69 Why our value - added services matter 1 ~90% of investors increased both confidence & trust in their advisor during the pandemic 83% Believe they grew their account balance because of help provided by their advisor during the crisis Client Trust
Slide 70: Client priorities continue to evolve
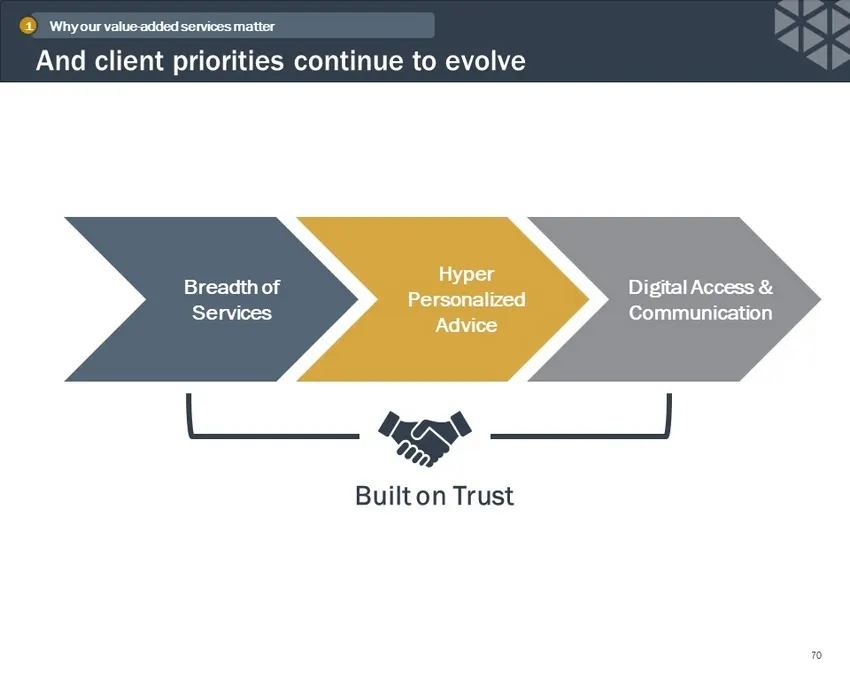
And client priorities continue to evolve 70 Breadth of Services Hyper Personalized Advice Digital Access & Communication Built on Trust Why our value - added services matter 1
Slide 71: RIAs can differentiate by offering more services
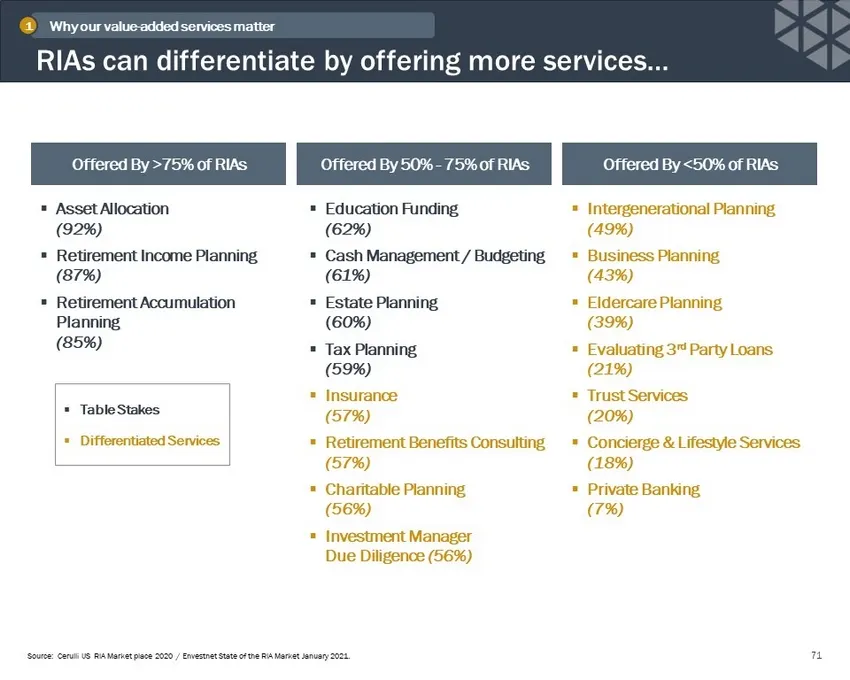
RIAs can differentiate by offering more services… 71 Source: Cerulli US RIA Market place 2020 / Envestnet State of the RIA Market January 2021. Offered By >75% of RIAs Offered By 50% - 75% of RIAs Offered By <50% of RIAs ▪ Asset Allocation (92%) ▪ Retirement Income Planning (87%) ▪ Retirement Accumu
Slide 72: Positioning to meet differing client needs
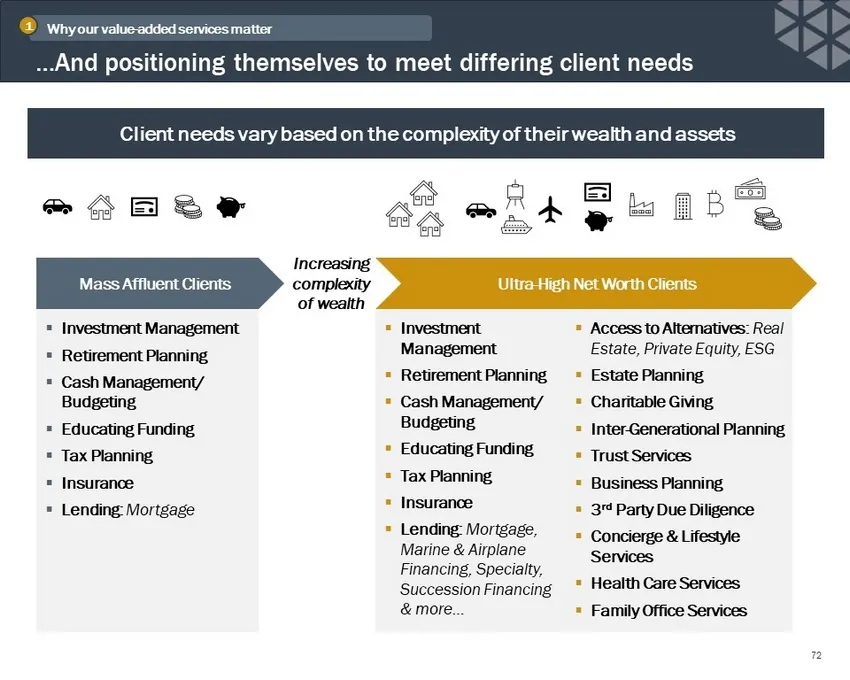
…And positioning themselves to meet differing client needs 72 ▪ Investment Management ▪ Retirement Planning ▪ Cash Management/ Budgeting ▪ Educating Funding ▪ Tax Planning ▪ Insurance ▪ Lending: Mortgage ▪ Investment Management ▪ Retirement Planning ▪ Cash Management/ Budgeting ▪ Educating Funding ▪
Slide 73: RIAs also need to upgrade their business practices
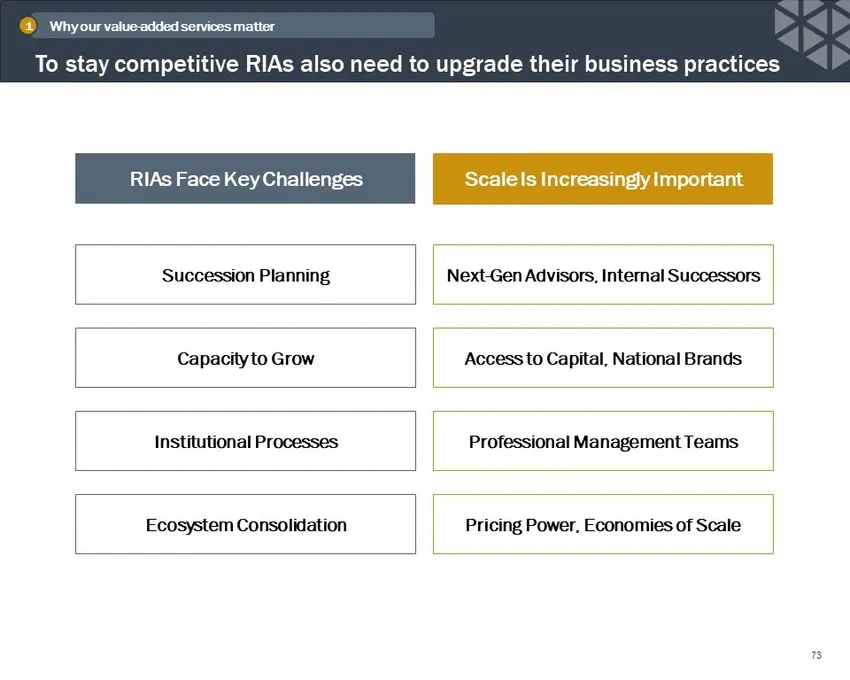
To stay competitive RIAs also need to upgrade their business practices 73 RIAs Face Key Challenges Succession Planning Capacity to Grow Institutional Processes Ecosystem Consolidation Next - Gen Advisors, Internal Successors Access to Capital, National Brands Professional Management Teams Pricing Po
Slide 74: We enable our partner firms to meet those needs
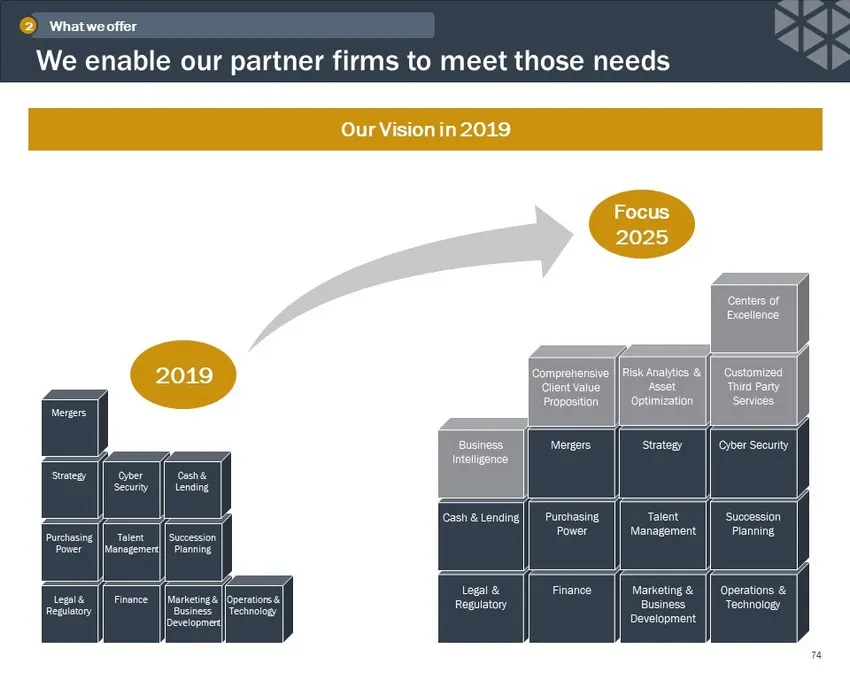
Legal & Regulatory Finance Marketing & Business Development Operations & Technology Purchasing Power Talent Management Succession Planning Strategy Cyber Security Mergers 2019 Legal & Regulatory Cash & Lending Finance Marketing & Business Development Operations & Technology Purchasing Power Talent M
Slide 75: We have exceeded our original plan for adding new services
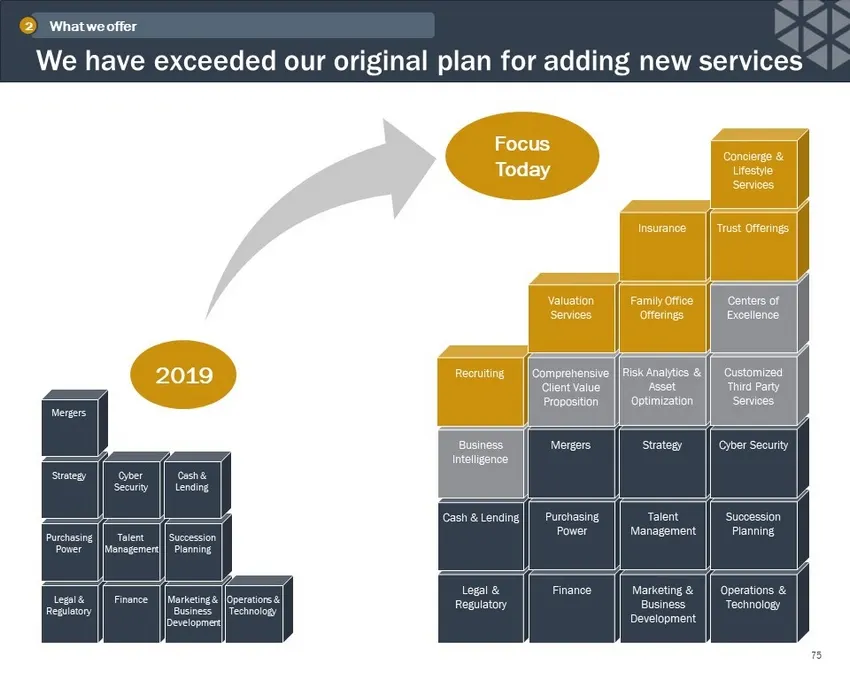
Legal & Regulatory Finance Marketing & Business Development Operations & Technology Purchasing Power Talent Management Succession Planning Strategy Cyber Security Mergers Legal & Regulatory Cash & Lending Finance Marketing & Business Development Operations & Technology Purchasing Power Talent Manage
Slide 76: A comprehensive array of solutions
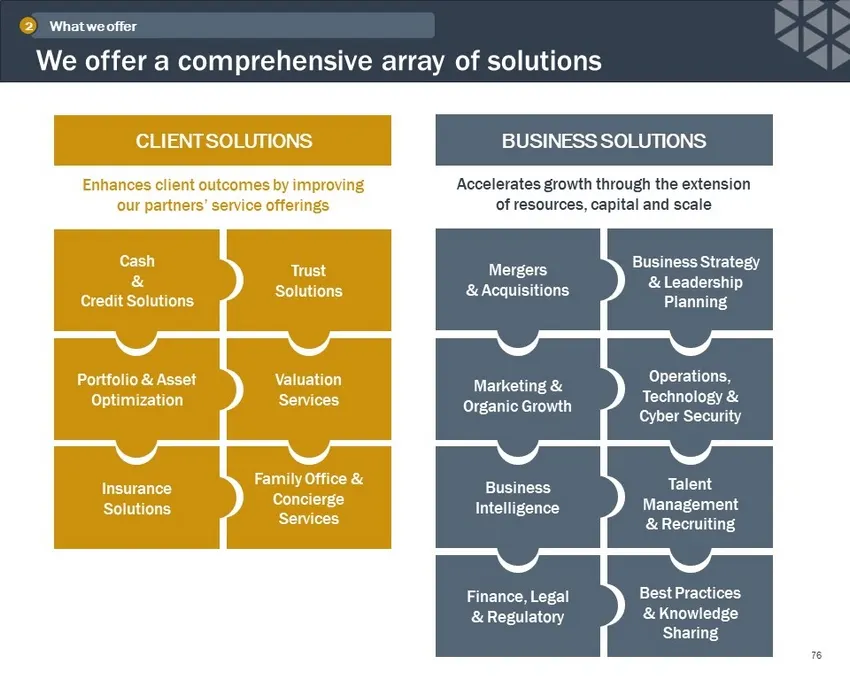
We offer a comprehensive array of solutions 76 Accelerates growth through the extension of resources, capital and scale Enhances client outcomes by improving our partners’ service offerings BUSINESS SOLUTIONS CLIENT SOLUTIONS Valuation Services Trust Solutions Family Office & Concierge Services Insu
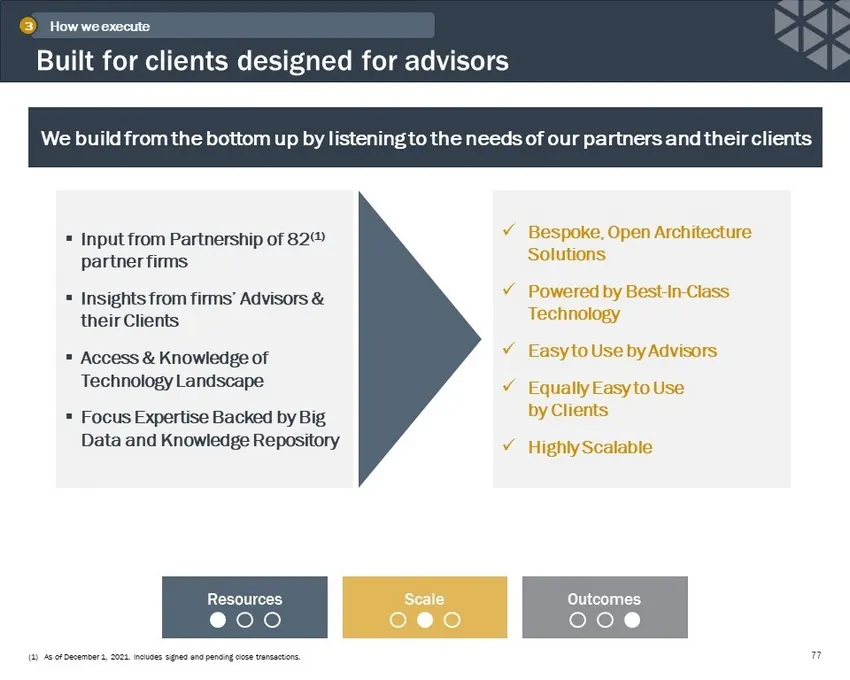
Slide 77: Built for clients designed for advisors
Built for clients designed for advisors 77 ▪ Input from Partnership of 82 (1) partner firms ▪ Insights from firms’ Advisors & their Clients ▪ Access & Knowledge of Technology Landscape ▪ Focus Expertise Backed by Big Data and Knowledge Repository x Bespoke, Open Architecture Solutions x Powered by B
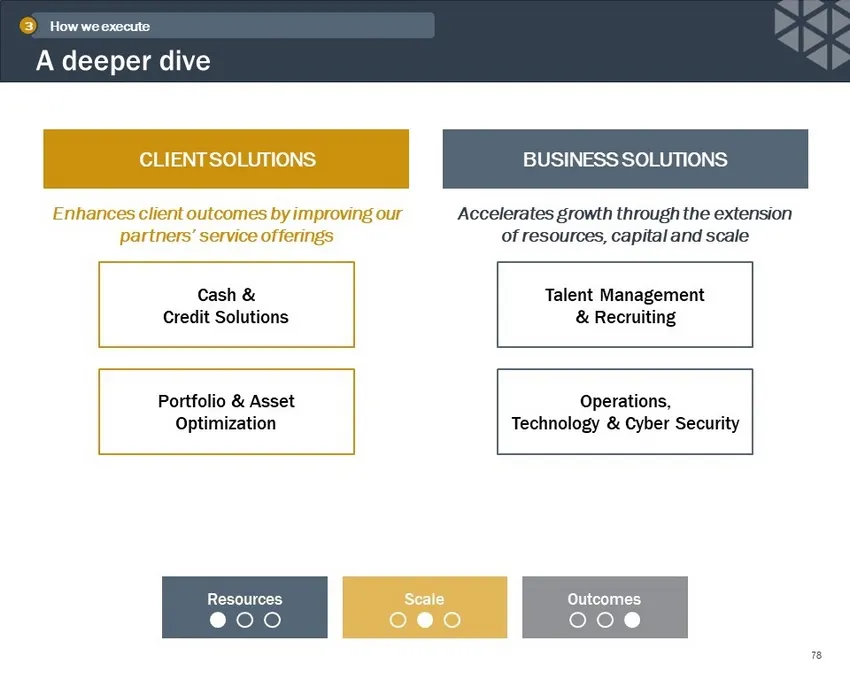
Slide 78: A deeper dive
A deeper dive 78 Talent Management & Recruiting Cash & Credit Solutions Accelerates growth through the extension of resources, capital and scale Enhances client outcomes by improving our partners’ service offerings Operations, Technology & Cyber Security Portfolio & Asset Optimization CLIENT SOLUTIO
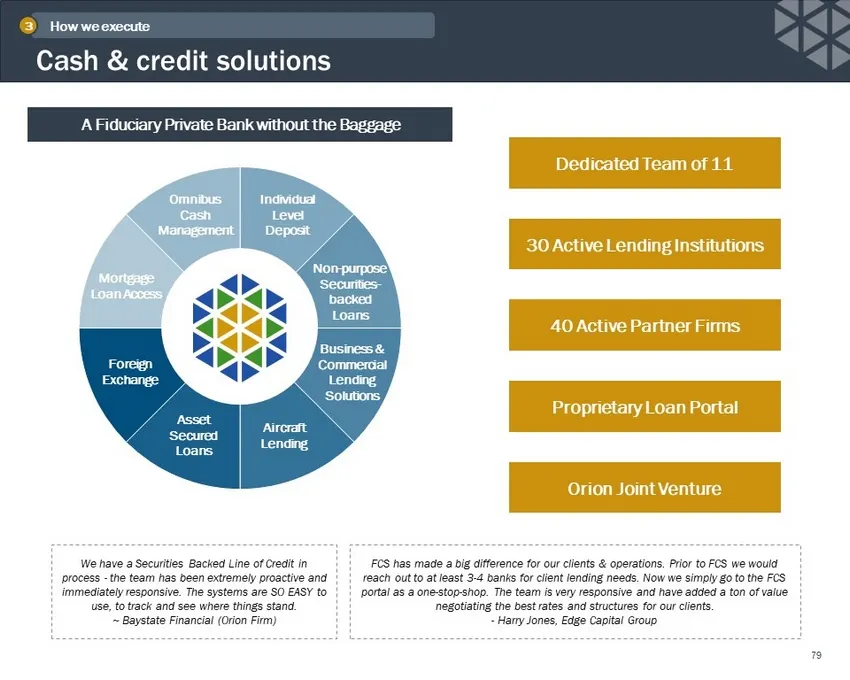
Slide 79: Cash & credit solutions
We have a Securities Backed Line of Credit in process - the team has been extremely proactive and immediately responsive. The systems are SO EASY to use, to track and see where things stand. ~ Baystate Financial (Orion Firm) FCS has made a big difference for our clients & operations. Prior to FCS we
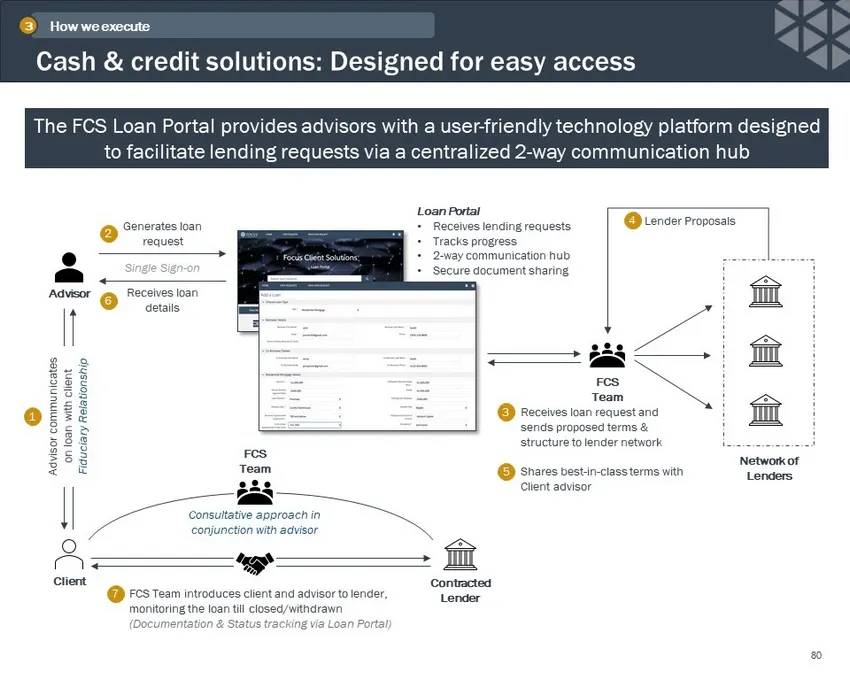
Slide 80: FCS Loan Portal: designed for easy access
The FCS Loan Portal provides advisors with a user - friendly technology platform designed to facilitate lending requests via a centralized 2 - way communication hub Generates loan request Advisor Loan Portal • Receives lending requests • Tracks progress • 2 - way communication hub • Secure document
Slide 81: Portfolio & asset optimization
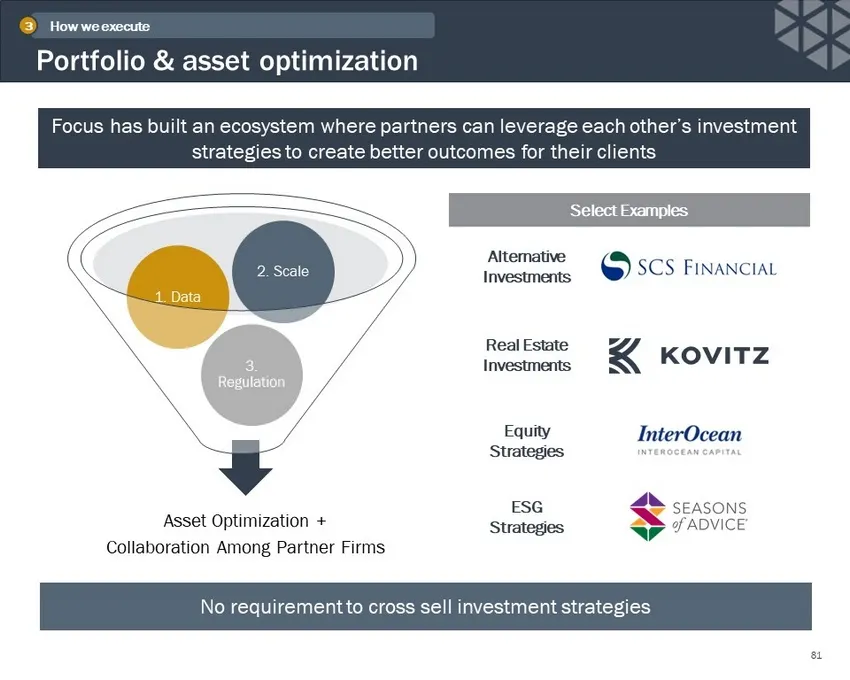
Portfolio & asset optimization 81 No requirement to cross sell investment strategies Focus has built an ecosystem where partners can leverage each other’s investment strategies to create better outcomes for their clients Select Examples Alternative Investments Real Estate Investments ESG Strategies
Slide 82: Case study: access to alternative investments
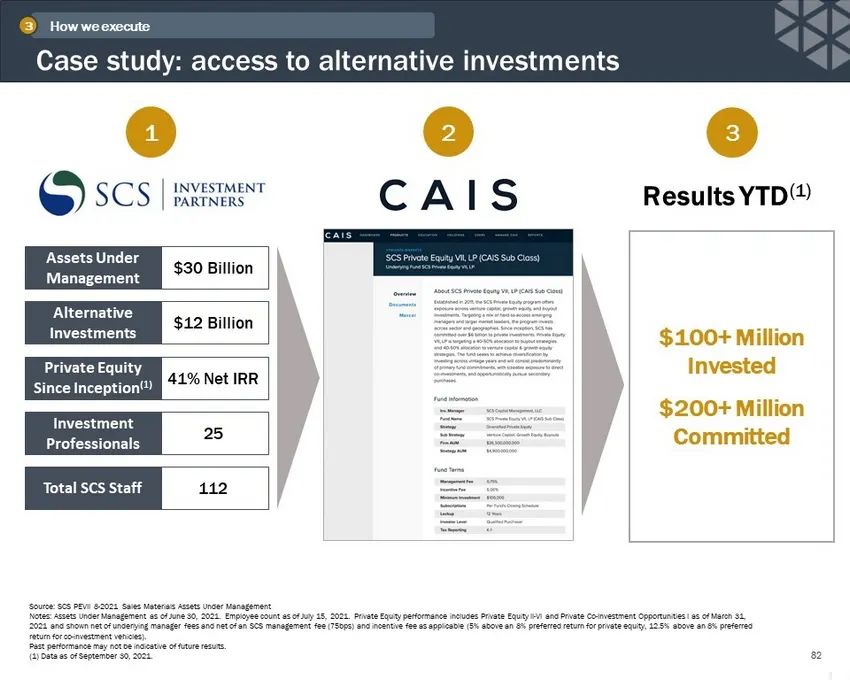
Case study: access to alternative investments 82 $100+ Million Invested $200 + Million Committed Results YTD (1) Source: SCS PEVII 8 - 2021 Sales Materials Assets Under Management Notes: Assets Under Management as of June 30, 2021. Employee count as of July 15, 2021. Private Equity performance inclu
Slide 83: Talent management & recruiting: more important than ever
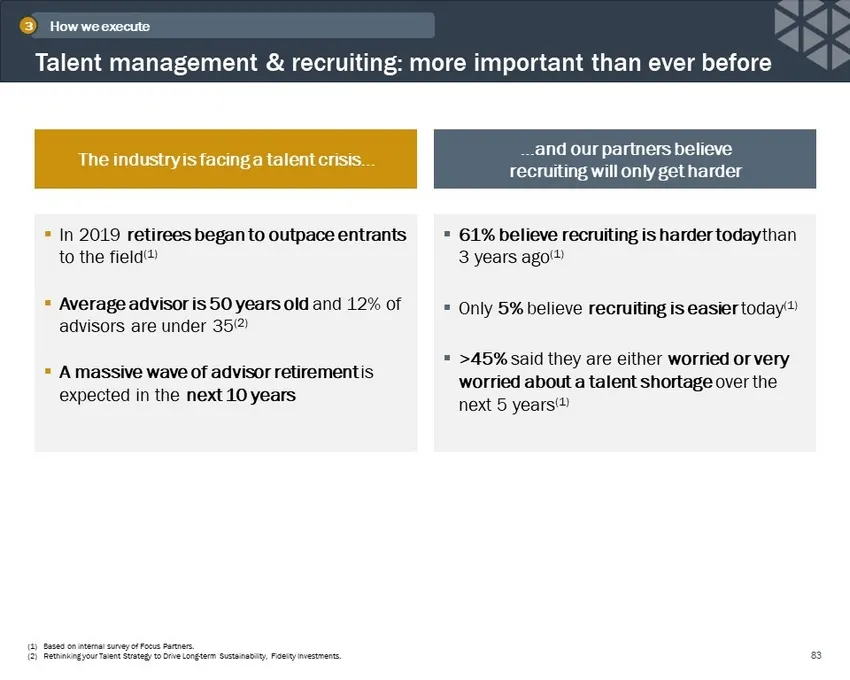
▪ In 2019 retirees began to outpace entrants to the field (1) ▪ Average advisor is 50 years old and 12% of advisors are under 35 (2) ▪ A massive wave of advisor retirement is expected in the next 10 years (1) Based on internal survey of Focus Partners. (2) Rethinking your Talent Strategy to Drive Lo
Slide 84: Recruiting support & resources
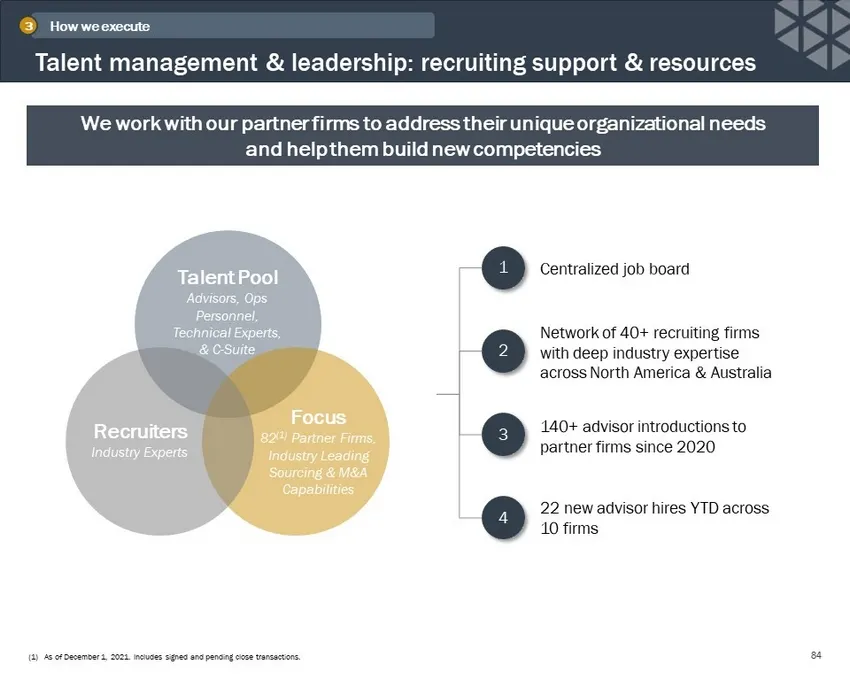
We work with our partner firms to address their unique organizational needs and help them build new competencies 1 2 3 4 Centralized job board Network of 40+ recruiting firms with deep industry expertise across North America & Australia 140+ advisor introductions to partner firms since 2020 22 new a
Slide 85: Best practices & knowledge sharing
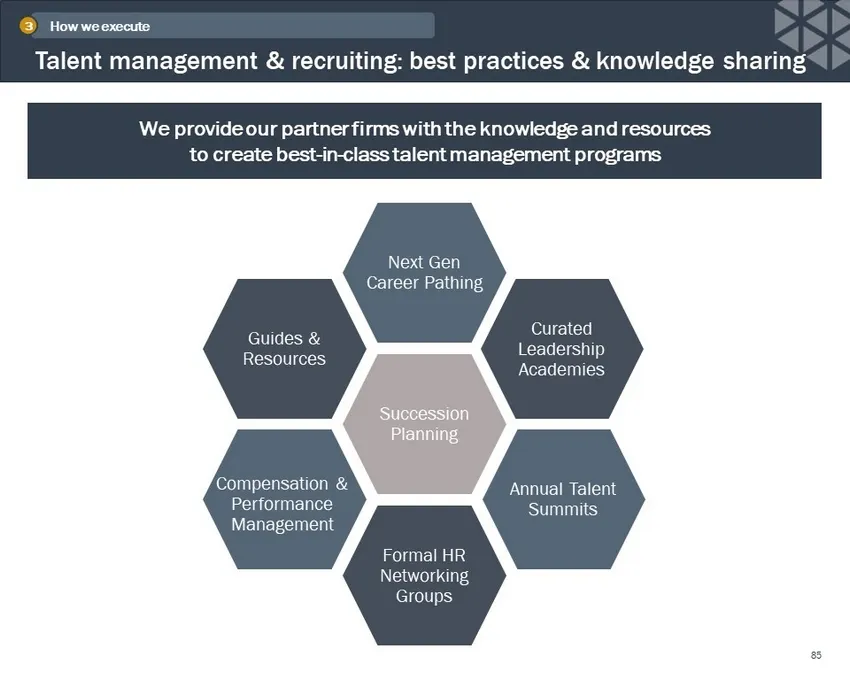
We provide our partner firms with the knowledge and resources to create best - in - class talent management programs Talent management & recruiting: best practices & knowledge sharing 85 How we execute 3 Guides & Resources Compensation & Performance Management Succession Planning Curated Leadership
Slide 86: Three key ingredients of digital enablement
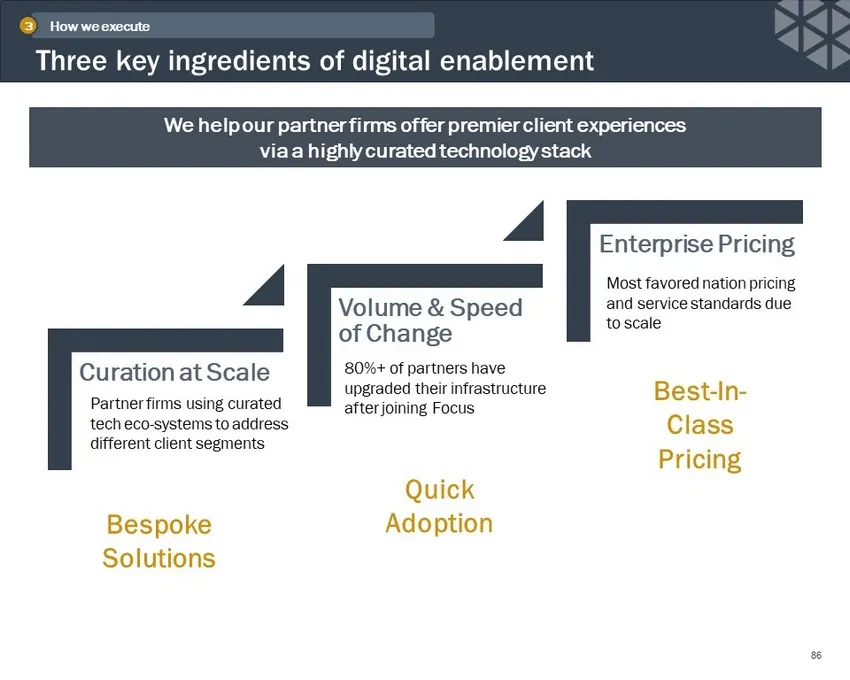
Three key ingredients of digital enablement 86 Curation at Scale Volume & Speed of Change Enterprise Pricing We help our partner firms offer premier client experiences via a highly curated technology stack Bespoke Solutions Quick Adoption Best - In - Class Pricing Partner firms using curated tech ec
Slide 87: Building a highly curated & scalable wealth tech stack
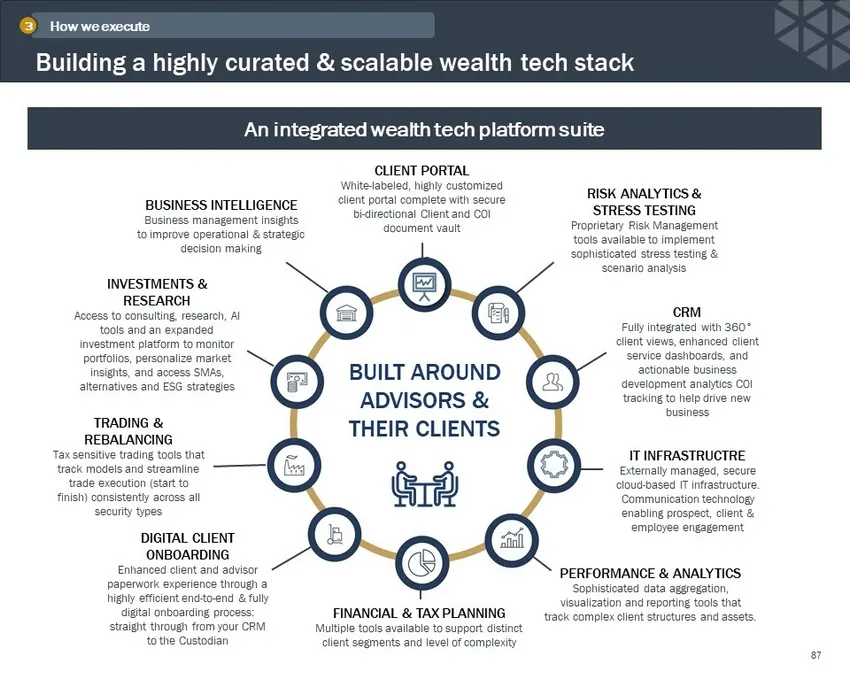
Building a highly curated & scalable wealth tech stack 87 BUILT AROUND ADVISORS & THEIR CLIENTS RISK ANALYTICS & STRESS TESTING Proprietary Risk Management tools available to implement sophisticated stress testing & scenario analysis CRM Fully integrated with 360 ° client views, enhanced client serv
Slide 88: Holistic approach to cyber security
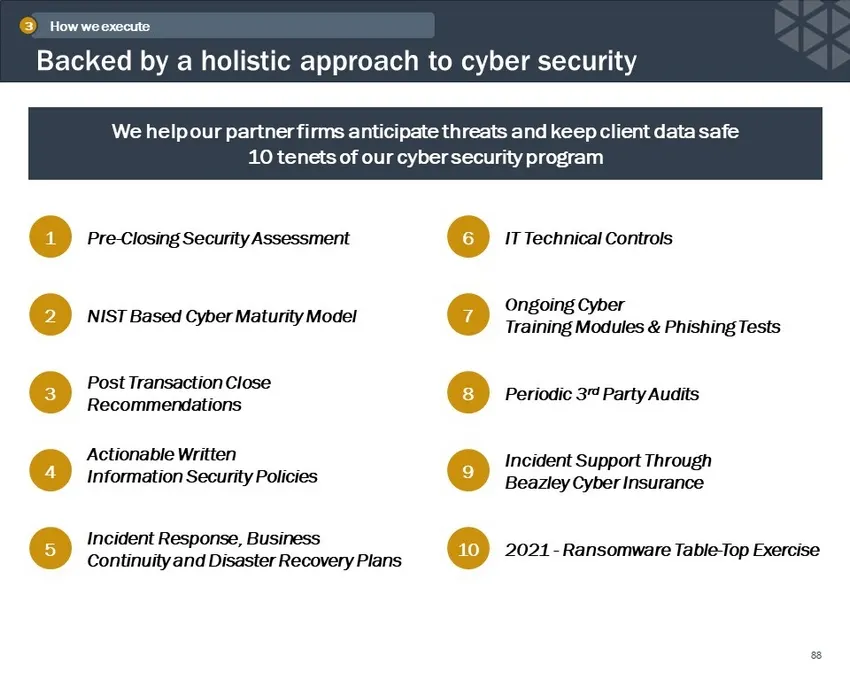
NIST Based Cyber Maturity Model Post Transaction Close Recommendations Incident Support Through Beazley Cyber Insurance Ongoing Cyber Training Modules & Phishing Tests Actionable Written Information Security Policies Incident Response, Business Continuity and Disaster Recovery Plans Periodic 3 rd Pa
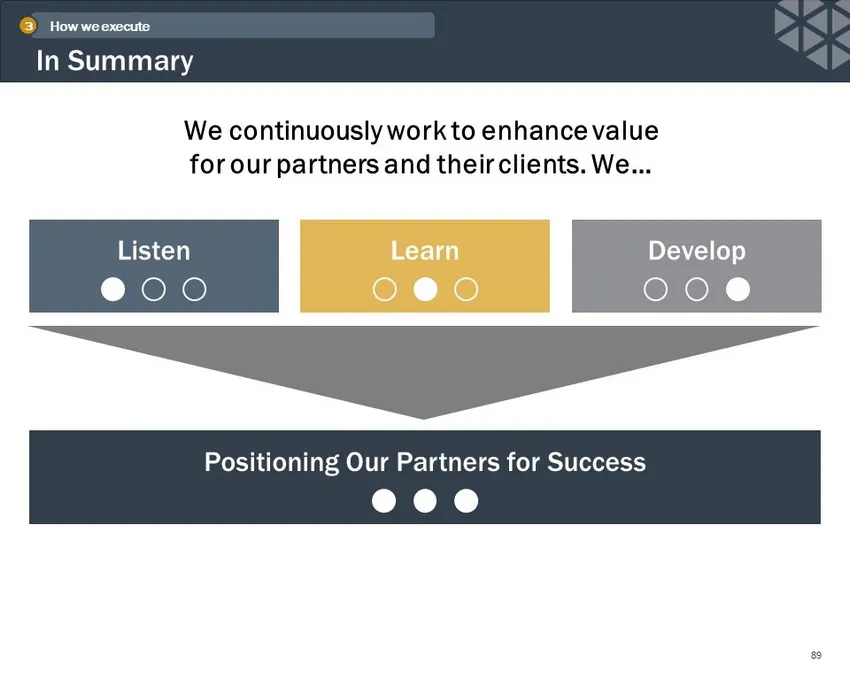
Slide 89: In Summary: Positioning Our Partners for Success
In Summary 89 Positioning Our Partners for Success We continuously work to enhance value for our partners and their clients. We… Listen Learn Develop How we execute 3
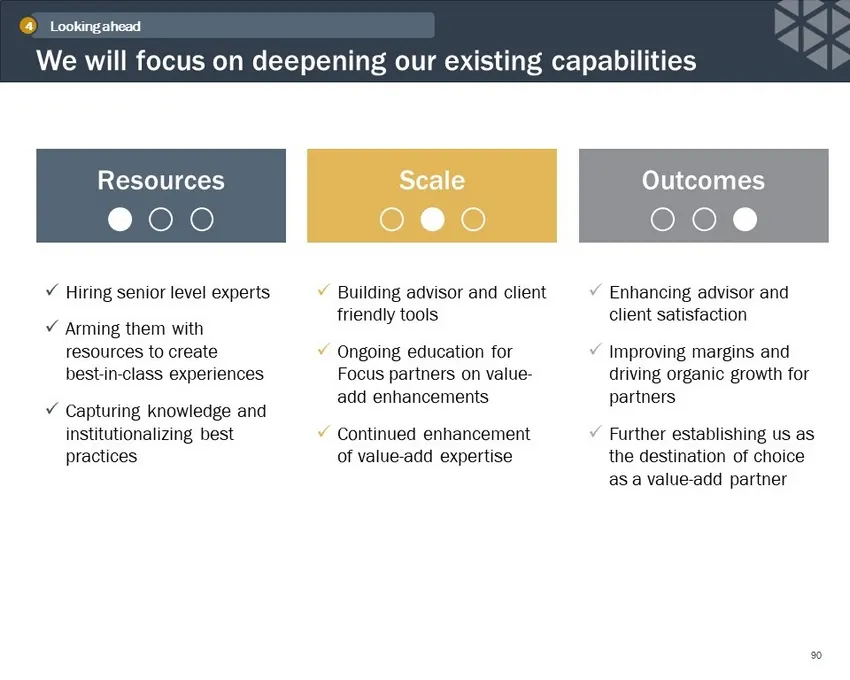
Slide 90: We will focus on deepening our existing capabilities
x Hiring senior level experts x Arming them with resources to create best - in - class experiences x Capturing knowledge and institutionalizing best practices x Building advisor and client friendly tools x Ongoing education for Focus partners on value - add enhancements x Continued enhancement of va
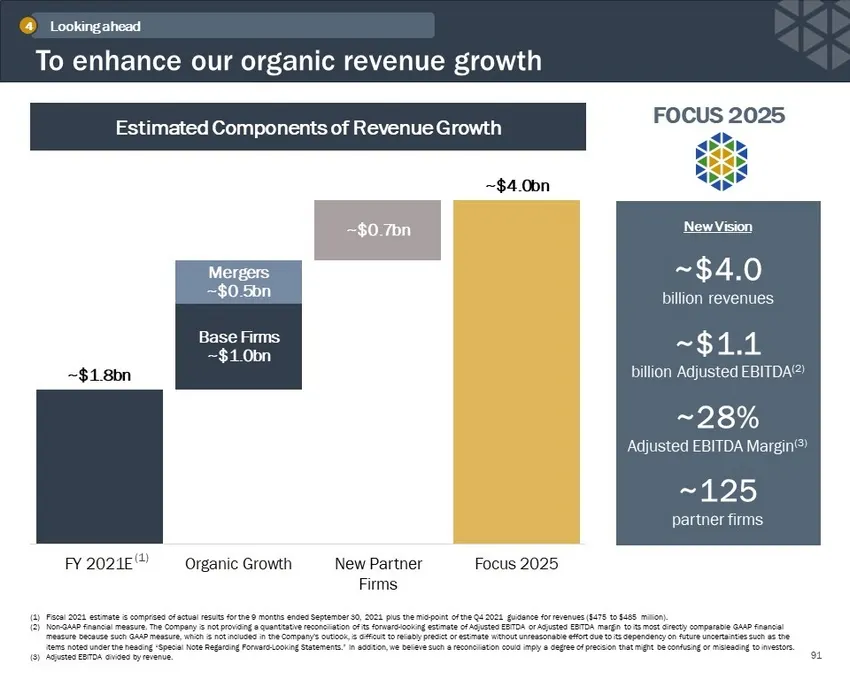
Slide 91: To enhance our organic revenue growth
To enhance our organic revenue growth 91 Looking ahead 4 (1) Fiscal 2021 estimate is comprised of actual results for the 9 months ended September 30, 2021 plus the mid - point of the Q4 2021 guidance for revenues ($475 to $485 million). (2) Non - GAAP financial measure. The Company is not providing

Slide 92: Appendix
Appendix
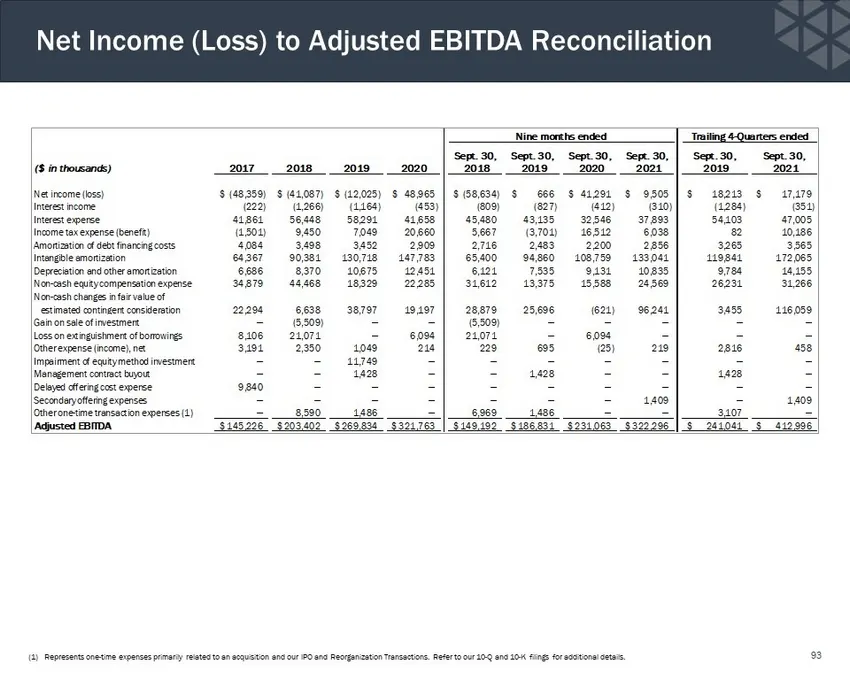
Slide 93: Net Income (Loss) to Adjusted EBITDA Reconciliation
Net Income (Loss) to Adjusted EBITDA Reconciliation (1) Represents one - time expenses primarily related to an acquisition and our IPO and Reorganization Transactions. Refer to our 1 0 - Q and 10 - K filings for additional details. 93 ($ in thousands) 2017 2018 2019 2020 Sept. 30, 2018 Sept. 30, 201
Slide 94: Net Income to Adjusted EBITDA Reconciliation
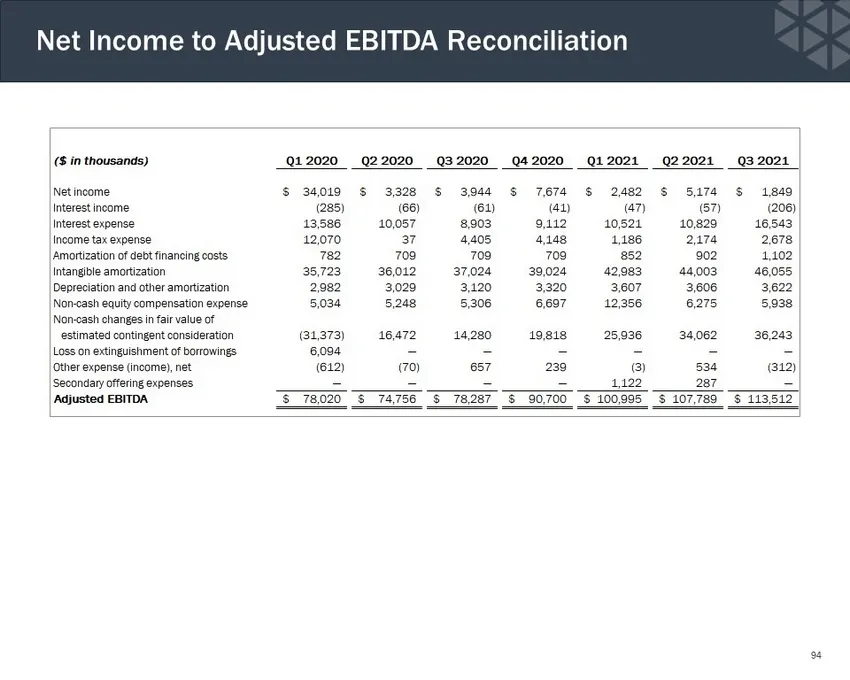
Net Income to Adjusted EBITDA Reconciliation 94 ($ in thousands) Q1 2020 Q2 2020 Q3 2020 Q4 2020 Q1 2021 Q2 2021 Q3 2021 Net income 34,019$ 3,328$ 3,944$ 7,674$ 2,482$ 5,174$ 1,849$ Interest income (285) (66) (61) (41) (47) (57) (206) Interest expense 13,586 10,057 8,903 9,112 10,521 10,829 16,543 I
Slide 95: Net Income to Adjusted Net Income Excluding Tax Adjustments
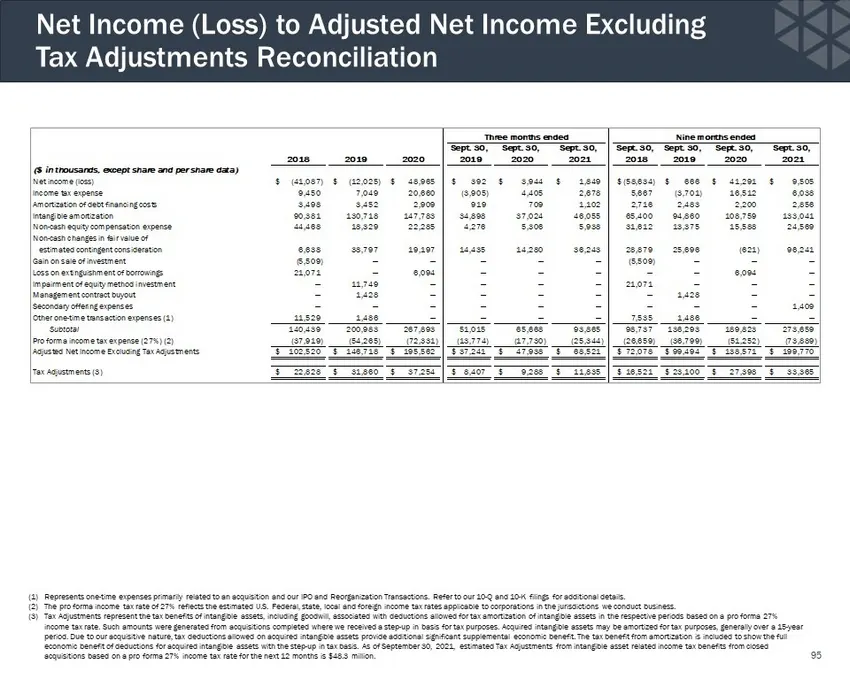
Net Income (Loss) to Adjusted Net Income Excluding Tax Adjustments Reconciliation 95 2018 2019 2020 Sept. 30, 2019 Sept. 30, 2020 Sept. 30, 2021 Sept. 30, 2018 Sept. 30, 2019 Sept. 30, 2020 Sept. 30, 2021 ($ in thousands, except share and per share data) Net income (loss) (41,087)$ (12,025)$ 48,965$
Slide 96: Adjusted Shares Outstanding Reconciliation
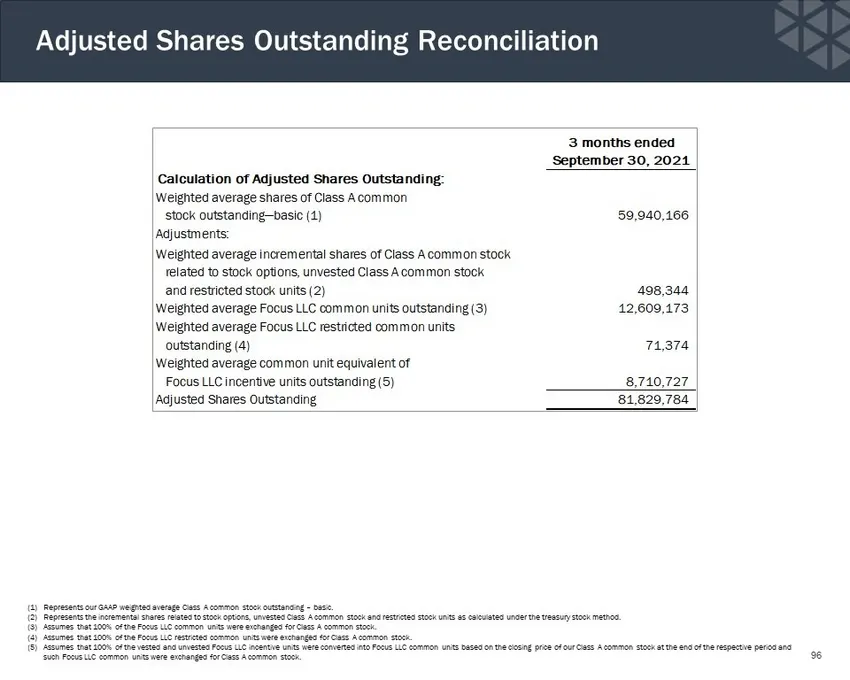
Adjusted Shares Outstanding Reconciliation 96 (1) Represents our GAAP weighted average Class A common stock outstanding – basic. (2) Represents the incremental shares related to stock options, unvested Class A common stock and restricted stock units as calc ulated under the treasury stock method. (3
Slide 97: Cash Flow Available for Capital Allocation Reconciliation
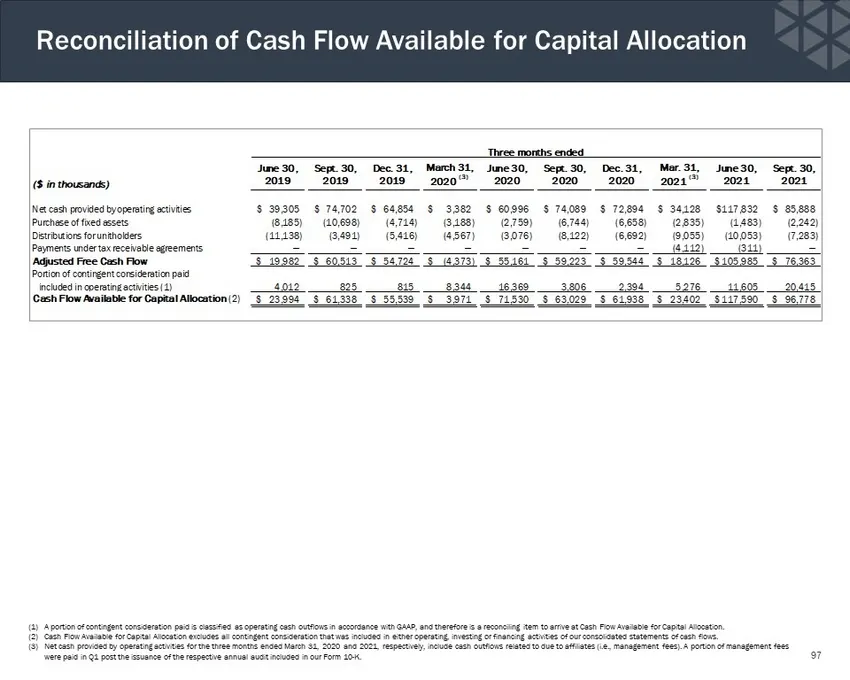
($ in thousands) June 30, 2019 Sept. 30, 2019 Dec. 31, 2019 March 31, 2020 (3) June 30, 2020 Sept. 30, 2020 Dec. 31, 2020 Mar. 31, 2021 (3) June 30, 2021 Sept. 30, 2021 Net cash provided by operating activities 39,305$ 74,702$ 64,854$ 3,382$ 60,996$ 74,089$ 72,894$ 34,128$ 117,832$ 85,888$ Purchase
Source: SEC EDGAR · 8-K filed Dec 9, 2021
More decks from Focus Financial Partners Inc
 Q1 2023 Earnings Presentation31 slides · May 4, 2023
 FY2022 Earnings Presentation39 slides · Feb 16, 2023
 Q3 2022 Earnings Presentation34 slides · Nov 3, 2022
 Q2 2022 Earnings Presentation33 slides · Aug 4, 2022
 Q1 2022 Earnings Presentation30 slides · May 5, 2022
 FY2021 Earnings Presentation42 slides · Feb 17, 2022