Dot Hill Systems — Rodman & Renshaw Annual Global Investment Conference 2013
39 slides from Dot Hill Systems's conference presentation, Sep 9, 2013

Slide 1: Driving Growth
DRIVING GROWTH NASDAQ: HILL September 9, 2013 Rodman & Renshaw Annual Global Investment Conference Dot Hill Systems Corp.
Slide 2: Safe Harbor
Safe Harbor September 9, 2013 NASDAQ HILL 2 Statements contained in this presentation regarding matters that are not historical facts are “forward-looking statements” within the meaning of the Private Securities Litigation Reform Act. Because such statements are subject to risks and uncertainties, a
Slide 3: Dot Hill Investment Highlights
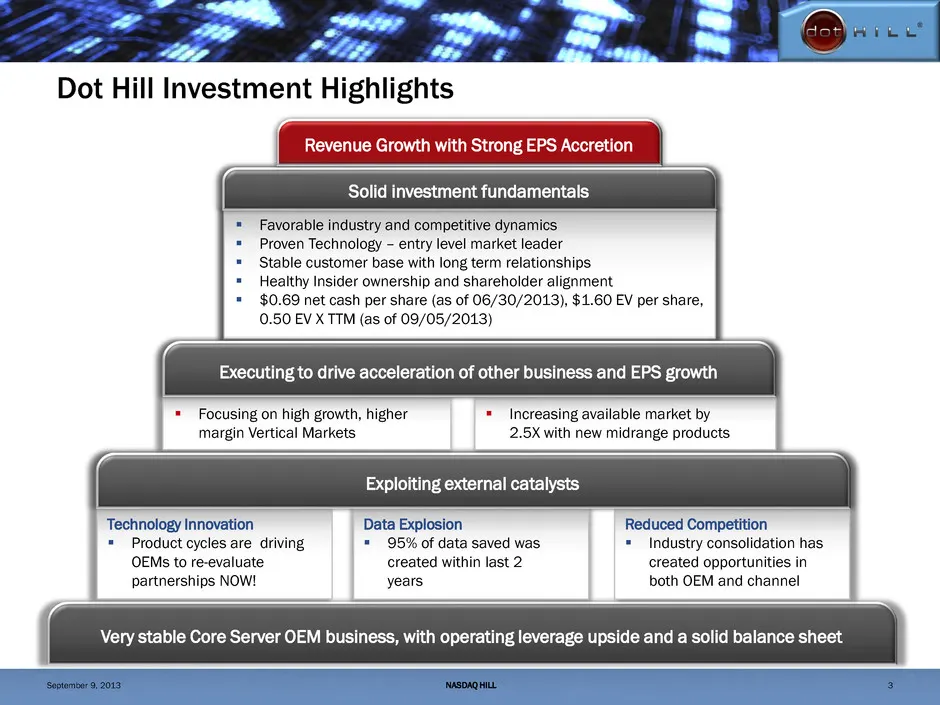
Dot Hill Investment Highlights Very stable Core Server OEM business, with operating leverage upside and a solid balance sheet Solid investment fundamentals Favorable industry and competitive dynamics Proven Technology – entry level market leader Stable customer base with long term relationship
Slide 4: Dot Hill: Providing Storage Solutions
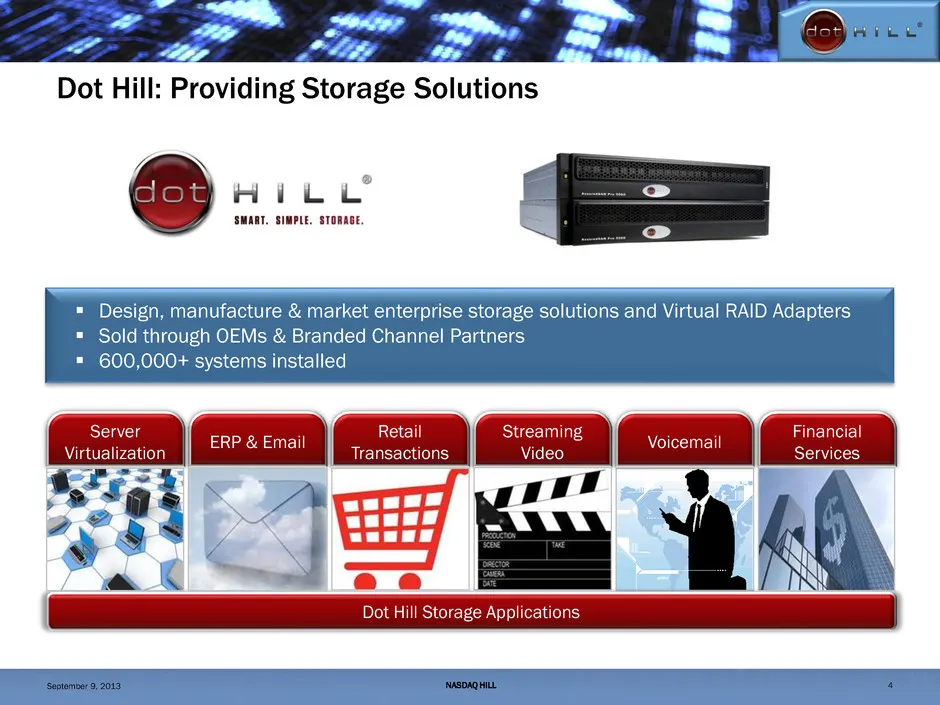
Dot Hill: Providing Storage Solutions Financial Services Streaming Video Retail Transactions ERP & Email Voicemail Dot Hill Storage Applications Server Virtualization Design, manufacture & market enterprise storage solutions and Virtual RAID Adapters Sold through OEMs & Branded Channel Partners
Slide 5: Dot Hill Routes to Market
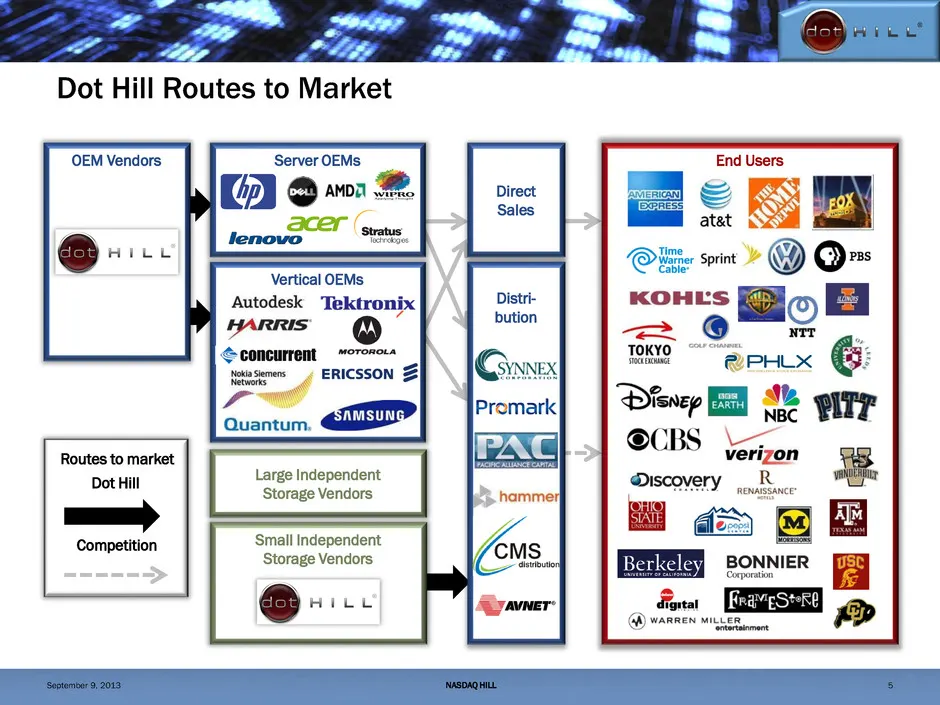
Dot Hill Routes to Market Small Independent Storage Vendors OEM Vendors Server OEMs Vertical OEMs Large Independent Storage Vendors Direct Sales End Users Distri- bution Routes to market Dot Hill Competition NASDAQ HILL 5 September 9, 2013
Slide 6: WW Storage Market 2011-2016
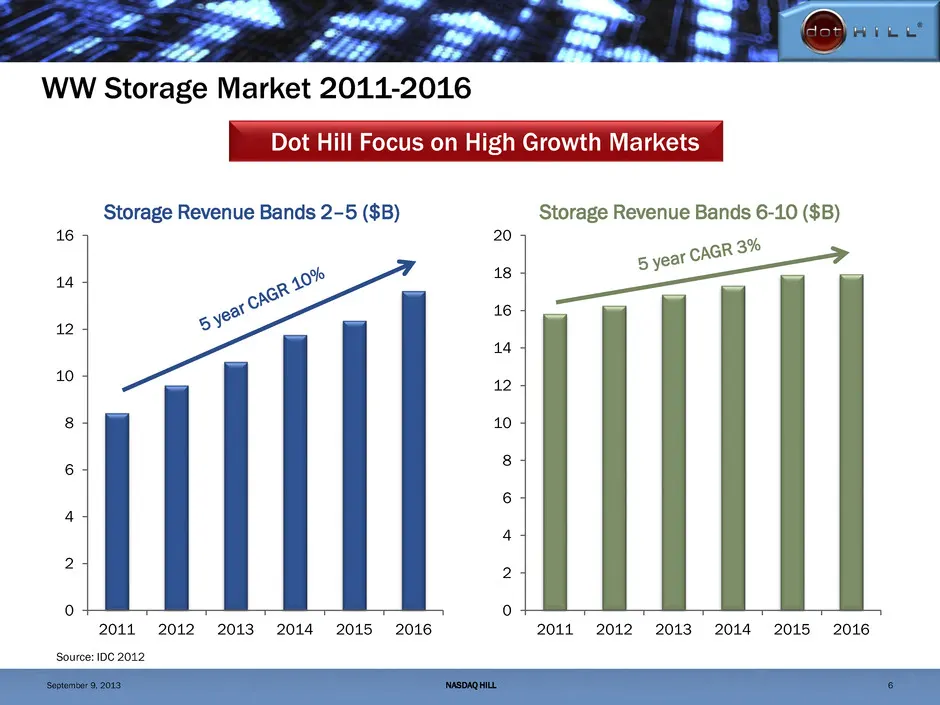
WW Storage Market 2011-2016 0 2 4 6 8 10 12 14 16 2011 2012 2013 2014 2015 2016 Source: IDC 2012 Storage Revenue Bands 2–5 ($B) 0 2 4 6 8 10 12 14 16 18 20 2011 2012 2013 2014 2015 2016 Storage Revenue Bands 6-10 ($B) NASDAQ HILL 6 Dot Hill Focus on High Growth Markets September 9, 2013
Slide 7: Dot Hill: Leader in the IP Landscape
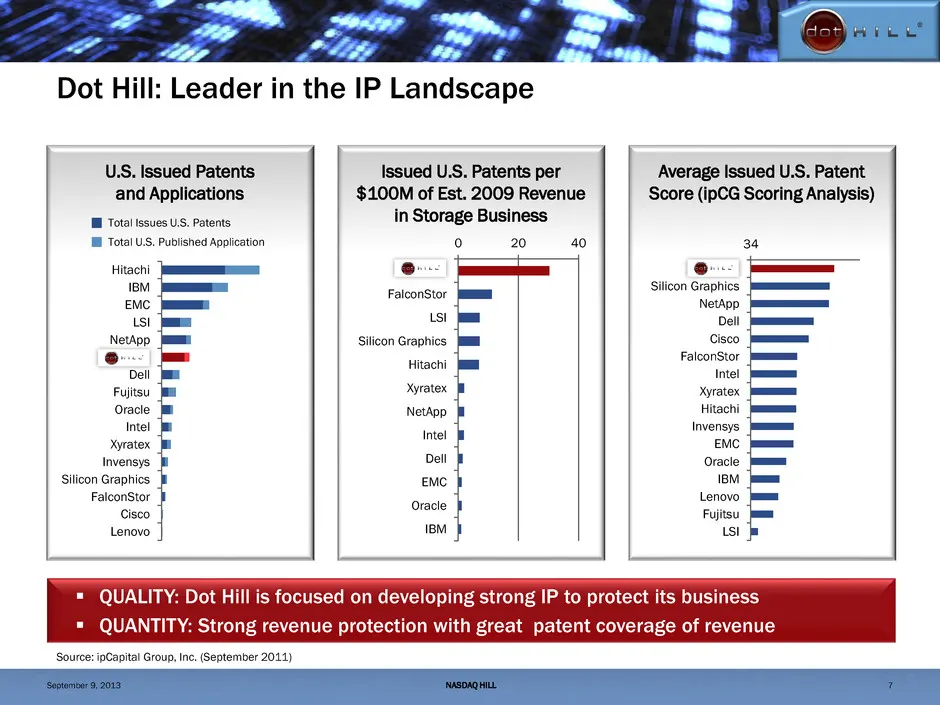
Dot Hill: Leader in the IP Landscape Source: ipCapital Group, Inc. (September 2011) QUALITY: Dot Hill is focused on developing strong IP to protect its business QUANTITY: Strong revenue protection with great patent coverage of revenue U.S. Issued Patents and Applications Issued U.S. Patents per
Slide 8: Dot Hill's Server OEM Foundation
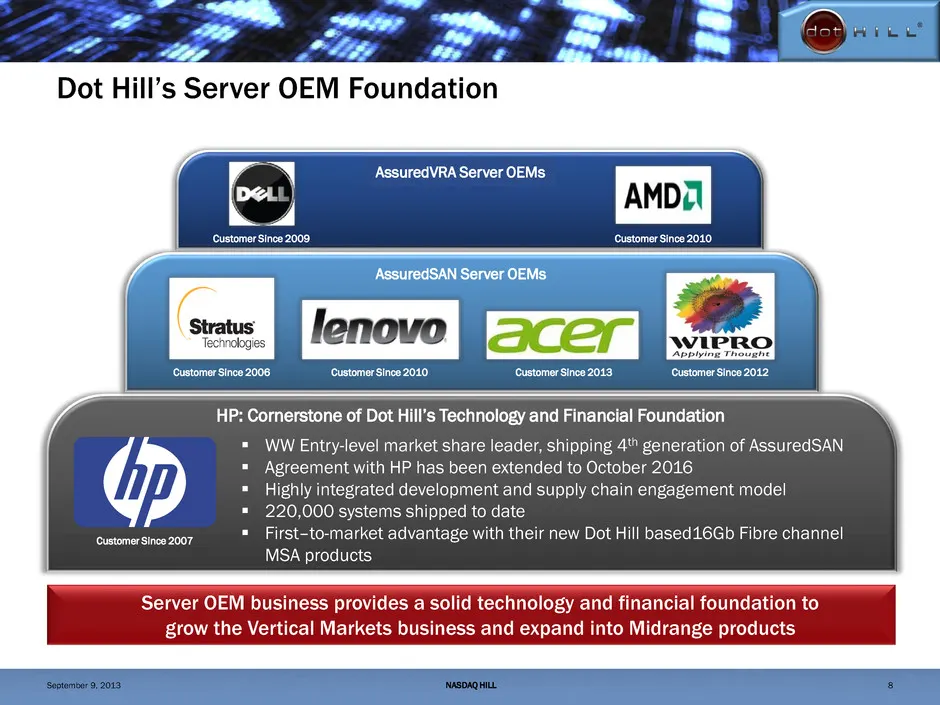
Dot Hill’s Server OEM Foundation AssuredVRA Server OEMs Customer Since 2009 Customer Since 2010 Server OEM business provides a solid technology and financial foundation to grow the Vertical Markets business and expand into Midrange products Customer Since 2007 HP: Cornerstone of Dot Hill’s Technolog
Slide 9: Look Back to 2010 / 2013 Strategic Initiatives
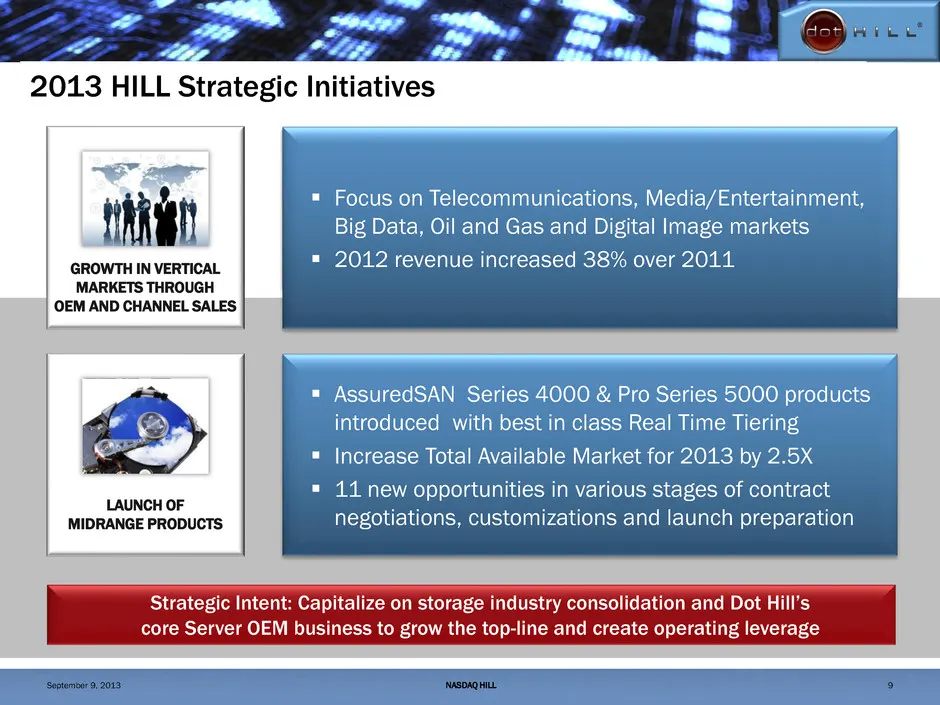
Look Back to 2010 HILL Strategic Initiatives CHANNELS SOFTWARE SYSTEMS Channels GOAL: Diversify revenues at higher margins Smoother revenue stream from more customers Add-on Professional Services Focus on Telecommunications, Media/Entertainment, Big Data, Oil and Gas and Digital Image markets
Slide 10: Vertical Markets Focus to Drive Growth
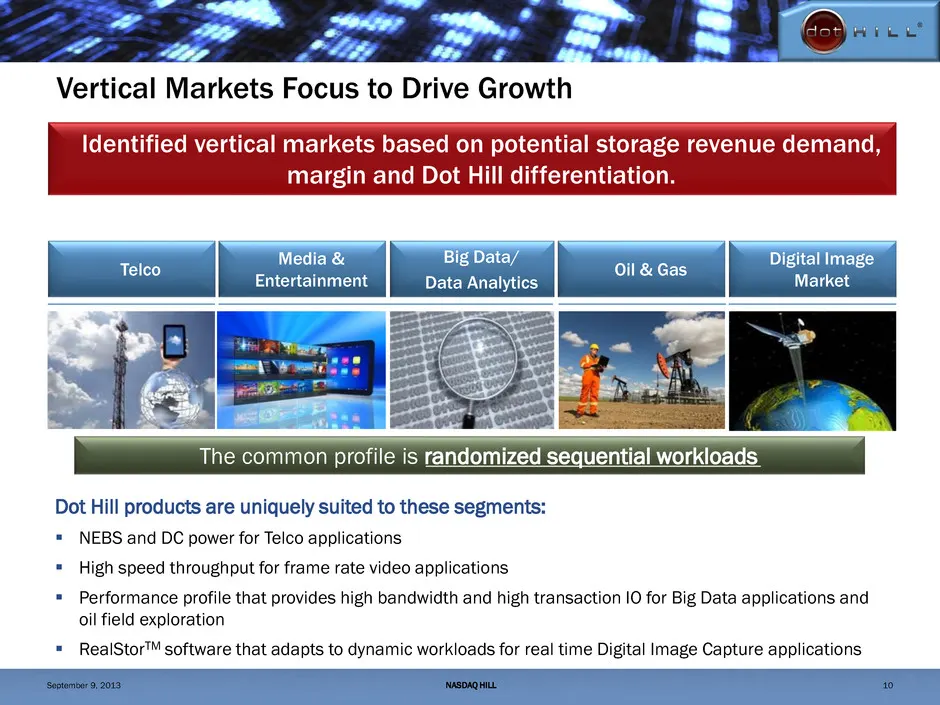
Identified vertical markets based on potential storage revenue demand, margin and Dot Hill differentiation. Vertical Markets Focus to Drive Growth Telco Media & Entertainment Big Data/ Data Analytics Oil & Gas Digital Image Market Dot Hill products are uniquely suited to these segments: NEBS and D
Slide 11: Strong Growth in Vertical Markets
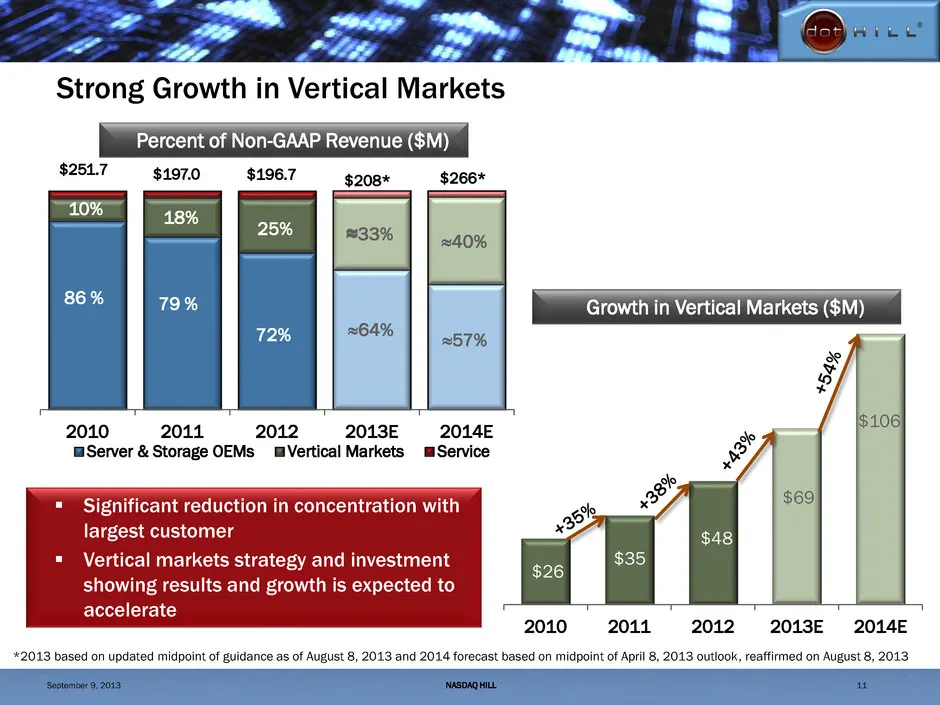
Strong Growth in Vertical Markets NASDAQ HILL 11 *2013 based on updated midpoint of guidance as of August 8, 2013 and 2014 forecast based on midpoint of April 8, 2013 outlook, reaffirmed on August 8, 2013 2010 2011 2012 2013E 2014E Server & Storage OEMs Vertical Markets Service 86 % 72% 79 % ≈64% ≈5
Slide 12: Midrange AssuredSAN Product Positioning
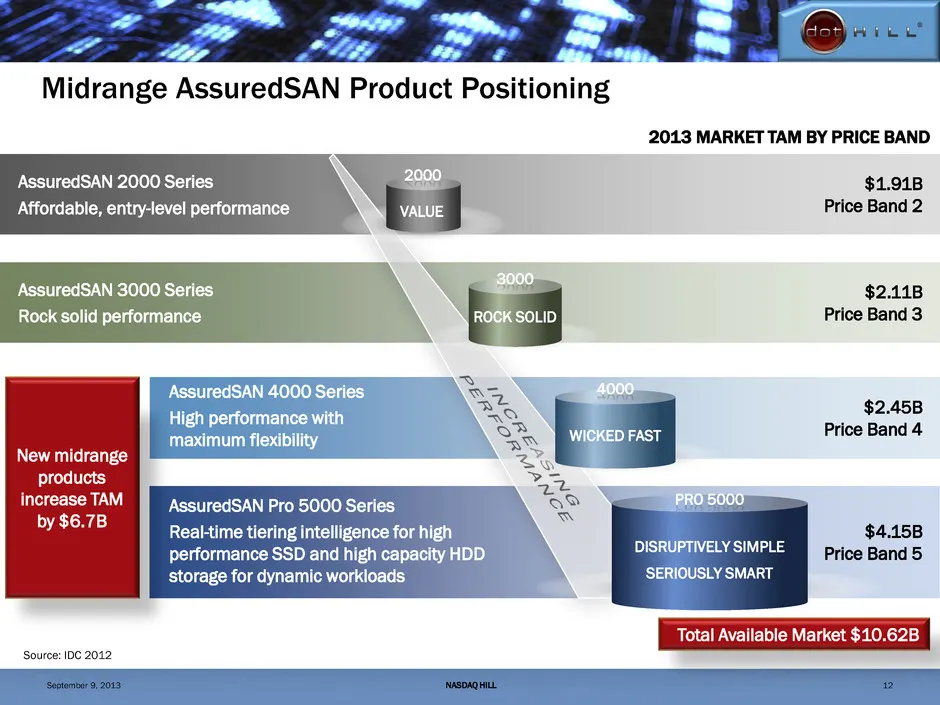
AssuredSAN Pro 5000 Series Real-time tiering intelligence for high performance SSD and high capacity HDD storage for dynamic workloads $4.15B Price Band 5 AssuredSAN 4000 Series High performance with maximum flexibility $2.45B Price Band 4 AssuredSAN 3000 Series Rock solid performance $2.11B Price B
Slide 13: The Business Value of RealStor Software
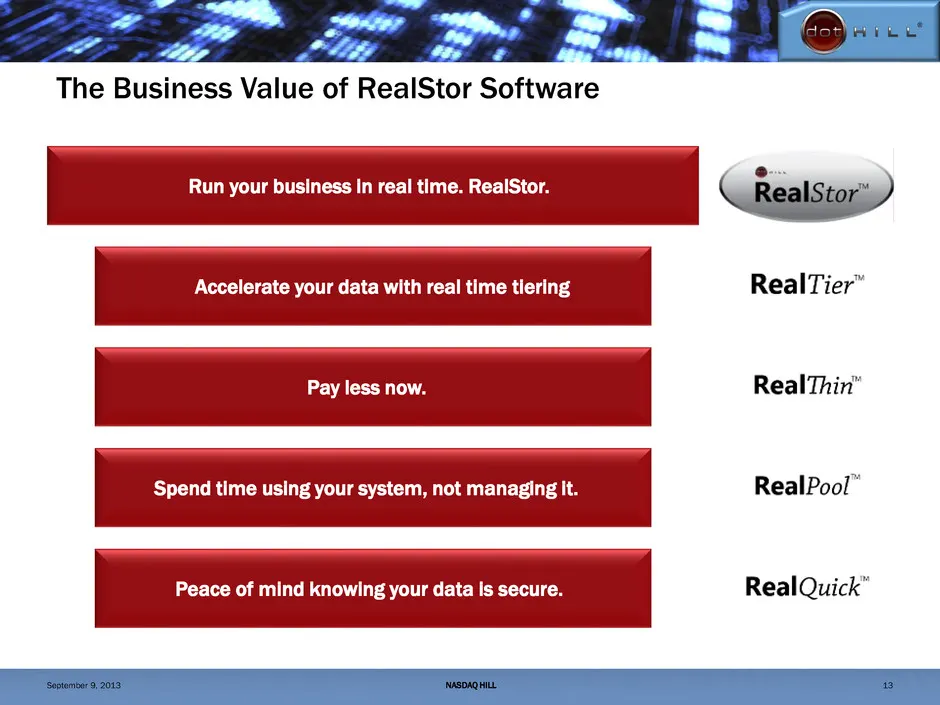
The Business Value of RealStor Software Run your business in real time. RealStor. Accelerate your data with real time tiering Pay less now. Spend time using your system, not managing it. Peace of mind knowing your data is secure. NASDAQ HILL 13 September 9, 2013
Slide 14: A History of Industry Consolidation
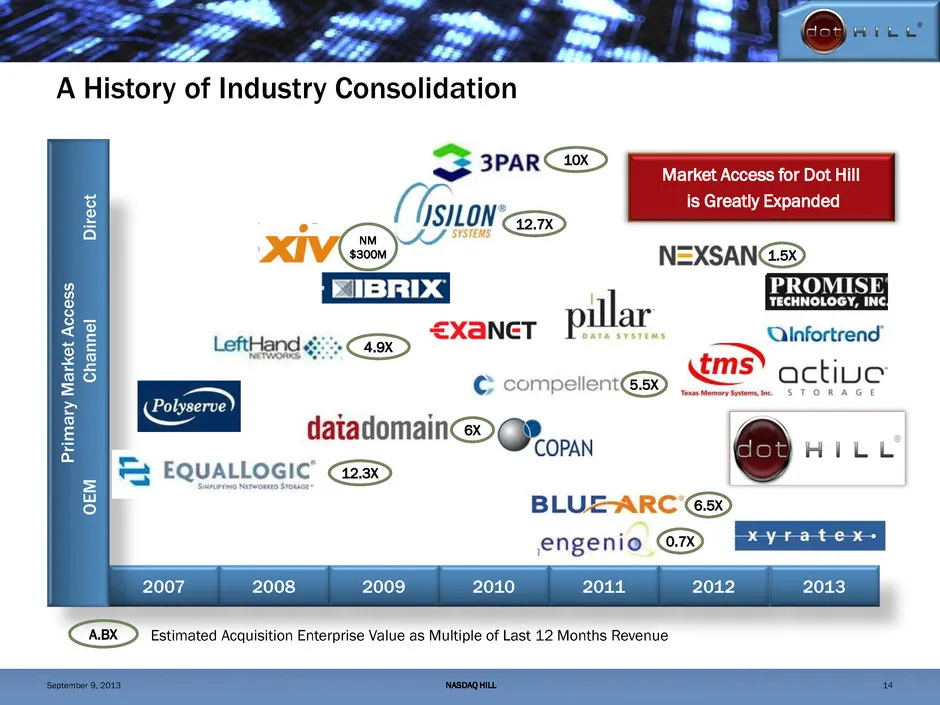
A History of Industry Consolidation 2007 2008 2009 2010 2011 2012 2013 Pr ima ry Ma rk e t A cc e ss OEM Ch a n n el D ir ec t Market Access for Dot Hill is Greatly Expanded Estimated Acquisition Enterprise Value as Multiple of Last 12 Months Revenue A.BX 12.3X 4.9X 10X 12.7X 6X 5.5X 6.5X 0.7X 1.5X
Slide 15: Typical OEM Sales Cycle
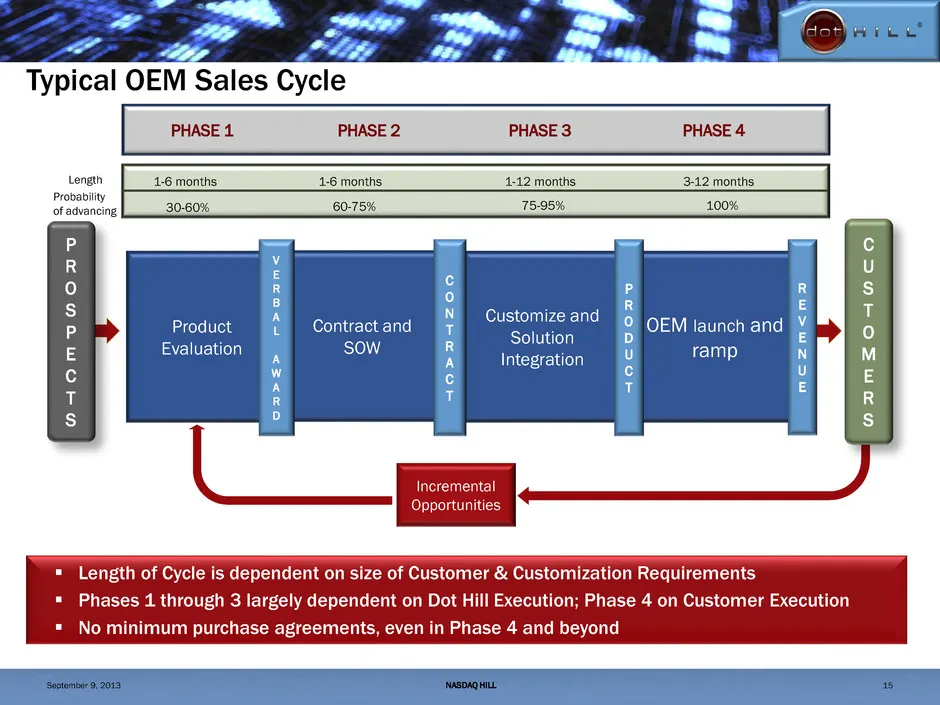
Typical OEM Sales Cycle Length of Cycle is dependent on size of Customer & Customization Requirements Phases 1 through 3 largely dependent on Dot Hill Execution; Phase 4 on Customer Execution No minimum purchase agreements, even in Phase 4 and beyond Incremental Opportunities PHASE 1 PHASE 2 P
Slide 16: Incremental Opportunities – New OEMs in the Pipeline – 5/9/13
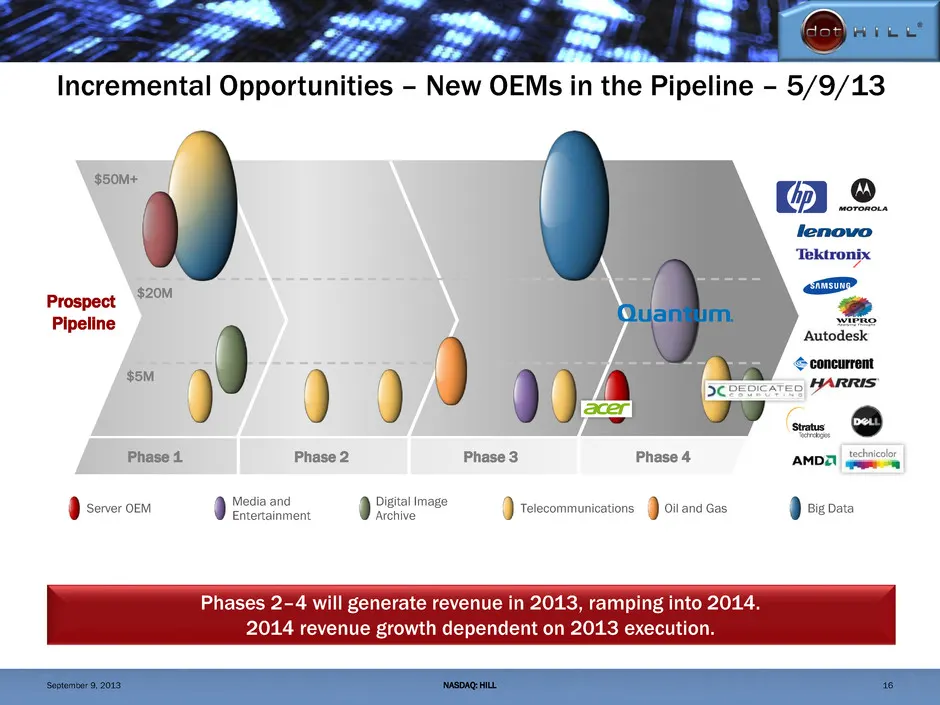
Incremental Opportunities – New OEMs in the Pipeline – 5/9/13 Prospect Pipeline $50M+ $5M $20M Server OEM Digital Image Archive Media and Entertainment Telecommunications Oil and Gas Big Data Phase 1 Phase 4 Phase 2 Phase 3 Phases 2–4 will generate revenue in 2013, ramping into 2014. 2014 revenue gr
Slide 17: Incremental Opportunities – New OEMs in the Pipeline – 8/8/13
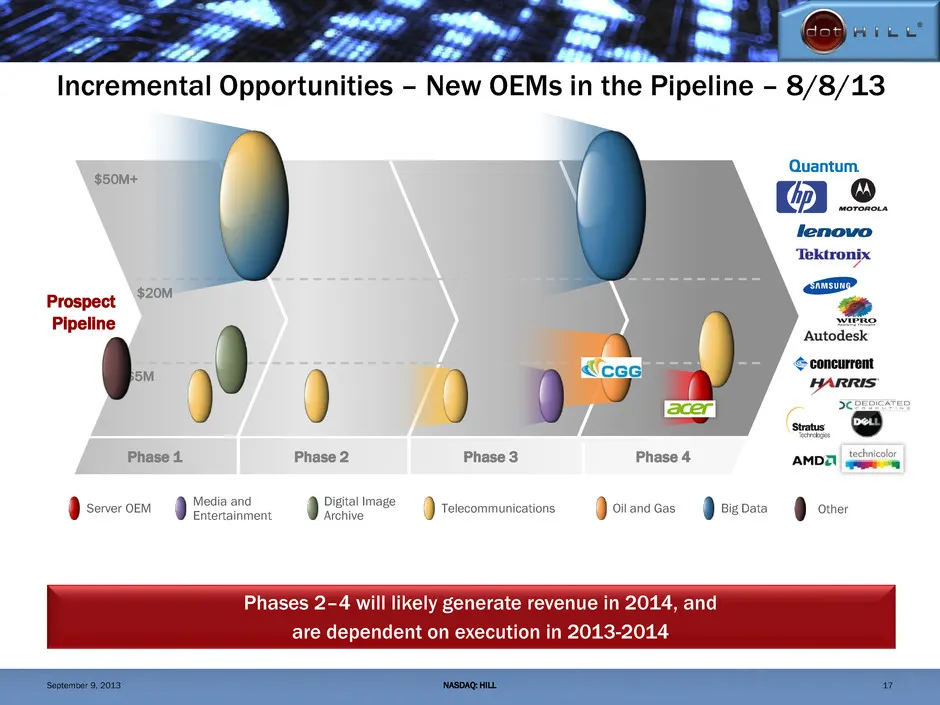
Incremental Opportunities – New OEMs in the Pipeline – 8/8/13 Prospect Pipeline $50M+ $5M $20M Server OEM Digital Image Archive Media and Entertainment Telecommunications Oil and Gas Big Data Phase 1 Phase 4 Phase 2 Phase 3 Phases 2–4 will likely generate revenue in 2014, and are dependent on execut
Slide 18: Incremental Opportunities – Existing Customers – 5/9/13
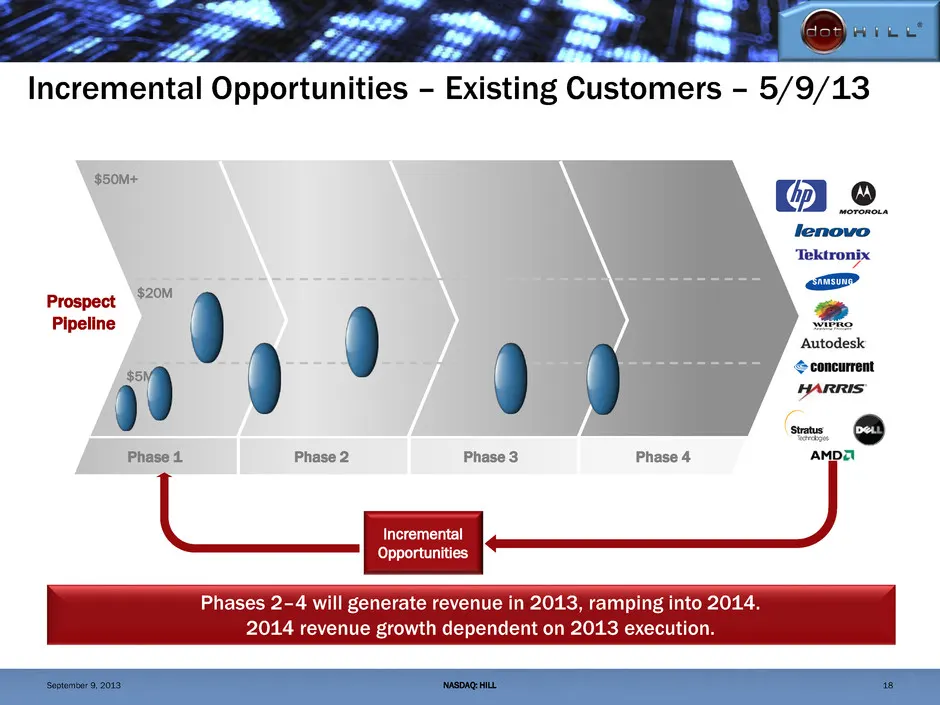
Incremental Opportunities – Existing Customers – 5/9/13 NASDAQ: HILL Prospect Pipeline $50M+ $5M $20M Phase 1 Phase 4 Phase 2 Phase 3 Phases 2–4 will generate revenue in 2013, ramping into 2014. 2014 revenue growth dependent on 2013 execution. 18 Incremental Opportunities September 9, 2013
Slide 19: Incremental Opportunities – Existing Customers – 8/8/13
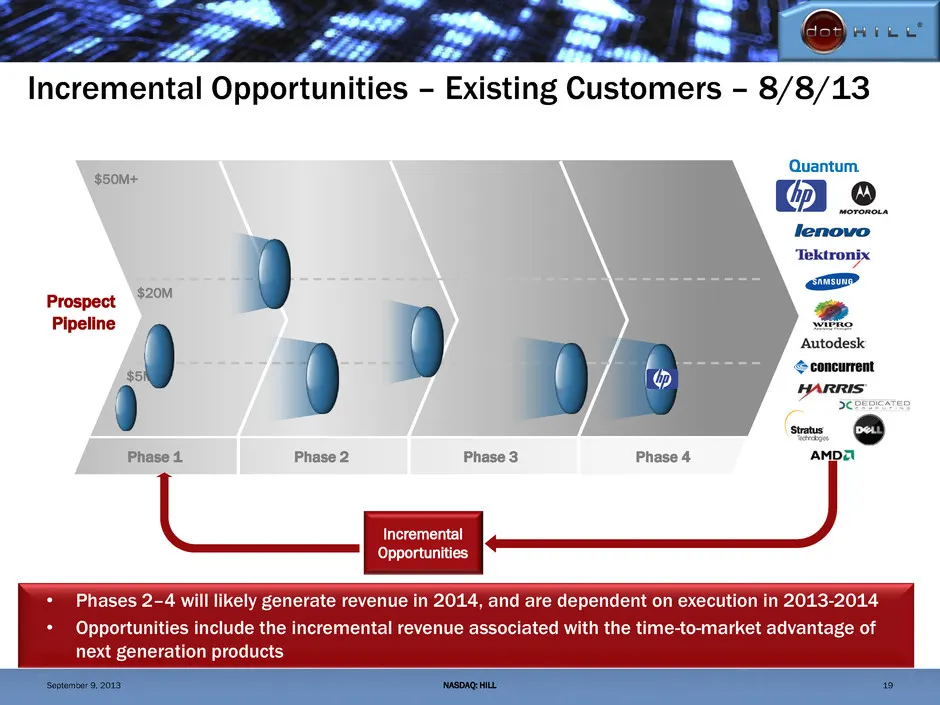
Incremental Opportunities – Existing Customers – 8/8/13 NASDAQ: HILL Prospect Pipeline $50M+ $5M $20M Phase 1 Phase 4 Phase 2 Phase 3 • Phases 2–4 will likely generate revenue in 2014, and are dependent on execution in 2013-2014 • Opportunities include the incremental revenue associated with the tim

Slide 20: Financials and Business Model
DRIVING GROWTH NASDAQ: HILL September 9, 2013 Financials and Business Model A STRONG FOUNDATION FOR
Slide 21: About Non-GAAP Financial Measures
About Non-GAAP Financial Measures NASDAQ HILL 21 The Company’s non-GAAP financial measures exclude the impact of stock-based compensation expense, legal settlements and associated expenses, intangible asset amortization, restructuring and severance charges, charges or credits for contingent consider
Slide 22: Creating Operating Leverage (Non-GAAP)
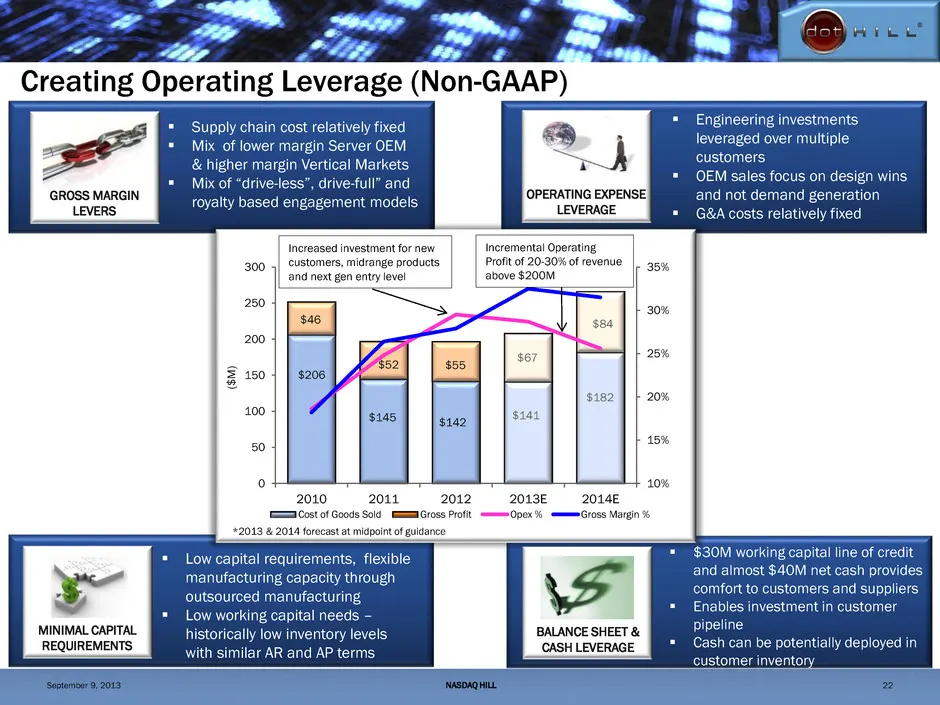
Creating Operating Leverage (Non-GAAP) Supply chain cost relatively fixed Mix of lower margin Server OEM & higher margin Vertical Markets Mix of “drive-less”, drive-full” and royalty based engagement models Engineering investments leveraged over multiple customers OEM sales focus on design
Slide 23: Incremental Opportunities – 2013 & 2014 Revenue Potential
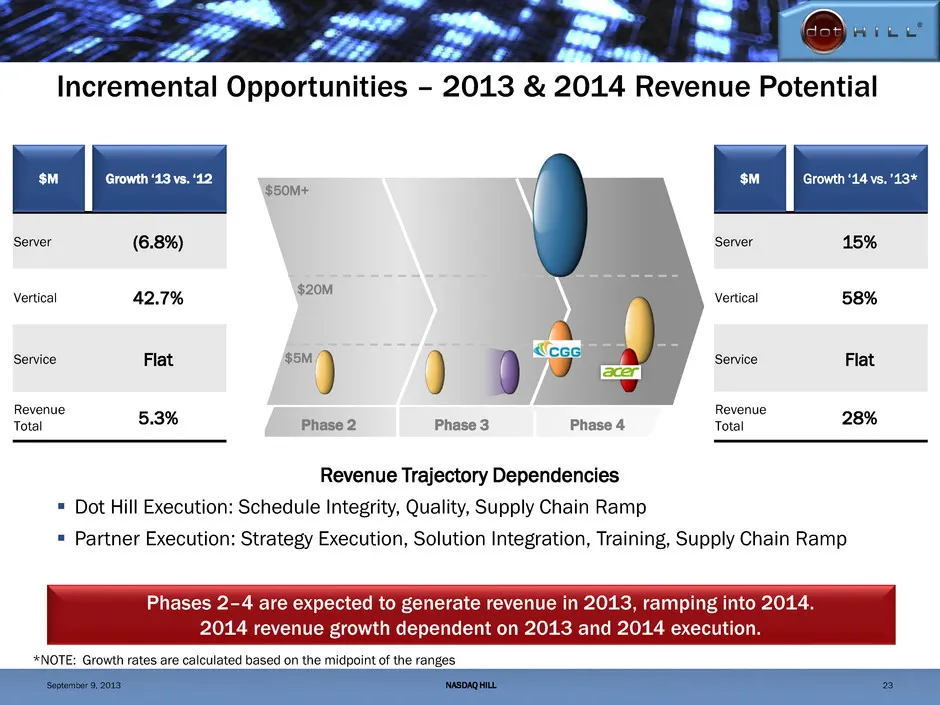
Incremental Opportunities – 2013 & 2014 Revenue Potential Phases 2–4 are expected to generate revenue in 2013, ramping into 2014. 2014 revenue growth dependent on 2013 and 2014 execution. Server OEM 141 132 Vertical Mkts 48 68.5 Service 7 7 Revenue Total 197 207.5 2012 Actuals 2013 Midpoint $M Serve
Slide 24: Dot Hill Specific Growth Catalysts
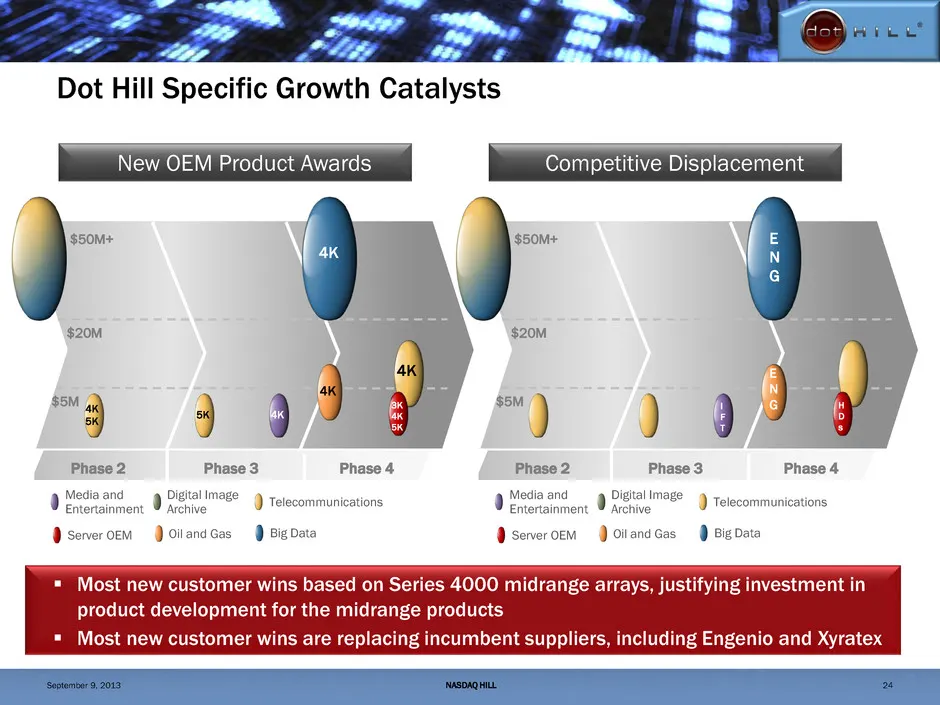
Dot Hill Specific Growth Catalysts Most new customer wins based on Series 4000 midrange arrays, justifying investment in product development for the midrange products Most new customer wins are replacing incumbent suppliers, including Engenio and Xyratex NASDAQ HILL 24 Server OEM Digital Image A
Slide 25: Target Non-GAAP Operating Model
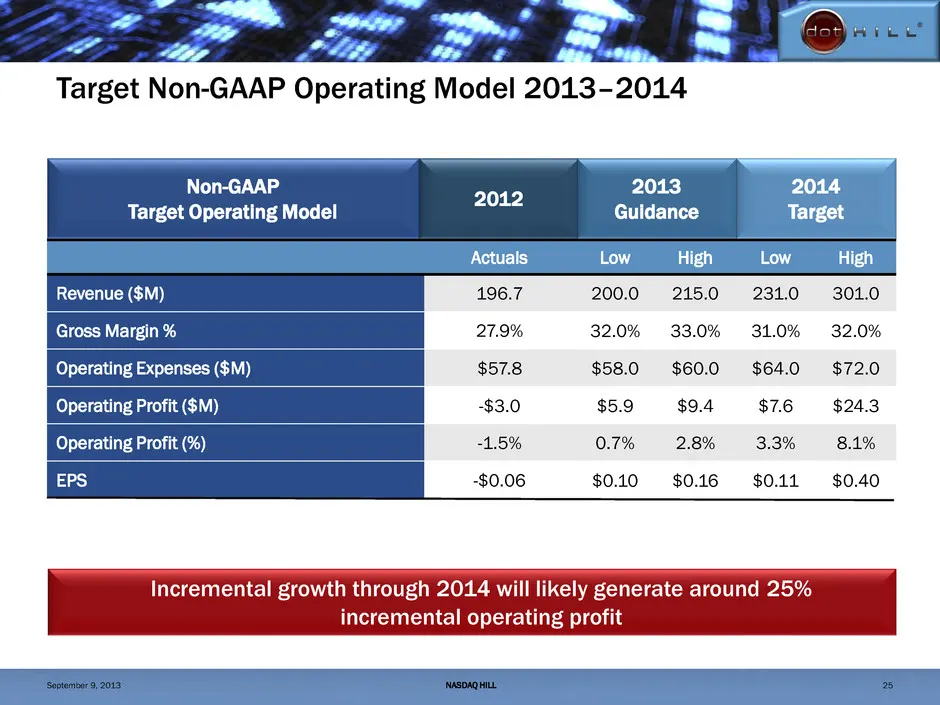
Target Non-GAAP Operating Model 2013–2014 Actuals Revenue ($M) 196.7 Gross Margin % 27.9% Operating Expenses ($M) $57.8 Operating Profit ($M) -$3.0 Operating Profit (%) -1.5% EPS -$0.06 2012 Non-GAAP Target Operating Model Incremental growth through 2014 will likely generate around 25% incremental o
Slide 26: Why Dot Hill?
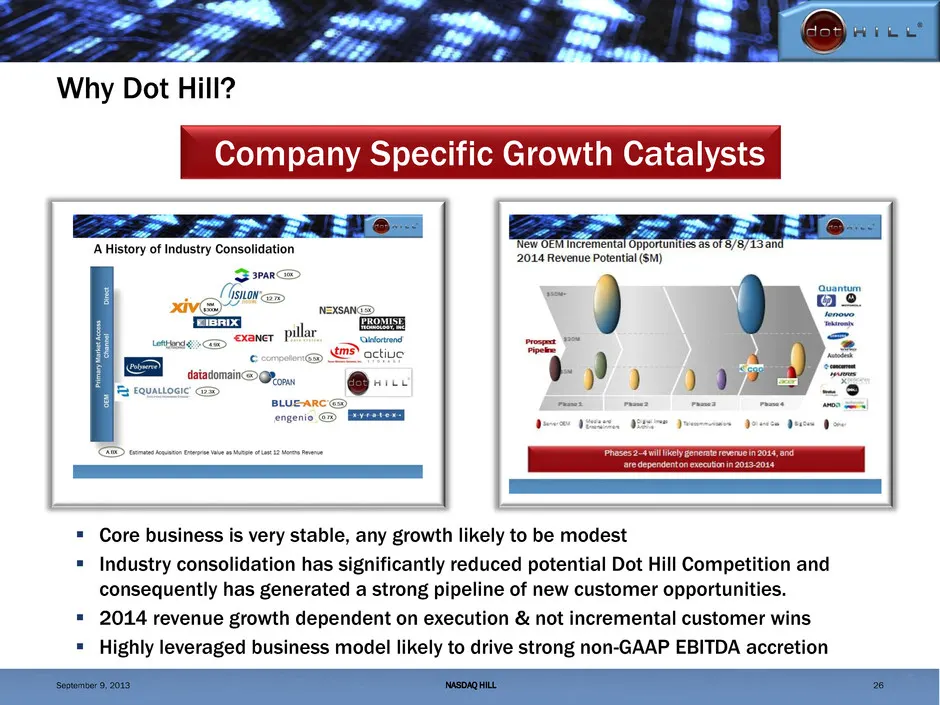
Why Dot Hill? Core business is very stable, any growth likely to be modest Industry consolidation has significantly reduced potential Dot Hill Competition and consequently has generated a strong pipeline of new customer opportunities. 2014 revenue growth dependent on execution & not incrementa

Slide 27: Appendix I: Select Financial Results, Q3 and 2013 Guidance
DRIVING GROWTH NASDAQ: HILL September 9, 2013 Appendix I: Select Financial Results, Q3 and 2013 Guidance A STRONG FOUNDATION FOR
Slide 28: 2012 Non-GAAP Financial Recap
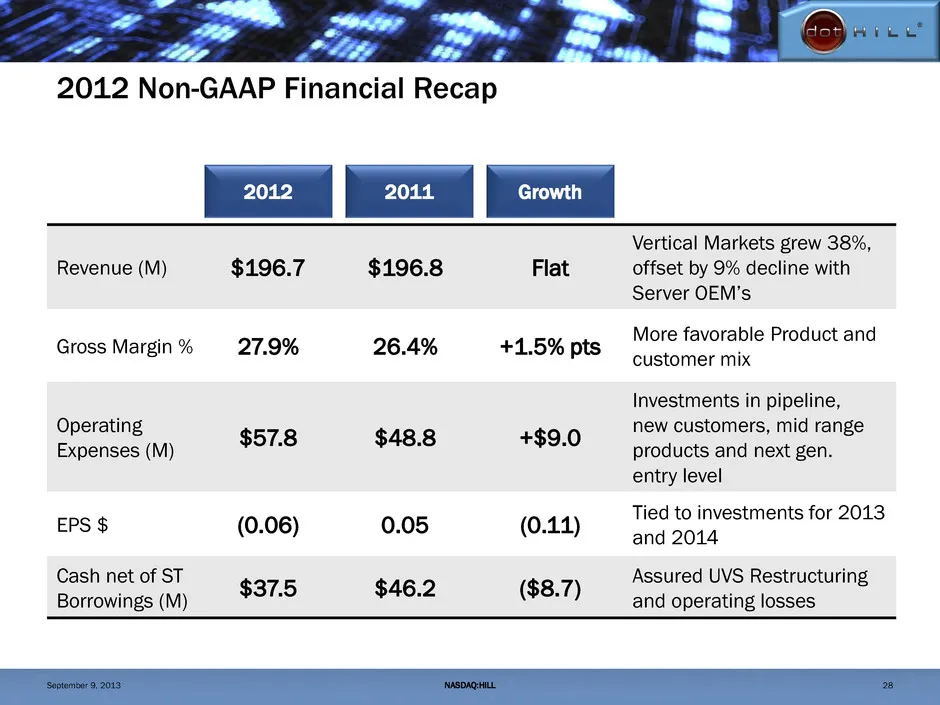
2012 Non-GAAP Financial Recap 28 Revenue (M) $196.7 $196.8 Flat Vertical Markets grew 38%, offset by 9% decline with Server OEM’s Gross Margin % 27.9% 26.4% +1.5% pts More favorable Product and customer mix Operating Expenses (M) $57.8 $48.8 +$9.0 Investments in pipeline, new customers, mid range pr
Slide 29: Q2'13 Non-GAAP Financial Metrics
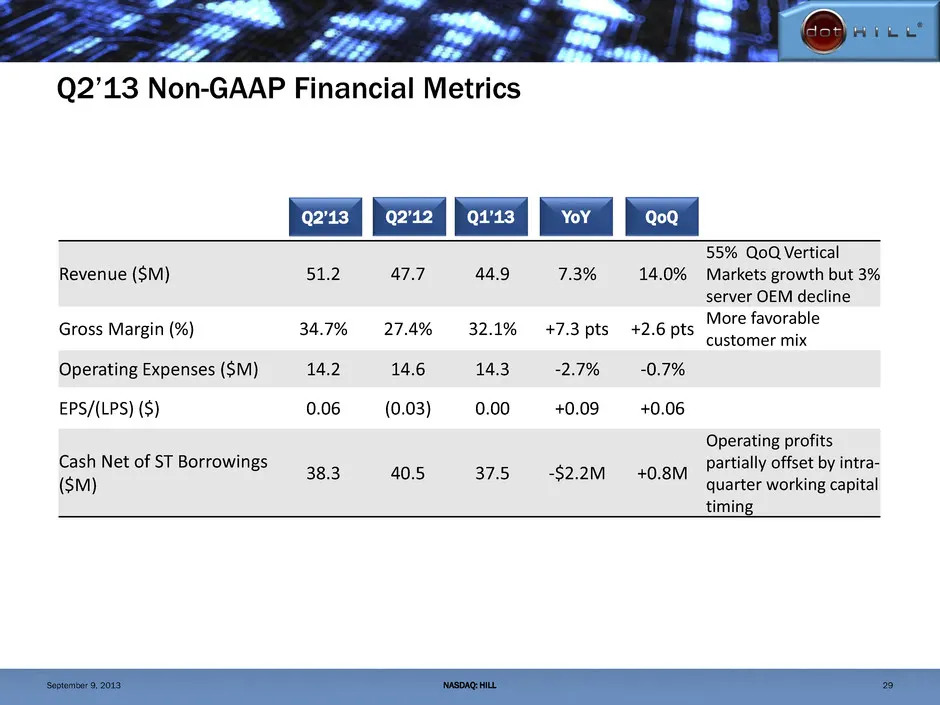
Q2’13 Non-GAAP Financial Metrics NASDAQ: HILL 29 Revenue ($M) 51.2 47.7 44.9 7.3% 14.0% 55% QoQ Vertical Markets growth but 3% server OEM decline Gross Margin (%) 34.7% 27.4% 32.1% +7.3 pts +2.6 pts More favorable customer mix Operating Expenses ($M) 14.2 14.6 14.3 -2.7% -0.7% EPS/(LPS) ($) 0.06 (0.
Slide 30: Q3'13 and Full Year 2013 Non-GAAP Guidance
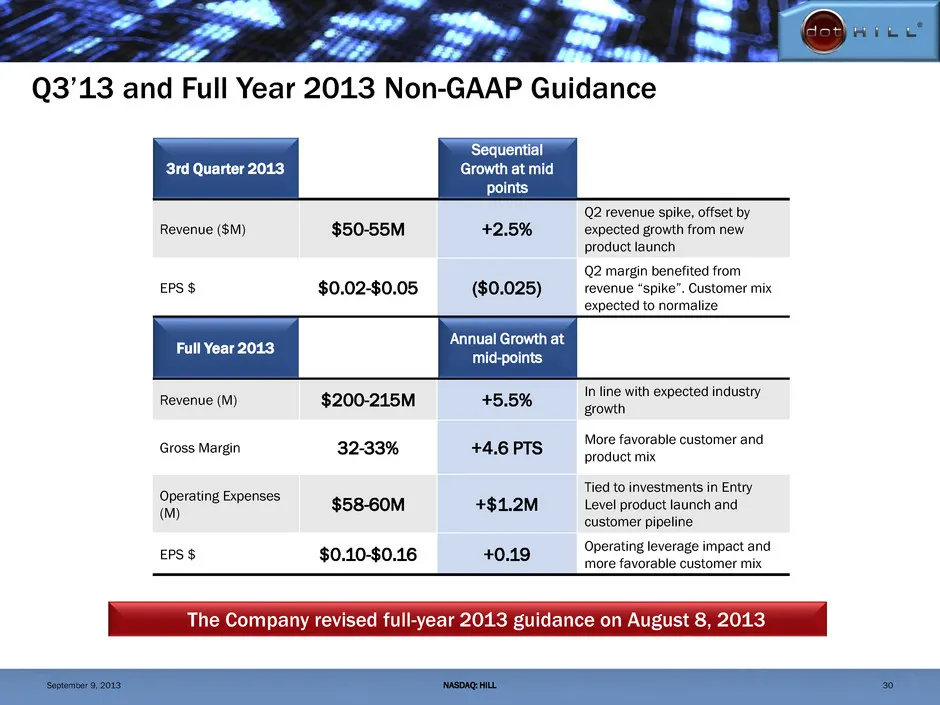
Q3’13 and Full Year 2013 Non-GAAP Guidance 30 Revenue ($M) $50-55M +2.5% Q2 revenue spike, offset by expected growth from new product launch EPS $ $0.02-$0.05 ($0.025) Q2 margin benefited from revenue “spike”. Customer mix expected to normalize 3rd Quarter 2013 Sequential Growth at mid points Revenu
Slide 31: Key Financial Metrics
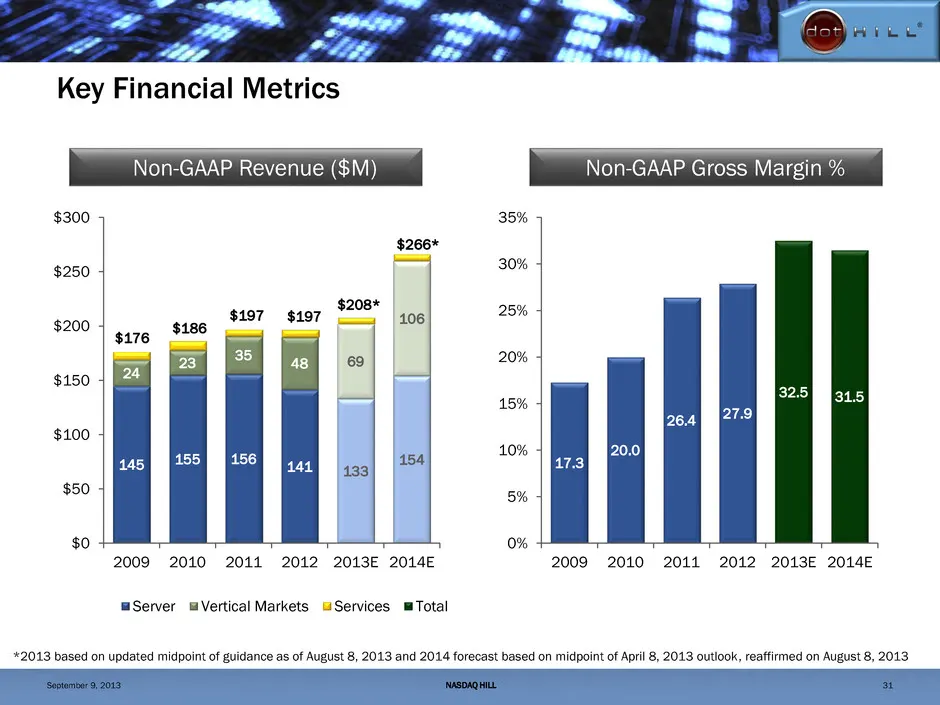
Key Financial Metrics 145 155 156 141 133 154 24 23 35 48 69 106 $0 $50 $100 $150 $200 $250 $300 2009 2010 2011 2012 2013E 2014E Server Vertical Markets Services Total $176 $186 $197 $197 $208* $266* 17.3 20.0 26.4 27.9 32.5 31.5 0% 5% 10% 15% 20% 25% 30% 35% 2009 2010 2011 2012 2013E 2014E NASDAQ H
Slide 32: Key Financial Metrics (Cont'd)
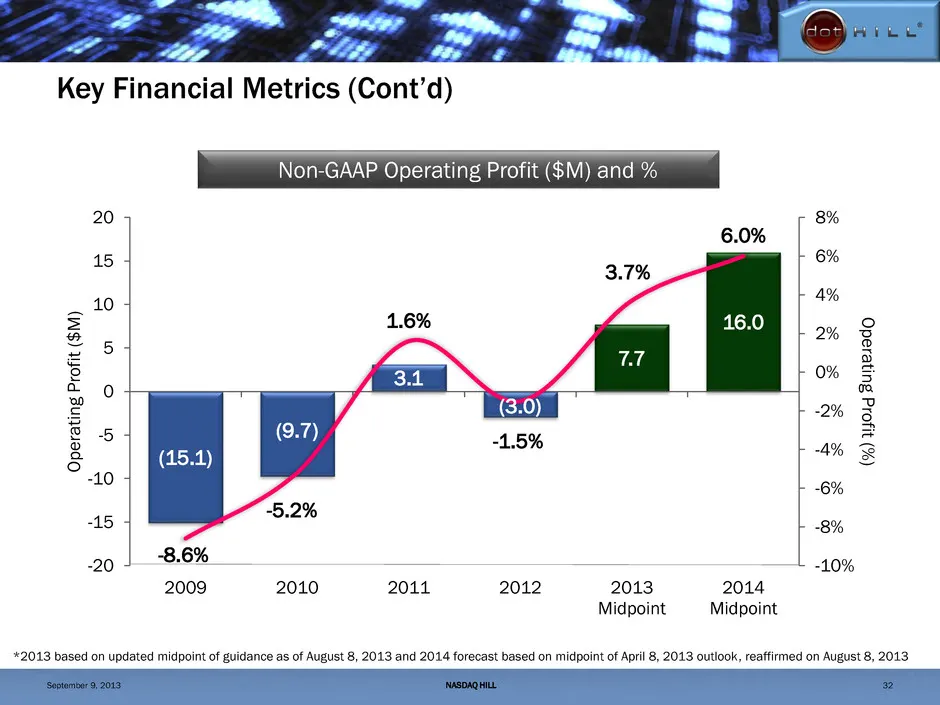
Key Financial Metrics (Cont’d) (15.1) (9.7) 3.1 (3.0) 7.7 16.0 -8.6% -5.2% 1.6% -1.5% 3.7% 6.0% -10% -8% -6% -4% -2% 0% 2% 4% 6% 8% -20 -15 -10 -5 0 5 10 15 20 2009 2010 2011 2012 2013 Midpoint 2014 Midpoint O p e ratin g P ro fit (% ) Operat in g P ro fit ($ M ) NASDAQ HILL 32 *2013 based on update

Slide 33: Appendix II: Reconciliation of GAAP to Non-GAAP Financial Measures
DRIVING GROWTH NASDAQ: HILL September 9, 2013 Appendix II: Reconciliation of GAAP to Non-GAAP Financial Measures A STRONG FOUNDATION FOR
Slide 34: Q2'13 GAAP to Non-GAAP Revenue Reconciliation
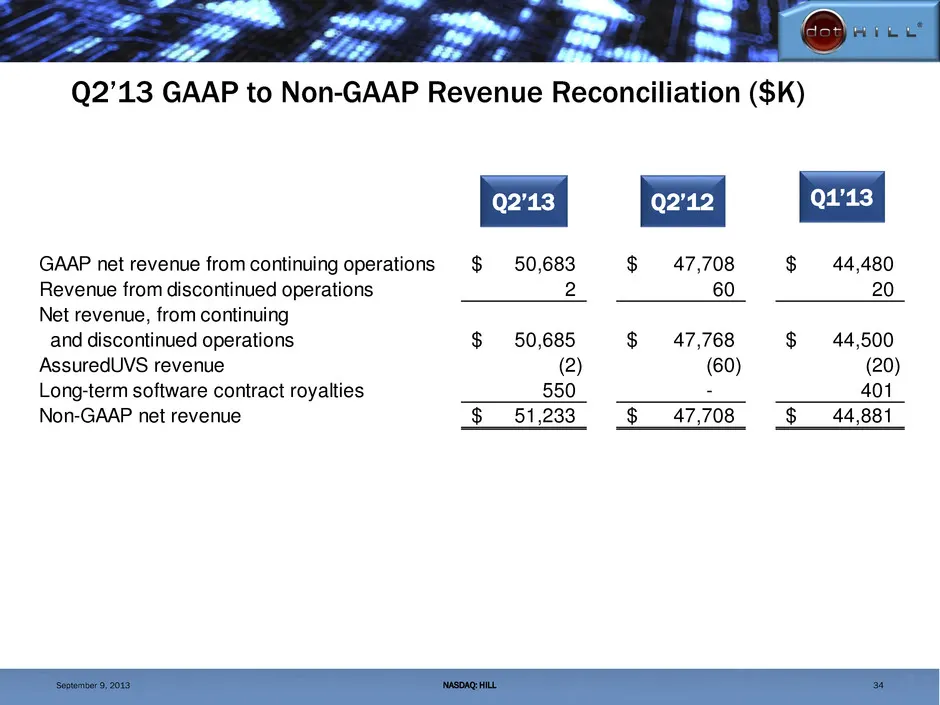
Q2’13 GAAP to Non-GAAP Revenue Reconciliation ($K) 34 Q2’13 Q2’12 Q1’13 NASDAQ: HILL GAAP net revenue from continuing operations 50,683$ 47,708$ 44,480$ Rev nue from discontinued operations 2 60 20 Net revenue, from continuing and discontinued operations 50,685$ 47,768$ 44,500$ AssuredUVS revenue (2
Slide 35: Q2'13 GAAP to Non-GAAP Gross Profit Reconciliation
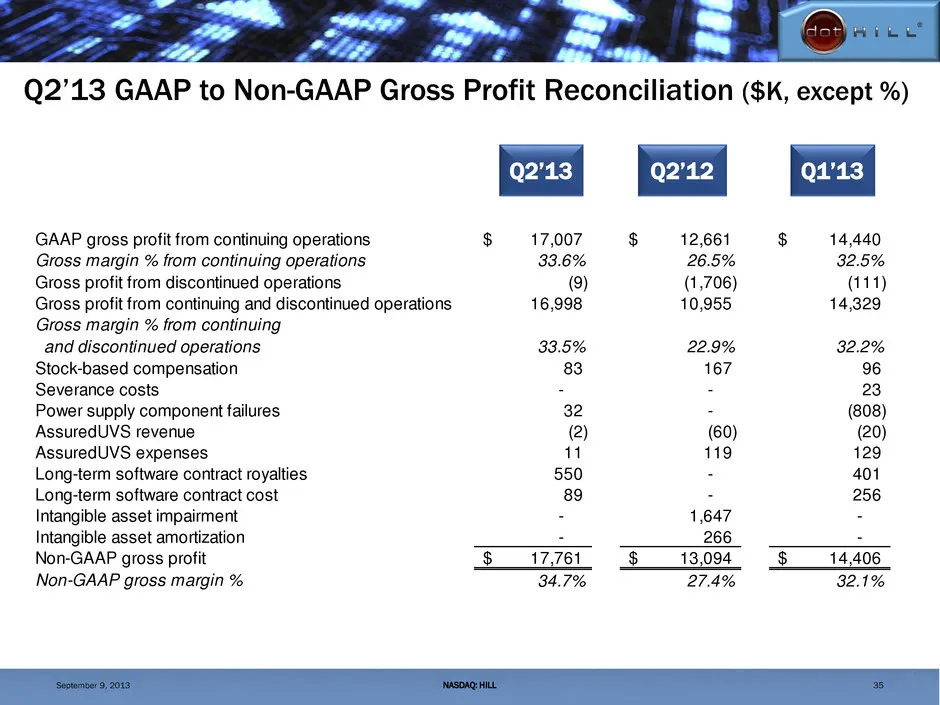
Q2’13 GAAP to Non-GAAP Gross Profit Reconciliation ($K, except %) 35 Q2’13 Q2’12 Q1’13 NASDAQ: HILL GAAP gross profit from continuing operations 17,007$ 12,661$ 14,440$ Gross margin % from continuing operations 33.6% 26.5% 32.5% Gross profit from discontinued operations (9) (1,706) (111) Gross profi
Slide 36: Q2'13 GAAP to Non-GAAP Operating Expenses Reconciliation
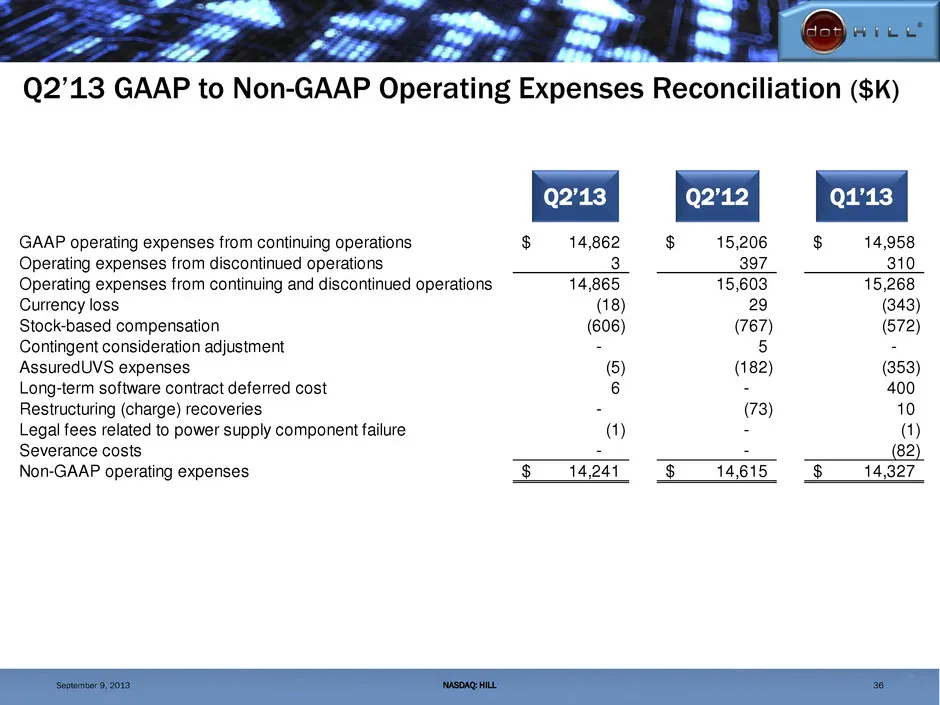
Q2’13 GAAP to Non-GAAP Operating Expenses Reconciliation ($K) 36 Q2’13 Q2’12 Q1’13 NASDAQ: HILL GAAP operating expenses from continuing operations 14,862$ 15,206$ 14,958$ Operating expenses from discontinued operations 3 397 310 Operating expenses from continuing and discontinued operations 14,865 1
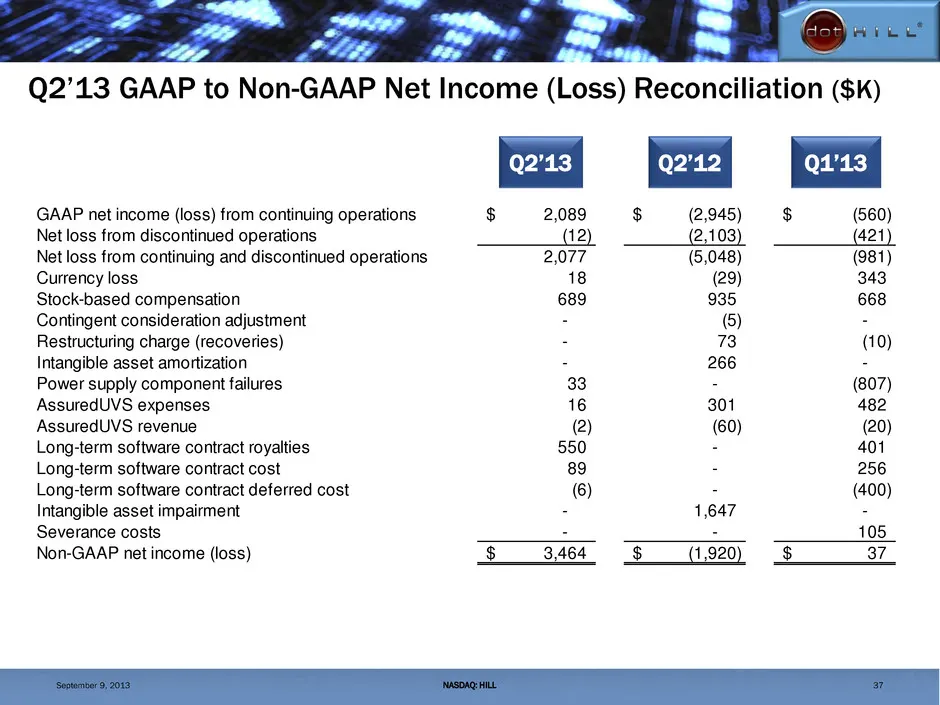
Slide 37: Q2'13 GAAP to Non-GAAP Net Income (Loss) Reconciliation
Q2’13 GAAP to Non-GAAP Net Income (Loss) Reconciliation ($K) 37 Q2’13 Q2’12 Q1’13 NASDAQ: HILL GAAP net income (loss) from continuing operations 2,089$ (2,945)$ (560)$ Net loss from discontinued operations (12) (2,103) (421) Net loss from continuing and discontinued operations 2,077 (5,048) (981) Cu
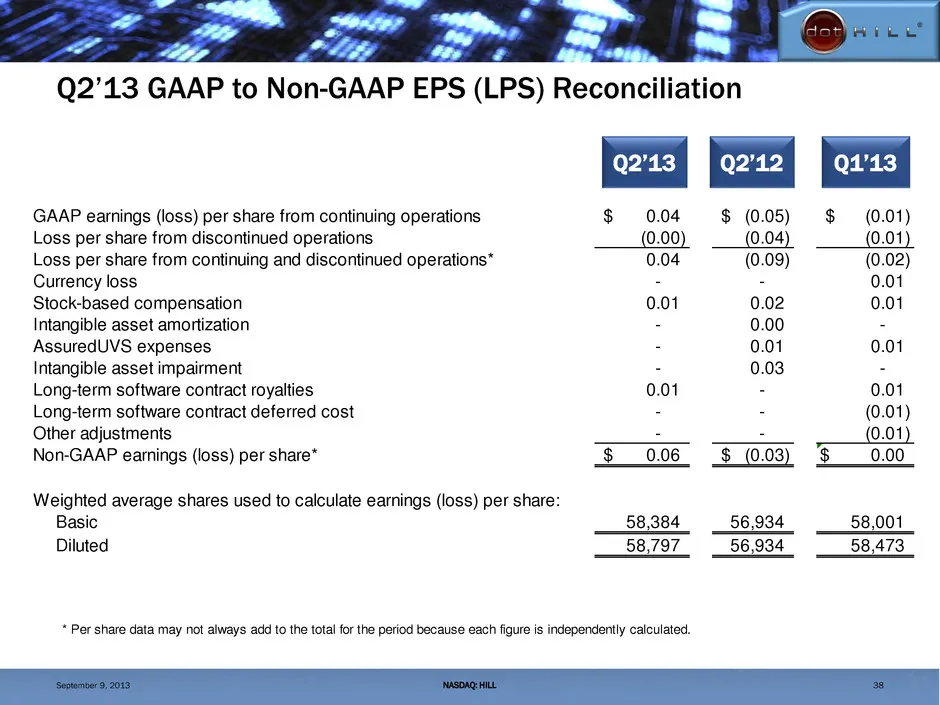
Slide 38: Q2'13 GAAP to Non-GAAP EPS (LPS) Reconciliation
Q2’13 GAAP to Non-GAAP EPS (LPS) Reconciliation 38 Q2’13 Q2’12 Q1’13 NASDAQ: HILL GAAP earnings (loss) per share from continuing operations 0.04$ (0.05)$ (0.01)$ Loss per share from discontinued operations (0.00) (0.04) (0.01) Loss per share from continuing and discontinued operations* 0.04 (0.09) (
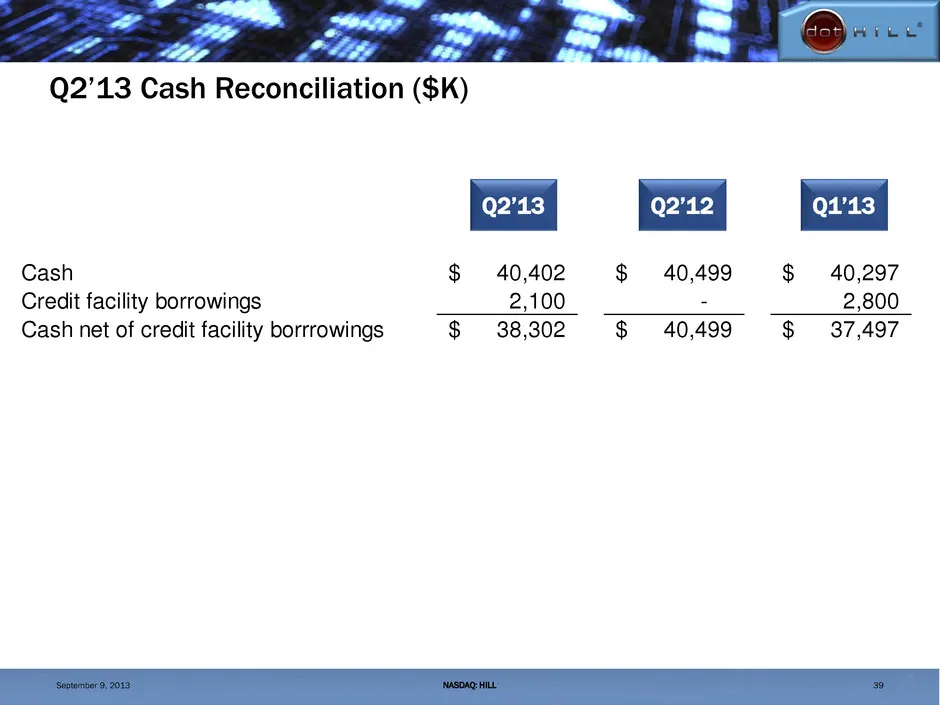
Slide 39: Q2'13 Cash Reconciliation
Q2’13 Cash Reconciliation ($K) 39 Q2’13 Q2’12 Q1’13 NASDAQ: HILL Cash 40,402$ 40,499$ 40,297$ redit facility borrowings 2,1 0 - 2,800 Cash net of credit facility borrrowings 38,302$ 40,499$ 37,497$ September 9, 2013
Source: SEC EDGAR · 8-K filed Sep 9, 2013
More decks from Dot Hill Systems Corp
 Q2 2015 Earnings Presentation27 slides · Aug 6, 2015
 Investor Presentation (May 2015)58 slides · May 12, 2015
 Q1 2015 Earnings Presentation13 slides · May 7, 2015
 Investor Presentation (March 2015)15 slides · Mar 5, 2015
 Investor Presentation (January 2015)49 slides · Jan 12, 2015
 Investor Presentation (November 2014)47 slides · Nov 10, 2014